")
Back to Journals » International Journal of General Medicine » Volume 14
Applications of Machine Learning to Predict Cisplatin Resistance in Lung Cancer
Authors Gao Y, Lyu Q, Luo P , Li M, Zhou R, Zhang J , Lyu Q
Received 21 July 2021
Accepted for publication 3 September 2021
Published 21 September 2021 Volume 2021:14 Pages 5911—5925
DOI https://doi.org/10.2147/IJGM.S329644
Checked for plagiarism Yes
Review by Single anonymous peer review
Peer reviewer comments 2
Editor who approved publication: Dr Scott Fraser
Yanan Gao,1,* Qiong Lyu,2,* Peng Luo,2,* Mujiao Li,3 Rui Zhou,3 Jian Zhang,2 Qingwen Lyu4
1Department of Radiotherapy, Affiliated Cancer Hospital, Zhengzhou University, Zhengzhou, People’s Republic of China; 2Department of Oncology, Zhujiang Hospital, Southern Medical University, Guangzhou, Guangdong, People’s Republic of China; 3School of Biomedical Engineering, Southern Medical University, Guangzhou, People’s Republic of China; 4Department of Information, Zhujiang Hospital, Southern Medical University, Guangzhou, People’s Republic of China
*These authors contributed equally to this work
Correspondence: Qingwen Lyu; Jian Zhang Email [email protected]; [email protected]
Purpose: Lung cancer, mainly lung adenocarcinoma, lung squamous cell carcinoma and small cell lung cancer, has the highest incidence and cancer-related mortality worldwide. Platinum-based chemotherapy plays an important role in the treatment of various lung cancer subtypes, but not all patients benefit from this treatment regimen; thus, it is worth identifying lung cancer patients who are resistant or sensitive to platinum-based therapy.
Methods: The drug response and sequencing data of 170 lung cancer cell lines were downloaded from the Genomics of Drug Sensitivity in Cancer (GDSC) database, and support vector machines (SVMs) and beam search were used to select an optimal gene panel that can predict the sensitivity of cell lines to cisplatin. Then, we used available cell line data to explore the potential mechanisms.
Results: In this work, the drug response and sequencing data of 170 lung cancer cell lines were downloaded from the GDSC database, and SVMs and beam search were used to screen a panel of genes related to lung cancer cell line resistance to cisplatin. A final panel of nine genes (PLXNC1, KIAA0649, SPTBN4, SLC14A2, F13A1, COL5A1, SCN2A, PLEC, and ALMS1) was identified, and achieved an area under the curve (AUC) of 0.873 ± 0.004. The natural logarithm of the half maximal inhibitory concentration (lnIC50) values of the mutant-type (panel-MT) group was significantly higher than that of the wild-type (panel-WT) group, regardless of the lung cancer subtype. The differentially expressed pathways between the two groups may explain this difference.
Conclusion: In this study, we found that a panel of nine genes can accurately predict sensitivity to cisplatin, which may provide individualized treatment recommendations to improve the prognosis of patients with lung cancer.
Keywords: lung cancer, machine learning, SVMs, biomarkers
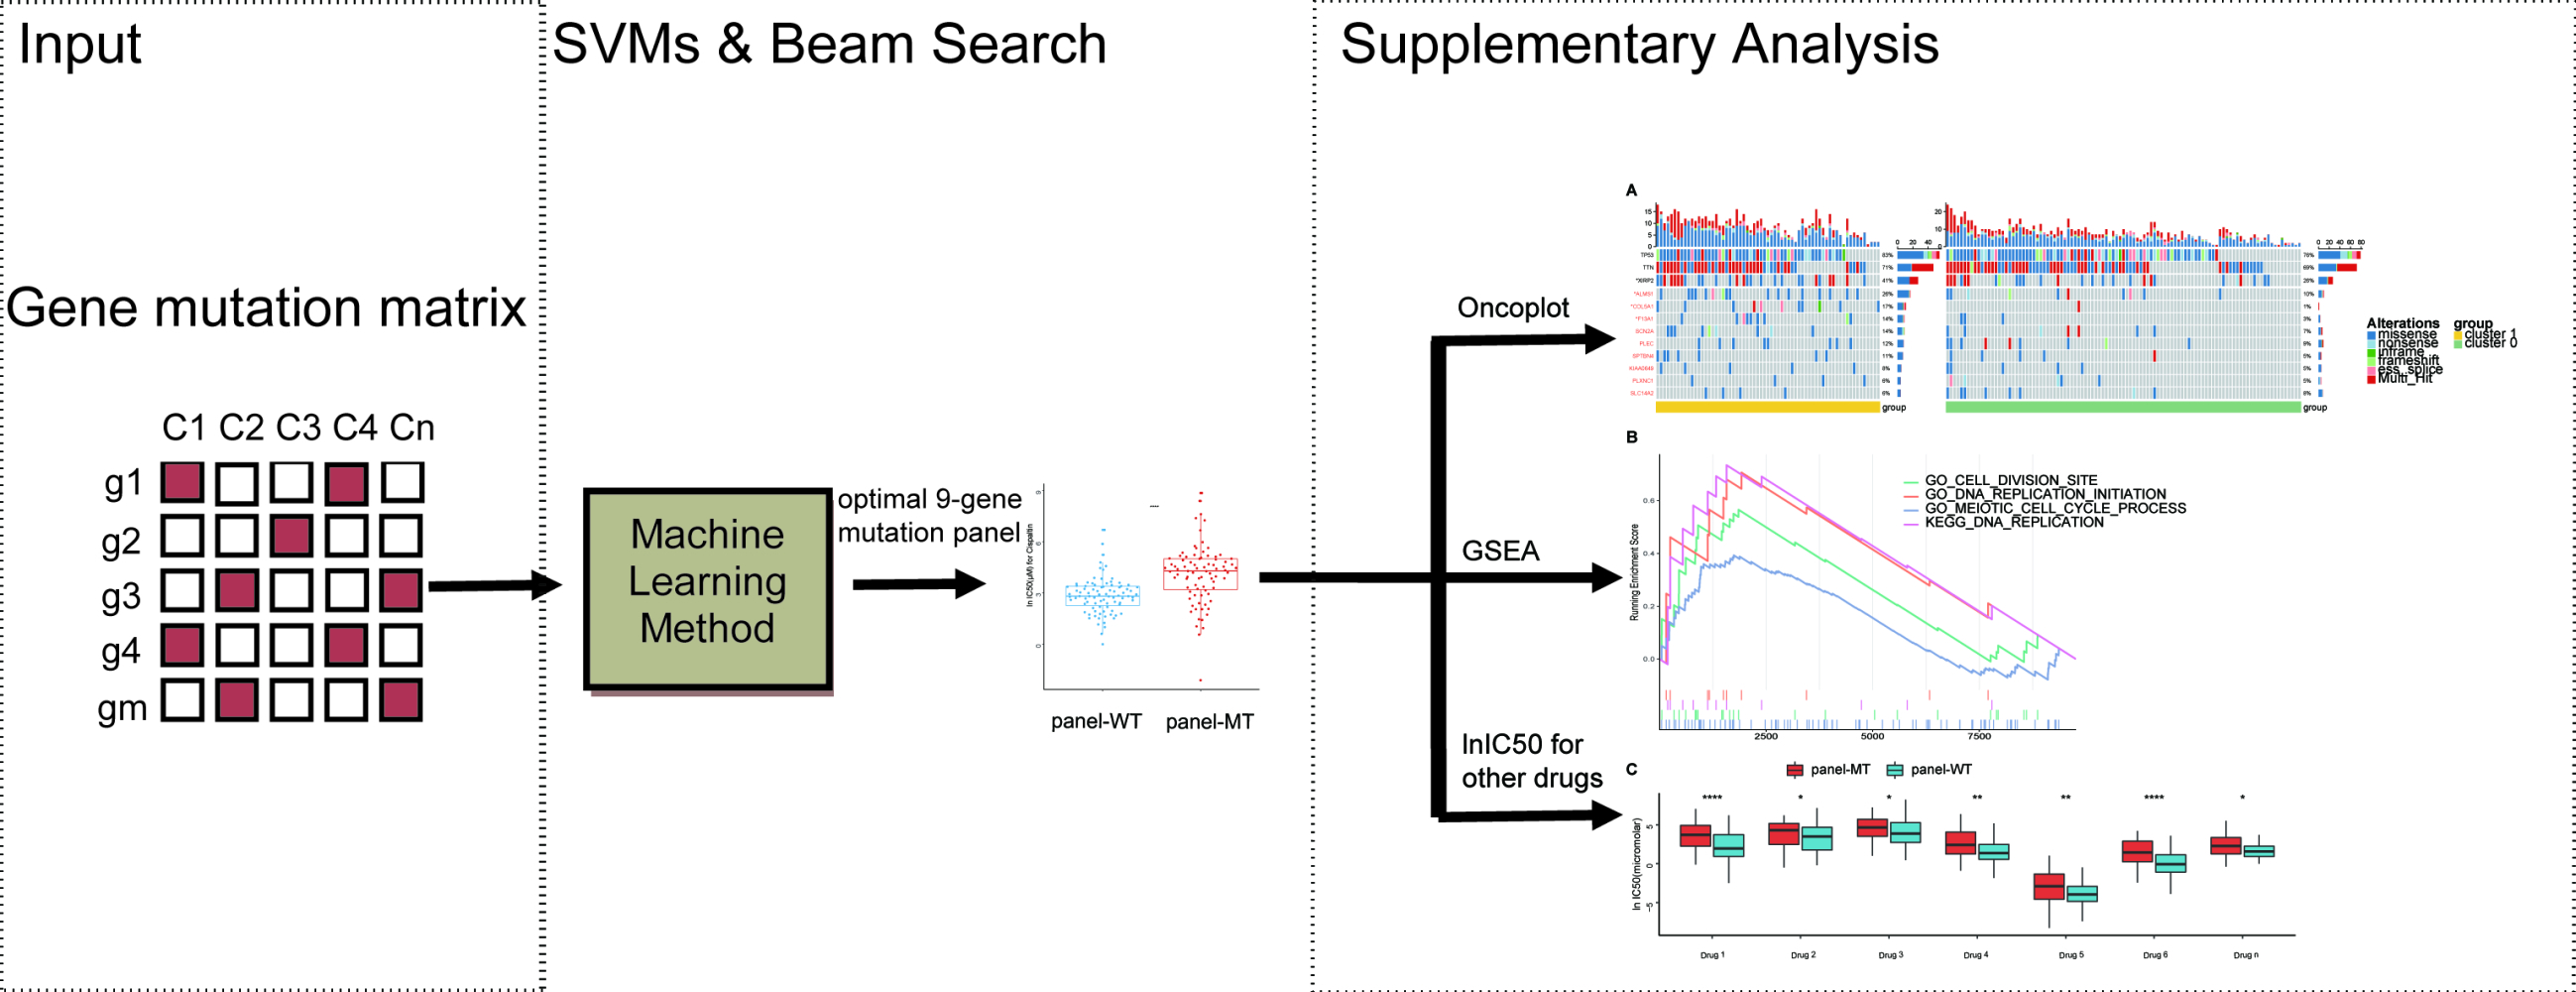
Graphical Abstract:
Introduction
Lung cancer is the most commonly diagnosed cancer worldwide and the leading cause of cancer-related deaths.1,2 According to histological classification, approximately 85% of lung cancer cases are non-small cell lung cancer (NSCLC). The current pathological classification mainly includes 3 histological subtypes: adenocarcinoma, squamous cell carcinoma and small cell carcinoma.3 Small cell lung cancer (SCLC), a type unique from NSCLC, is a highly aggressive tumor, accounting for 13–15% of lung cancer cases.4 For patients with limited-stage SCLC, in addition to surgical resection, platinum-based neoadjuvant or adjuvant therapy can improve patient outcomes. For patients with extensive-stage SCLC, systemic treatment with cisplatin combined with etoposide is the most widely used.5 For NSCLC patients, although stage IIA patients can be treated with platinum-based adjuvant therapy after complete tumor resection, platinum-based chemotherapy is still the main recommendation for the first-line treatment of stage IIB patients and above.6–8
The identification of driver mutations promotes personalized management in non-small cell lung cancer (NSCLC) which accounts for approximately 85% of lung cancers. For patients with mutations in the epidermal growth factor receptor (EGFR), acquired resistance will inevitably occur when they receive a first-generation EGFR tyrosine kinase inhibitor (TKI; eg, gefitinib) or a third-generation EGFR TKI (eg, osimertinib) that overcomes the EGFR T790M mutation.9 Immunotherapy has antitumor effects in a small part of the population, while it may cause serious immune-related adverse reactions in some people. For patients who do not meet the criteria for the above treatments or for patients who have failed previous immunotherapy or targeted therapy, systemic treatments including cisplatin are still important.
Human cancer cell lines originating from tumor tissues and retaining most of the characteristics of tumor tissues10 are the simplest experimental model and are widely used in the development of antitumor drugs. Large-scale drug sensitivity screening data and genomics data from cancer cell lines have been used to explore the interactions between drugs and genes.11–14 Following NCI-60 cell line screening,15 the Genomics of Drug Sensitivity in Cancer (GDSC) project (https://www.cancerrxgene.org/) has also made a great contribution to exploring the relationship between drug sensitivity and genomic data to discover therapeutic biomarkers that can be used to identify patients mostly likely to benefit from anticancer drugs.16 This new release of the GDSC database contains drug response data for nearly 1000 cell lines, representing common tumor types, and 518 drugs, including both cytotoxic drugs and targeted drugs. In addition, nearly every cell line has corresponding genomics data, including whole-exome sequencing (WES), gene expression, copy number alteration, DNA methylation, gene fusion and microsatellite instability data. In summary, the large-scale amount of drug response data and genomics data contained in the GDSC database provides the opportunity to explore potential biological indicators of drug responsiveness.
Mutations in key genes such as oncogenes may drive tumorigenesis to influence the responsiveness of cell lines to drugs, which can be validated in a clinical cohort. For example, BCR-ABL rearrangement mutations are significantly related to the efficacy of ABL inhibitors, and ABL inhibitors have been approved for chronic myeloid leukemia (CML) patients with BCR-ABL fusion mutations.17 In addition, BRAF mutations are related to the efficacy of BRAF, MEK1, and MEK2 inhibitors. The inhibitor vemurafenib (B-Raf V600E) can prolong the survival of patients with BRAF mutation-positive melanoma in clinical trials.18 ERBB amplification,19 the oncogene EGFR20 and FLT3 mutations21 are also sensitive to their targeted inhibitors. Recent studies have found that new gene mutations are associated with chemotherapy sensitivity and patient prognosis.22,23 In addition, mutations in GREB1 are associated with a worse prognosis of patients with lung adenocarcinoma and with patients resistance to cisplatin.24
Machine learning, driven by computing power and massive data, has made outstanding achievements in the health and medical fields.25 Using preclinical research models with genomics and drug response data, machine learning or deep learning methods may identify genomic features26 or transcriptomic features25,27 related to drug response to help clinicians choose suitable drugs for individual patients. Based on the expression data of tumor organoids and their drug response data, researchers have used machine learning to identify pathway features related to the half maximal inhibitory concentration (IC50) that have been consistently verified in colon cancer and bladder cancer patient cohorts.28
In this study, we conducted a sophisticated machine learning scheme, including beam search and classification,29 to select an optimal gene panel to predict resistance to cisplatin and attempted to explain the potential underlying mechanism by analyzing the sequencing and drug response data of 170 lung cancer cell lines from the GDSC database. Support vector machines (SVMs) were used to construct the model,30 and 10 times stratified 5-fold cross-validation was performed to ensure the robustness and reliability of our results. Our research has great potential to provide individualized treatment recommendations to improve the prognosis of patients with lung cancer.
Materials and Methods
Drug Response, Gene Expression and Mutation Data
The natural logarithm of the half maximal inhibitory concentration (lnIC50) values of all selected cell lines treated with cisplatin were downloaded from GDSC. Robust Multichip Average (RMA) normalized expression data from the Affymetrix Human Genome U219 array, and gene mutation information found in cell lines by Illumina HiSeq 2000 WES were also obtained from GDSC.
Identification of Cisplatin-Sensitive and -Resistant Cell Lines
The sensitivity of cancer cell lines to drugs is mainly expressed in terms of the IC50 value, which refers to the concentration of the drug needed to kill half of the tumor cells in vitro. Because the drug concentration was diluted one-tenth or one-hundredth, we used the lnIC50 to distinguish resistant or sensitive cell lines. Based on the GDSC 8.1 database (updated on October 2019), a total of 170 lung cancer cell lines have cisplatin drug sensitivity data, WES mutation data and RNA sequencing (RNA-Seq) data. To distinguish between resistant and sensitive cell lines, we analyzed the distribution of lnIC50 values and performed binary Gaussian fitting to fit the distribution. Finally, the k-means clustering algorithm was used to determine whether a cell line was sensitive or resistant based on the lnIC50 value.31 The pseudocode of identification of cisplatin-sensitive and cisplatin-resistant cell lines is shown in Table 1.
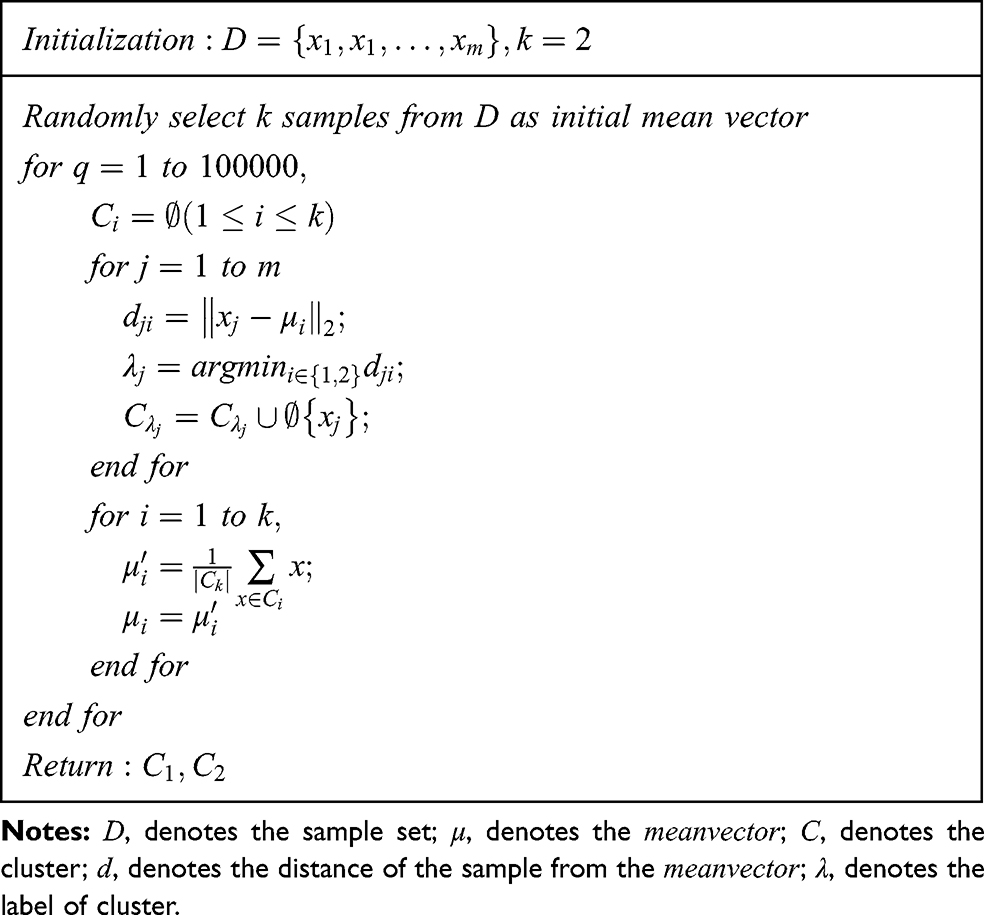 |
Table 1 The Pseudocode of Identification of Cisplatin-Sensitive and Cisplatin-Resistant Cell Lines |
Feature Normalization
The Z-score normalization method was used to normalize the data to improve the accuracy and reliability of the model.32 Specifically, the normalization of each feature was as follows:

where  denotes measurements of a specific feature,
  denotes the mean value of
  ,
,  denotes the standard deviation of
  , and
, and  denotes the normalized feature value. We used the same normalization procedure in both the training and test sets to make the experiments more precise.
Selection of Mutated Resistance Gene Panel
A total of 170 lung cancer cell lines in the GDSC database were identified as cisplatin-sensitive or -resistant with the aforementioned method. A total of 1693 genes with mutation frequencies above 5% were selected as candidate genes. SVMs were used to construct the classifiers, and the average area under the curve (AUC), accuracy, sensitivity, and specificity were used to evaluate the performance of the classifiers. We aimed to select the optimal gene panel by combining SVMs and beam search.29,30 The entire procedure of our workflow is shown in Figure 1B; within each loop, the mutation data of each mutation panel were used as the input data of the model to predict the resistance to cisplatin. Ten times stratified 5-fold cross-validation was used to select the stable gene panels. Specifically, within each iteration, a fold was used as the test set, and all remaining folds were used as the training set. This classification procedure was repeated 5 times, and the average result of 5 folds was regarded as the cross-validation result of the model. The average results of 10 repeats of cross-validation were calculated to evaluate each gene panel, and all gene panels were ranked by AUC. First, 1693 single genes were used as a 1-gene panel cohort with a size of 1693. Then, we traversed this cohort to classify the cell lines and took the gene panel with the highest AUC as the priority gene panel and, similarly, the gene panels with the top 100 AUCs as the priority cohort. Finally, we exhaustively added a gene to the panels in the priority cohort to form a new gene panel cohort. This process was repeated until the accuracy of the priority gene panel of the next loop no longer increased significantly to obtain the optimal gene panel. The Scikit-learn (version: 0.23.1) software package was used to conduct the experiments in this study.33
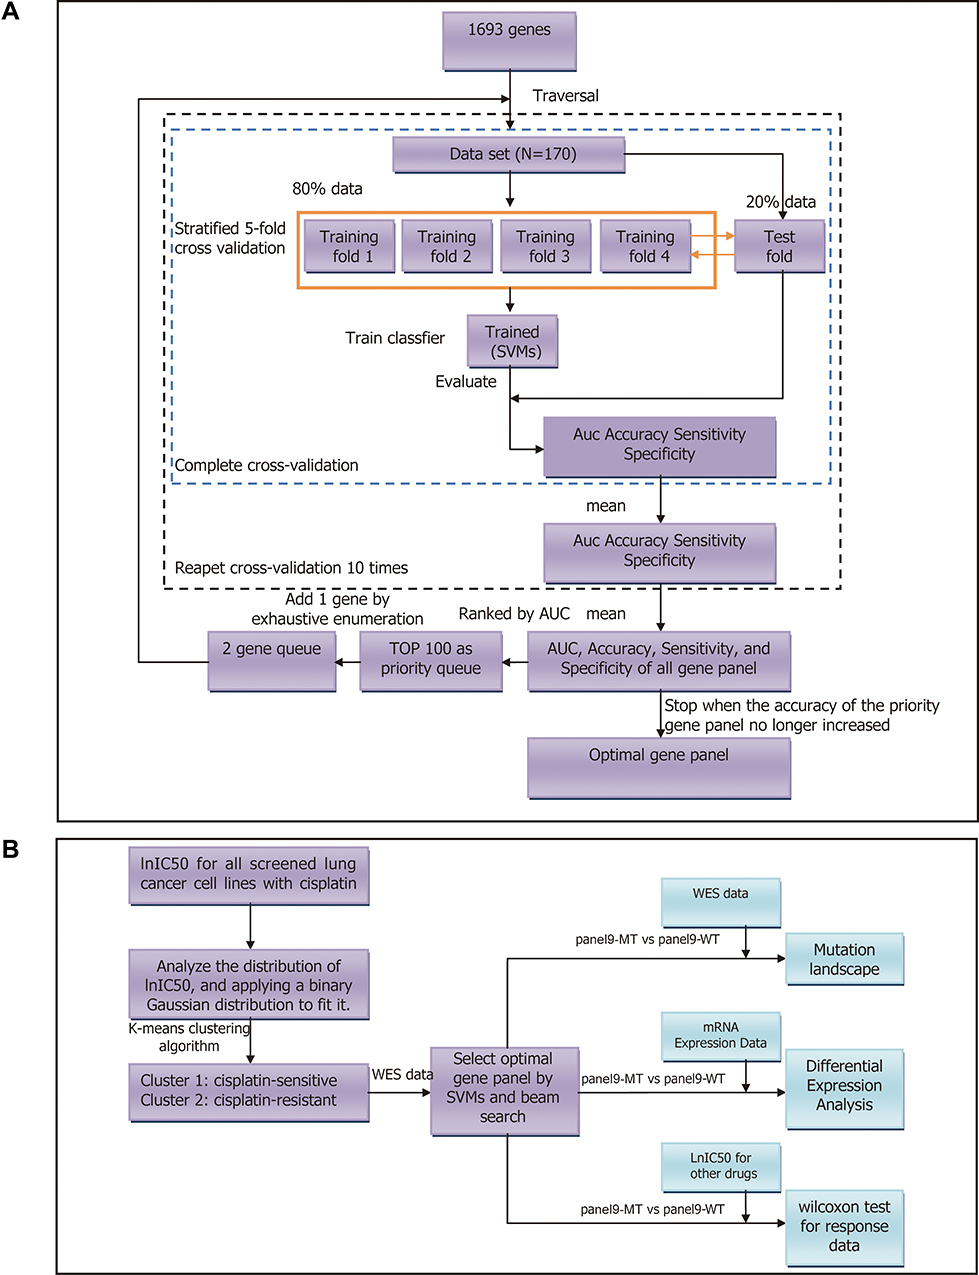 |
Figure 1 Flowcharts of the selection of the mutated resistance-related gene panel in this study. (A) Work flow of this paper. SVMs, support vector machines; WES, whole-exome sequencing. (B) Flowchart of the selection of the mutated resistance-related gene panel. N indicates the sample size. Abbreviations: AUC, area under the curve; SVMs, support vector machines. |
TMB and DDR
The nonsynonymous mutations of lung cancer cell lines were taken as the raw mutation count and divided by 38 Mb to quantify the tumor mutation burden (TMB).34 The R package ComplexHeatmap35 was used to visualize the top 20 mutated genes in the sample and the gene panels identified by SVM. DNA damage repair (DDR) pathway-related gene sets were downloaded from the Molecular Signatures Database (MSigDB) of the Broad Institute.36 These gene sets were used to evaluate the number of nonsynonymous mutations in the DDR pathway and compare the difference between the panel-MT (panel-MT) group and the panel-WT type (panel-WT) group.
Differential Gene Expression Analysis and Gene Set Enrichment Analysis
The R package limma was used to perform differential analysis on the gene expression data downloaded from GDSC.37 The R package clusterProfiler was used to perform gene set enrichment analysis (GSEA),38 among which p<0.05 was considered significant. If the enrichment score was greater than 0 and the p value was less than 0.05, the pathway was highly expressed in the panel-MT group; the opposite pattern indicated that the pathway was highly expressed in the panel-WT group. The pathway gene sets used in the GSEA were downloaded from MSigDB of the Broad Institute and included 3 categories, including Gene Ontology (GO) terms, Kyoto Encyclopedia of Genes and Genomes (KEGG) and Reactome.36
Statistical Analysis
The differences in drug response data and TMB between the panel-MT and panel-WT groups in GDSC were examined using the Mann–Whitney U-test, and the associations between the panel status and the top 20 recurrently mutated genes and genes in the panel were examined using Fisher’s exact test. p <0.05 was considered significant, and all tests were two-sided. All statistical tests and visualizations were performed with R software (version 3.6.1) and R studio (Version 1.2.1335). In addition, the R package ggpubr was used to create boxplots.37
Results
Identification of Cisplatin-Sensitive and -Resistant Cell Lines
The workflow of our entire study is shown in Figure 1A. The lnIC50 distribution was analyzed to distinguish cisplatin-sensitive cell lines from cisplatin-resistant cell lines. As shown in Figure 2A, based on this distribution, binary Gaussian fitting was performed, and the goodness-of-fit coefficient (R2 = 0.9958) indicated that the curve fit very well. Therefore, cisplatin-sensitive and -resistant phenotypes can be characterized by a binary Gaussian distribution. From the binary Gaussian distribution, we know that the cell lines that correspond to lnIC50 in the left (blue) curve indicate cisplatin-sensitive cell lines, and those in the right (pink) curve indicate cisplatin-resistant cell lines. Based on the characteristics of the binary Gaussian distribution, the k-means clustering algorithm was used to perform 100 thousand iterations to determine whether each cell line was resistant or sensitive. As shown in Figure 2B, 104 cell lines were identified as cisplatin-sensitive cell lines (cluster 0), while the remaining 66 cell lines were identified as cisplatin resistant (cluster 1).
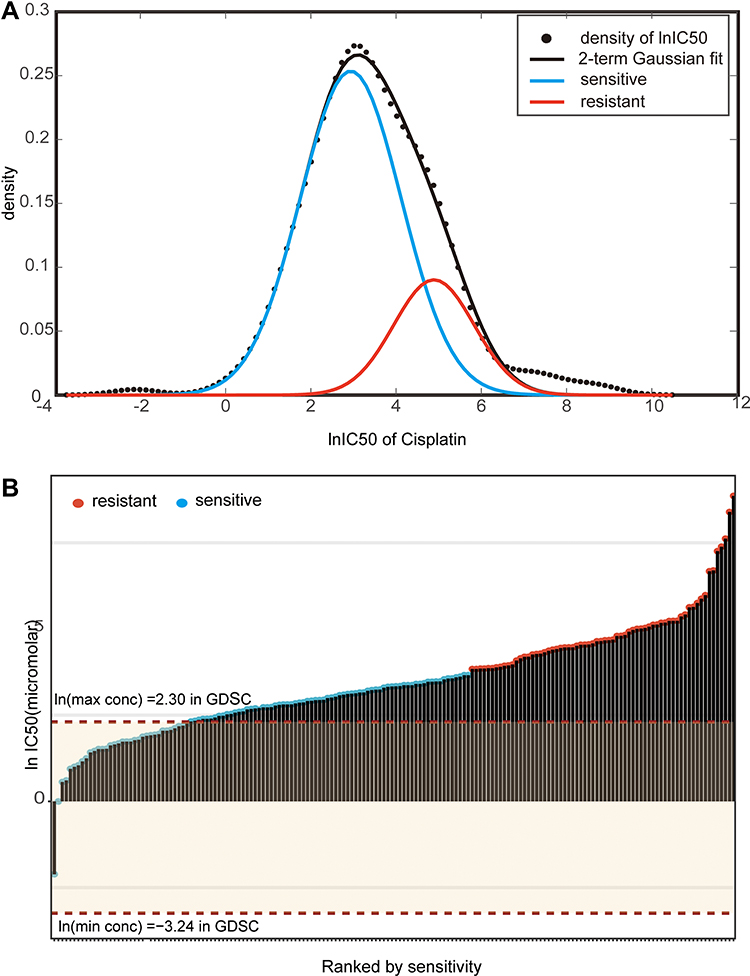 |
Figure 2 IC50 distribution of cisplatin in lung cancer cells. (A) Fit curve displaying the distribution of lnIC50 values in 170 lung cancer cell lines. (B) Scatter plot of the IC50 distribution of cisplatin in 170 lung cancer cells. The first red dotted line shows the maximum screening concentration of 10.0 µM, and the second red dotted line at the bottom shows the minimum screening concentration of 0.0391 µM. The red dots correspond to the predicted cisplatin-resistant cell lines by the k-means method, and the blue dots correspond to the predicted cisplatin-sensitive cell lines. |
Classification Performance and Optimal Gene Panel
As shown in Figure 3A, when using a beam search to select the optimal gene panel, the AUC of the priority gene panel gradually increased as the number of genes increased. When 9 genes were selected, the accuracy of the priority gene panel no longer increased significantly. Therefore, 9 genes were selected as an optimal gene panel to predict resistance to cisplatin. The corresponding genes were PLXNC1, KIAA0649, SPTBN4, SLC14A2, F13A1, COL5A1, SCN2A, PLEC, and ALMS1. As shown in Table 2, the model achieved an AUC of 0.873 and an overall accuracy of 84.71% when using mutations of the optimal gene panel. In addition, it had an accuracy of 84.68% in correctly identifying resistant cell lines (ie, sensitivity) and an accuracy of 84.61% in identifying cell lines sensitive to cisplatin (ie, specificity).
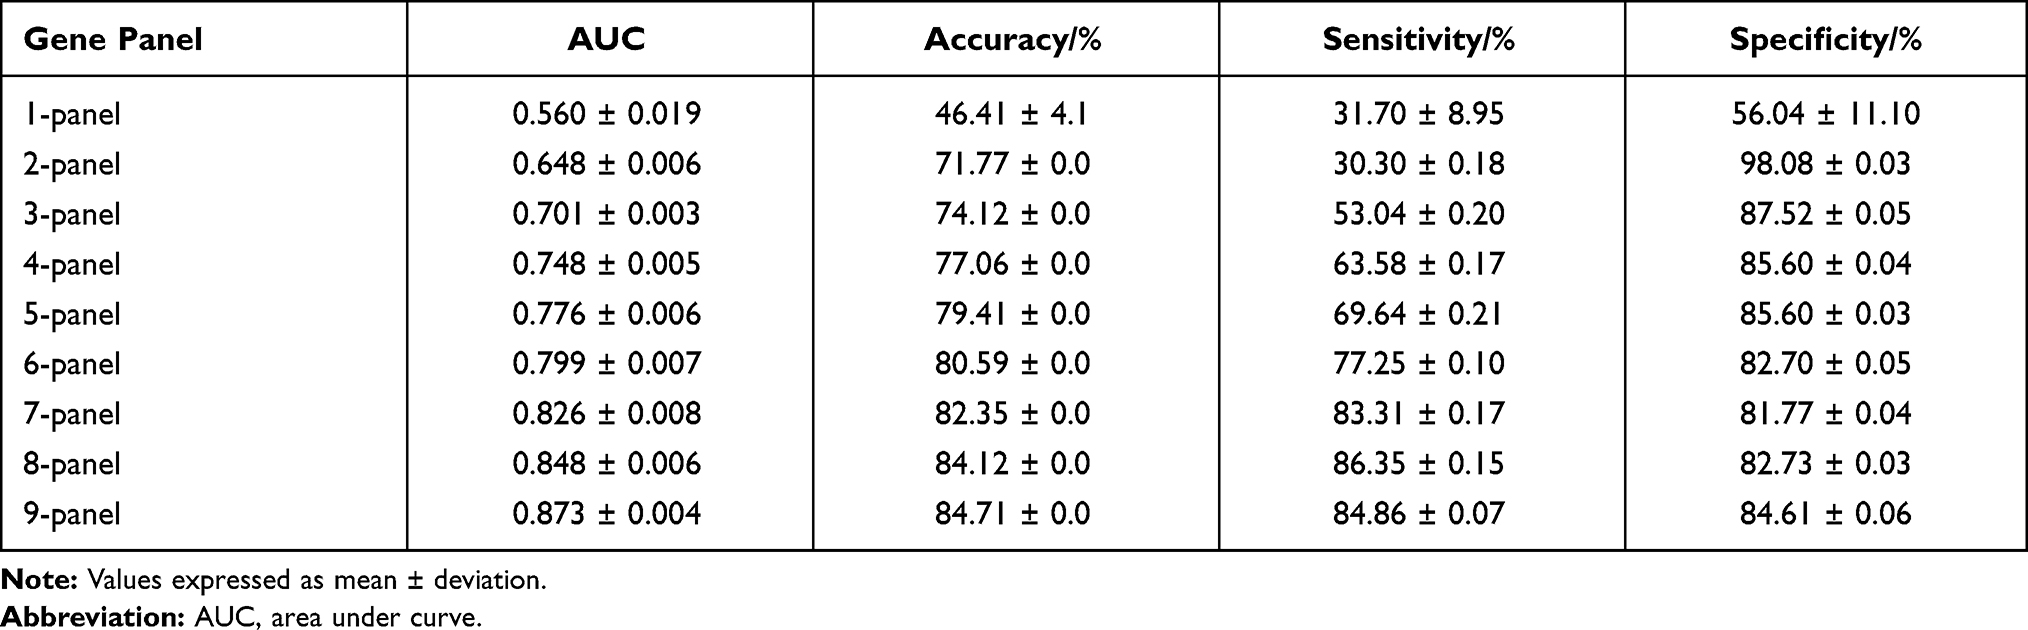 |
Table 2 A Summary of Priority Gene Panels (Means and Deviations) |
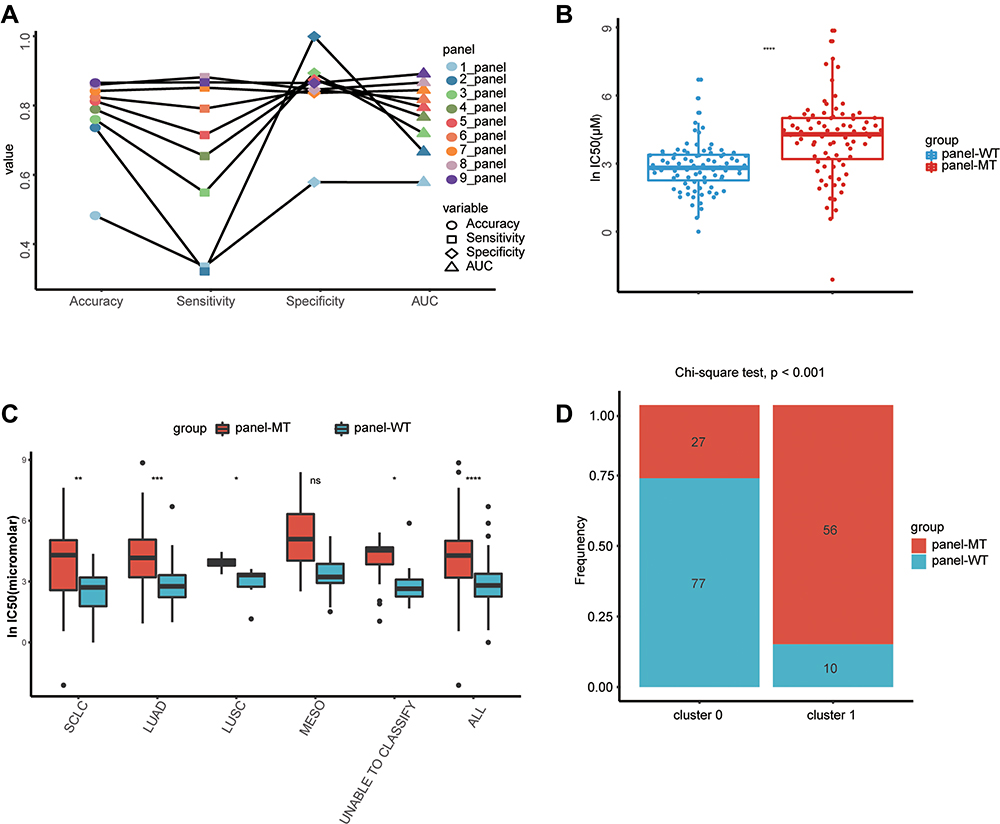 |
Figure 3 The identified features can distinguish sensitive cell lines from drug-resistant cell lines. (A) Comparison of SVM algorithms containing 1–9 characteristic genes. When more gene features are included, the accuracy and sensitivity of the SVM algorithm can be substituted, as with AUC. (B) Regardless of the subtype of lung cancer, the lnIC50 values of cell lines containing any mutations in the 9 genes were significantly higher, and these cell lines were resistant to cisplatin. (C) Considering the subtypes of lung cancer, with the exception of EMSO, cell lines containing mutations in the 9 genes had significantly higher lnIC50 values and were resistant to cisplatin. (D) Correlation analysis of cluster labels between SVMs and the k-means method. Cluster 0 by k-means was significantly enriched in more panel-WT cell lines. *, **, ***, ****, P<0.05, P<0.01, P<0.001, P<0.0001. Abbreviation: ns, not significant. |
The Gene Panel Can Predict the Responsiveness of Lung Cancer Cell Lines to Cisplatin
To further demonstrate the accuracy of the trained model, we grouped the cell lines according to the mutation characteristics of the gene panel to demonstrate whether the features selected by SVMs can accurately classify cisplatin-sensitive and -resistant cell lines. It is expected that in the panel-MT group containing any mutation in the gene panel, the lnIC50 value of the overall lung cancer cell line will be higher (p <0.001) (Figure 3B). In addition, when considering The Cancer Genome Atlas (TCGA) tumor label provided in the GDSC drug screening data, these lung cancer cell lines were grouped into lung adenocarcinoma (LUAD), lung squamous cell carcinoma (LUSC), SCLC, mesothelioma (MESO) and cell lines that could not be classified. The lnIC50 value of the panel-MT group was significantly higher than that of the panel-WT group except for MESO (Figure 3C).
In addition, we explored the correlation between the labels by k-means clustering and the optimal gene panel selected by SVMs and beam search. We found that more panel-WT cell lines were significantly enriched in cluster 0, while more panel-MT cell lines were significantly enriched in cluster 1 (Figure 3D). This finding also verified that the gene panel containing 9 genes identified by machine learning can be used as a marker for the drug response of lung cancer cell lines treated with cisplatin.
The Predictive Ability of the Gene Panel for Other Drugs
To explore whether the optimal gene panel has a similar predictive ability for other drugs, we also compared other drug response data between the panel-WT group and the panel-MT group (Supplemental Table 1). Not surprisingly, based on the list of medications for lung cancer patients from the latest NCCN guidelines of SCLC and NSCLC, we also found the same predictive ability for certain other chemotherapeutics (Figure 4). With regard to these chemotherapeutic agents, the lnIC50 of the drugs was significantly different between the groups except for gemcitabine and paclitaxel. Among the recommended targeted drugs, none of the drugs had showed significant differences in lnIC50.
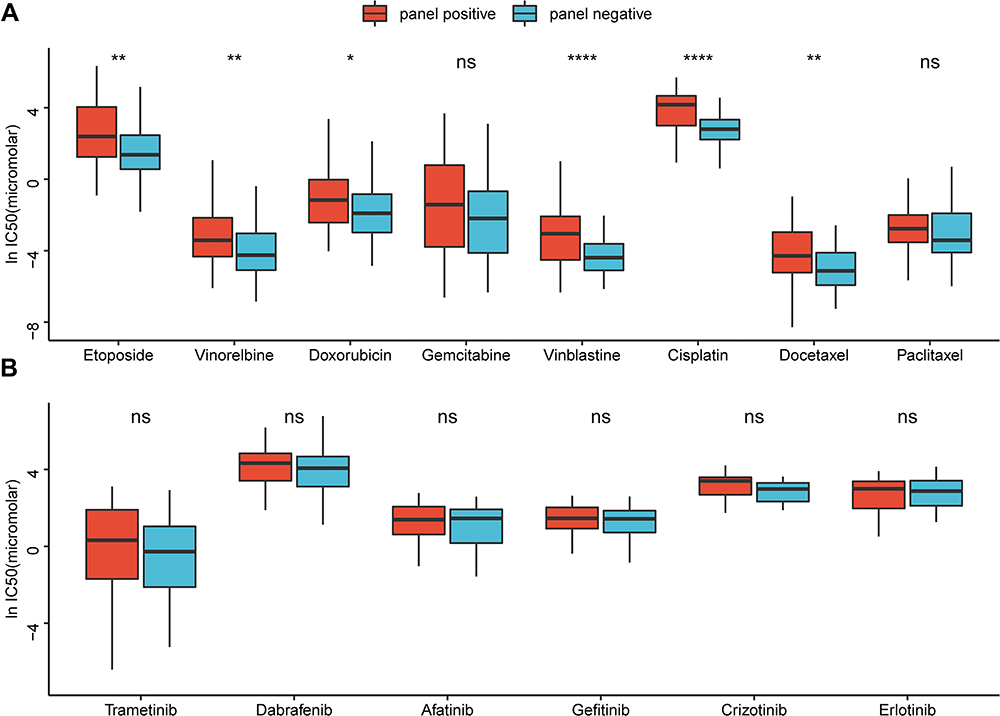 |
Figure 4 The identified features can be extended to other chemotherapy drugs in the GDSC database. (A) With regard to chemotherapeutic agents recommended by the latest NCCN guidelines of SCLC and NSCLC, the lnIC50 of the drugs were significantly different between the groups, except for gemcitabine and paclitaxel. (B) Among the recommended targeted drugs, none had significant differences in lnIC50 between the panel-MT and panel-WT groups. *, **, ****, P<0.05, P<0.01, P<0.0001. Abbreviation: ns, not significant. |
Differences in Gene Mutation Load Between the Panel-WT and Panel-MT Groups
To determine the potential mechanism by which the gene panel can predict the response of lung cancer cell lines to cisplatin, we combined the available sequencing data for subsequent analysis. By calculating the TMB of each group, we found that the panel-MT group had a significantly higher TMB than the panel-WT group (Mann–Whitney U-test, p <0.05) (Figure 5A). Because DNA is the target of cisplatin, we also explored differences in the frequency of gene mutations in the DDR pathway. Overall, the median frequency of mutations in the DDR pathway in the panel-MT group was higher than that of the panel-WT group. In detail, the frequency of mutations in panel-MT homologous recombination (HR) pathways was also significantly higher (Figure 5B).
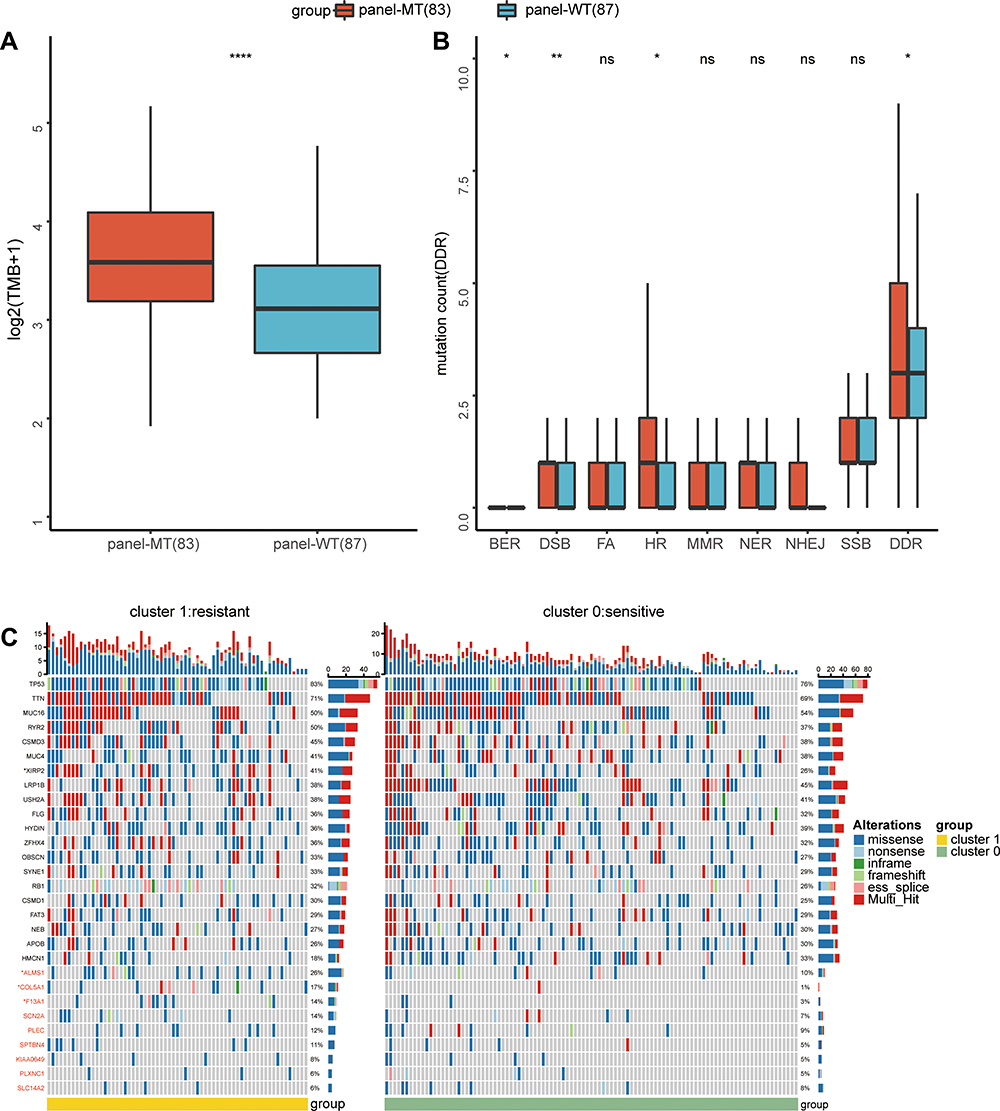 |
Figure 5 Differences in gene mutations between the panel-MT and panel-WT groups. (A) The TMB in the panel-MT group was significantly higher (p <0.001). (B) The number of mutations of the overall DDR and HR pathways in the panel-MT group was significantly higher than that in the panel-WT group (p <0.05). (C) The top 20 mutant genes and genes in the panel are grouped by the results of k-means clustering. Fisher’s exact test was used to test the associations between the panel status and the mutated genes. *, **, ****, P<0.05, P<0.01, P<0.0001. Abbreviations: TMB, tumor mutation burden; DDR, DNA damage repair; HR, homologous recombination; ns, not significant. |
Next, we explored the differences between the recurrently mutated genes and the genes in the panel. Figure 5C shows the recurrently mutated genes and the 9 genes in the optimal gene panel grouped based on k-means clustering. We found that among the lung cancer cell lines included in the study, the most recurrently mutated genes were TP53, TTN, MUC16 and RYR2. For mutations in TP53, missense mutations were most common, which may be related to their inactivation status. In contrast to TP53, TTN and MUC16 mainly contained missense mutations and multiple mutations. In addition to the most common mutant genes, we found genes with different mutation frequencies in the two groups. Among the top 20 mutant genes, the mutation frequency of XIRP2 in the cluster 1 group was higher at 41%, while the mutation frequency in cluster 0 was 26%. Additionally, the mutation frequency of ALMS1 in the panel was also significantly higher in the cluster 1 group (26% in cluster 1; 10% in cluster 0). Moreover, we found that some recurrently mutated genes with different mutation frequencies in the two groups (Supplemental Table 2), such as CDH10, ENSG00000121031, SCN1A, WDFY4, and NLRP5, had higher mutation frequencies in cluster 1 (27%, 23%, 23%, 23%, and 21%, respectively), while ABCA1, ZFAT, PCDHG_cluster, RP11-551L14.1, VCX, HEPHL1 and LHCGR had higher mutation frequencies in cluster 0 (16%, 13%, 12%, 12%, 11%, 11%, and 11%, respectively). Among the 9 genes in the panel, the mutation frequencies of COL5A1 and F13A1 in cluster 1 were significantly higher than those in cluster 0 (COL5A1 17% vs 1%; F13A1 14% vs 3%).
High Enrichment of DNA Repair-Related Pathways in the Panel-MT Group May Promote Cell Resistance to Cisplatin
To explore the correlation between the expression of genes in the panel, we performed correlation analysis between genes, and the results indicated that there was no significant correlation between most genes. PLEC had a strong negative correlation with SPTBN4 (r = −0.68), ALMS1 (r = −0.51), and SCN2A (r = −0.51), while ALMS1 had a weak positive correlation with SPTBN4 (r = 0.49), and SCN2A (r = 0.39). There was a weak positive correlation between SCN2A and SPTBN4 (r = 0.41) (Supplementary Figure 1).
Next, we performed gene differential expression analysis (DEA) and GSEA to identify molecules or pathways that may explain the differences in the responses of the two groups to cisplatin. The DEA results showed that a total of 7 genes were upregulated in the panel-MT group, and 14 genes were upregulated in the panel-WT group, with a p value <0.05 and fold change (FC)>3/2 or FC <2/3 (Figure 6A, Supplemental Table 3).
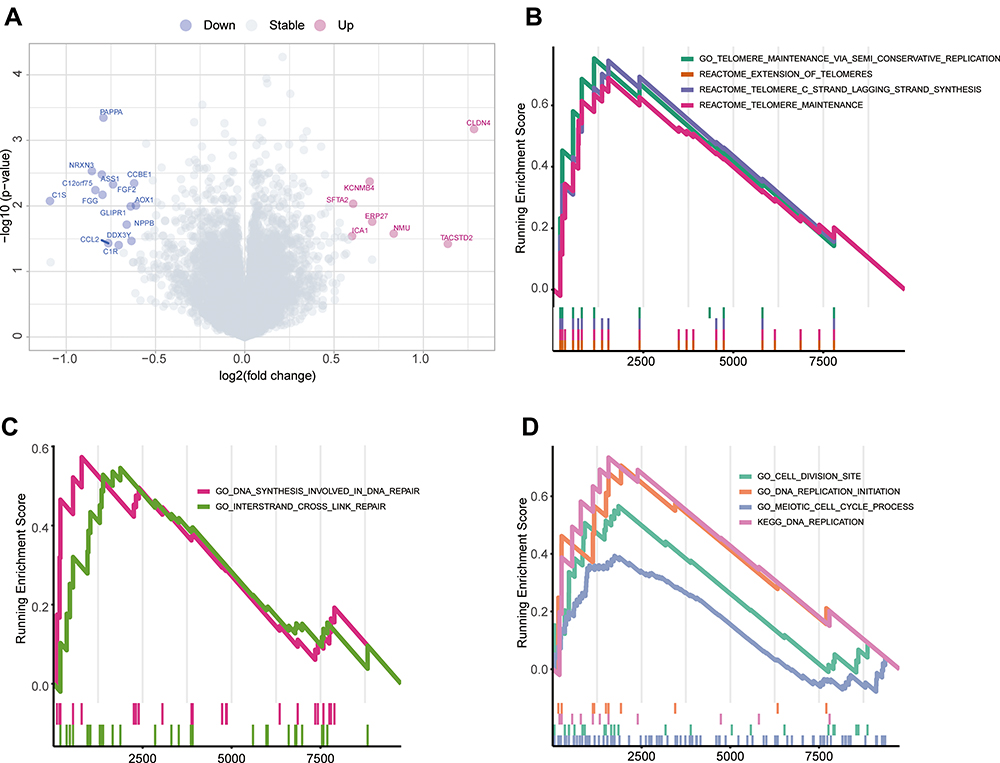 |
Figure 6 Differences in molecular and pathway expression between the panel-MT and panel-WT groups. (A) Differentially expressed genes between the panel-MT and panel-WT groups. A total of 14 genes were upregulated in the panel-WT group when the p value <0.05 and FC > 3/2 or FC < 2/3. FC, fold change. (B–D) The GSEA results show the significantly enriched pathways in the panel-MT group. Pathways related to telomerase maintenance (B) and the cell cycle (D) were enriched in the panel-MT group. DNA synthesis involved in DNA repair and interstrand crosslink repair pathways were significantly enriched in the panel-MT group (C). Abbreviation: GSEA, gene set enrichment analysis. |
Pathways representing several function-related genes can achieve specific biological functions. In contrast, dysfunctional pathways are related to the occurrence and development of diseases. In this study, we found that the pathways enriched in the panel-MT group and the panel-WT group were different (Figure 6B–D, Supplemental Table 4). Based on the pathways filtered by p<0.05, we found that pathways related to telomerase maintenance and cell cycle-related pathways were enriched in the panel-MT group (Figure 6B and D). In addition, we found that DNA synthesis involved in DNA repair and interstrand crosslink repair pathways were significantly enriched in the panel-MT group (Figure 6C).
Discussion
In this study, we found that a combination of mutations and machine learning can accurately predict resistance to cisplatin. Furthermore, we selected a 9-gene panel that may be highly associated with resistance to cisplatin and an efficient biomarker for resistance to cisplatin in lung cancer cells. In this paper, we innovatively applied beam search and machine learning for the prediction of resistance to cisplatin in lung cancer cell lines. First, we performed binary Gaussian fitting on the drug susceptibility data of lung cancer and used k-means clustering to identify cisplatin-sensitive and -resistant cell lines. Second, we applied a beam search to select the optimal gene panel. In addition to selecting 1693 genes of larger magnitude as candidate genes, we also traversed as many gene panels as possible to evaluate their prediction ability for resistance to cisplatin in lung cancer cell lines to select an optimal gene panel that can accurately predict resistance to cisplatin. Moreover, 10 times stratified 5-fold cross-validation was employed to obtain stable and reliable observation results. Finally, classification was based on the mapping relationship between the features and labels, so the optimal gene panel we selected may implicitly indicate the correlation between these genes and resistance to cisplatin, which can help us to explain the potential mechanism.
The 9-gene panel included PLXNC1, KIAA0649, SPTBN4, SLC14A2, F13A1, COL5A1, SCN2A, PLEC, and ALMS1. Except for F13A1, which has only been reported in benign tumors,39 the remaining genes have been reported to be associated with malignant tumors. Among them, PLXNC1,40 KIAA0649,41 SCN2A42 and SCN2A43,44 are related to malignant tumor progression, metastasis or chemotherapy resistance.
The lung cancer cell lines in GDSC were grouped into panel-MT and panel-WT groups, and the accuracy of the panel in classifying sensitive and resistant cell lines was verified in our study. We found that in all cell lines, the lnIC50 values of the panel-MT group were significantly higher than those of the panel-WT group (p<0.001). In addition, with the exception of MESO (malignant tumors derived from the pleura), cell lines from different lung cancer subtypes in the panel-MT group were less responsive to cisplatin, and the corresponding lnIC50 values were higher, and the differences were all significant (p<0.05). The above results suggest that the mutation status of the gene panel selected by SVM can predict the response of lung cancer cell lines to cisplatin well.
Cisplatin-based treatment regimens play a very important role in each subtype of lung cancer.5–8 The main mechanism by which cisplatin suppresses tumors is through interacting with DNA to form covalent adducts with purine DNA bases, causing DNA damage and disrupting DNA replication and transcription.45 Theoretically, tumors with damaged DDR pathways are more sensitive to cisplatin because they cannot recover the DNA damage caused by cisplatin in a timely manner,46 which is found in many tumor types.47,48 It is worth mentioning that in the DDR subpathway, the HR pathway repairs DNA double-strand breaks, and abnormalities in its function cause significant damage to tumor cells. However, other previous studies have found that colon cancer cells and endometrial cancer cells with defects in DNA damage repair are resistant to cisplatin and carboplatin, respectively.49 The possible mechanism may be that the normal function of the mismatch repair system (MMR) after DNA replication can induce cell apoptosis and increase the sensitivity of cisplatin to damaged DNA, while MMR-deficient cells can lead to decreased apoptosis and cell resistance.50 In our study, the overall number of DDR mutations in the panel-MT group was significantly higher than that in the panel-WT group (p<0.05).
Previous studies have suggested that tumors with mutations in the DDR pathway show a higher TMB because of a greater accumulation of unrepaired DNA damage in cells.34 Similarly, we also found that the TMB of the panel-MT group was higher, which is consistent with the higher mutations in the DDR pathway in the panel-MT group. Immunotherapy has made remarkable achievements in the treatment of solid tumors, including lung cancer,51 but only a small subset of the population benefits, and there is an urgent need to identify patients who are likely to benefit from immune checkpoint inhibitors (ICIs). The KEYNOTE-158 pan-cancer study recently promoted the Food and Drug Administration (FDA) approval of pembrolizumab for the treatment of patients with tumors with high TMB (> 10 mutations/Mb)51 (https://www.fda.gov/drugs/ drug-approvals-and-databases/ fda-approves -pembrolizumab -adults-and-children-tmb-h-solid-tumors). The above research indicates that we can also use the panel genes found in our research to predict TMB. In addition, our previous study demonstrated that cancer cells with high TMB are associated with higher IC50 values,22 which is consistent with our current conclusion, suggesting that high TMB may also be a mechanism of cisplatin resistance.
In addition, we explored genes with a high frequency of mutations in lung cancer cells. Among the top 20 frequently mutated genes, the mutation frequency of XIRP2 in cluster 1 was significantly higher (41% vs 26%). This gene has been reported in breast cancer52 and gastric cancer53 in clinical samples, but it has not been reported in other cancers. This finding suggests the need to increase the number of clinical samples to discover new gene mutantations and provide opportunities for subsequent mechanistic research. Among the genes identified by SVM, ALMS1 (26% vs 10%), COL5A1 (17% vs 1%) and F13A1 (14% vs 3%) had mutation frequencies in cluster 1 that were significantly higher than those in cluster 0. Except for the mechanisms of COL5A1 in tumors, the mechanisms of the remaining two genes in malignant tumors have not been reported. Previous studies have suggested that high COL5A1 expression is associated with a poor prognosis in breast cancer44 and with the metastasis of lung adenocarcinoma.45 The above results suggest that our algorithm can identify new molecular markers related to chemotherapy, which should be validated further.
Studies on the mechanism of cisplatin, which is a type of cell cycle-specific drug, have shown that cisplatin is mainly cross-linked with DNA during replication to affect the function of DNA and cause cell death.54 In addition, enhanced DNA damage repair capabilities can prevent the accumulation of lethal DNA damage induced by platinum-based treatment, leading to chemotherapy resistance.55 In our research, we found that telomere pathways, such as telomere maintenance, extension, and C-chain lagging synthesis, and cell cycle pathways, such as meiotic cell cycle process, DNA replication initiation and DNA replication, were enriched in the panel-MT group, suggesting that cells in the panel-MT group may be more sensitive to cisplatin. However, the IC50 values of the panel-MT group were significantly higher than those of the panel-WT group, indicating that there may be other factors influencing the response of cell lines to cisplatin. In our research, we also found that pathways related to DNA repair during DNA synthesis were also enriched in the panel-MT group, suggesting that cells in the panel-MT group have a stronger ability to repair DNA damage, thereby reducing the formation of damaged DNA induced by cisplatin. The latter factor may play a major role in explaining why cells in the panel-MT group are more likely to be resistant to cisplatin.
The panel features identified by the SVM algorithm have the same predictive ability for the response of lung cancer cell lines to other chemotherapeutics. It is worth mentioning that among the drugs we identified, etoposide has the same mechanism as cisplatin of interacting with DNA and preventing DNA synthesis. In addition, there were some drugs targeted the cell cycle, including docetaxel, vinblastine, and vinorelbine. The above cytotoxic drugs are cell cycle-specific. The results suggest that the panel features identified by SVM can predict not only the sensitivity of lung cancer cell lines to cisplatin but also the response to drugs with the same or similar mechanism.
There were several potential limitations in our study. First, our sample size was limited, and there were only 170 lung cancer cell lines with cisplatin drug sensitivity data, mutation data and transcription data. However, full validation strategies were performed to ensure the reliability and robustness of the observations. Second, there are currently no suitable large-sample clinical data to directly support our conclusions; additional relevant clinical studies are needed.
Conclusion
In conclusion, we analyzed the drug response data and sequencing data of 170 lung cancer cell lines and established a 9-gene panel related to cisplatin sensitivity. Targeted sequencing containing these 9 genes helps predict the responsiveness of lung cancer patients to cisplatin and may provide personalized guidance for patient management.
Disclosure
The authors report no conflicts of interest in this work.
References
1. Herbst RS, Morgensztern D, Boshoff C. The biology and management of non-small cell lung cancer. Nature. 2018;553(7689):446–454. doi:10.1038/nature25183
2. Torre LA, Siegel RL, Ward EM, Jemal A. Global cancer incidence and mortality rates and trends–an update. Cancer Epidemiol Biomarkers Prev. 2016;25(1):16–27. doi:10.1158/1055-9965.EPI-15-0578
3. Scagliotti G, von Pawel J, Novello S, et al. Phase III multinational, randomized, double-blind, placebo-controlled study of tivantinib (ARQ 197) plus erlotinib versus erlotinib alone in previously treated patients with locally advanced or metastatic nonsquamous non-small-cell lung cancer. J Clin Oncol. 2015;33(24):2667. doi:10.1200/JCO.2014.60.7317
4. Sabari JK, Lok BH, Laird JH, Poirier JT, Rudin CM. Unravelling the biology of SCLC: implications for therapy. Nat Rev Clin Oncol. 2017;14(9):549–561. doi:10.1038/nrclinonc.2017.71
5. Farago AF, Keane FK. Current standards for clinical management of small cell lung cancer. Transl Lung Cancer Res. 2018;7(1):69–79. doi:10.21037/tlcr.2018.01.16
6. Pignon J-P, Tribodet H, Scagliotti GV, et al. Lung adjuvant cisplatin evaluation: a pooled analysis by the LACE collaborative group. J Clin Oncol. 2008;26(21):3552–3559. doi:10.1200/JCO.2007.13.9030
7. Strauss GM, Herndon JE, Maddaus MA, et al. Adjuvant paclitaxel plus carboplatin compared with observation in stage IB non-small-cell lung cancer: CALGB 9633 with the cancer and leukemia group B, radiation therapy oncology group, and north central cancer treatment group study groups. J Clin Oncol. 2008;26(31):5043–5051. doi:10.1200/JCO.2008.16.4855
8. Le Chevalier T, Arriagada R, Le Pechoux C, et al. Cisplatin-based adjuvant chemotherapy in patients with completely resected non-small-cell lung cancer. New Eng J Med. 2004;350(4):351–360.
9. Li G, Ma Y, Yu M, et al. Identification of hub genes and small molecule drugs associated with acquired resistance to gefitinib in non-small cell lung cancer. J Cancer. 2021;12(17):5286–5295. doi:10.7150/jca.56506
10. Iorio F, Knijnenburg TA, Vis DJ, et al. A landscape of pharmacogenomic interactions in cancer. Cell. 2016;166(3):740–754. doi:10.1016/j.cell.2016.06.017
11. Barretina J, Caponigro G, Stransky N, et al. Addendum: The Cancer Cell Line Encyclopedia enables predictive modelling of anticancer drug sensitivity. Nature. 2019;565(7738):E5–E6. doi:10.1038/s41586-018-0722-x
12. Basu A, Bodycombe NE, Cheah JH, et al. An interactive resource to identify cancer genetic and lineage dependencies targeted by small molecules. Cell. 2013;154(5):1151–1161. doi:10.1016/j.cell.2013.08.003
13. Dempster JM, Pacini C, Pantel S, et al. Agreement between two large pan-cancer CRISPR-Cas9 gene dependency data sets. Nat Commun. 2019;10. doi:10.1038/s41467-019-13805-y
14. Seashore-Ludlow B, Rees MG, Cheah JH, et al. Harnessing connectivity in a large-scale small-molecule sensitivity dataset. Cancer Discov. 2015;5(11):1210–1223. doi:10.1158/2159-8290.CD-15-0235
15. Chabner BA. NCI-60 cell line screening: a radical departure in its time. J Natl Cancer Inst. 2016;108(5):djv388. doi:10.1093/jnci/djv388
16. Garnett MJ, Edelman EJ, Heidorn SJ, et al. Systematic identification of genomic markers of drug sensitivity in cancer cells. Nature. 2012;483(7391):570–587. doi:10.1038/nature11005
17. Druker BJ, Guilhot F, O’Brien SG, et al. Five-year follow-up of patients receiving imatinib for chronic myeloid leukemia. New Eng J Med. 2006;355(23):2408–2417. doi:10.1056/NEJMoa062867
18. Chapman PB, Hauschild A, Robert C, et al. Improved survival with vemurafenib in melanoma with BRAF V600E mutation. New Eng J Med. 2011;364(26):2507–2516. doi:10.1056/NEJMoa1103782
19. Konecny GE, Pegram MD, Venkatesan N, et al. Activity of the dual kinase inhibitor lapatinib (GW572016) against HER-2-overexpressing and trastuzumab-treated breast cancer cells. Cancer Res. 2006;66(3):1630–1639. doi:10.1158/0008-5472.CAN-05-1182
20. Lynch TJ, Bell DW, Sordella R, et al. Activating mutations in the epidermal growth factor receptor underlying responsiveness of non-small-cell lung cancer to gefitinib. New Eng J Med. 2004;350(21):2129–2139. doi:10.1056/NEJMoa040938
21. Daver N, Wei AH, Pollyea DA, Fathi AT, Vyas P, DiNardo CD. New directions for emerging therapies in acute myeloid leukemia: the next chapter. Blood Cancer J. 2020;10(10). doi:10.1038/s41408-020-00376-1
22. Li M, Lin A, Luo P, et al. DNAH10 mutation correlates with cisplatin sensitivity and tumor mutation burden in small-cell lung cancer. Aging. 2020;12(2):1285–1303. doi:10.18632/aging.102683
23. Qiu Z, Lin A, Li K, et al. A novel mutation panel for predicting etoposide resistance in small-cell lung cancer. Drug Des Devel Ther. 2019;13:2021–2041. doi:10.2147/DDDT.S205633
24. Li R, Liu J, Fang Z, Liang Z, Chen X. Identification of mutations related to cisplatin-resistance and prognosis of patients with lung adenocarcinoma. Front Pharmacol. 2020;11:1705.
25. Esteva A, Robicquet A, Ramsundar B, et al. A guide to deep learning in healthcare. Nat Med. 2019;25(1):24–29. doi:10.1038/s41591-018-0316-z
26. Snow O, Lallous N, Ester M, Cherkasov A. Deep learning modeling of androgen receptor responses to prostate cancer therapies. Int J Mol Sci. 2020;21(16):5847. doi:10.3390/ijms21165847
27. Steiner MC, Gibson KM, Crandall KA. Drug resistance prediction using deep learning techniques on HIV-1 sequence data. Viruses. 2020;12(5):560. doi:10.3390/v12050560
28. Kong J, Lee H, Kim D, et al. Network-based machine learning in colorectal and bladder organoid models predicts anti-cancer drug efficacy in patients. Nat Commun. 2020;11(1). doi:10.1038/s41467-020-19313-8
29. Sabuncuoglu I, Bayiz M. Job shop scheduling with beam search. Eur J Oper Res. 1999;118(2):390–412. doi:10.1016/S0377-2217(98)00319-1
30. Hsu CW, Lin CJ. A comparison of methods for multiclass support vector machines. IEEE Trans Neural Netw. 2002;13(2):415–425. doi:10.1109/72.991427
31. Xu R, Wunsch D. Survey of clustering algorithms. IEEE Trans Neural Netw. 2005;16(3):645–678. doi:10.1109/TNN.2005.845141
32. Higgs RE, Knierman MD, Freeman AB, Gelbert LM, Patil ST, Hale JE. Estimating the statistical significance of peptide identifications from shotgun proteomics experiments. J Proteome Res. 2007;6(5):1758–1767. doi:10.1021/pr0605320
33. Pedregosa F, Varoquaux G, Gramfort A, et al. Scikit-learn: machine learning in python. J Mach Learn Res. 2011;12:2825–2830.
34. Chalmers ZR, Connelly CF, Fabrizio D, et al. Analysis of 100,000 human cancer genomes reveals the landscape of tumor mutational burden. Genome Med. 2017;9. doi:10.1186/s13073-017-0424-2
35. Gu Z, Eils R, Schlesner M. Complex heatmaps reveal patterns and correlations in multidimensional genomic data. Bioinformatics. 2016;32(18):2847–2849. doi:10.1093/bioinformatics/btw313
36. Subramanian A, Tamayo P, Mootha VK, et al. Gene set enrichment analysis: a knowledge-based approach for interpreting genome-wide expression profiles. Proc Natl Acad Sci U S A. 2005;102(43):15545–15550. doi:10.1073/pnas.0506580102
37. Ritchie ME, Phipson B, Wu D, et al. limma powers differential expression analyses for RNA-sequencing and microarray studies. Nucleic Acids Res. 2015;43(7):e47–e47. doi:10.1093/nar/gkv007
38. Yu G, Wang L-G, Han Y, He Q-Y. clusterProfiler: an R package for comparing biological themes among gene clusters. OMICS. 2012;16(5):284–287. doi:10.1089/omi.2011.0118
39. Supsrisunjai C, Hsu C-K, Michael M, et al. Coagulation factor XIII-A subunit missense mutation in the pathobiology of autosomal dominant multiple dermatofibromas. J Invest Dermatol. 2020;140(3):624. doi:10.1016/j.jid.2019.08.441
40. Balakrishnan A, Penachioni JY, Lamba S, et al. Molecular profiling of the “plexinome” in melanoma and pancreatic cancer. Hum Mutat. 2009;30(8):1167–1174. doi:10.1002/humu.21017
41. Yang L, Zhao J, Lu WQ, et al. KIAA0649, a 1A6/DRIM-interacting protein with the oncogenic potential. Biochem Biophys Res Commun. 2005;334(3):884–890. doi:10.1016/j.bbrc.2005.06.179
42. Sun J, Wang C, Zhang Y, et al. Genomic signatures reveal DNA damage response deficiency in colorectal cancer brain metastases. Nat Commun. 2019;10. doi:10.1038/s41467-019-10987-3
43. Wu M, Sun Q, Mo CH, et al. Prospective molecular mechanism of COL5A1 in breast cancer based on a microarray, RNA sequencing and immunohistochemistry. Oncol Rep. 2019;42(1):151–175.
44. Liu W, Wei H, Gao Z, et al. COL5A1 may contribute the metastasis of lung adenocarcinoma. Gene. 2018;665:57–66. doi:10.1016/j.gene.2018.04.066
45. Kelland L. The resurgence of platinum-based cancer chemotherapy. Nat Rev Cancer. 2007;7(8):573–584. doi:10.1038/nrc2167
46. Park S, Lee H, Lee B, et al. DNA damage response and repair pathway alteration and its association with tumor mutation burden and platinum-based chemotherapy in SCLC. J Thorac Oncol. 2019;14(9):1640–1650. doi:10.1016/j.jtho.2019.05.014
47. Plimack ER, Dunbrack RL, Brennan TA, et al. Defects in DNA repair genes predict response to neoadjuvant cisplatin-based chemotherapy in muscle-invasive bladder cancer. Eur Urol. 2015;68(6):959–967. doi:10.1016/j.eururo.2015.07.009
48. Teo MY, Bambury RM, Zabor EC, et al. DNA damage response and repair gene alterations are associated with improved survival in patients with platinum-treated advanced urothelial carcinoma. Clin Cancer Res. 2017;23(14):3610–3618. doi:10.1158/1078-0432.CCR-16-2520
49. Fink D, Aebi S, Howell SB. The role of DNA mismatch repair in drug resistance. Clin Cancer Res. 1998;4(1):1–6.
50. Stewart DJ. Mechanisms of resistance to cisplatin and carboplatin. Crit Rev Oncol Hematol. 2007;63(1):12–31.
51. Wu YL, Lu S, Cheng Y, et al. Nivolumab versus docetaxel in a predominantly Chinese patient population with previously treated advanced NSCLC: checkMate 078 randomized phase III clinical trial. J Thorac Oncol. 2019;14(5):867–875. doi:10.1016/j.jtho.2019.01.006
52. Paul MR, Pan TC, Pant DK, et al. Genomic landscape of metastatic breast cancer identifies preferentially dysregulated pathways and targets. J Clin Invest. 2020;130(8):4252–4265.
53. Li X, Wu WK, Xing R, et al. Distinct subtypes of gastric cancer defined by molecular characterization include novel mutational signatures with prognostic capability. Cancer Res. 2016;76(7):1724–1732. doi:10.1158/0008-5472.CAN-15-2443
54. Rottenberg S, Disler C, Perego P. The rediscovery of platinum-based cancer therapy. Nat Rev Cancer. 2021;21(1):37–50. doi:10.1038/s41568-020-00308-y
55. Perez RP. Cellular and molecular determinants of cisplatin resistance. Eur J Cancer. 1998;34(10):1535–1542. doi:10.1016/S0959-8049(98)00227-5
 © 2021 The Author(s). This work is published and licensed by Dove Medical Press Limited. The full terms of this license are available at https://www.dovepress.com/terms.php and incorporate the Creative Commons Attribution - Non Commercial (unported, v3.0) License.
By accessing the work you hereby accept the Terms. Non-commercial uses of the work are permitted without any further permission from Dove Medical Press Limited, provided the work is properly attributed. For permission for commercial use of this work, please see paragraphs 4.2 and 5 of our Terms.
© 2021 The Author(s). This work is published and licensed by Dove Medical Press Limited. The full terms of this license are available at https://www.dovepress.com/terms.php and incorporate the Creative Commons Attribution - Non Commercial (unported, v3.0) License.
By accessing the work you hereby accept the Terms. Non-commercial uses of the work are permitted without any further permission from Dove Medical Press Limited, provided the work is properly attributed. For permission for commercial use of this work, please see paragraphs 4.2 and 5 of our Terms.