")
Back to Journals » Journal of Hepatocellular Carcinoma » Volume 9
Application of the CT/MRI LI-RADS Treatment Response Algorithm to Contrast-Enhanced Ultrasound: A Feasibility Study
Authors Ruan SM, Cheng MQ, Huang H, Hu HT, Li W, Xie XY, Lu MD, Kuang M , Lin MX, Wang W
Received 21 December 2021
Accepted for publication 9 May 2022
Published 20 May 2022 Volume 2022:9 Pages 437—451
DOI https://doi.org/10.2147/JHC.S353914
Checked for plagiarism Yes
Review by Single anonymous peer review
Peer reviewer comments 4
Editor who approved publication: Prof. Dr. Imam Waked
Si-Min Ruan,1,* Mei-Qing Cheng,1,* Hui Huang,1 Hang-Tong Hu,1 Wei Li,1 Xiao-Yan Xie,1 Ming-De Lu,1,2 Ming Kuang,1,2 Man-Xia Lin,1 Wei Wang1
1Department of Medical Ultrasonics, Institute of Diagnostic and Interventional Ultrasound, The First Affiliated Hospital of Sun Yat-Sen University, Guangzhou, Guangdong, People’s Republic of China; 2Department of Hepatobiliary Surgery, The First Affiliated Hospital of Sun Yat-Sen University, Guangzhou, Guangdong, People’s Republic of China
*These authors contributed equally to this work
Correspondence: Man-Xia Lin; Wei Wang, Department of Medical Ultrasonics, Institute of Diagnostic and Interventional Ultrasound, The First Affiliated Hospital of Sun Yat-Sen University, 58 Zhongshan Road 2, Guangzhou, 510080, People’s Republic of China, Tel/Fax +86-20-87765183, Email [email protected]; [email protected]
Purpose: The contrast-enhanced ultrasound (CEUS) Liver Imaging Reporting and Data System (LI-RADS) treatment response algorithm (TRA) is still in development. The aim of this study was to explore whether the CT/MRI LI-RADS TRA features were applicable to CEUS in evaluating the liver locoregional therapy (LRT) response.
Patients and Methods: This study was a retrospective review of a prospectively maintained database of patients with hepatocellular carcinoma undergoing ablation between July 2017 and December 2018. The standard criteria for a viable lesion were a histopathologically confirmed or typical viable appearance in the follow-up CT/MRI. Performance of the LI-RADS TRA assessing tumor viability was then compared between CEUS and CT/MRI. Inter-reader association was calculated.
Results: A total of 244 patients with 389 treated observations (118 viable) were evaluated. The sensitivity and specificity of the CEUS TRA and CT/MRI LI-RADS TRA viable categories for predicting viable lesions were 55.0% (65/118) versus 56.8% (67/118) (P = 0.480) and 99.3% (269/271) versus 96.3% (261/271) (P = 0.013), respectively. The PPV of CEUS was higher than that of CT/MRI (97.0% vs 87.0%). Subgroup analysis showed that the sensitivity was low in the 1-month assessment for both CEUS (38.1%, 16/42) and CT/MR (47.6%, 20/42) and higher in the 2– 6-month assessment for both CEUS (65.7%, 23/35) and CT/MR (62.9%, 22/35). Interobserver agreements were substantial for both CEUS TRA and CT/MRI LI-RADS TRA (κ, 0.74 for both).
Conclusion: The CT/MRI LI-RADS TRA features were applicable to CEUS TRA for liver locoregional therapy. The CEUS TRA for liver locoregional therapy has sufficiently high specificity and PPV to diagnose the viability of lesions after ablation.
Keywords: contrast-enhanced ultrasound, Liver Imaging Reporting and Data System, treatment response, hepatocellular carcinoma, locoregional therapy
Introduction
Hepatocellular carcinoma (HCC) is an aggressive tumor that is the third leading cause of cancer-related death worldwide, according to GLOBOCAN 2020 data.1 Treatment options for HCC vary according to the stage of HCC at the time of diagnosis. Curative treatments include surgical resection and liver transplant for early HCC. Other treatment options include locoregional therapy (LRT), e.g., thermal ablation, transarterial chemoembolization (TACE), and transarterial radioembolization (TARE), which is either used as a bridge for liver transplant2 or the treatment of advanced disease. With the increasing application of LRT, accurate treatment response assessment is essential for predicting prognosis and determining future management.
Contrast-enhanced ultrasound (CEUS), which offers not only a high sensitivity to contrast agents but also a high temporal resolution,3 is one of the most important and useful modalities for assessing treatment and depicting the local recurrence of HCC.3,4 Previous studies have demonstrated that CEUS for assessing tumor vascularity after both ablation and TACE has the same diagnostic accuracy as contrast-enhanced computerized tomography (CECT), whether for the immediate posttreatment evaluation or the subsequent follow-up.5–12 However, there is no widely used CEUS treatment response algorithm for liver LRTs.
In CT/MRI Liver Imaging Reporting and Data System (LI-RADS) version 201713 and version 2018,14 the treatment response algorithm (TRA) takes the tumor viability after LTR into consideration. Except for using a feature such as the arterial phase hyperenhancement of lesions in the modified Response Evaluation Criteria in Solid Tumors criteria,15 several new features including posttreatment “washout,” treatment-specific expected enhancement, and posttreatment enhancement similar to pretreatment are observed when evaluating the viability of the treated tumor. Furthermore, this new evaluation system focuses on the variable appearances of individual lesions instead of the patient-level response, providing access to the efficiency of each LRT.
Ultrasound contrast agents (UCAs) of CEUS are purely intravascular agents, except Sonazoid, and differ in fundamental aspects from the agents used in contrast-enhanced computerized tomography (CECT)/contrast-enhanced magnetic resonance imaging (CEMRI). However, the dynamic phases of liver enhancement with UCA resemble those of CECT with iodinated agents and CEMRI with gadolinium chelates. The patterns of arterial phase hyperenhancement (APHE) and washout are typical features indicating a viable malignant tumor.16 Therefore, we aimed to explore whether the CT/MRI LI-RADS TRA features apply to CEUS in patients with HCC after ablation, and compared the diagnostic performance and reproducibility between CEUS and CT/MRI.
Materials and Methods
Patients
This was an institutional-review-board-approved, single-center, retrospective analysis of prospectively collected data. Written informed consent was obtained from each patient before performing CEUS. We recruited consecutive patients who underwent ablation for HCC between July 2017 and December 2018. The criteria for clinical diagnosis and histopathological diagnosis of HCC are described in Supplementary Material S1. The inclusion criteria were as follows: (a) patients were >18 years old; (b) both CEUS and CT/MRI were used for pretreatment assessment of the lesions; and (c) both CEUS and CT/MRI were used for posttreatment response assessment. The exclusion criteria were as follows: (a) patients underwent chemotherapy, targeted therapy, or immunotherapy; (b) the time interval between CT/MRI and CEUS was >2 weeks; (c) patients underwent treatment between the interval of CT/MRI and CEUS examination; (d) the follow-up by CT/MRI was conducted less than 1 year after the CEUS examination, (e) low-quality images of CEUS or CT/MRI (Figure 1). The details of data collection are described in Supplementary Material S1.
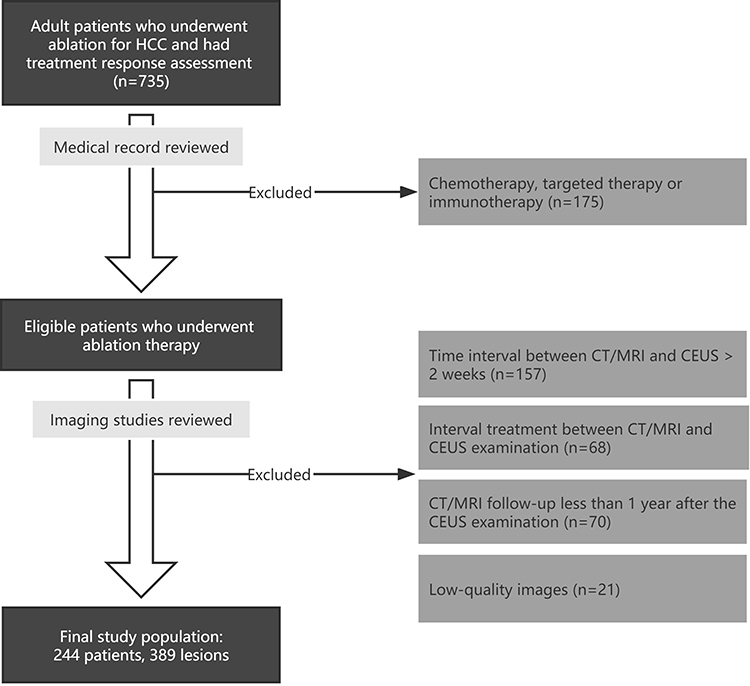 |
Figure 1 Flow diagram of participant enrollment. Abbreviations: HCC, hepatocellular carcinoma; CEUS, contrast-enhanced ultrasound. |
CEUS, CECT, CEMRI Protocols, and Scanning Parameters
CEUS: The ultrasound equipment was as follows: Convex transducers and a Contrast Harmonic Imaging mode were used. A 2.4-mL bolus of SonoVue (Bracco Imaging SpA, Milan, Italy) was injected into the antecubital vein and then received a flush with 5 mL of 0.9% saline solution. The examination needs to be continued for up to 6 min.
CECT: CECT was performed with one of the following equipment: a 64-detector row (Aquilion CXL, Toshiba Medical System, Tokyo, Japan) or 320-detector row CT machine (Aquilion One, Toshiba Medical System, Tokyo, Japan). 1.5 mL/kg of contrast media (Ultravist, Bayer, Germany) was injected into an antecubital vein at a rate of 3.0 mL/s via a pump injector (P3T abdomen module, Medrad Inc.).
CEMRI: MRI examination was performed by using a 3.0-T system (Siemens Healthineers). Gd-EOB-DTPA (Primovist®, 0.1 mL/kg body weight) with a flow rate of 1 mL/s was injected into an antecubital vein.
Imaging protocols and scanning parameters of CEUS, CECT, and CEMRI examination are described in Supplementary Material S1.
Target Lesion Selection
One radiologist (H.H.), with 5 years of experience in hepatic imaging, who was not blinded to clinical information or follow-up findings, identified and annotated treated observations on CEUS videos and CT/MRI scans. For multiple treated observations meeting the inclusion criteria in one patient, the most recently treated lesion based on a medical record review was selected. Each target lesion was annotated on the portal venous phase of the ultrasound, CT, and MR image for further image analysis.
Image Features Definition
Two abdominal radiologists, each with 11 and 10 years of hepatic imaging experience (S.M.R. [reader 1] and M.Q.C. [reader 2], respectively), independently reviewed every patient’s posttreatment imaging studies. A 2-week time interval between reviewing the CEUS and CT/MRI images was applied to avoid a recall bias. Both readers were blinded to clinical information and the follow-up results but allowed to review pretreatment imaging to apply LI-RADS TRA criteria.
As the American College of Radiology CEUS LI-RADS TRA has not been developed, we used the same evaluation criteria as the CT/MRI LI-RADS TRA13,14 in CEUS treatment response evaluation. Treatment response features and categories were as follows: (a) lesions had nodular, mass-like, or irregular thick tissue in or adjacent to the treated lesion with APHE, washout, and/or posttreatment enhancement similar to pretreatment (even in the absence of APHE or washout appearance), categorized as CEUS TRA viable; (b) expected posttreatment lesion hyperenhancement (posttreatment enhancement attributable to treatment-related changes in parenchymal perfusion), no lesional enhancement or no longer visible after treatment, categorized as CEUS TRA nonviable; (c) enhancement atypical for treatment-specific expected enhancement pattern and did not meet criteria for being probably or viable, categorized as CEUS TRA equivocal. In cases of reader uncertainty between two categories, the category indicating lower certainty was chosen for further evaluation. Details of these features and categories are described in Figure 2 and Tables S1 and S2. To resolve the discrepancies between the two readers, images were re-evaluated by another senior radiologist (W.W., with 15 years of experience in hepatic imaging) until a consensus was reached. Besides, the influence of the shadows by gas from the lung or hollow viscera of the lesion was recorded during CEUS imaging assessment.
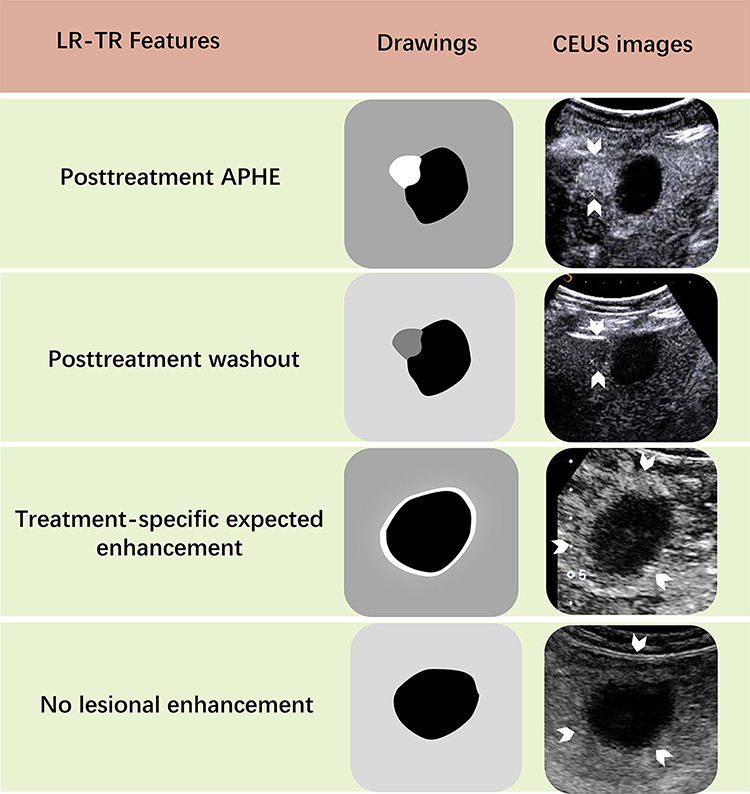 |
Figure 2 The features of CEUS TRA for liver treated lesions. Posttreatment APHE: Nodular, mass-like, or thick, irregular APHE contained within or along the margin of a treated lesion suggests posttreatment tumor viability. Posttreatment washout: Nodular, mass-like or thick, irregular washout appearance within or along the margin of a treated lesion suggests posttreatment tumor viability. Treatment-specific expected enhancement: Expected temporal and spatial pattern of posttreatment enhancement attributable to treatment-related changes in parenchymal perfusion. No lesional enhancement: Absence of enhancement within or along the margin of a treated lesion. The white arrows point to the regions of interest of the treated lesions. Abbreviations: CEUS, contrast-enhanced ultrasound; TRA, treatment response algorithm; APHE, arterial phase hyperenhancement. |
Diagnostic Criteria
A viable lesion was diagnosed if it met any of the following three criteria. First, both the CT and MRI indicated a viable lesion, and the patient was submitted to further treatment. Second, a biopsy or hepatectomy was performed, and the lesion was confirmed to be viable by histopathology. Third, the non-enhancement area or equivocal area became typical of arterial enhancement following subsequent washout, or a 20% increase in the diameters of the equivocal area was observed on the follow-up CT/MRI. The nonviable lesion was diagnosed as no enhancement, or the equivocal area shrunk in the follow-up CT/MRI. The follow-up period was not less than 1 year.
Statistical Analysis
Continuous variables were presented as the mean ± standard deviation or median values and ranges when not normally distributed. Categorical variables were expressed as frequencies and percentages.
Simple and linear-weighted kappa coefficients with 95% confidence intervals were used to evaluate the inter-reader agreement between major features and the category of CT/MRI and CEUS. Kappa results were qualitatively stratified as follows: score κ = 0.81–1.00, (almost) perfect agreement; κ = 0.61–0.80, substantial agreement; κ = 0.41–0.60, moderate agreement; κ = 0.21–0.40, fair agreement; κ ≤ 0.20, slight agreement. The interclass correlation coefficient (ICC) was used to assess variations in size measurements of viable lesions between the two observers. The ICC result used the same stratification as the Kappa value.
The TRA Viable, Equivocal, and Nonviable categories were reduced to binary indicators (TRA Viable compared against TRA Nonviable plus Equivocal and TRA Viable plus Equivocal categories compared against TRA Nonviable, respectively). The sensitivity, specificity, positive predictive value (PPV), and negative predictive value (NPV) of TRA imaging features and categories for detection of a viable tumor were calculated by using the pathology or follow-up as the diagnostic criteria. The McNemar test was used to compare the sensitivity and specificity of the TRA categories and each imaging feature between CEUS and CT/MRI.
Subgroup analyses were performed according to time intervals between ablation and the response assessment and the influence of the shadows by gas from the lung or hollow viscera.
Differences were considered statistically significant if the two-sided P < 0.05. All statistical analyses were performed with MedCalc (version 15.2.2, MedCalc Software).
Results
Patient Characteristics
Among the 735 patients who underwent LRT during the study period, 491 were excluded from the study population. Then, 389 HCCs in 244 patients after ablation (median age, 57 years, ranged: 27–86, 211 men) were finally included in our study. The patients’ demographic characteristics are presented in Table 1. There were 95 (95/244, 38.9%) patients with hepatic cirrhosis and 233 (233/244, 95.5%) patients with Hepatitis B. All the included patients were at high risk of HCC. All the treated lesions were evaluated by CEUS. A total of 18 lesions were evaluated by MRI, and 371 by CT. Among the 389 treated observations, 118 (118/389, 30.3%) lesions were viable, and the remaining 271 (271/389, 69.7%) lesions were nonviable according to the follow-up criteria. Furthermore, 25 viable lesions were proved by pathology. The details of the diagnoses of viable lesions are shown in the Supplementary Material S1.
 |
Table 1 Patient and Lesion Characteristics |
Inter-Reader Agreement
The inter-reader agreement for major features and categories is shown in Table S3. The inter-reader agreement of APHE, washout, and no lesional enhancement was in substantial agreement for CEUS and CT/MRI (κ, CEUS: 0.75, 0.63, 0.74; CT/MRI: 0.72, 0.63, 0.76). The inter-reader agreement for expected posttreatment lesion hyperenhancement and indeterminate enhancement was in moderate agreement for CEUS and CT/MRI (κ, CEUS: 0.55, 0.56; CT/MRI: 0.56, 0.49). For category assignment, the inter-reader agreement between CEUS TRA and CT/MRI LI-RADS TRA was in substantial agreement (κ, 0.74 for both). The ICC results for the sizes of viable lesions between the two observers were 0.91 for CEUS and 0.94 for ICC, which were almost in perfect agreement.
Comparison of Diagnostic Performances of CEUS TRA and CT/MRI LI-RADS TRA for the Treated Liver Lesions
The diagnostic performances of the TRA viable category in the detection of viable tumors are listed in Table 2. The overall sensitivity and specificity in detecting viable tumors were 55.0% (65/118; 95% CI: 45.7, 64.3) and 99.3% (269/271; 95% CI: 97.4, 99.9) with CEUS and 56.8% (67/118; 95% CI: 47.3, 65.9) and 96.3% (261/271; 95% CI: 93.3, 98.2) with CT/MRI when TRA equivocal assessments were treated as nonviable (Figure 3). The specificity of CEUS was significantly higher than that of CT/MRI (P = 0.013). The PPV of CEUS was higher than CT/MRI (97.0% vs 87.0%) (Figure 4), while the NPV was similar (83.5% vs 83.7%). When TRA equivocal assessments were treated as viable, the sensitivity and specificity were 61.0% (72/118; 95% CI: 51.6, 69.9) and 96.7% (262/271; 95% CI: 93.8, 98.5) with CEUS and 65.3% (77/118; 95% CI: 55.9, 73.8) and 94.5% (256/271; 95% CI: 91.0, 96.9) with CT/MRI. The specificity of CEUS was significantly higher than that of CT/MRI (P = 0.041). The sensitivity of both categories was not significantly different between CEUS and CT/MRI (P > 0.05 for both).
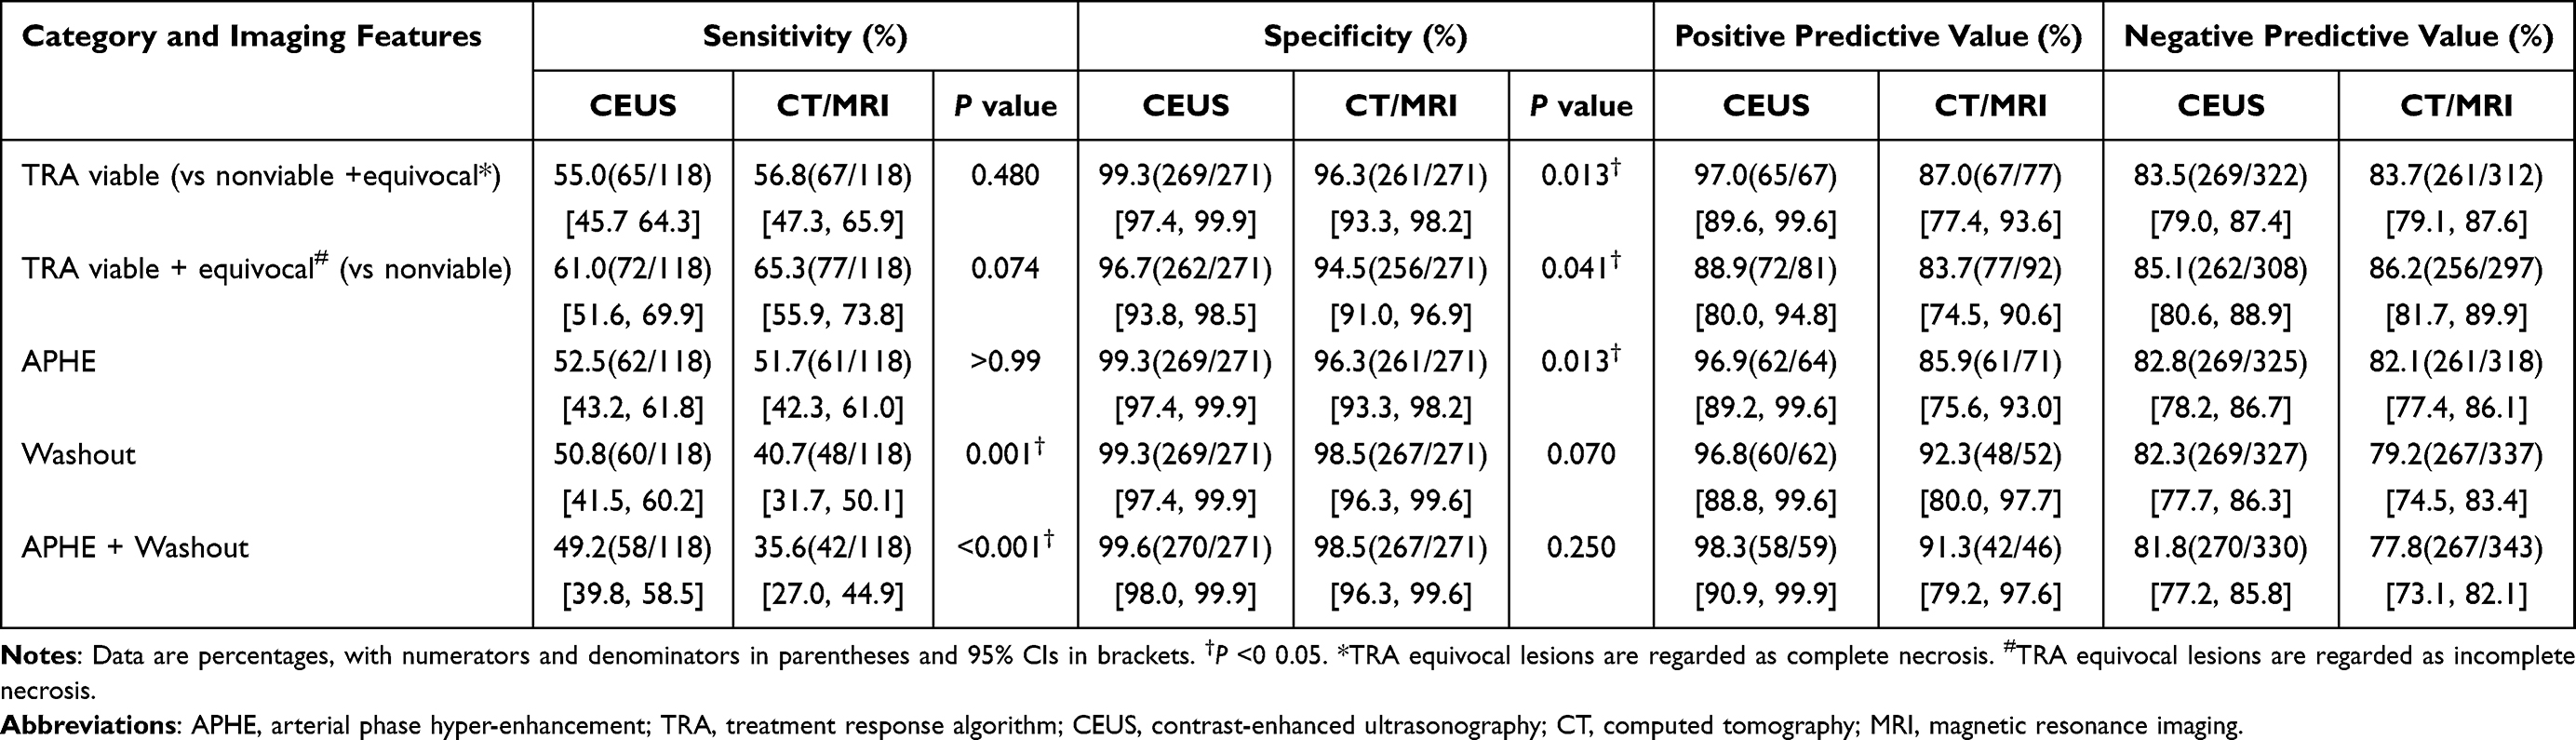 |
Table 2 Diagnostic Performance of Treatment Response Algorithm Category and Imaging Features with CEUS and CT/MRI for Detection of Viable Tumors in Consensus Reading |
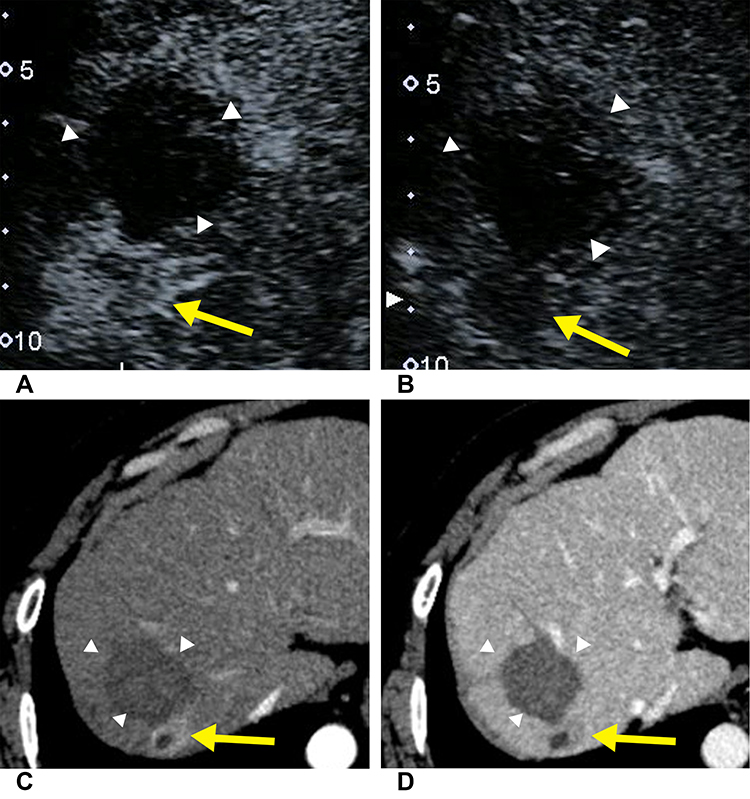 |
Figure 3 Images in a 46-year-old man with hepatocellular carcinoma treated with radiofrequency ablation. The CEUS images show nodular hyperenhancement (yellow arrow) on the arterial phase (A) and nodular washout (yellow arrow) on the late phase (B) beside the treated lesion (white arrowhead). (C and D) On axial CT images, hyperenhancement (yellow arrow) was detected on the arterial phase image (C) and hypoenhancement (yellow arrow) on the portal venous phase (D). According to Imaging Reporting and Data System treatment response algorithm, this treated observation was deemed viable at both CEUS and CT. Biopsy was performed, and the lesion was confirmed to be viable by histopathology. |
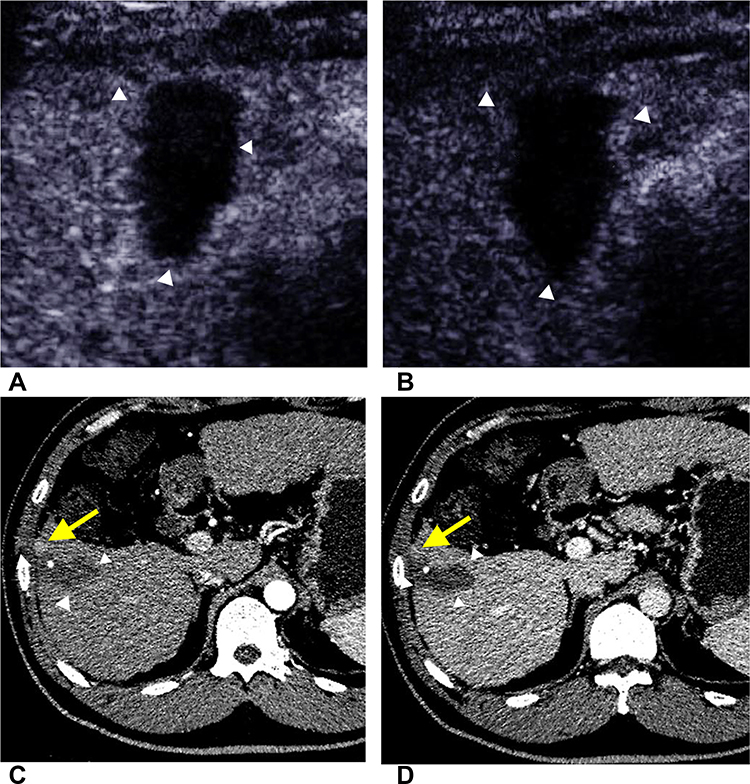 |
Figure 4 Images in a 48-year-old man with HCC treated with radiofrequency ablation. The CEUS images of both arterial phase (A) and late phase (B) show no lesional enhancement of the treated lesion (white arrowhead). (C and D) On axial CT images, hyperenhancement (yellow arrow) was detected on the arterial phase image (C), and the hyperenhancement area subsequently became isoenhancement (yellow arrow) on the portal venous phase (D). According to Imaging Reporting and Data System treatment response algorithm, this treated observation was deemed nonviable at CEUS and viable at CT. After 1-year follow-up, the hyperenhancement area of CT shrunk, indicating the nonviability of this treated lesion. |
The diagnostic performance of TRA imaging features is also presented in Table 2. The sensitivity of washout and combining APHE and washout in detecting viable tumors was significantly higher for CEUS than for CT/MRI scans (P = 0.001, P < 0.001), whereas the specificity of APHE was significantly higher for CEUS than CT/MRI (P = 0.013).
There are 46 viable observations classified as CEUS TRA nonviable lesions. Forty-five of these lesions were no lesional enhancement, and one lesion was with treatment-specific expected enhancement pattern in CEUS. The CT/MRI contrast-enhanced patterns of these lesions were as follows: 32 lesions had no lesional enhancement, three lesions had indeterminate enhancement, nine lesions had arterial phase hyperenhancement without subsequent washout and two lesions had arterial phase hyperenhancement following subsequent washout.
By consensus, 14 (14/389, 3.6%) of 389 lesions were categorized as TRA equivocal by using CEUS, and 50% of these (7/14) were viable based on follow-up results. Of the seven viable lesions categorized as CEUS TRA equivocal, three lesions displayed nodular or mass-like tissue with three-phase isoenhancement, and two lesions showed rim hyperenhancement with irregular thickness. As for CT/MRI, 15 (15/389, 3.9%) of 389 lesions were categorized as LI-RADS TRA equivocal, and 66.7% of these (10/15) were viable. According to our results, we initially proposed a CEUS TRA and its follow-up strategy. The algorithm is shown in Figure 5.
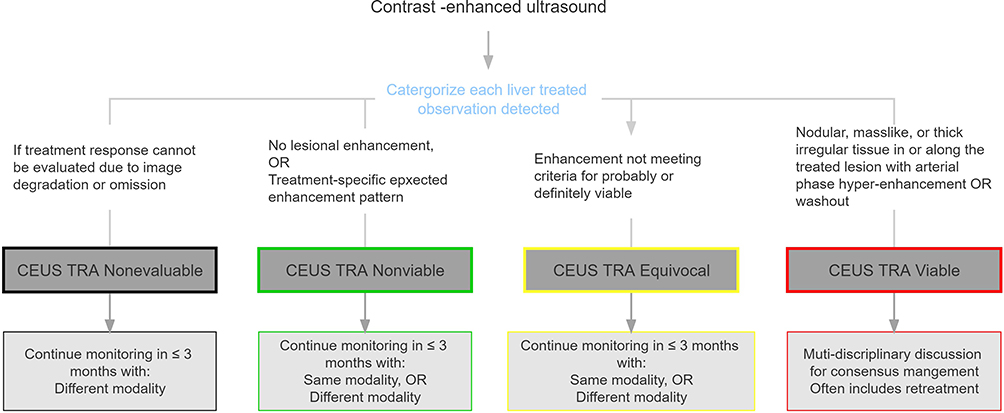 |
Figure 5 The algorithm of CEUS treatment response algorithm for liver treated lesions and its follow-up strategy. Abbreviations: CEUS, contrast-enhanced ultrasound; TRA, treatment response algorithm. |
Subgroup Analysis of the Impact of the Monitor Timing on the Performance of CEUS TRA and the CT/MRI LI-RADS TRA for the Liver-Treated Lesion
According to the time interval between ablation therapy and response evaluation, the lesions assessed within 1 month, 2–6 months, and more than 6 months were 157 (157/389, 40.3%), 80 (80/389, 20.6%), and 152 (152/389, 39.1%), respectively. The performance of viable lesion detection is shown in Table 3. The sensitivity of 1 month, 2–6 months and more than 6 months were 38.1% (16/42, 95% CI 23.6, 54.4), 65.7% (23/35, 95 CI% 47.5, 80.9), 63.4% (26/41, 95 CI% 46.9, 77.9) for CEUS, respectively. The sensitivity was not significantly different between CEUS and CT/MRI in different monitor timings (P > 0.05 for all). Both CEUS TRA and CT/MRI LI-RADS TRA showed low sensitivity in the 1-month treatment response evaluation. The specificity of CEUS and CT/MR also showed no significant difference. When TRA equivocal assessments were treated as viable, the performance of CEUS and CT/MRI is presented in Table S4.
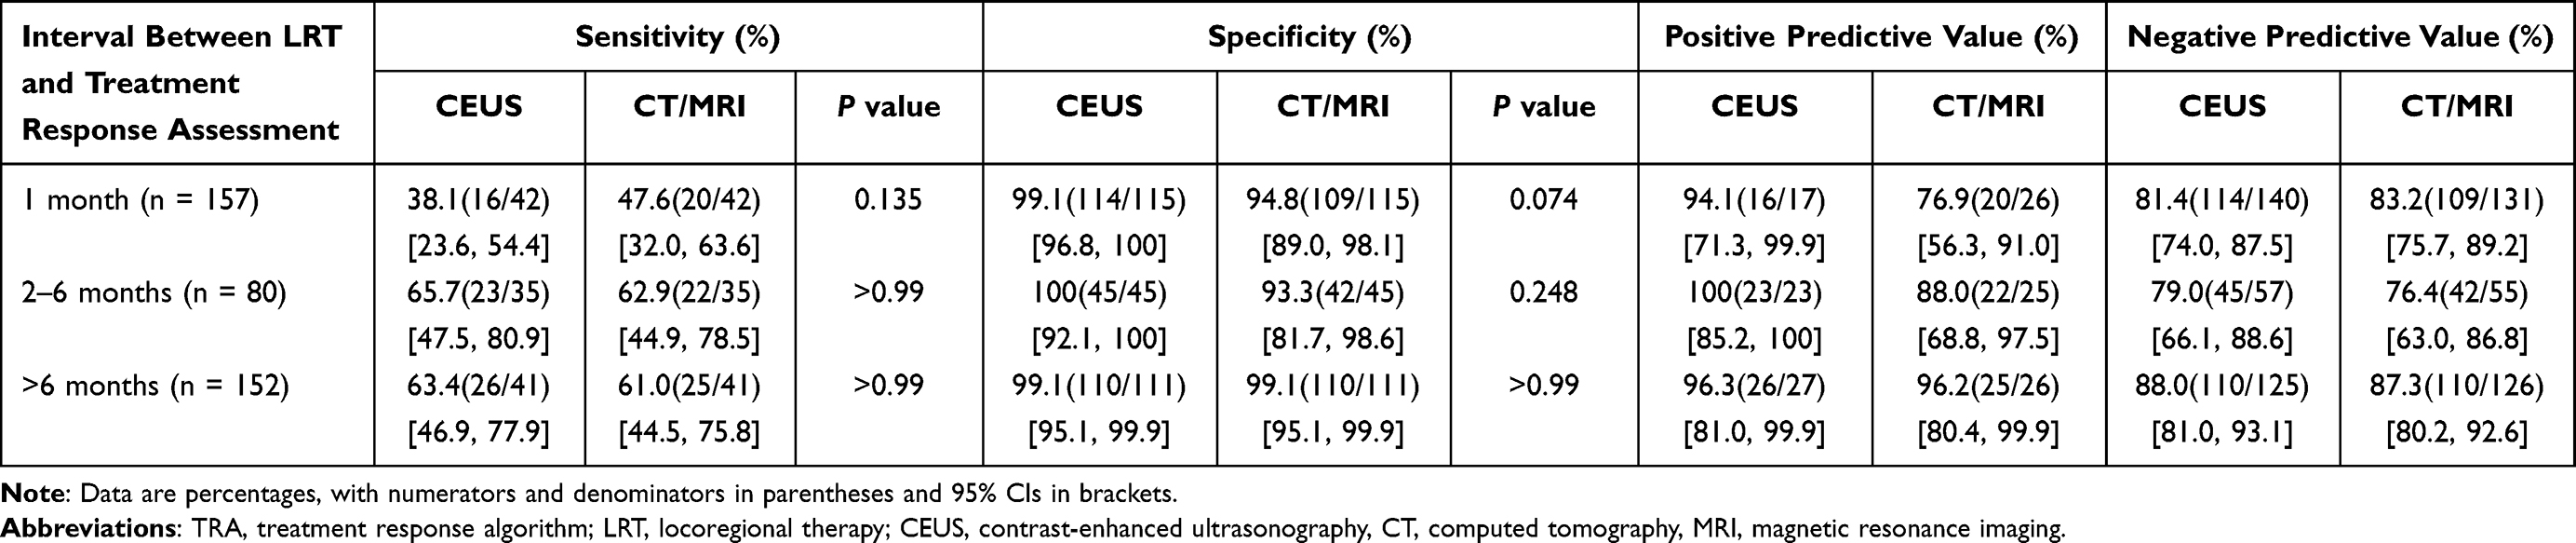 |
Table 3 Subgroup Analysis of the Impact of the Monitor Timing on the Performance of the Treatment Response Algorithm of CEUS and CT/MRI |
Subgroup Analysis of the Influence of the Gas Shadows on the Performance of CEUS TRA for the Liver-Treated Lesion
During the ultrasound examination, 75 (75/389, 19.3%) lesions were affected by the lung and intestinal gas shadows, and 314 (314/389, 80.7%) lesions were not affected. In the shadow-affected group, the sensitivity of CEUS was 33.3% (7/21, 95% CI 14.6, 57.0), which was significantly lower than that of CT/MRI (61.9%, 13/21, 95% CI 38.4, 81.9, P = 0.041) (Table 4), and there were no significant differences in the specificity (P > 0.99). In the non-shadow-affected group, the sensitivity of CEUS and CT/MRI was without significant difference (P = 0.134). The specificity of CEUS was 99.5% (216/217, 95% CI 97.4, 99.9), which was significantly higher than that of CT/MRI (P = 0.023). When TRA equivocal assessments were treated as viable, the performance of CEUS and CT/MRI is presented in Table S5.
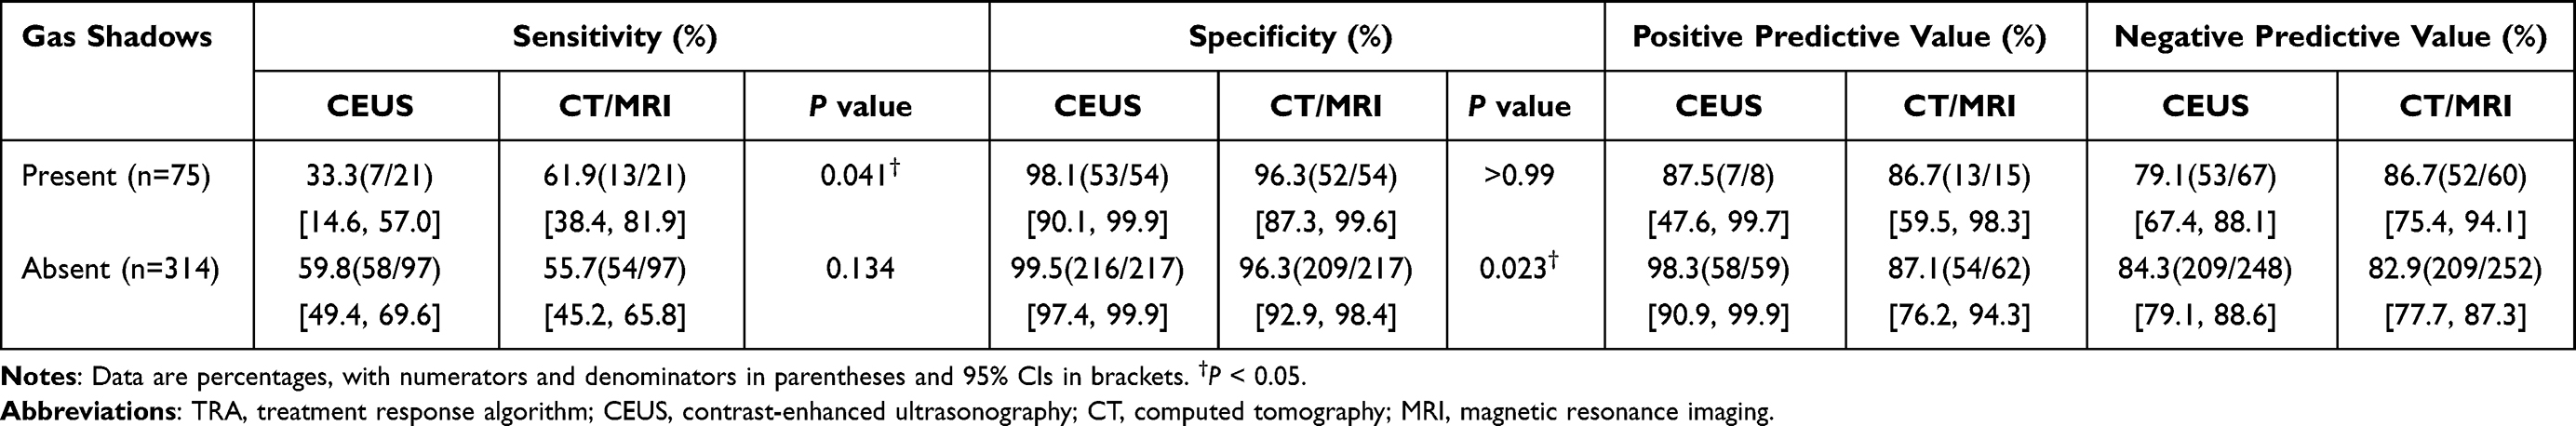 |
Table 4 Subgroup Analysis of the Impact of the Lung and Intestinal Gas Shadows on the Performance of the Treatment Response Algorithm of CEUS and CT/MRI |
Discussion
Our study first explored whether the CT/MRI LI-RADS TRA features were feasible for CEUS treatment response evaluation. This study may provide some data support for the development of ACR CEUS LI-RADS TRA. The results demonstrated the sufficiently high specificity and PPV of the CEUS TRA viable category to make a diagnosis of a viable lesion. However, the sensitivity needs to be improved by further adjusting the CEUS treatment response algorithm for the liver lesions. As for the follow-up strategy, a second assessment within 6 months after the 1-month assessment may effectively improve the sensitivity of both CEUS and the CT/MRI treatment response algorithm.
The LI-RADS was introduced to standardize the assessment of HCC and facilitate therapeutic decision-making since its release in 2011. Although CT and MRI are regarded as the reference standards in TRA, CEUS is gaining increasing attention owing to its advantages, such as real-time scanning, easy performance, lack of radiation, wide availability, and lack of allergic reactions.17 Previous studies have indicated that CEUS is comparable to CT/MRI in evaluating percutaneous ablation treatment10,18–20 and TACE.21,22 However, CEUS may have different imaging features compared with CT/MRI owing to the different contrast mediums. Whether the CT/MRI LI-RADS TRA categories and features are suitable for CEUS has not been explored yet. Our results first show that the specificity of CEUS viable TRA (99.3%) was significantly higher than that of CT/MRI viable LI-RADS-TRA (96.3%, P = 0.013). The specificity of CT/MRI LI-RADS TRA viable in our results was consistent with that of previous research, which ranged from 85% to 98%.23–27 The PPV of CEUS TRA was also higher than that for CT/MRI viable (97.0% for CEUS, 87.0% for CT/MRI, respectively), which indicated that sufficiently high PPV of CEUS can almost confirm the diagnosis of viable lesions.
However, the sensitivity of CEUS TRA viable for predicting viable lesions was not high (55.0%), comparable to that of CT/MRI LI-RADS TRA viable (56.8%), without significant difference (P = 0.480). The sensitivity in several previous studies ranged from 30% to 77% for CT/MRI LI-RADS TRA viable.26–29 The diversity is mainly from the difference in the inter-reader agreement,24,27 the modality of the imaging assessment (MRI had higher sensitivity compared with CT),23,26 and types of LRT (ablation had lower sensitivity compared with TACE).26,29 Our study showed that the sensitivity of the washout of CEUS (50.8%) was significantly higher than that of CT/MRI (P = 0.001). The washout phenomenon characterizes malignancies regardless of their enhancement pattern in the CEUS arterial phase.15 CEUS permits real-time imaging and prolongs observation to 6 minutes, avoiding missing the lesion with a late washout onset. Besides, the contrast agent of CEUS is an intravascular agent, which can avoid contrast material diffusing into the tumor interstitium, and may conceal washout.30
In this study, we initially proposed a CEUS TRA for liver-treated lesions and its follow-up strategy according to the CT/MRI LI-RADS TRA. Patients with CEUS TRA viable lesions need to undergo retreatment given the high PPV of CEUS. As for CEUS TRA equivocal, lesions showing nodular or mass-like tissue with three-phase isoenhancement and rim hyperenhancement with irregular thickness may be viable. Therefore, we recommend continuing monitoring in 1 month or multi-disciplinary discussion for a tailored workup. The proposed CEUS TRA for liver-treated lesions may provide a risk stratification for the management of treated observations, but it needs further prospective and multi-center studies to verify its feasibility. As there is no clear definition of the time interval of posttreatment in CT/MRI LI-RADS TRA, finding a proper time interval to validate the performance of treatment response evaluation is essential in clinical practice. Our study showed that when the assessment was conducted 1 month after treatment, the sensitivity was low for both CEUS (38.1%, 16/42) and CT/MRI (47.6%, 20/42). The reason may be twofold. First, reactive hyperemia caused by the inflammatory reaction occurs after ablation. This treatment-specific expected enhancement pattern may cover up the hyperenhancement area from residual tumor tissue. Second, the area of residual tissue may be too small to be detected for a 1-month assessment. Therefore, we propose that a second assessment within 6 months is needed after the 1-month assessment for both CEUS and CT/MRI. Lesions located near the liver dome and obscuration due to gas from the lung or hollow viscera can affect the ultrasound image quality.31 This is one of the shortcomings of ultrasound that is hard to overcome. Our results show that the sensitivity of CEUS was significantly lower than that of CT/MRI when lesions were influenced by shadowing (33.3% for CEUS, 61.9% for CT/MRI, P = 0.041, respectively). CT/MRI scan is recommended for such lesions.
Inter-reader agreement is essential for the use of standardized reporting systems. We observed substantial inter-reader agreement for TRA categories of CEUS (κ = 0.74) and CT/MRI (κ = 0.74). However, treatment-specific expected enhancement and indeterminate enhancement had moderate agreement. Besides, the feature of “enhancement similar to pretreatment” was not calculated because of a small sample size. These three features should be considered to simplify or clarify the definition to improve inter-reader association. In our result, CEUS showed a lower reproducibility in its measurement compared with CT/MRI, but the ICC was up to 0.91 for CEUS, which can ensure the accuracy for clinical application.
Our study had several limitations. First, not all treated lesions had a pathological standard to validate the efficacy of the treatment response algorithm in this study. In addition, the imaging was less accurate than pathology in confirming the necrosis of a tumor. Therefore, more than 1-year follow-up after the treatment response evaluation was collected in our study. The time interval might allow the microscopic foci of the residual tumor to grow large enough for imaging depiction. Second, almost all patients were imaged with CT but few with MRI which may have a higher sensitivity to TRA.26 It would be clinically significant to have a pairwise comparison of CEUS, CT, and MRI. Third, our study population included only patients with a history of ablation. Future investigations will be needed for a more detailed assessment of the performance of the TRA after various types of LRT.
Conclusion
In this study, we found that the response categories of the CT/MRI Liver Imaging Reporting and Data System treatment response algorithm (LI-RADS TRA) were applicable to CEUS. The CEUS TRA for liver-treated lesions had high specificity and PPV to diagnose the viability of lesions after ablation.
Abbreviations
APHE, arterial phase hyperenhancement; CI, confidence interval; HCC, hepatocellular carcinoma; CEUS, contrast-enhanced ultrasound; CT, computerized tomography; MRI, magnetic resonance imaging; CECT, contrast-enhanced computerized tomography; CEMRI, contrast-enhanced magnetic resonance imaging; LI-RADS, Liver Imaging Reporting and Data System; TRA, treatment response algorithm; ICC, interclass correlation coefficient; PPV, positive predictive value; NPV, negative predictive value.
Data Sharing Statement
The data used and/or analyzed are available from the corresponding author on reasonable request.
Ethics Approval and Informed Consent
This article does not contain any studies with animals performed by any of the authors. This study was approved by the ethics committees of the First Affiliated Hospital of Sun Yat-sen University and fully complied with the Declaration of Helsinki and the Guideline for Good Clinical Practice; informed consent was obtained from patients who participated in the study. Registration number: ChiCTR-DDD-16010089.
Consent for Publication
Informed consent for publication was obtained from all authors.
Acknowledgments
We thank all the patients for their participation in this study.
Author Contributions
All authors made a significant contribution to the study conception, design, execution, data acquisition, analysis, and interpretation. The first draft of the manuscript was written by Si-Min Ruan and Mei-Qing Cheng, and all authors substantially revised or critically reviewed the article. All authors approved the final manuscript and agreed on the journal to which the article would be submitted. All authors reviewed and agreed on all versions of the article before submission, the final version accepted for publication during revision, and any significant changes introduced in the proofing stage. All authors agreed to take responsibility and be accountable for the contents of the article.
Funding
This study was supported by the National Nature Science Foundation of China (NO: 81971630, NO: 82171960, and NO: 82102078), the Guangdong Natural Science Foundation (NO: 2021B1515020054), and Guangzhou Science and Technology Project (NO: 201904010187).
Disclosure
The authors have no relevant financial or non-financial interests to disclose in this work.
References
1. Sung H, Ferlay J, Siegel RL, et al. Global cancer statistics 2020: GLOBOCAN estimates of incidence and mortality worldwide for 36 cancers in 185 countries. CA Cancer J Clin. 2021;71(3):209–249. doi:10.3322/caac.21660
2. Cescon M, Cucchetti A, Ravaioli M, Pinna AD. Hepatocellular carcinoma locoregional therapies for patients in the waiting list. Impact on transplantability and recurrence rate. J Hepatol. 2013;58(3):609–618. doi:10.1016/j.jhep.2012.09.021
3. Eisenbrey JR, Gabriel H, Savsani E, Lyshchik A. Contrast-enhanced ultrasound (CEUS) in HCC diagnosis and assessment of tumor response to locoregional therapies. Abdom Radiol. 2021;46(8):3579–3595. doi:10.1007/s00261-021-03059-y
4. Maruyama H, Sekimoto T, Yokosuka O. Role of contrast-enhanced ultrasonography with Sonazoid for hepatocellular carcinoma: evidence from a 10-year experience. J Gastroenterol. 2016;51(5):421–433. doi:10.1007/s00535-015-1151-3
5. Ainora ME, Iezzi R, Ponziani FR, et al. Contrast-enhanced ultrasound in the short-term evaluation of hepatocellular carcinoma after locoregional treatment. Dig Dis. 2020;38(6):522–533. doi:10.1159/000506455
6. Andreana L, Kudo M, Hatanaka K, et al. Contrast-enhanced ultrasound techniques for guiding and assessing response to locoregional treatments for hepatocellular carcinoma. Oncology. 2010;78(Suppl 1):68–77. doi:10.1159/000315233
7. Bartolotta TV, Taibbi A, Midiri M, De Maria M. Hepatocellular cancer response to radiofrequency tumor ablation: contrast-enhanced ultrasound. Abdom Imaging. 2008;33(5):501–511. doi:10.1007/s00261-007-9294-1
8. Inoue T, Kudo M, Hatanaka K, et al. Usefulness of contrast-enhanced ultrasonography to evaluate the post-treatment responses of radiofrequency ablation for hepatocellular carcinoma: comparison with dynamic CT. Oncology. 2013;84(Suppl 1):51–57. doi:10.1159/000345890
9. Kim CK, Choi D, Lim HK, et al. Therapeutic response assessment of percutaneous radiofrequency ablation for hepatocellular carcinoma: utility of contrast-enhanced agent detection imaging. Eur J Radiol. 2005;56(1):66–73. doi:10.1016/j.ejrad.2005.03.023
10. Lu MD, Yu XL, Li AH, et al. Comparison of contrast enhanced ultrasound and contrast enhanced CT or MRI in monitoring percutaneous thermal ablation procedure in patients with hepatocellular carcinoma: a multi-center study in China. Ultrasound Med Biol. 2007;33(11):1736–1749. doi:10.1016/j.ultrasmedbio.2007.05.004
11. Moschouris H, Malagari K, Papadaki MG, Kornezos I, Matsaidonis D. Contrast-enhanced ultrasonography of hepatocellular carcinoma after chemoembolisation using drug-eluting beads: a pilot study focused on sustained tumor necrosis. Cardiovasc Intervent Radiol. 2010;33(5):1022–1027. doi:10.1007/s00270-010-9800-7
12. Shaw CM, Eisenbrey JR, Lyshchik A, et al. Contrast-enhanced ultrasound evaluation of residual blood flow to hepatocellular carcinoma after treatment with transarterial chemoembolization using drug-eluting beads: a prospective study. J Ultrasound Med. 2015;34(5):859–867. doi:10.7863/ultra.34.5.859
13. American College of Radiology. Liver imaging reporting and data system version; 2017. Available from: https://www.acr.org/Clinical-Resources/Reporting-and-DataSystems/LI-RADS/CT-MRI-LI-RADS-v2017.
14. American College of Radiology. Liver imaging reporting and data system version 2018 manual; 2018. Available from: https://www.acr.org/-/media/ACR/Files/Clinical-Resources/LIRADS/LI-RADS-2018-Manual-5Dec18.pdf?la=en.
15. Lencioni R, Llovet JM. Modified RECIST (mRECIST) assessment for hepatocellular carcinoma. Semin Liver Dis. 2010;30(1):52–60. doi:10.1055/s-0030-1247132
16. Dietrich CF, Nolsoe CP, Barr RG, et al. Guidelines and good clinical practice recommendations for Contrast Enhanced Ultrasound (CEUS) in the liver - update 2020 - WFUMB in cooperation with EFSUMB, AFSUMB, AIUM, and FLAUS. Ultraschall Med. 2020;41(5):562–585. doi:10.1055/a-1177-0530
17. Liu LN, Xu HX, Zhang YF, Xu JM. Hepatocellular carcinoma after ablation: the imaging follow-up scheme. World J Gastroenterol. 2013;19(6):797–801. doi:10.3748/wjg.v19.i6.797
18. Frieser M, Kiesel J, Lindner A, et al. Efficacy of contrast-enhanced US versus CT or MRI for the therapeutic control of percutaneous radiofrequency ablation in the case of hepatic malignancies. Ultraschall Med. 2011;32(2):148–153. doi:10.1055/s-0029-1245934
19. Salvaggio G, Campisi A, Lo Greco V, Cannella I, Meloni MF, Caruso G. Evaluation of posttreatment response of hepatocellular carcinoma: comparison of ultrasonography with second-generation ultrasound contrast agent and multidetector CT. Abdom Imaging. 2010;35(4):447–453. doi:10.1007/s00261-009-9551-6
20. Ricci P, Cantisani V, Drudi F, et al. Is contrast-enhanced US alternative to spiral CT in the assessment of treatment outcome of radiofrequency ablation in hepatocellular carcinoma? Ultraschall Med. 2009;30(3):252–258. doi:10.1055/s-2008-1027727
21. Watanabe Y, Ogawa M, Kumagawa M, et al. Utility of contrast-enhanced ultrasound for early therapeutic evaluation of hepatocellular carcinoma after transcatheter arterial chemoembolization. J Ultrasound Med. 2020;39(3):431–440. doi:10.1002/jum.15118
22. Oezdemir I, Wessner CE, Shaw C, Eisenbrey JR, Hoyt K. Tumor vascular networks depicted in contrast-enhanced ultrasound images as a predictor for transarterial chemoembolization treatment response. Ultrasound Med Biol. 2020;46(9):2276–2286. doi:10.1016/j.ultrasmedbio.2020.05.010
23. Bae JS, Lee JM, Yoon JH, et al. Evaluation of LI-RADS version 2018 treatment response algorithm for hepatocellular carcinoma in liver transplant candidates: intraindividual comparison between CT and hepatobiliary agent-enhanced MRI. Radiology. 2021;299:203537.
24. Kim SW, Joo I, Kim HC, et al. LI-RADS treatment response categorization on gadoxetic acid-enhanced MRI: diagnostic performance compared to mRECIST and added value of ancillary features. Eur Radiol. 2020;30(5):2861–2870. doi:10.1007/s00330-019-06623-9
25. Park S, Joo I, Lee DH, et al. Diagnostic performance of LI-RADS treatment response algorithm for hepatocellular carcinoma: adding ancillary features to MRI compared with enhancement patterns at CT and MRI. Radiology. 2020;296(3):554–561. doi:10.1148/radiol.2020192797
26. Seo N, Kim MS, Park MS, et al. Evaluation of treatment response in hepatocellular carcinoma in the explanted liver with liver imaging reporting and data system version 2017. Eur Radiol. 2020;30(1):261–271. doi:10.1007/s00330-019-06376-5
27. Chaudhry M, McGinty KA, Mervak B, et al. The LI-RADS version 2018 MRI treatment response algorithm: evaluation of ablated hepatocellular carcinoma. Radiology. 2020;294(2):320–326. doi:10.1148/radiol.2019191581
28. Shropshire EL, Chaudhry M, Miller CM, et al. LI-RADS treatment response algorithm: performance and diagnostic accuracy. Radiology. 2019;292(1):226–234. doi:10.1148/radiol.2019182135
29. Cools KS, Moon AM, Burke LMB, McGinty KA, Strassle PD, Gerber DA. Validation of the liver imaging reporting and data system treatment response criteria after thermal ablation for hepatocellular carcinoma. Liver Transplant. 2020;26(2):203–214. doi:10.1002/lt.25673
30. Wilson SR, Kim TK, Jang HJ, Burns PN. Enhancement patterns of focal liver masses: discordance between contrast-enhanced sonography and contrast-enhanced CT and MRI. Am J Roentgenol. 2007;189(1):W7–W12. doi:10.2214/AJR.06.1060
31. Zheng SG, Xu HX, Lu MD, et al. Role of contrast-enhanced ultrasound in follow-up assessment after ablation for hepatocellular carcinoma. World J Gastroenterol. 2013;19(6):855–865. doi:10.3748/wjg.v19.i6.855
 © 2022 The Author(s). This work is published and licensed by Dove Medical Press Limited. The full terms of this license are available at https://www.dovepress.com/terms.php and incorporate the Creative Commons Attribution - Non Commercial (unported, v3.0) License.
By accessing the work you hereby accept the Terms. Non-commercial uses of the work are permitted without any further permission from Dove Medical Press Limited, provided the work is properly attributed. For permission for commercial use of this work, please see paragraphs 4.2 and 5 of our Terms.
© 2022 The Author(s). This work is published and licensed by Dove Medical Press Limited. The full terms of this license are available at https://www.dovepress.com/terms.php and incorporate the Creative Commons Attribution - Non Commercial (unported, v3.0) License.
By accessing the work you hereby accept the Terms. Non-commercial uses of the work are permitted without any further permission from Dove Medical Press Limited, provided the work is properly attributed. For permission for commercial use of this work, please see paragraphs 4.2 and 5 of our Terms.