")
Back to Journals » Adolescent Health, Medicine and Therapeutics » Volume 11
Application of Rasch Analysis for Development and Psychometric Properties of Adolescents’ Quality of Life Instruments: A Systematic Review
Authors Dabaghi S , Esmaielzadeh F, Rohani C
Received 31 May 2020
Accepted for publication 20 October 2020
Published 11 November 2020 Volume 2020:11 Pages 173—197
DOI https://doi.org/10.2147/AHMT.S265413
Checked for plagiarism Yes
Review by Single anonymous peer review
Peer reviewer comments 3
Editor who approved publication: Professor Alastair Sutcliffe
Sahar Dabaghi,1 Fatemeh Esmaielzadeh,1 Camelia Rohani2,3
1Student Research Committee, School of Nursing & Midwifery, Shahid Beheshti University of Medical Sciences, Tehran, Iran; 2Community Health Nursing Department, School of Nursing & Midwifery, Shahid Beheshti University of Medical Sciences, Tehran, Iran; 3Ersta Sköndal Bräcke University College, Campus Ersta, Stockholm SE-100 61, Sweden
Correspondence: Camelia Rohani
Ersta Sköndal Bräcke University College, Campus Ersta, Stigbergsgatan 30, Box 11189, Stockholm SE-100 61, Sweden
Tel +46-766289637
Email [email protected]
Background: Due to the importance of assessing quality of life (QoL) in healthy and ill adolescents, the evaluation of psychometric properties of these questionnaires is important.
Objective: To investigate the application of Rasch analysis in psychometric assessment studies on adolescents’ QoL instruments, and to evaluate the quality of reporting Rasch parameters in these studies.
Methods: This systematic review was conducted by searching for papers in electronic databases PubMed, Web of Science, EMBASE, Cochrane Library and Scopus until December 2018.
Results: After screening 122 papers, 31 remained in the study. Around 68% of the studies used the Rasch analysis for instrument testing and 32% for the development of new instruments. In 77.4% of studies, both classical and Rasch methods were used parallel to data analysis. In 32.2% of studies, healthy adolescents were the main target group. The most commonly used instrument in Rasch studies was, KIDSCREEN, administered in different countries. Six Rasch parameters were reported with a higher percentage in the studies. Major reported parameters of Rasch analysis were application of the software program (96.7%), test of item fit to the Rasch model (93.5%), unidimensionality (80.6%), type of the identified mathematical Rasch model (74.1%), threshold (58%) and differential item functioning (54.8%). Based on the psychometric evaluation of the QoL instruments, 71% of studies showed acceptable results.
Conclusion: The application of the Rasch model for psychometric assessment of adolescents’ QoL questionnaires has increased in recent decades. But, there is still no strong and commonly used critical appraisal tool or guideline for the evaluation of these papers.
Keywords: adolescence, instrument, psychometric, quality of life, Rasch analysis, systematic review
Introduction
One of the concerns of healthcare providers is adolescents and children’s quality of life (QoL).1 Adolescence, is a transitional phase between the childhood and adulthood period. The World Health Organization (WHO) defines it as a life period between ages 10 to 19.2 This range is overlapping with the definition of the WHO for young people between 10 to 24.2 Substance abuse, injuries, obesity, chronic diseases, mental health problems, sexual and reproductive health disorders are important issues during the adolescence period.3,4 To assess physical, social and mental health as well as evaluating population-based intervention programs, outcome variables like QoL and health-related quality of life (HRQoL) are measured among adolescents and children.5 Thus, the assessment of QoL among adolescents and children is important to identify individuals with poor QoL condition and to plan intervention strategies.6 One important part of an individual’s general well-being is defined as QoL.7 As described by the WHO, QoL is an individuals’ understanding of their situations in life within the context of the culture and value systems in which they live, in relation to their goals, expectations, standards, and attitudes.8 However, HRQoL contains at least physical, psychological and social functioning aspects in the context of a disease.9 Despite various definitions for QoL and HRQoL, the researchers agree on three important features, consisting of multidimensionality, subjectivity, and dynamicity of these concepts.10
Since, the 1970s, after efforts to improve QoL, the number of instruments has increased exponentially, some of which are made for adolescents.11 In clinical and non-clinical settings, the use of QoL measurement tools can provide valuable information for the best possible individual care and evaluation of interventions.12 Considering the importance of measuring the QoL of adolescents, it is valuable to use valid and reliable questionnaires. The necessity and importance of providing sufficient information about validity and reliability of the questionnaires have been mentioned in previous studies.13,14 Thus, evaluation of the psychometric properties of these questionnaires is essential.15 To this end, various tools have been designed and are available as generic and specific-disease tools to measure QoL.16
Although, evaluation of psychometric properties of instruments is mostly done by Classical Test Theory (CTT) methods, researchers’ attention has increased towards application of more complicated models. Also, numerous researchers have recommended, that new theories should replace the classical theories in various disciplines. The Rasch model is one of the most practical and common approaches used for this purpose.17 The Rasch analysis, based on the Item Response Theory (IRT), is used for evaluation of the psychometric properties of measurement tools, and is more complex than the classical methods. Relevant findings show that this complexity is superior to the classical methods because more accurate results are obtained. There are some problems regarding the use of classical methods in which raw scores, linear combinations of these scores and responses that have ordinal scale, essentially are considered as interval-scale data. Modern analysis offers solutions to these problems. Rasch analysis is a statistical technique that can be used to convert ordinal data into interval data in questions with two or more options to answer.18
QoL Questionnaires with several subscales can be evaluated by Rasch models.19 In these models, it is assumed that, all the questions and materials of a test measuring a construct constitute a sort of ordered relationship. The second assumption in these models is that a correct answer to one question does not influence the other questions.17
Evidence shows that the number of QoL instruments is increasing, some of them specific for adolescents. Due to the importance of assessing QoL in healthy and ill adolescents, the evaluation of psychometric properties of these instruments is important.17 Thus, a systematic review was conducted on studies that investigated psychometric properties of adolescents’ QoL Instruments by Rasch analysis. The following research questions were also put forth in this review:
How is the application of Rasch analysis in psychometric assessment studies on adolescents’ QoL Instruments?
How is the quality of reporting Rasch parameters in selected studies?
Methods
The present study was carried out based on the Preferred Reporting Items for Systematic Reviews and Meta-Analyses (PRISMA) 2009. PRISMA Statement is a critical appraisal tool and helps authors improve the reporting of systematic review and meta-analysis studies’ results.20 Selected studies included all papers reporting psychometric properties of QoL instruments in adolescents by the Rasch method. A systematic search was done by two authors independently using five electronic databases; PubMed, Web of Science, EMBASE, Cochrane Library and Scopus, with no time limit until December 2018 (Table 1). A number of key terms with the assistance of Boolean expressions (AND, OR, NOT) were assessed in the title and abstract of the identified papers. Key terms included “Quality of Life” OR “Life Quality” OR “Health-Related” OR “Health-Related Quality Of Life” OR “HRQOL” AND “Rasch analysis” OR “Rasch analyses“ OR “Rasch measurement” OR “Rasch measurement model” OR “Rasch model” OR “Rasch modeling” OR “Rasch rating scale analysis” OR “Rasch rating scale model” AND “Adolescent” OR “Teenager” OR “Teen” OR “Stripling”. The inclusion criteria for study selection were all papers published in a scientific journal in the English language, they used Rasch analysis to evaluate psychometric properties of adolescents̕ QoL instruments, and there was access to the full text of the paper. Exclusion criteria included non-English language papers, adult target population, and review papers. After removing duplicates in the first screening phase, two authors independently reviewed titles and abstracts of the studies. Papers containing the full text, were included in the review and were screened separately by two authors. In cases of disagreement between the two authors, the papers were reviewed by the third author. Two tables were designed in the research team to collect the data from different papers. The following data were extracted from all studies: author’s name, year of publication, country, aim of the study, study type, measurement instrument, item numbers, rating scales, measurement construct, sample and age, data collection procedure, study results, type of software, type of Rasch parameters, validity (Classical and Rasch methods), reliability (Classical and Rasch methods), and mixed results of both Rasch and Classical methods. Three authors individually evaluated the Rasch parameters using a Quality Identifiers (QI) checklist. All processes of studies’ selection and data extraction were discussed within the research team. The QI checklist which was introduced by Tennant and Conaghan with 10 items, was used to evaluate quality of the reporting of Rasch parameters.21,22 The criteria for this 10-item checklist are: (1) Stating the name of the software for Rasch analysis, (2) Reporting mathematical derivation of the Rasch model, (3) Evaluation of the threshold ordering, (4) Test of item fit to the Rasch model, (5) Test of person fit, (6) Testing for differential item functioning (DIF), (7) Reliability, (8) Response dependency, (9) Unidimensionality, and (10) Transformation table.21 Here there is a short explanation for each item.
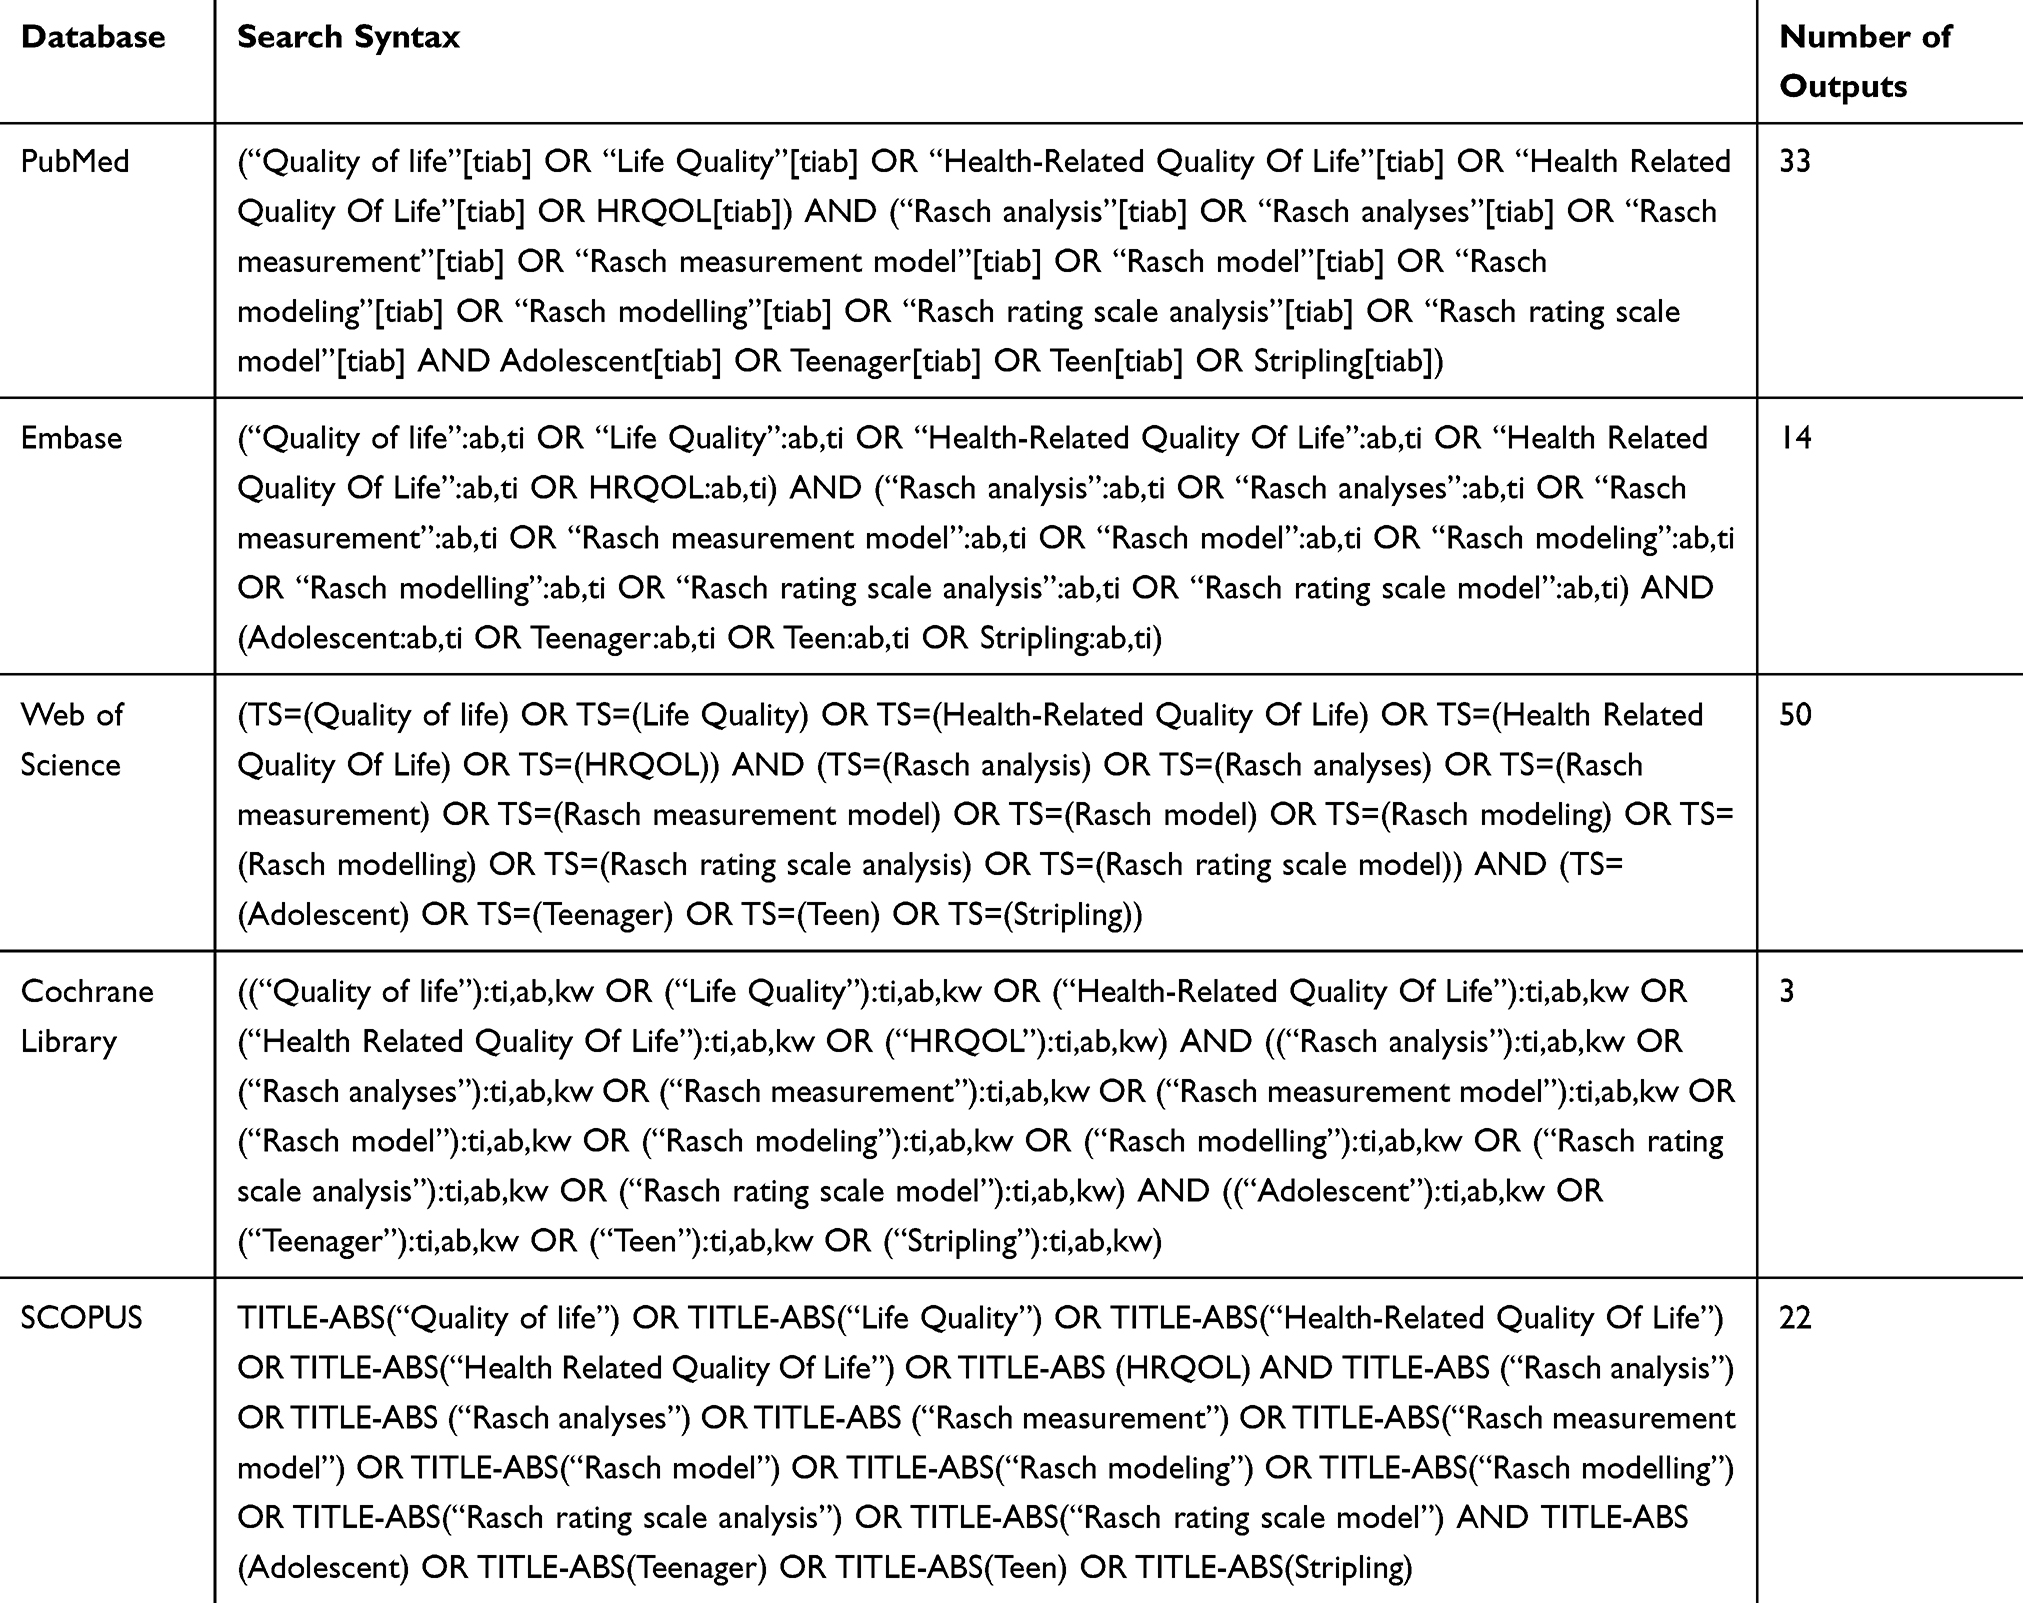 |
Table 1 Search Syntax in Different Databases |
Stating the Name of the Software for Rasch Analysis
There are several software programs to analyze the data using the Rasch method, but the main software programs which are used in the studies are WINSTEPS, RUMM, ConQuest and WINMIRA. Each of these software programs report the findings in a slightly different process. But, the main hypothesis in all of them is testing and matching observed response pattern in the data with theoretical pattern expected by the model.21–24
Reporting Mathematical Derivation of the Rasch Model
The first step in Rasch analysis is determining and selecting the mathematical derivation of the Rasch model. If the Likert scale items have two response options the chosen model is a dichotomous model. If the items have three or more levels of response options (Polytomous model), the Rasch model will be slightly different and is commonly referred to as the Andrich Rating Scale Model (RSM) or Masters Partial Credit Model (PCM). The two models differs in the way of behaving with thresholds (probabilistic midpoint between two adjacent categories). In the RSM, any category on the response scale is modeled to be “equal” throughout all items. In other words, the gap between thresholds is considered equal across items. In fact, the threshold is a metric distance between items and should be the same across the items of a scale. Studies should explain the type of the model which was used and the reason for this selection.21–24
Evaluation of the Threshold Ordering
This evaluation applies to polytomous items using the PCM and the RSM models. It is important to identify the classification structure of response levels to the items and to ensure that answers to the items are consistent with the metric estimate of the underlying construct. This means that the transition from one response level to the next should increase the hidden property of the measure. When this does not happen, disordered thresholds have occurred. Disorder at threshold means collapse of response options (response categories) over one another, followed by disorder at response levels due to relevance, redundancy, or misallocation of the items in the instrument. In the “Rasch-Andrich thresholds” or “step calibrations”, disordering appears when some categories do not match to intervals on the latent variable. Andrich disputes that there is a requirement at the level of the item for the categories to be ordered. The latent response processes must therefore be dependent so that an outcome of being successful on the second latent process and failing the first latent process cannot occur. Therefore, a threshold cannot be passed unless all prior thresholds have been passed. Andrich imposes this order requirement through what he calls a Guttman structure.25,26 Studies should identify threshold as well as measures to eliminate the disorder.21–24
Test of Item Fit to the Rasch Model
There may be a difference between observed and expected responses in each study, so model testing can give the researcher more information. There are different fit statistics in different software programs. Although they cannot be compared to each other, there are standardized values for all individuals and they can subsequently be comparable. For example, WINSTEPS software outputs include infit, outfit, and ZSTD (standardized fit statistics). In the RUMM 2020 software, outputs are Chi-square statistic and residual statistic (standardized sum of all differences between observed and expected values aggregated across all persons) which are very similar to outfit and ZSTD in WINSTEPS software. Infit is the difference between observed and expected responses for those items with difficulty levels close to the individual’s ability. The outfit deals with the differences between all items (regardless of difficulty of the item and based on one’s ability). Thus, infit gives more weight to the responses for items close to one’s ability. Chi-square test shows the difference between expected and observed values of measured properties between groups, indicating different levels of ability. If its value is less than 0.05, then it is considered as a misfit. Another output of the RUMM 2020 is item-trait interaction Chi-square, representing the variance of measured property. If Chi-square becomes significant, hierarchical ordering of response levels varies across attributes.21–24
Test of Person Fit
Answers with unusual patterns can influence fit item levels. These incorrect responses can be triggered by unregistered diseases such as cognitive deficits in the respondent. Thus, deleting such responders can lead to improved internal construct validity of the tool. Such response patterns must be identified by high positive residuals. So, person fit is important and should be reported.21–24
Testing for DIF (Differential Item Functioning)
DIF or item bias can influence the fit model. This happens when different groups with different demographic characteristics in a sample (eg, youth, the elderly, women, and men) respond differently to the same item while equal levels of response are measured for a latent variable. The goal is not to disregard age group differences, but to have access to the same levels of a trait regardless of the age variable. There may be a difference in different demographic settings, but an important point is that, DIF should be evaluated at least in different age and sex groups in each study.21–24
Reliability
There are different outputs for reliability in different software programs. For example, the output of the WINSTEPS software is reported as “person reliability” and “person separation”. “Person reliability” indicates to how well the instrument constantly reproduces a participant’s score. A “person reliability” coefficient of 0.70 shows an acceptable level, 0.80 a good level, and 0.90 an excellent level. While a “person separation” indicates how well the instrument differentiates persons into separate ability groups. It means “reproducibility of relative measure location, therefore, the greater the person separation statistic, the more distinct strata are disclosed (not less than 2). In RUMM 2030, this is provided by the “Person Separation Index” (PSI). The PSI is equivalent to Cronbach’s alpha, though it uses person estimates in logit instead of raw scores. Similar to Cronbach’s alpha, a value close to 1 indicates high internal consistency and a value less than 0.70 indicates model misfit.21–24
Response Dependency
Response dependency arises when the responses to some items are correlated, that is, answering one item determines the answer to another. Dependent items can be determined by calculating a residual correlation matrix, which should not actually show a significant correlation.21–24
Unidimensionality
According to the Rasch model, it is assumed that, all items collectively represent a unidimensional tool and measure one trait. There are several methods used for the measurement of unidimensionality that vary depending on the software which is used in data analysis, but Rasch Principal Component Analysis (PCA) for residuals or PCAR is the common indicator for the analysis of residuals. In WINSTEPS software, the first remaining contrast is an important indicator and usually should not be higher than two (eigenvalue of <2). However, if the first contrast has an eigenvalue value >2, it indicates that another dimension may be exist. It specifies that the dimension has at least three items.27 Another way to measure it using RUMM software is reporting a series of independent t-tests guided by pairs of person measures fitted from two subsets of positive and negative loading items on the first component of the residuals. Person estimates derived from the positive set of items are compared against those derived from the negative set. A series of unique t-tests are performed to compare the probabilities for each individual. Percentage of these tests outside the range of −1.96 to +1.96 should not exceed 5%. The differences in estimates derived from the two sets of the items are normally distributed.21–24
Transformation Table
When the Rasch model is used for psychometric study of an instrument, the options of instrument items can be converted to an interval scale. In this case, a transformation table for this change must be reported in the study. Equal interval scaling is important in clinical trials for accurately reporting the change in scores and reporting responsiveness, such as minimal important differences and effect size.21–24
Results
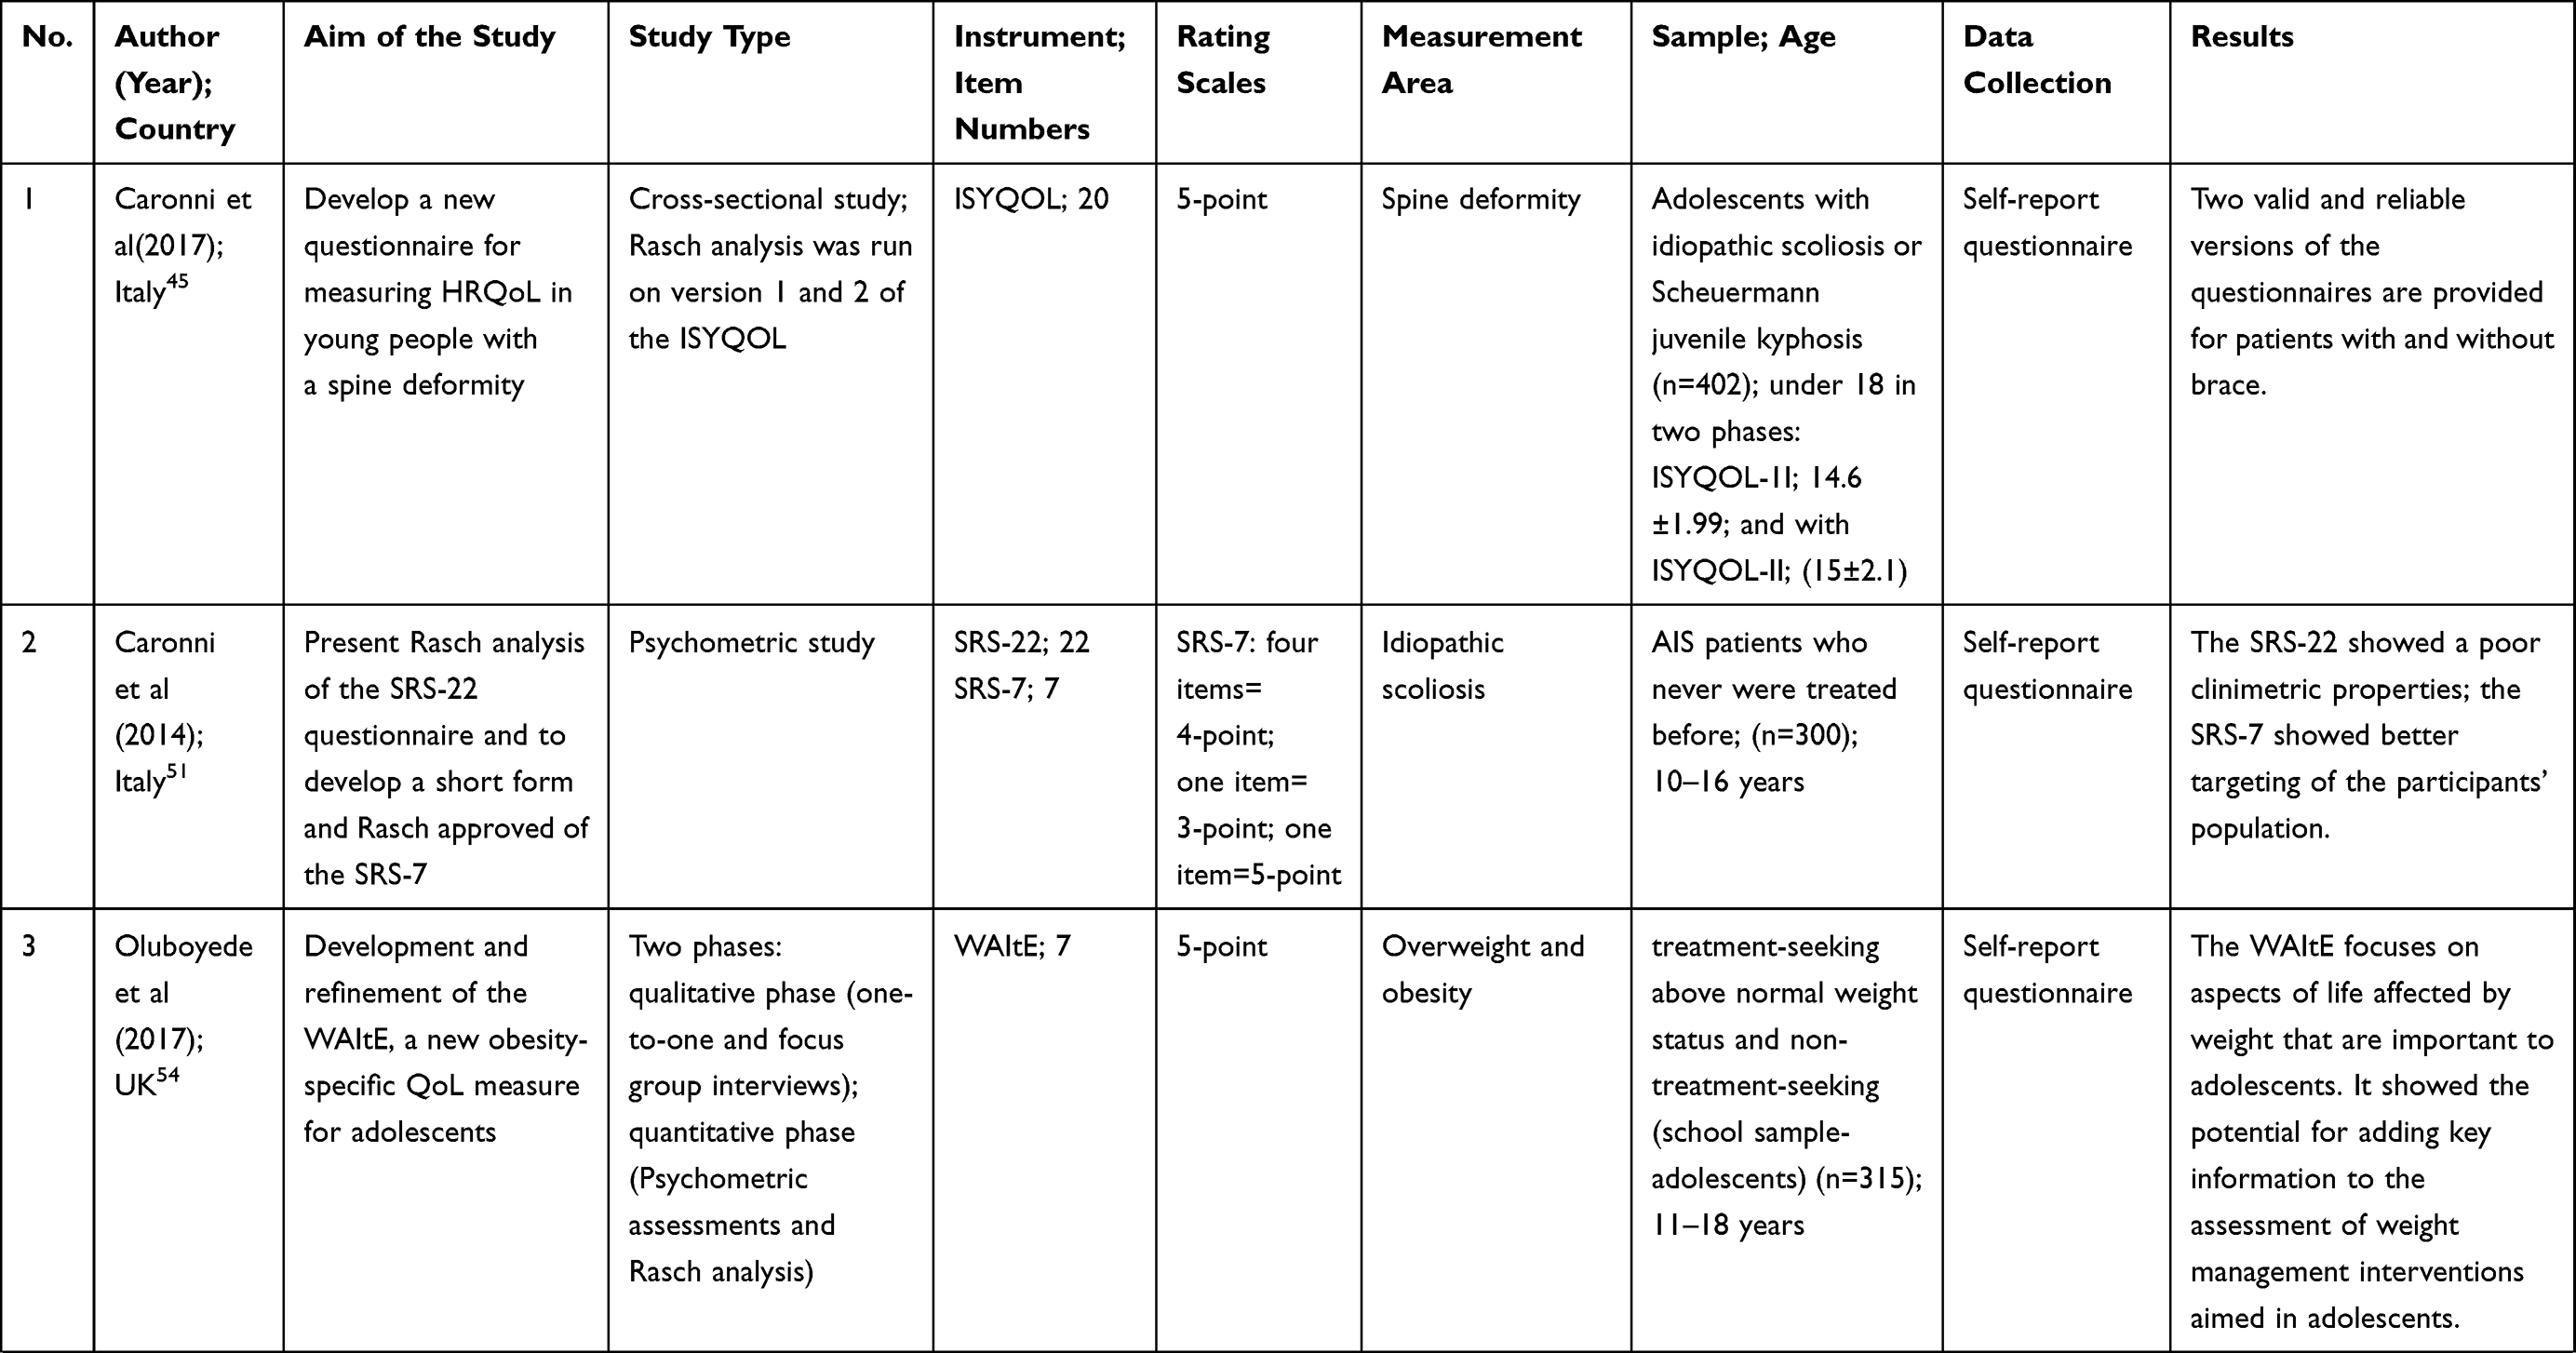
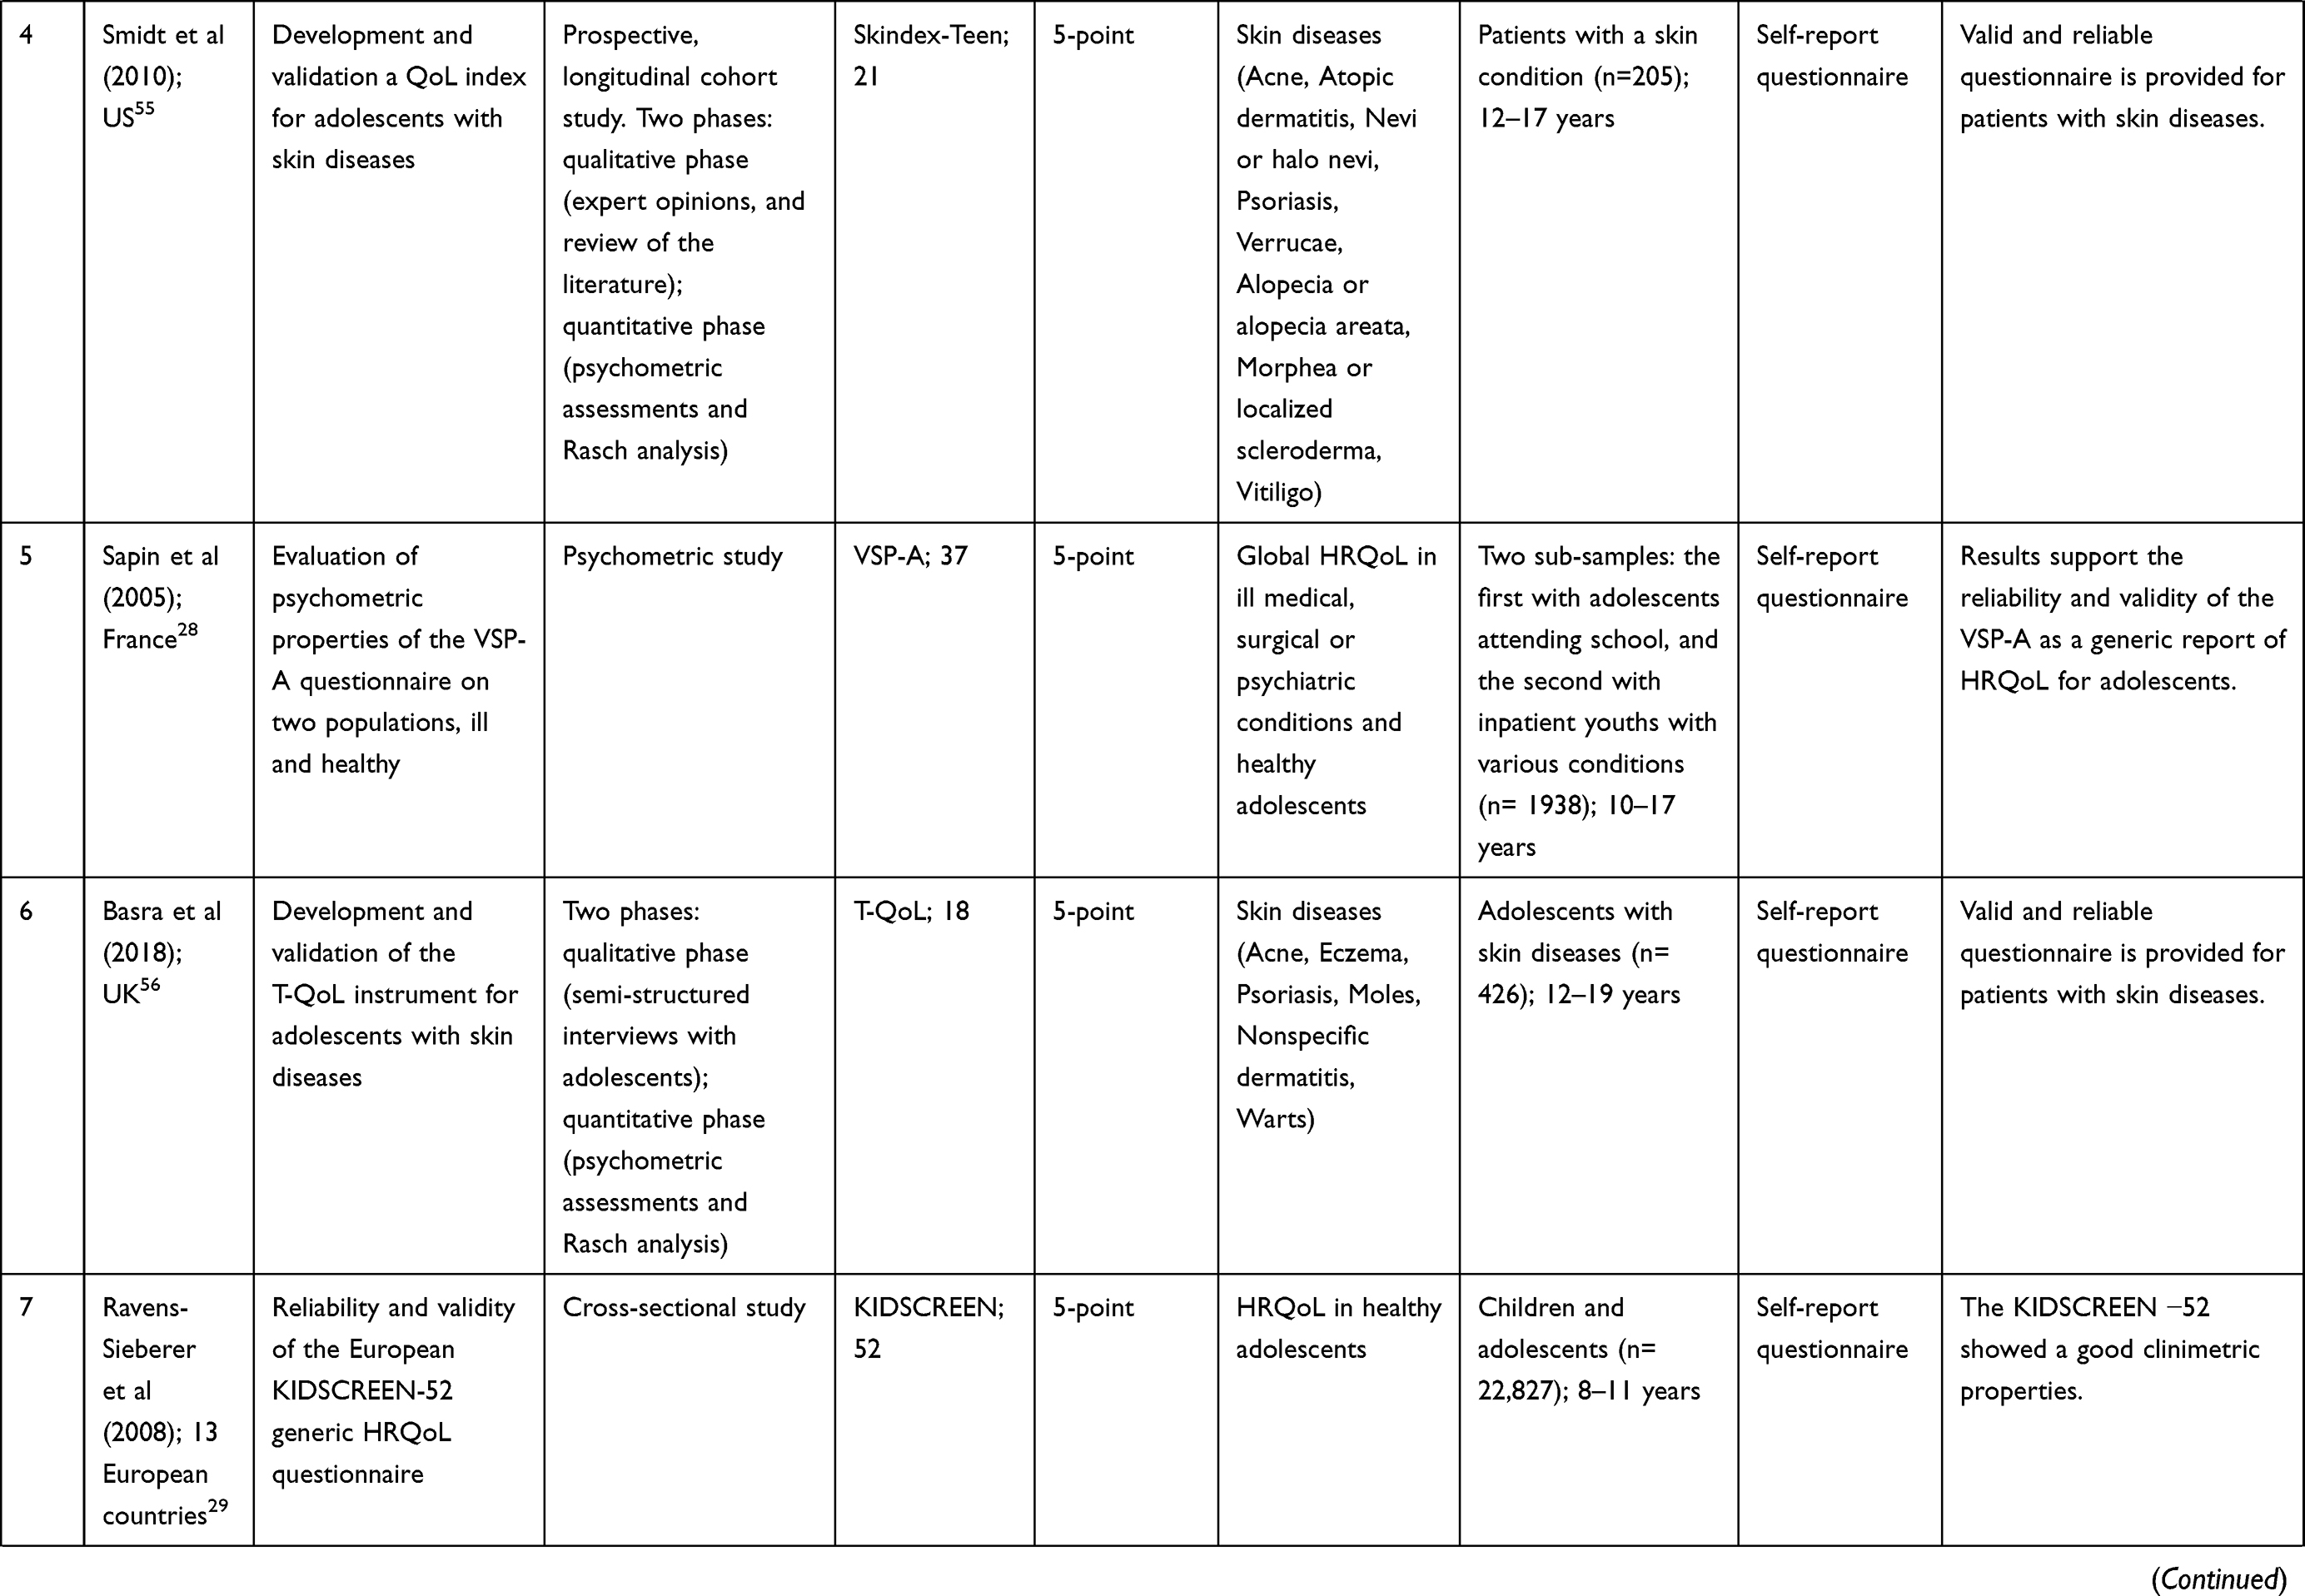
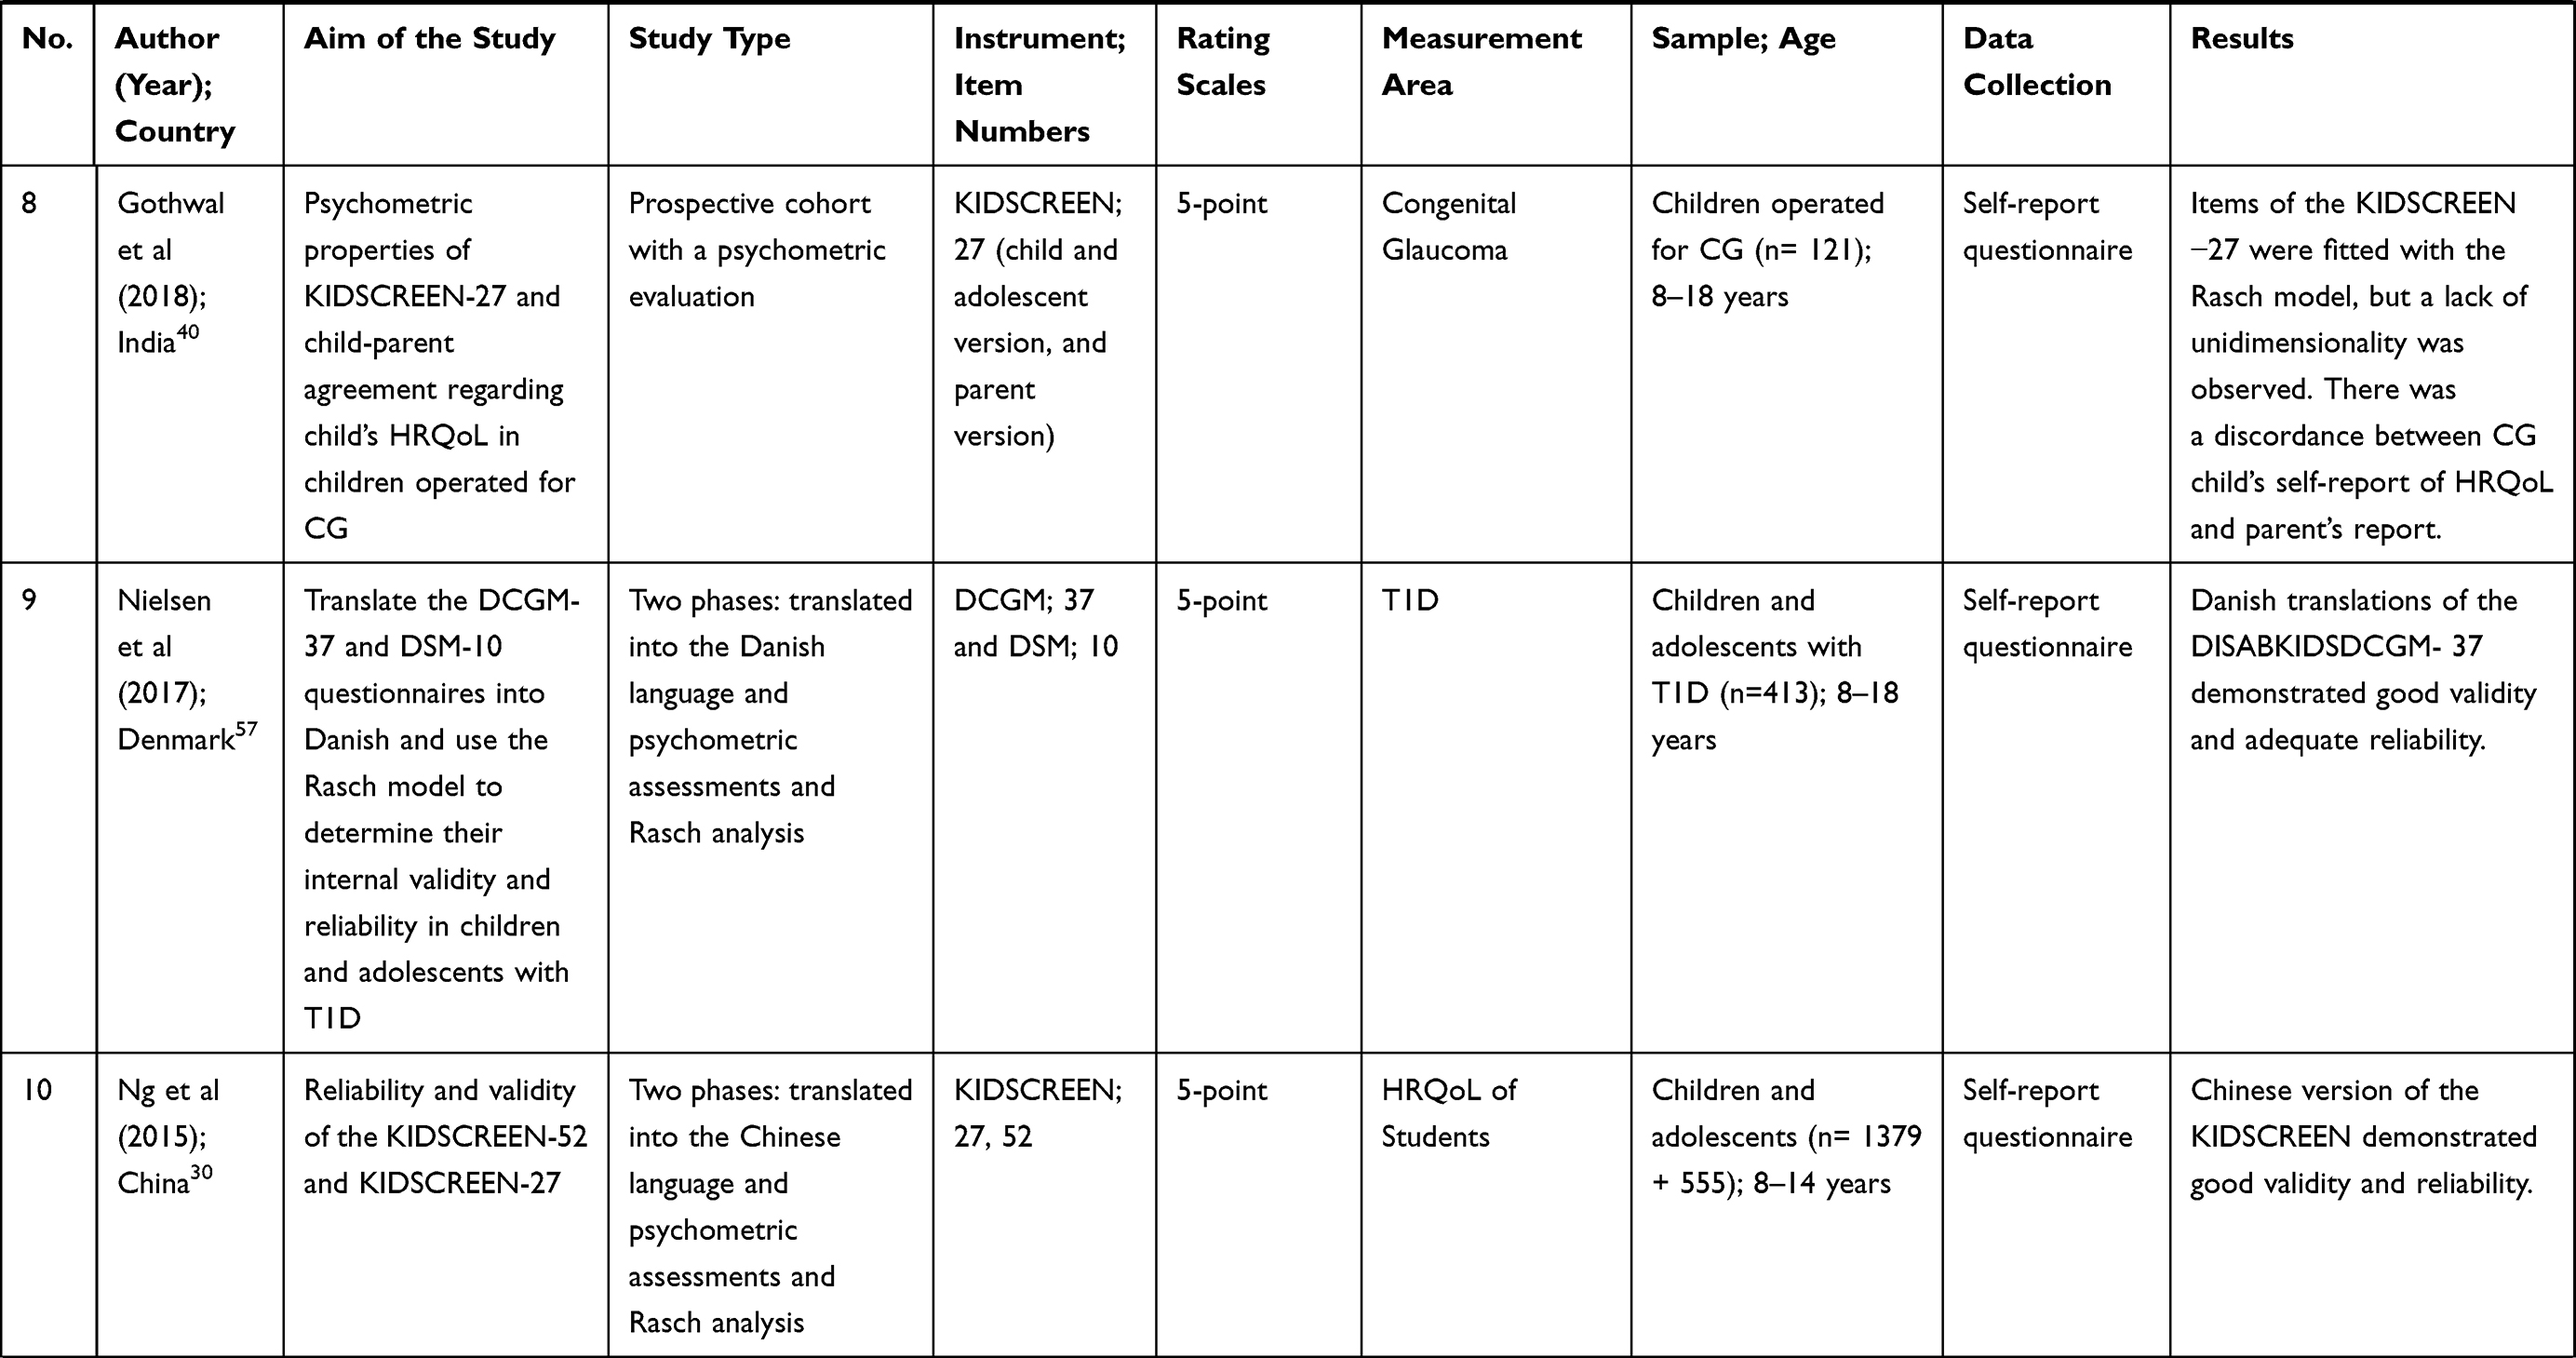
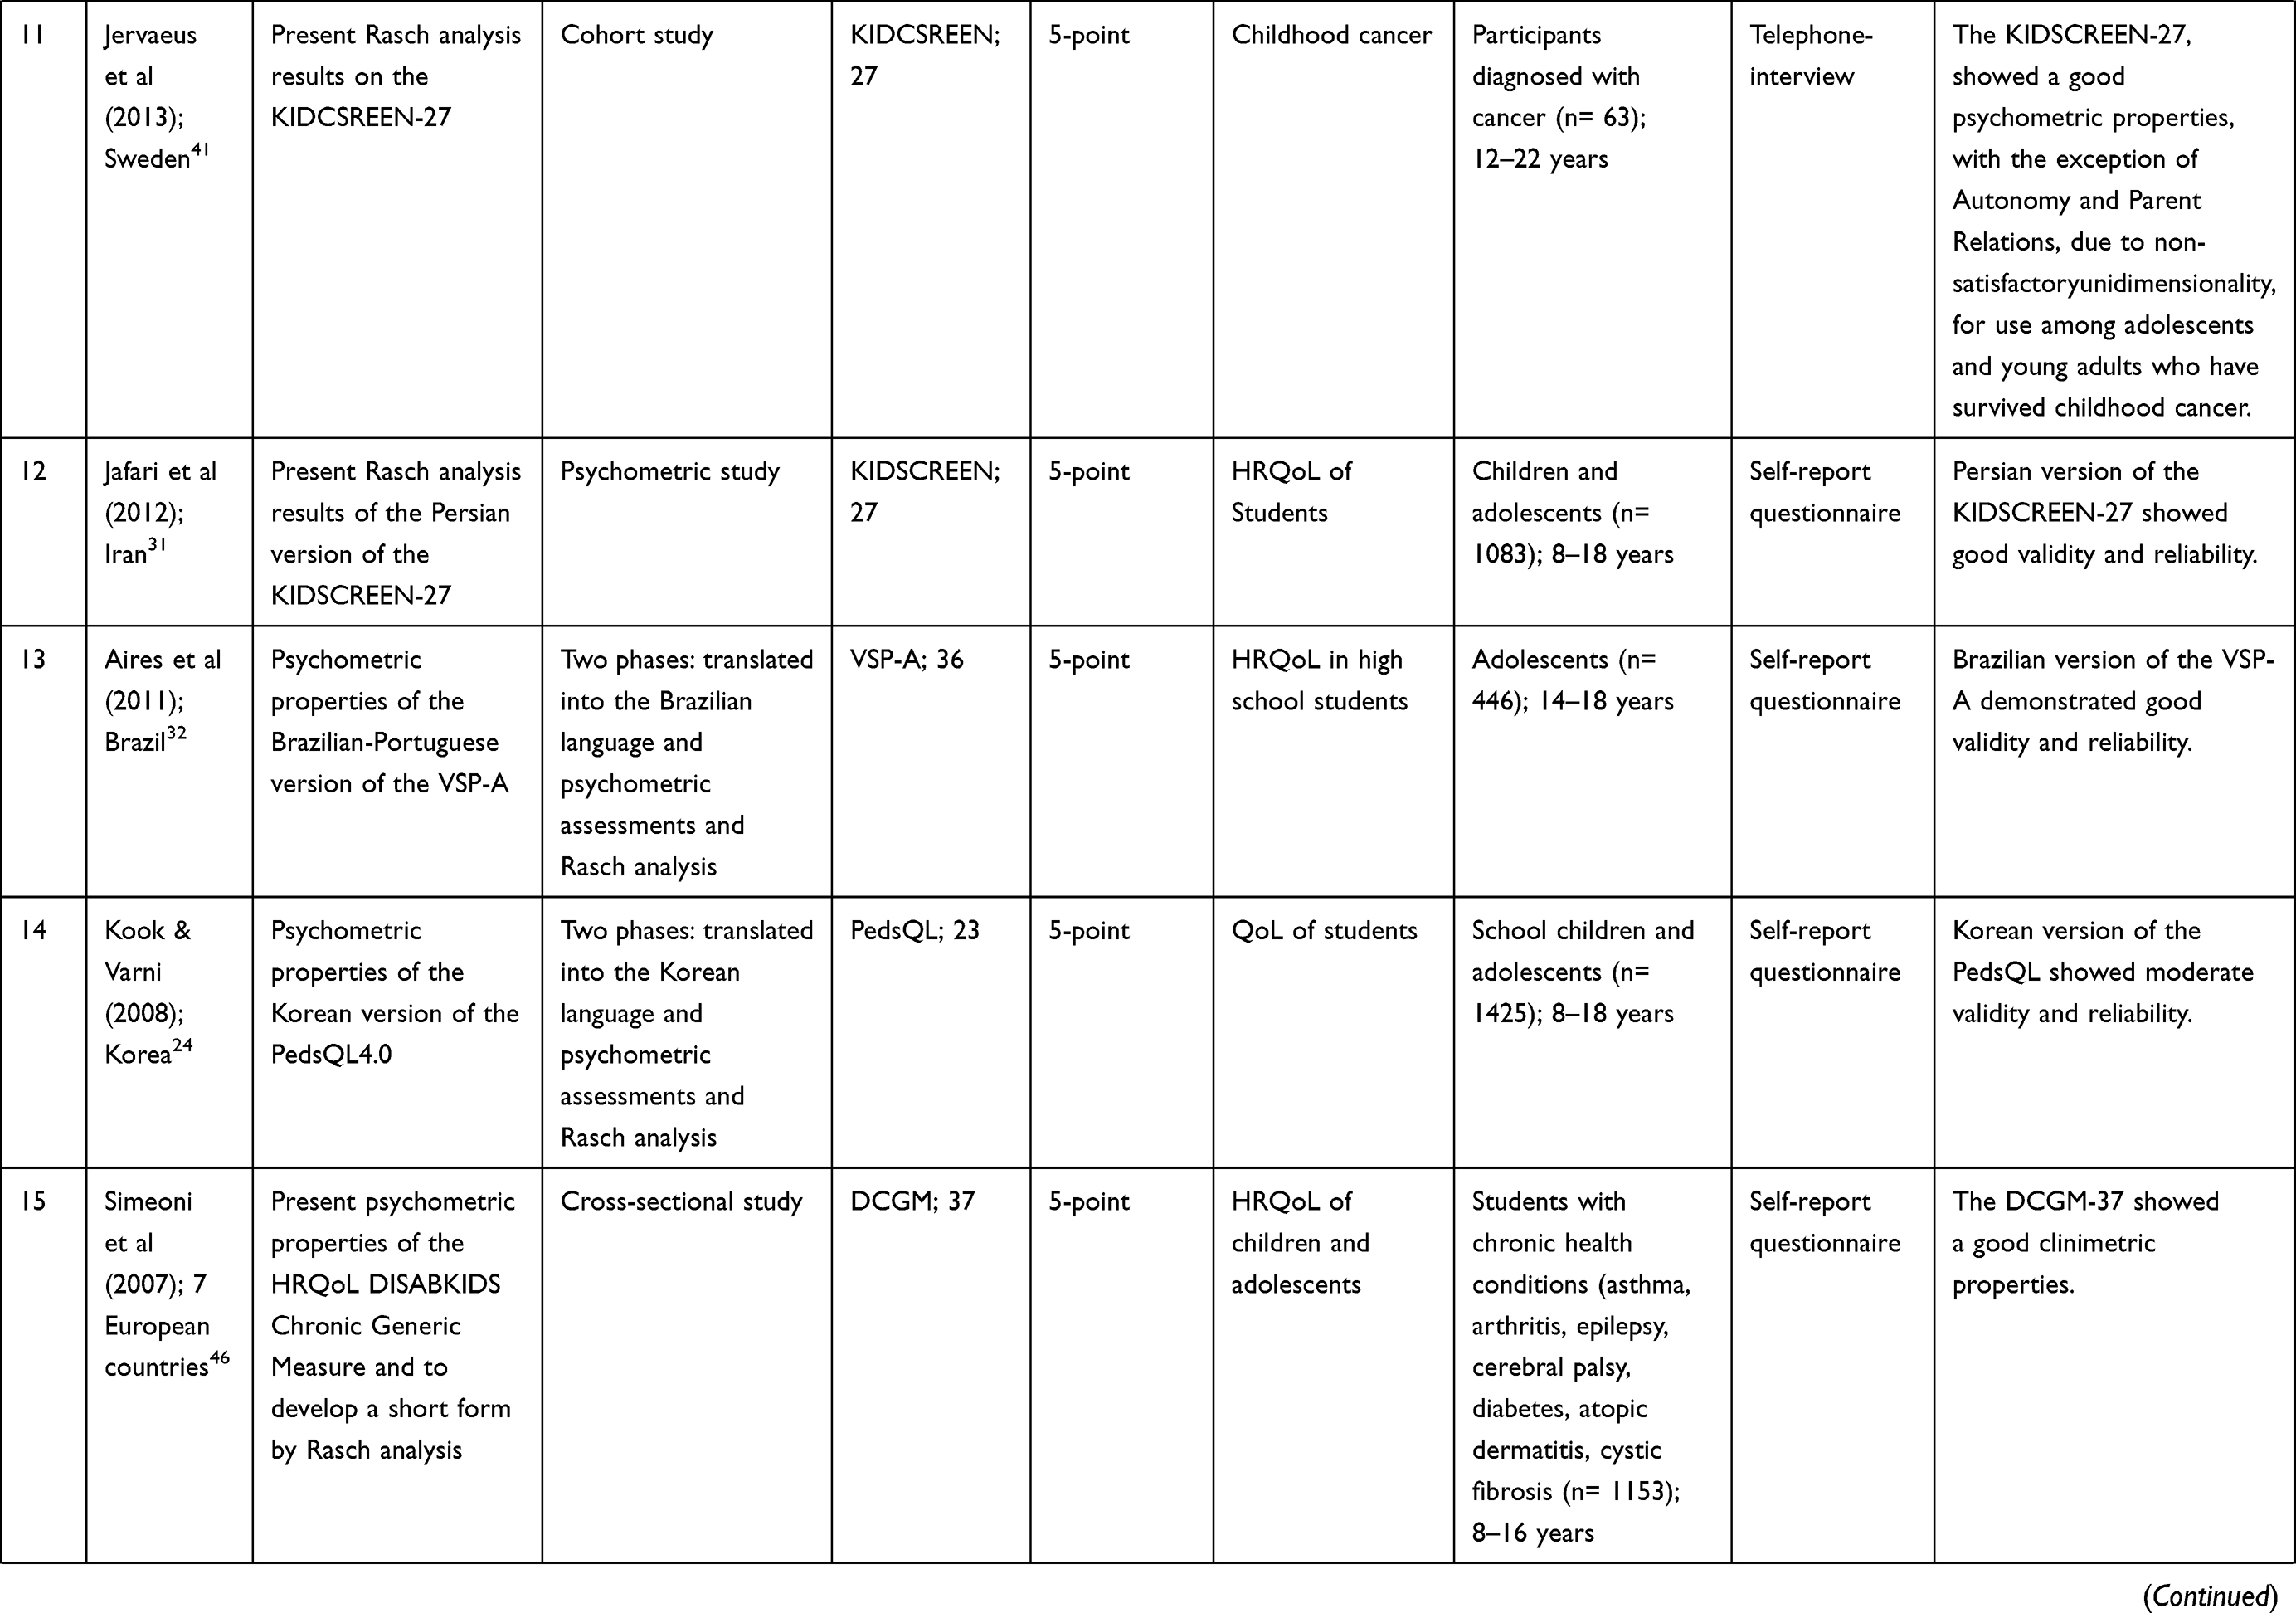
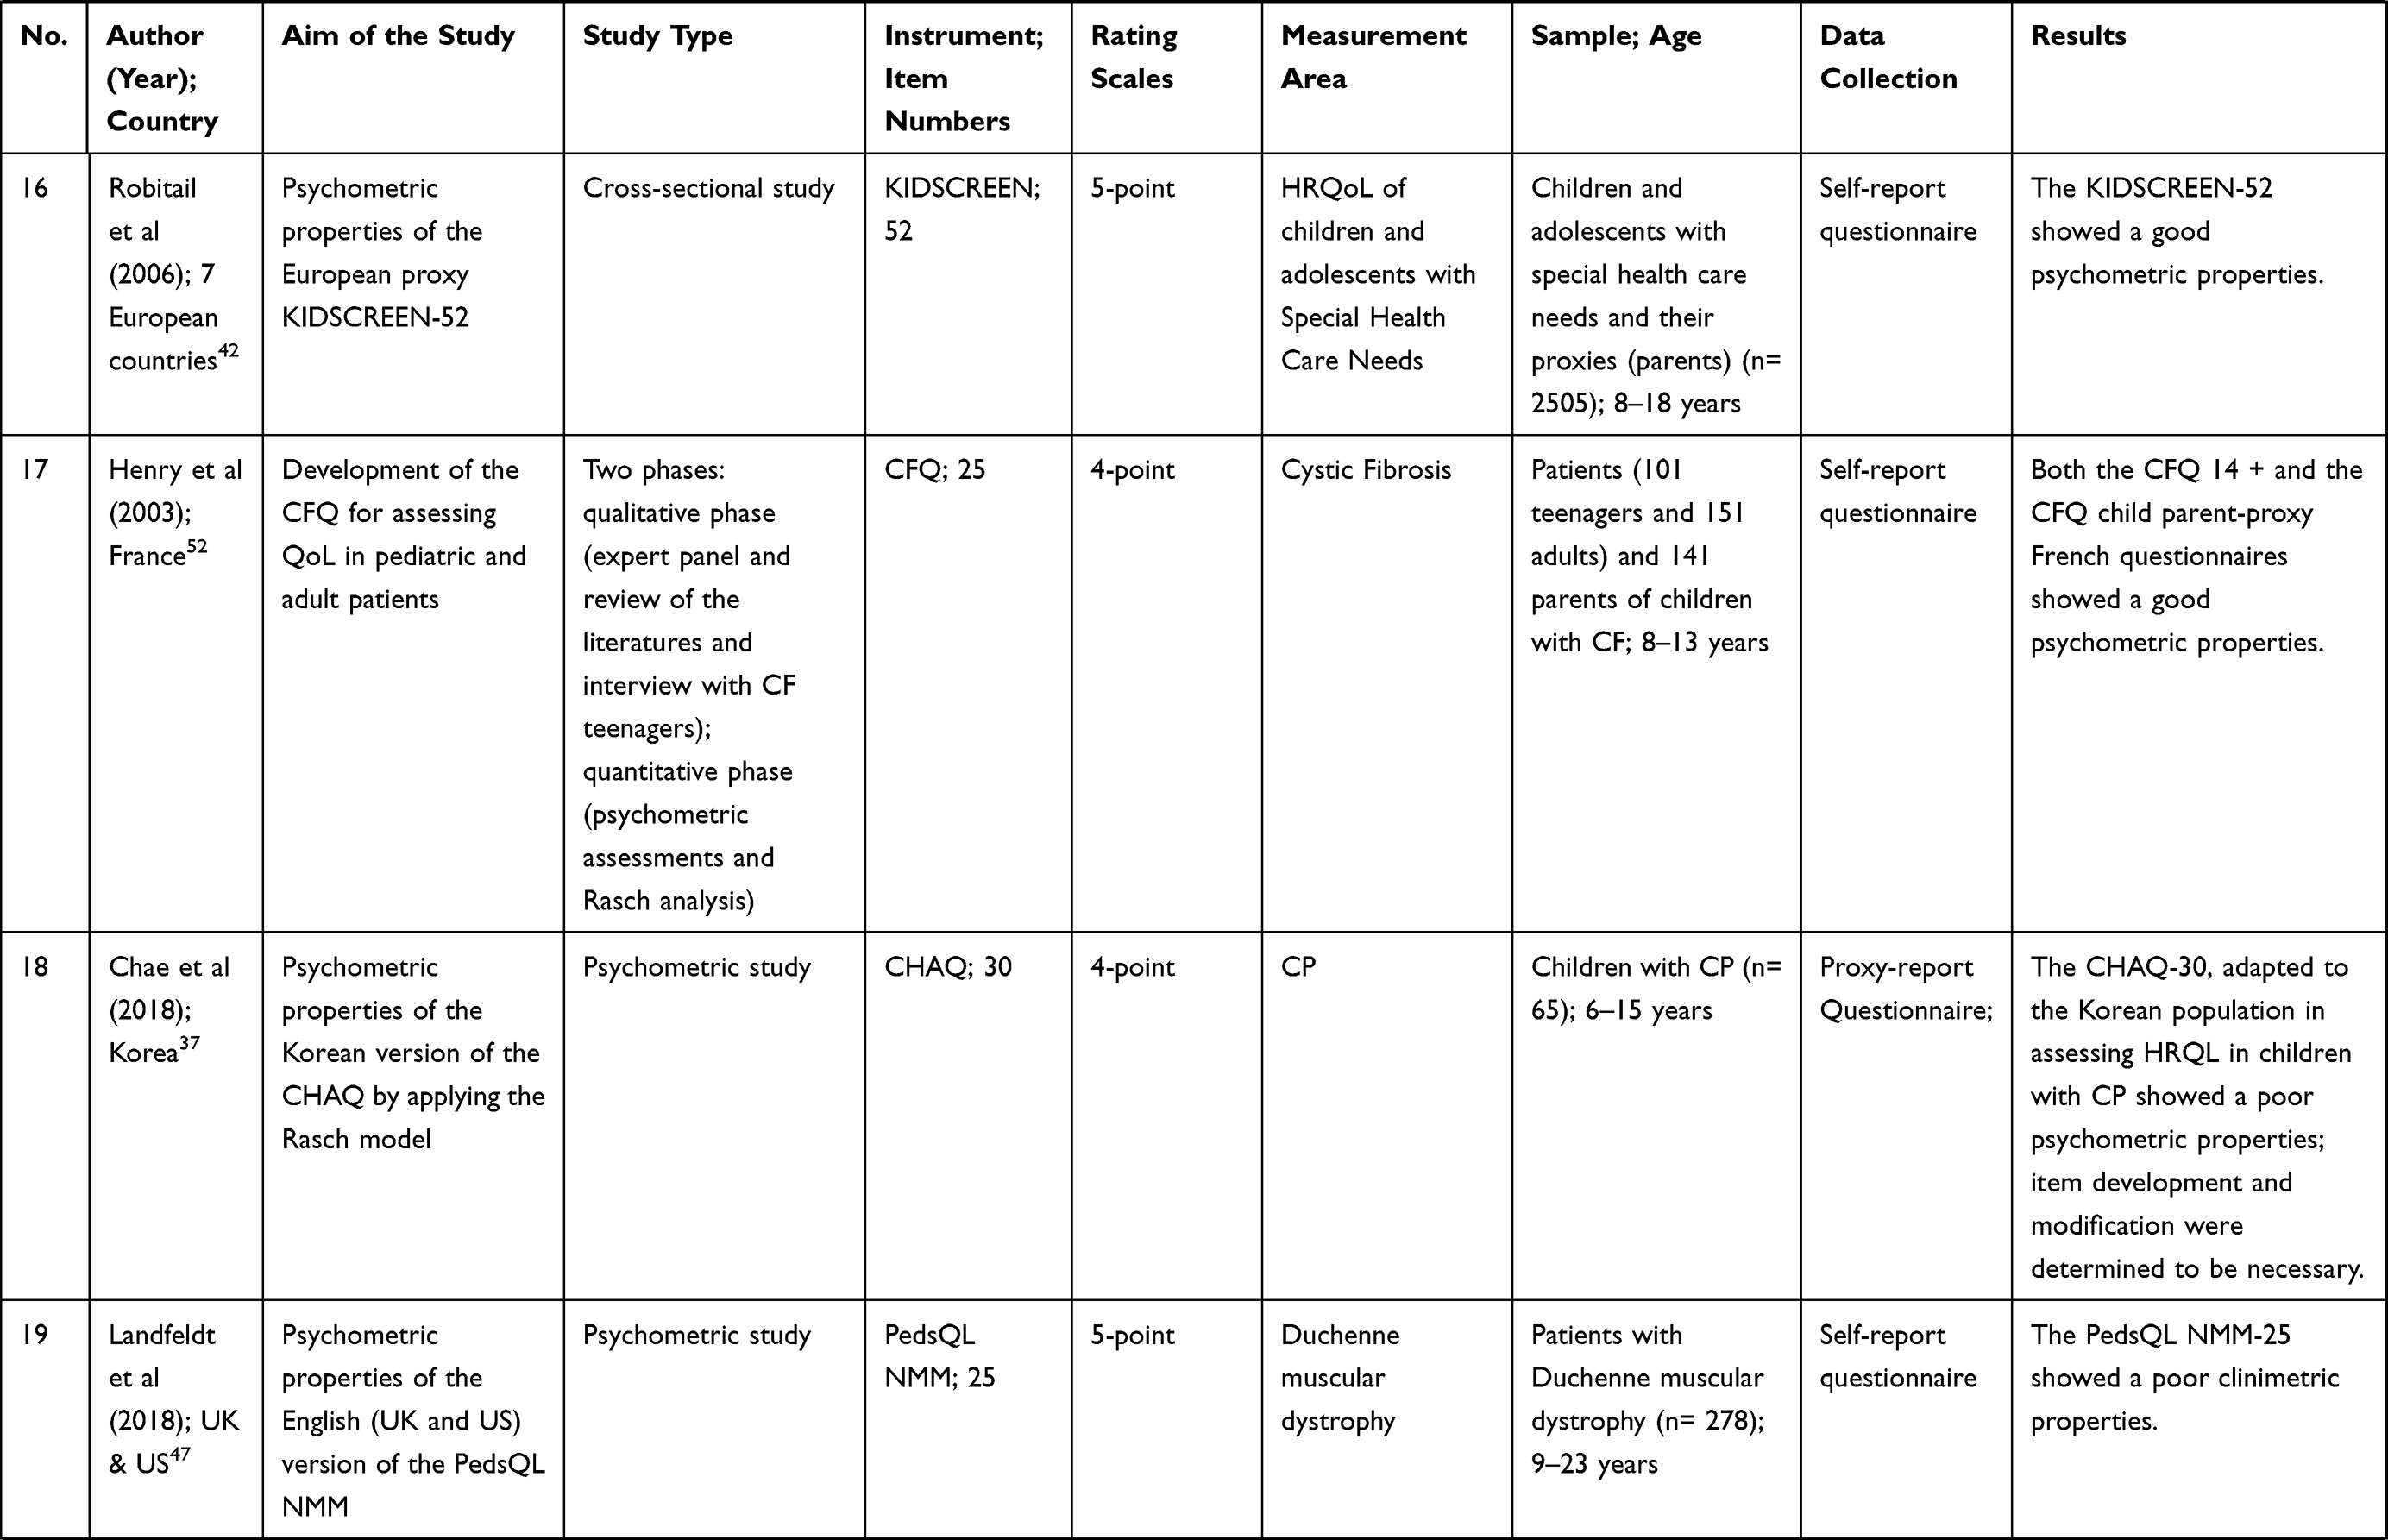
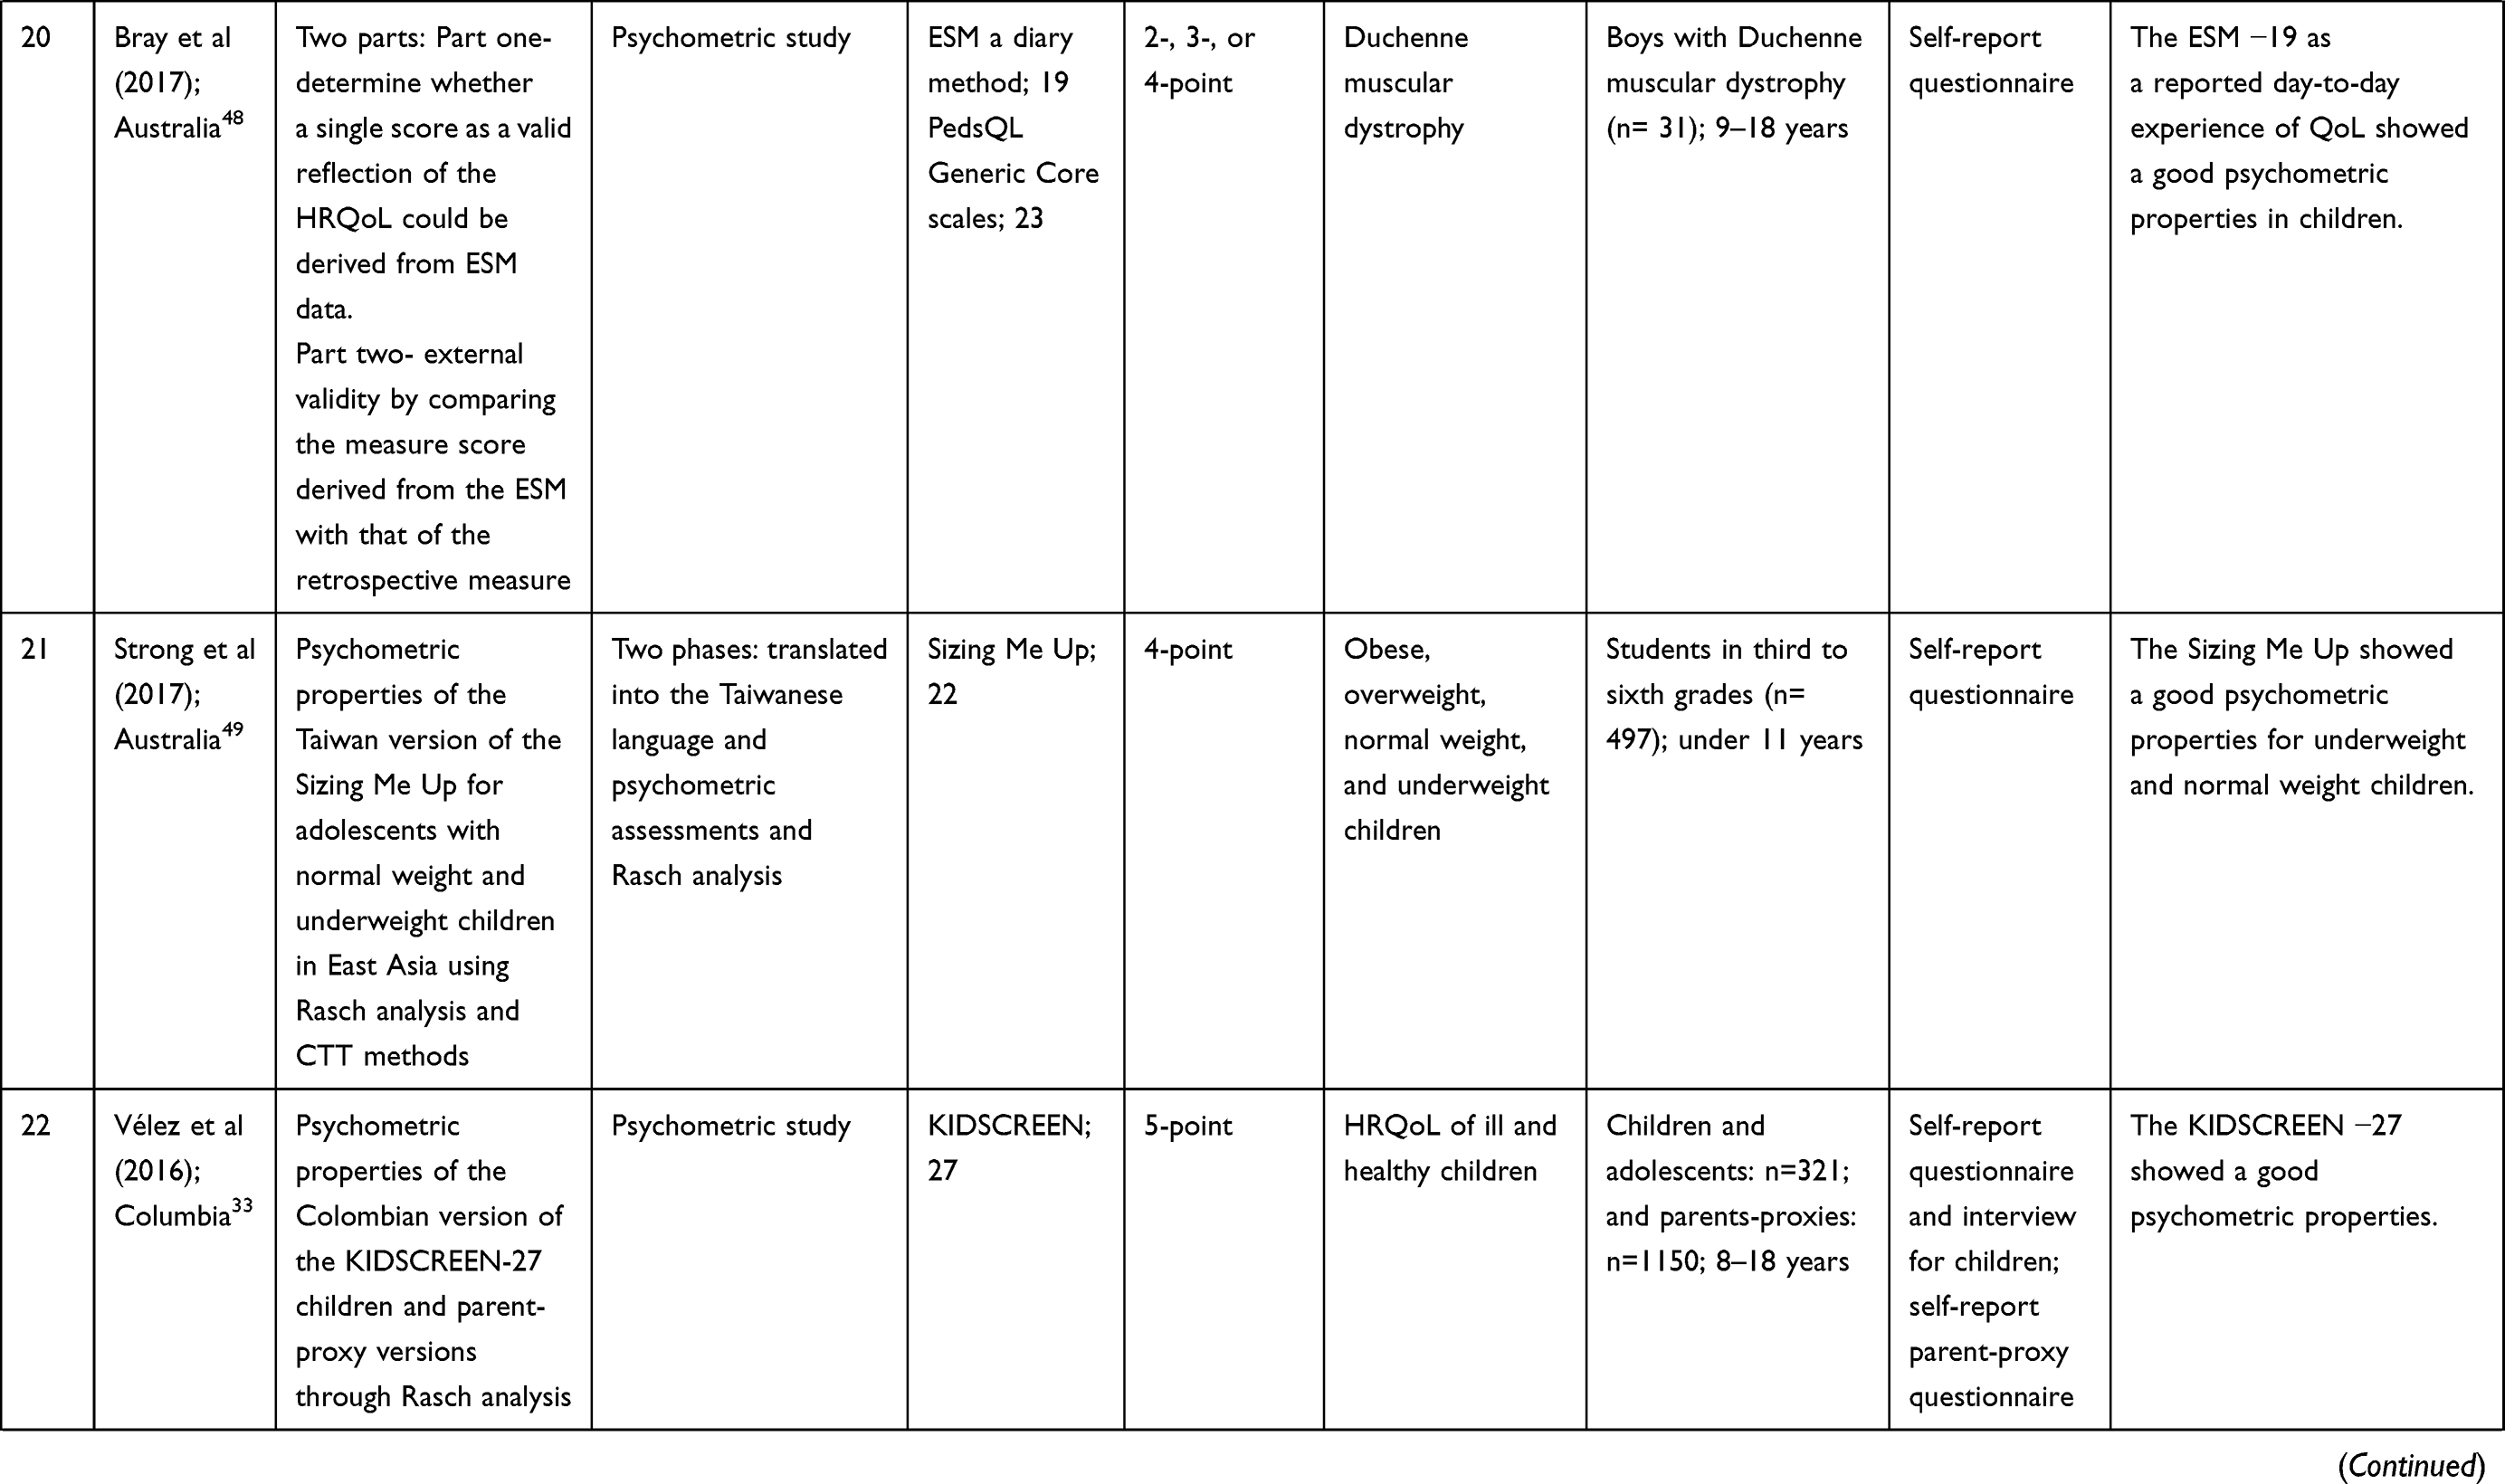
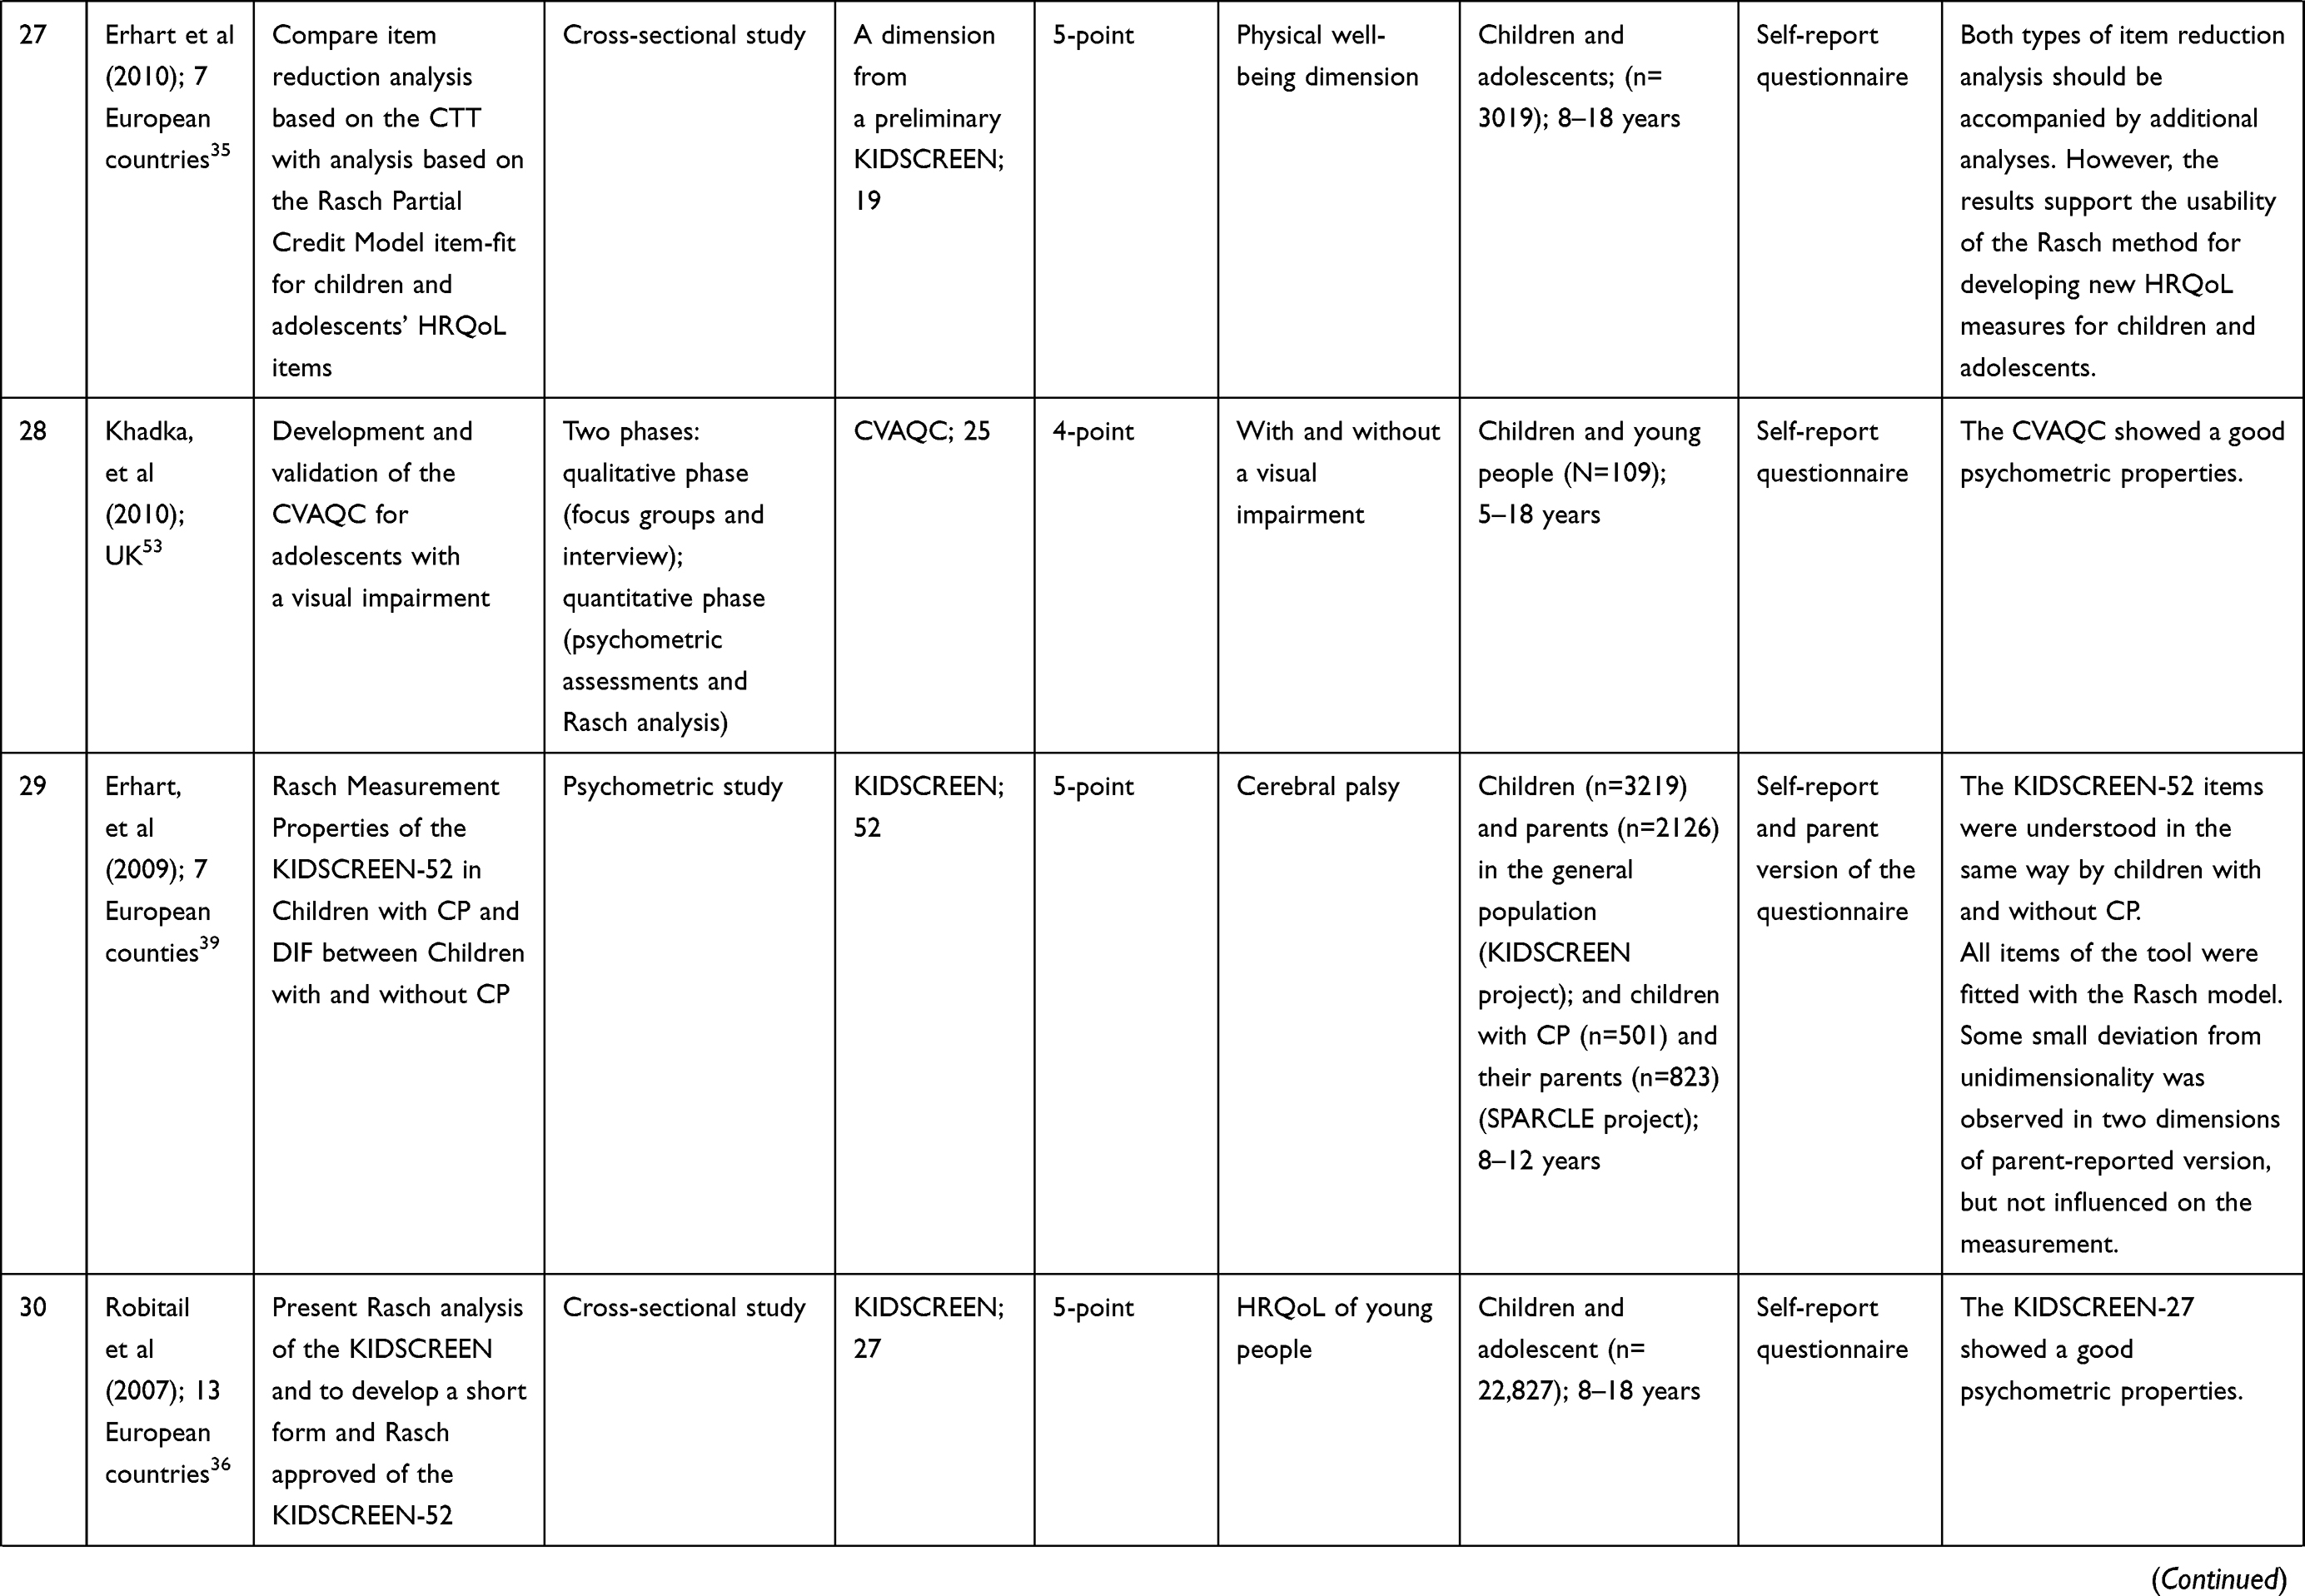
From a total of 122 papers which were found until December 2018, 31 papers were finally included in this study. The process of the study selection is shown in Figure 1 (the PRISMA 2009 diagram). The general characteristics of the selected studies are shown in Table 2.
 |
 |
 |
 |
 |
 |
 |
 |
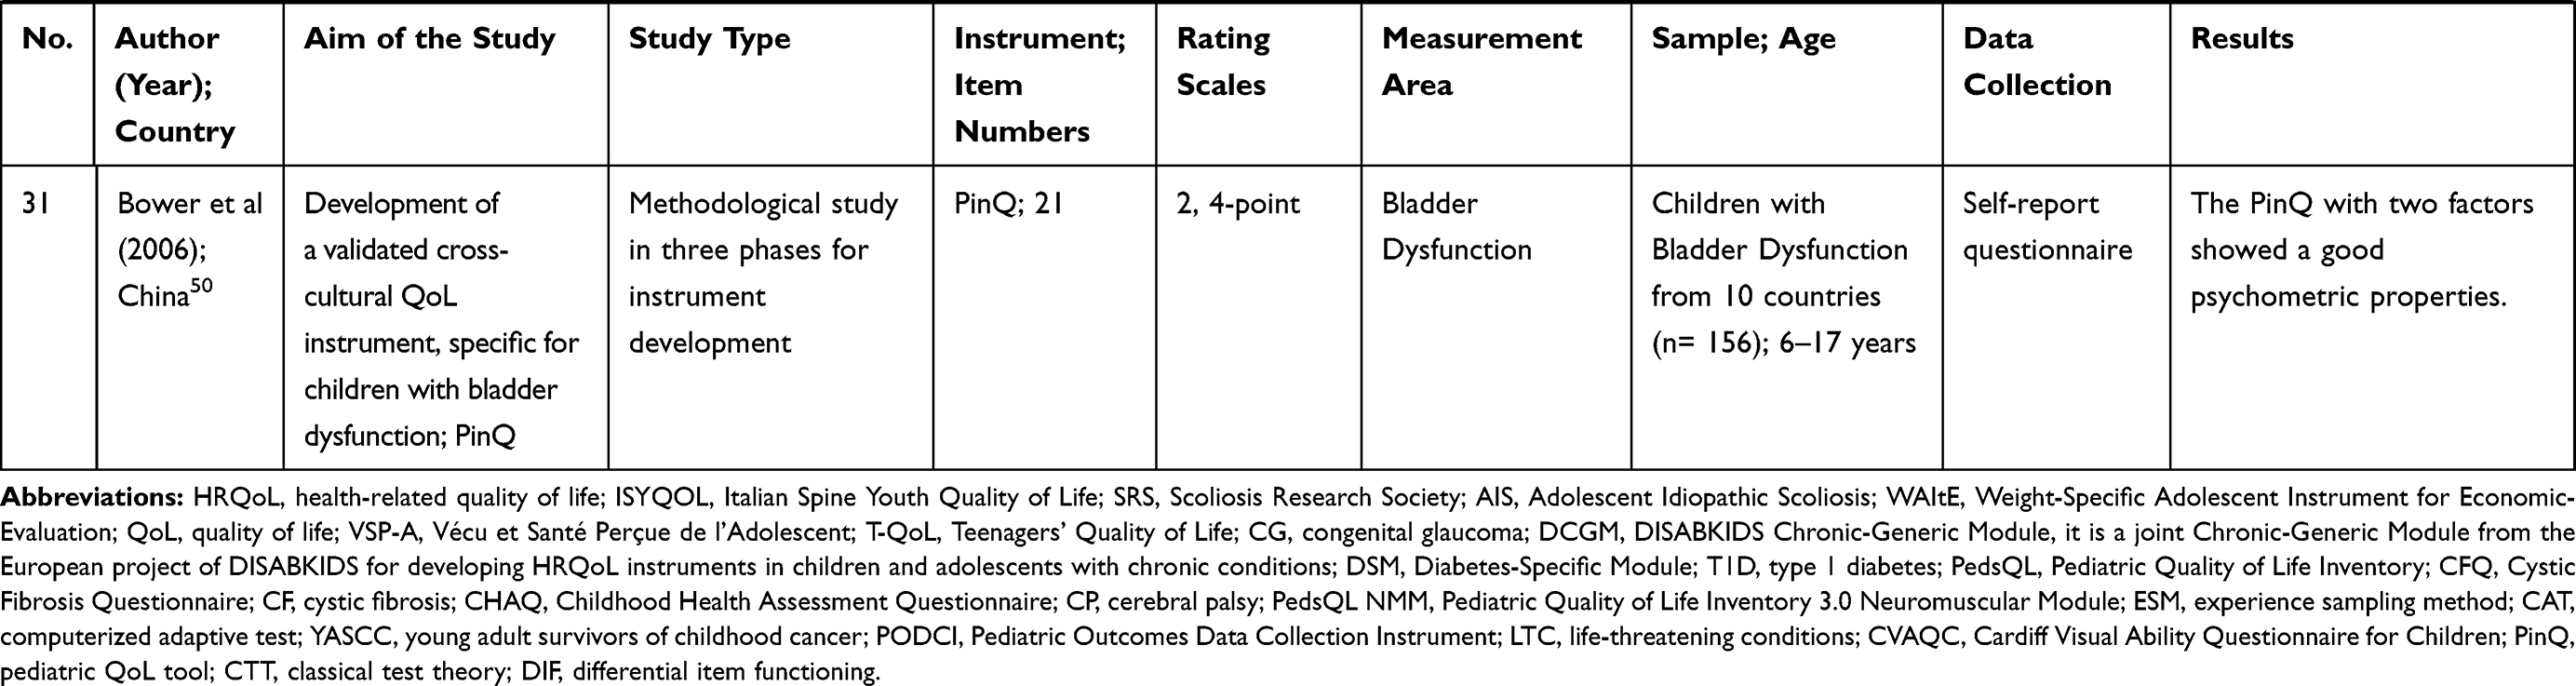 |
Table 2 General Characteristics of the Selected Studies with Application of Rasch Analysis in Adolescents’ QoL Instruments (n = 31) |
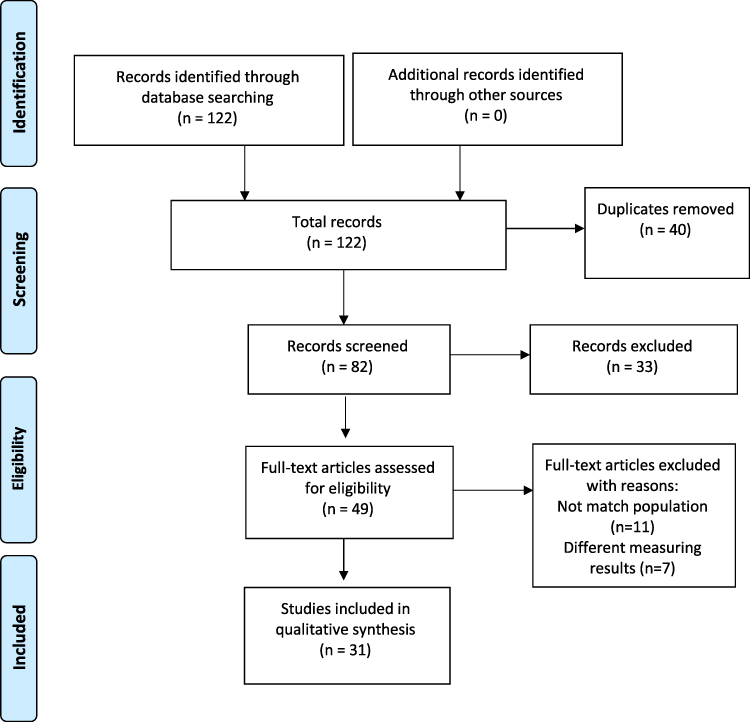 |
Figure 1 PRISMA diagram for the selection of studies. Notes: Adapted from Moher D, Liberati A, Tetzlaff J, Altman DG. The PRISMA GROUP. Preferred Reporting Items for Systematic Reviews and Meta-Analyses: The PRISMA Statement. PLoS Med. 2009; 6 (7): 1000097. doi: 10. 1371/journal. pmed 1000097.20 |
In response to the first research question “How is the application of Rasch analysis in psychometric assessment studies on adolescents’ QoL Instruments?” the following results were obtained.
Characteristics of Studies
67.7% of the studies (n = 21) used the Rasch analysis for instrument testing and 32.3% (n = 10) for the development of new instruments. In 77.4% of studies (n = 24), both Classical and Rasch methods were used parallel to data analysis. Mean age of adolescents in selected studies was equal to 12 years old (range: 6–22 years). The most commonly used instrument in Rasch studies was KIDSCREEN, administered in different countries. An important point is that, the majority of QoL of instruments, such as KIDSCREEN (KIDSCREEN Health-Related Quality of Life Questionnaire), DCGM-37 (DISABKIDS Chronic Generic Module), PedsQL (Pediatric Quality of Life Inventory), CFQ (Cystic Fibrosis Questionnaire) cover a wide range of ages, including childhood and adolescence, making it impossible to separate study results on adolescents from children. Various tools have been used, and the main target group for evaluating validity and reliability of the QoL tools was healthy adolescents (n = 78,149) in 32.2% of studies.24,28–36 Regarding target groups of patients, 9.4% of studies were related to adolescents with Cerebral Palsy (CP), accounting for the highest number of patients.37–39 Other disorders studied, including kyphosis, skin diseases, diabetes, cancer, glaucoma, bladder dysfunction, visual impairment, Life-Threatening Conditions (LTC), Duchenne muscular dystrophy, cystic fibrosis, mental health, idiopathic scoliosis, spine deformity, mental health, underweight, obesity and overweight have also been the focus of interest. Also, 22.6% of the studies (n = 7) were cross-cultural surveys, with the highest share among European countries (Table 2).
Adolescents’ QoL Instruments
Twenty types of QoL instruments were evaluated by the Rasch method. Among various QoL instruments, there were 18 specific tools for adolescents and children; ISYQOL (Italian Spine Youth Quality of Life), WAItE (Weight-specific Adolescent Instrument for Economic evaluation), Skindex-Teen (skin disease scale), VSP-A (Vécu et Santé Percue de l’Adolescent), KIDSCREEN, T-QoL (Teenagers’ Quality of Life), DISABKIDS (Disability Kids), PedsQL (Pediatric Quality of Life Inventory), DCGM-37 DISABKIDS (Chronic Generic Module), CHAQ (The Childhood Health Assessment Questionnaire), Sizing Me Up (a self-reported weight-related QoL instrument), KIDS-CAT (computerized adaptive test), HRQOL tool for YASCC (Young Adult Survivors of Childhood Cancer), PODCI (Pediatric Outcomes Data Collection Instrument), CVAQC (Cardiff Visual Ability Questionnaire for Children), PinQ (Pediatric QoL), ESM (Experience Sampling) a diary method, SRS-7 (Scoliosis Research Society), and CFQ (Cystic Fibrosis Questionnaire). The most commonly used tool was KIDSCREEN, administered in 11 studies (35.5%) in different countries, examining its psychometric properties.29–31,33,36,39–41 This questionnaire was designed in the KIDSCREEN project in 10 dimensions with 52 questions and is suitable for measuring QoL of children and adolescents at 8–18 years of age. It has 10 dimensions, including physical well-being, psychological well-being, emotions and moods, social support and peer, parent’s relationships, self-perception, autonomy, school environment, social acceptance, and financial resources, measuring QoL across a 5-point Likert scale. The highest score for each item is 4 and the lowest score is 0.29,30,41 In the present review, studies used the short (10, 19, 27 items) and long versions (52 items) of the questionnaire.29,31,33–36,39–42 It was used as a self-report questionnaire in most studies, while telephone-interview,41,43 proxy interview,33,34,37–39,43 and face-to face interview versions33,44 have also been reported.
Several types of Likert-scales were used in various studies, but 5-point Likert-scales were mostly used. Based on the psychometric assessment of the instruments, 9 studies (29%) reported unsatisfactory psychometrics results. The rest of studies reported satisfactory psychometrics results (n = 22, 71%) (Table 2). Furthermore, some short forms of the instruments, such as SRS-7, KIDSCREEN-23, and CHAQ-28 showed good psychometric results.
Rasch Parameters
In response to the second research question “How is the quality of reporting Rasch parameters in selected studies?” the following results were obtained:
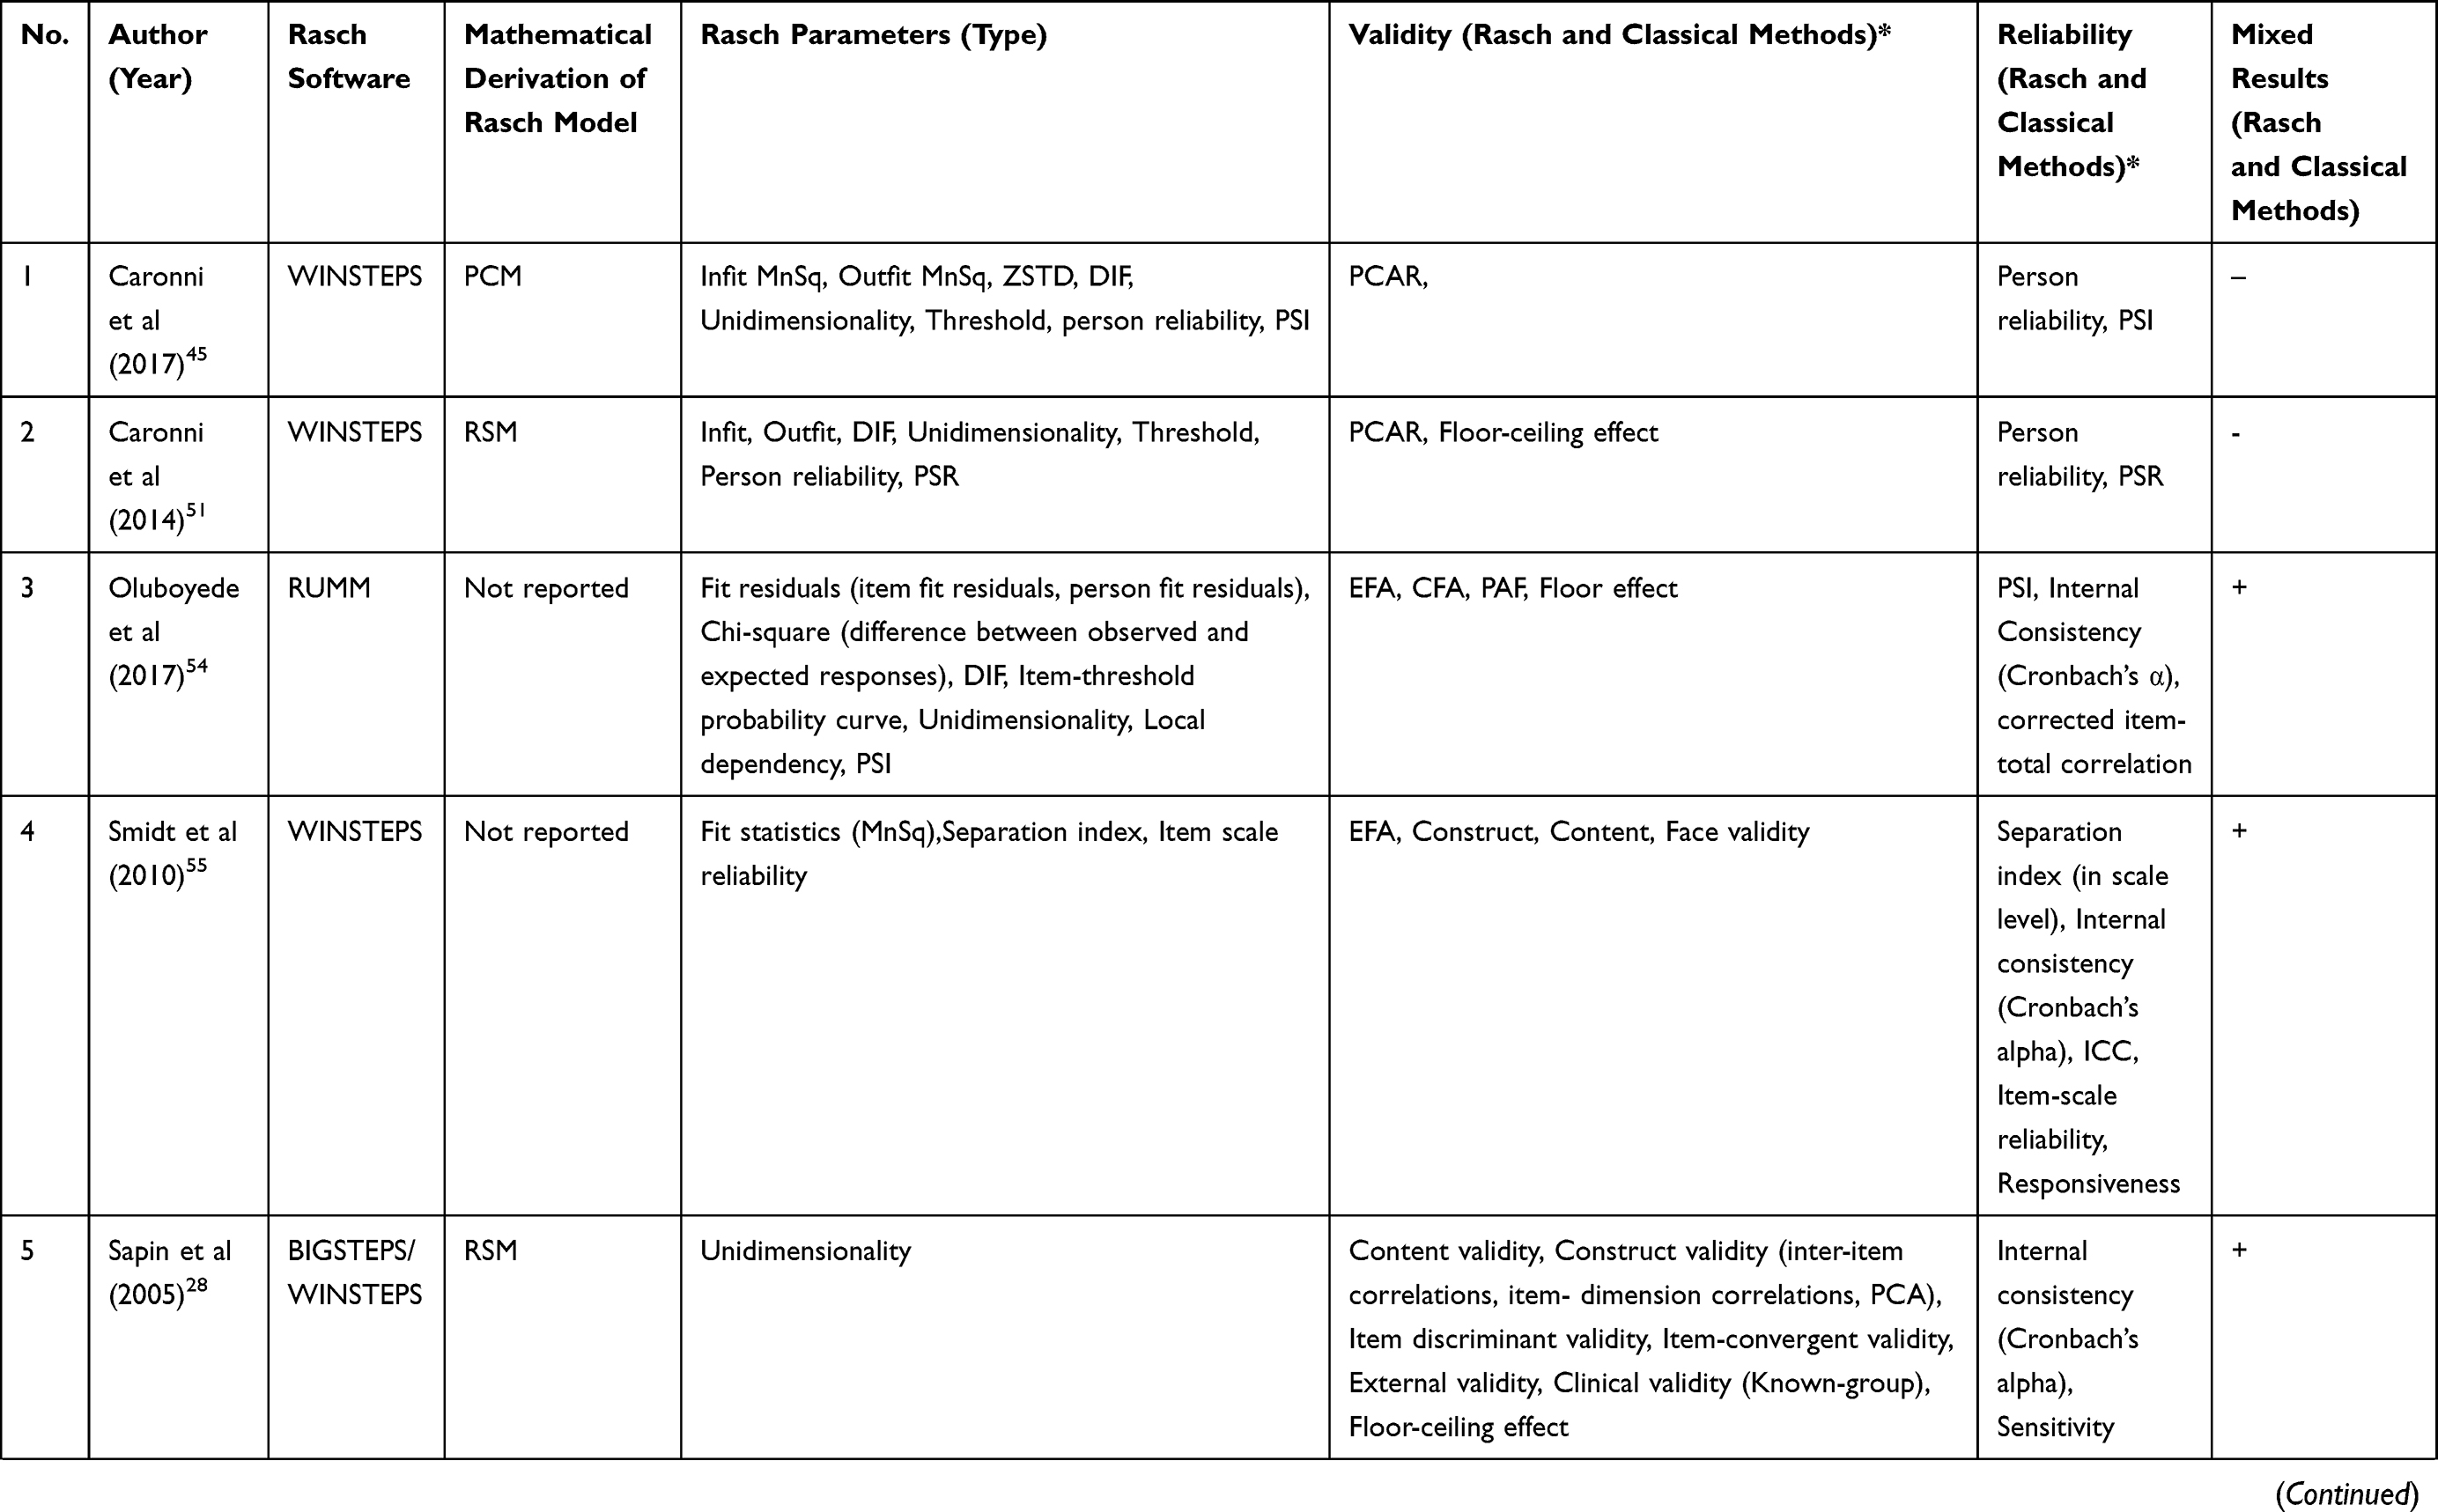
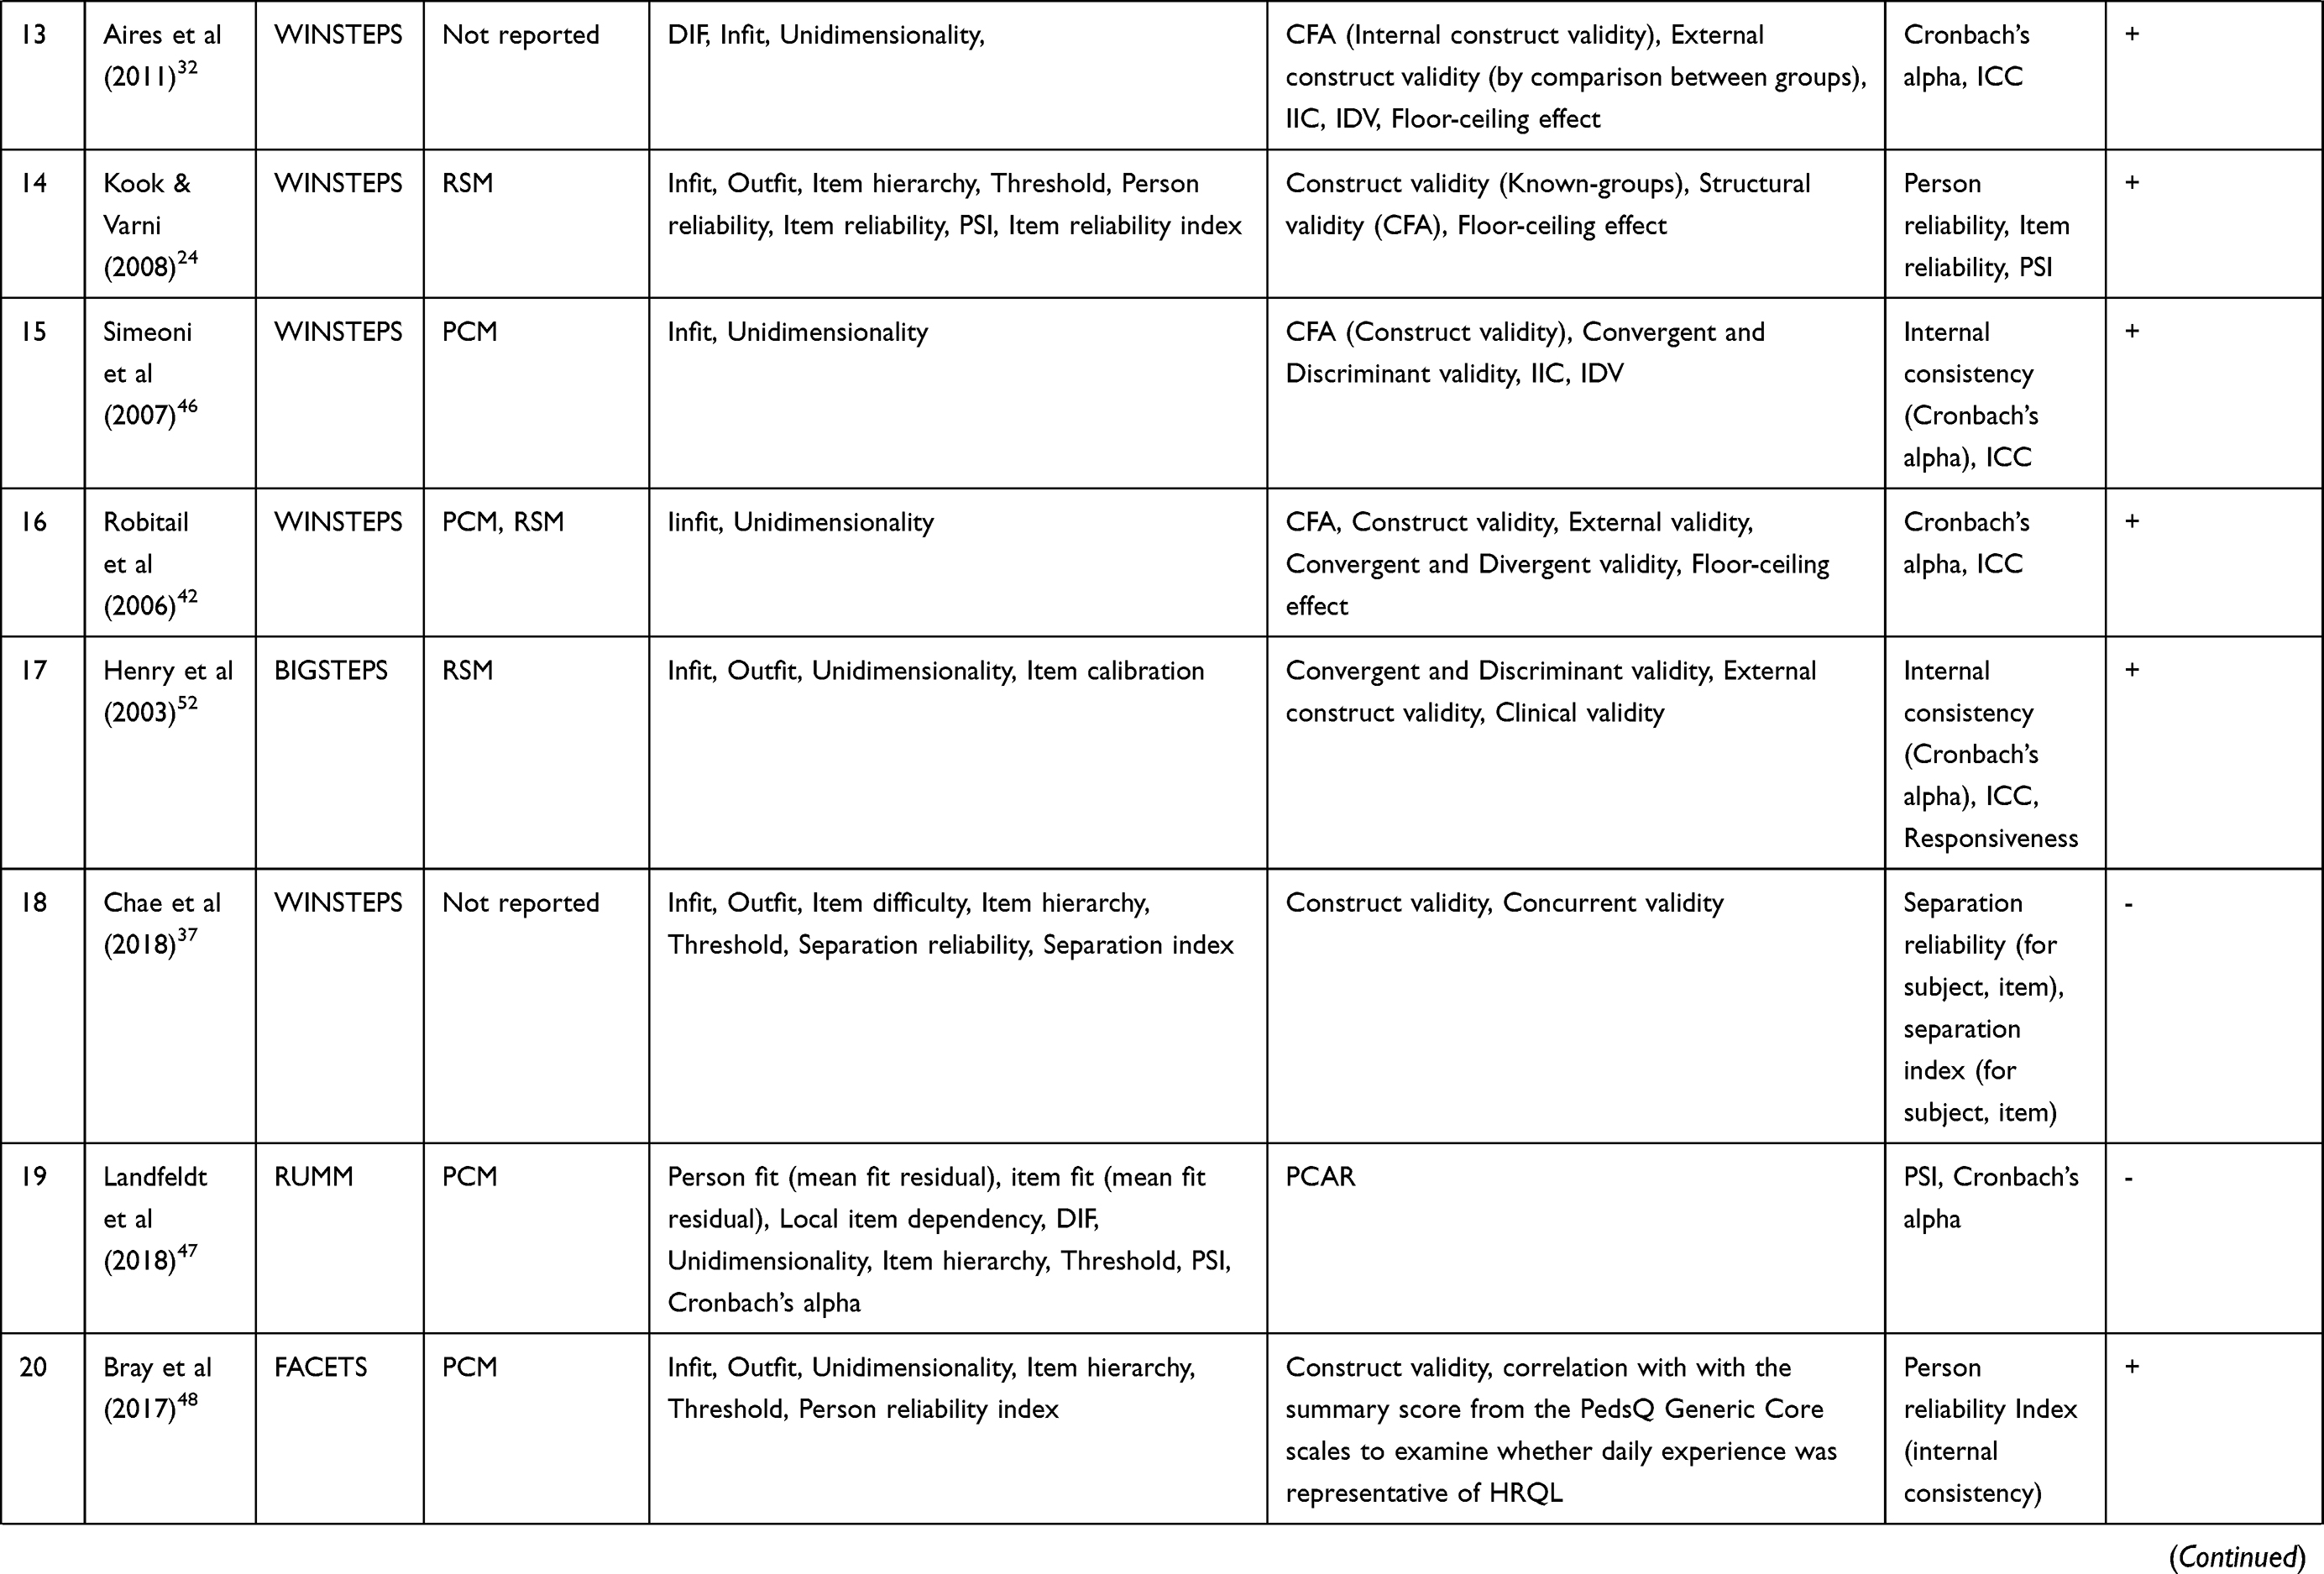
Tables 2 and 3 represent the detailed results for psychometric assessment of the studies. Rasch parameters using the QI checklist are shown in Table 3. The results show that most studies (n = 30, 96.7%) reported the name of the software program for Rasch analysis; WINSTEPS (n = 23, 74.2%), RUMM (n = 3, 9.7%), and WINMIRA (n = 3, 9.7%), respectively. One study (3.2%) used two software programs; WINMIRA and MULTIRA.29 Two studies (6.4%) used other software programs; DIGRAM and FACETS.48,57 Also, 15 studies (48.4%) applied PCM29,31,33–36,38,39,41,45–50 and 6 studies (19.4%) applied RSM as a mathematical Rasch model.24,28,40,51–53 One study (3.2%) used both models.42 In 8 studies (25.8%), no mathematical Rasch model was mentioned.30,32,37,43,44,54–57 As threshold is important for instruments with polytomous item responses, it was observed in 58.1% of the studies (n = 18). It was not mentioned in several studies (n=13, 41.9%).28,30,31,38,42–44,52,55 In studies with disordered threshold, poor items were treated by item deletion45,46,54 or category rescoring.33,40,41,47,51,53,56
 |
 |
 |
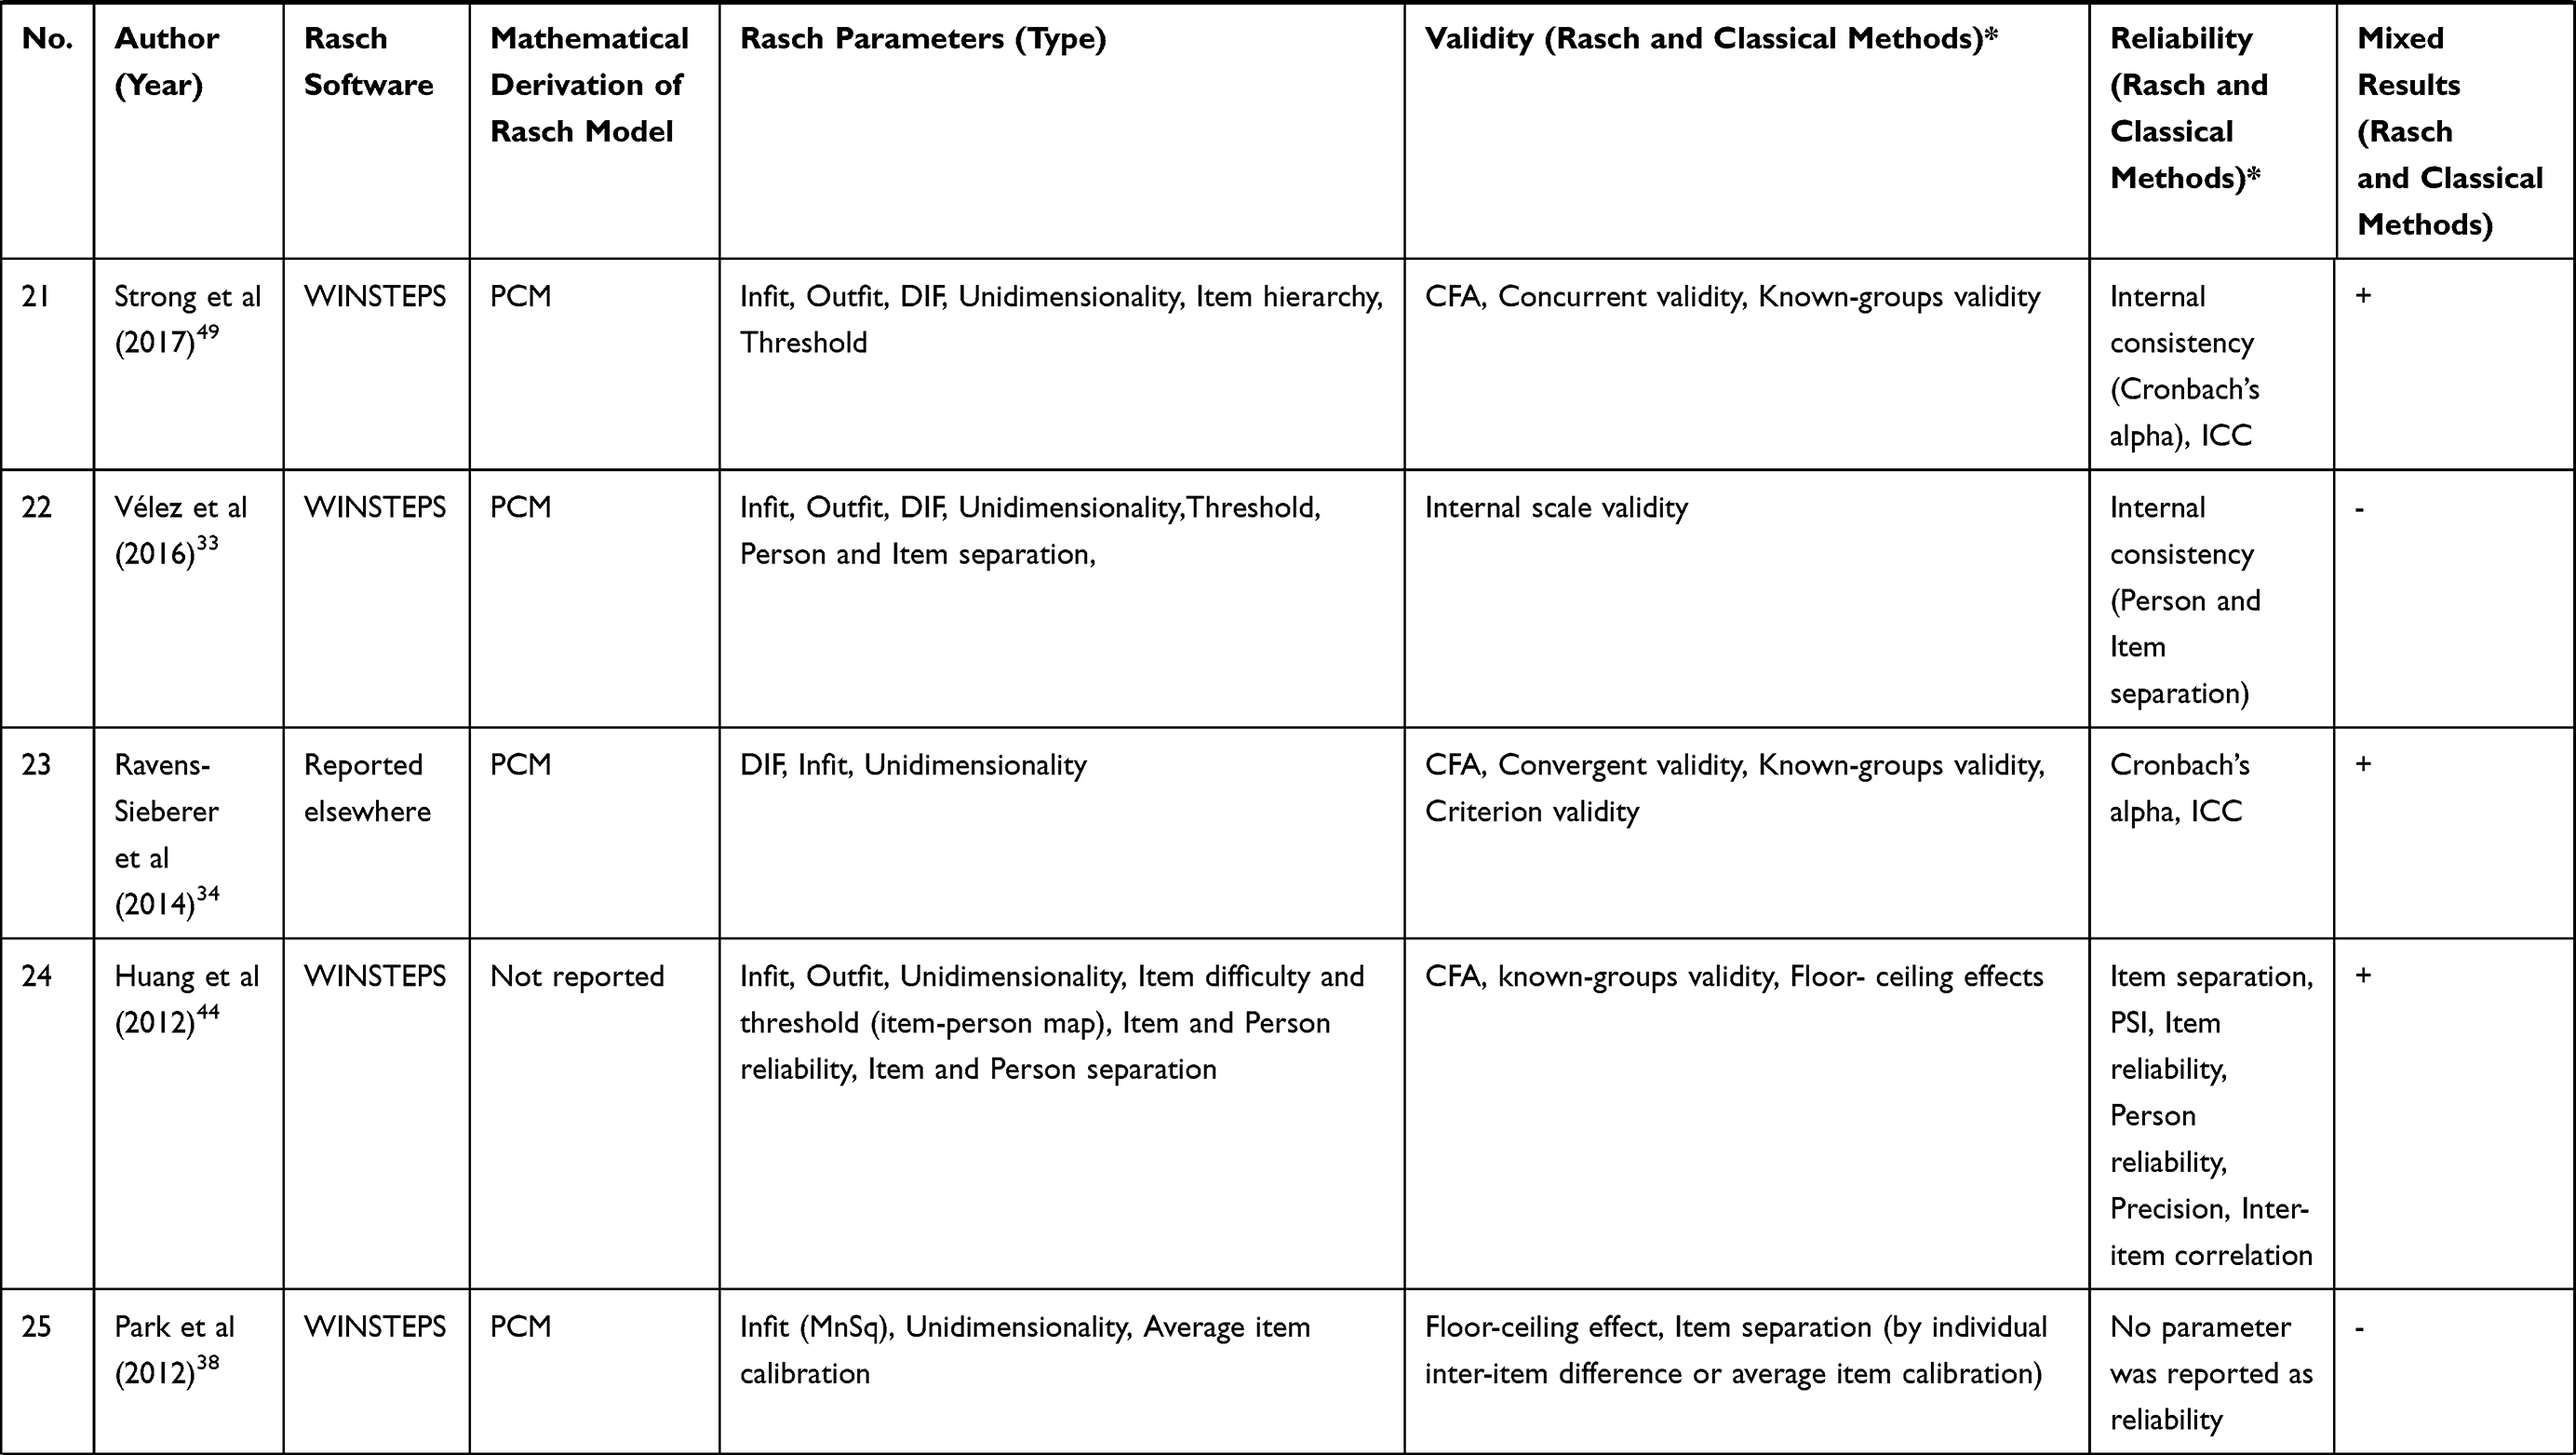 |
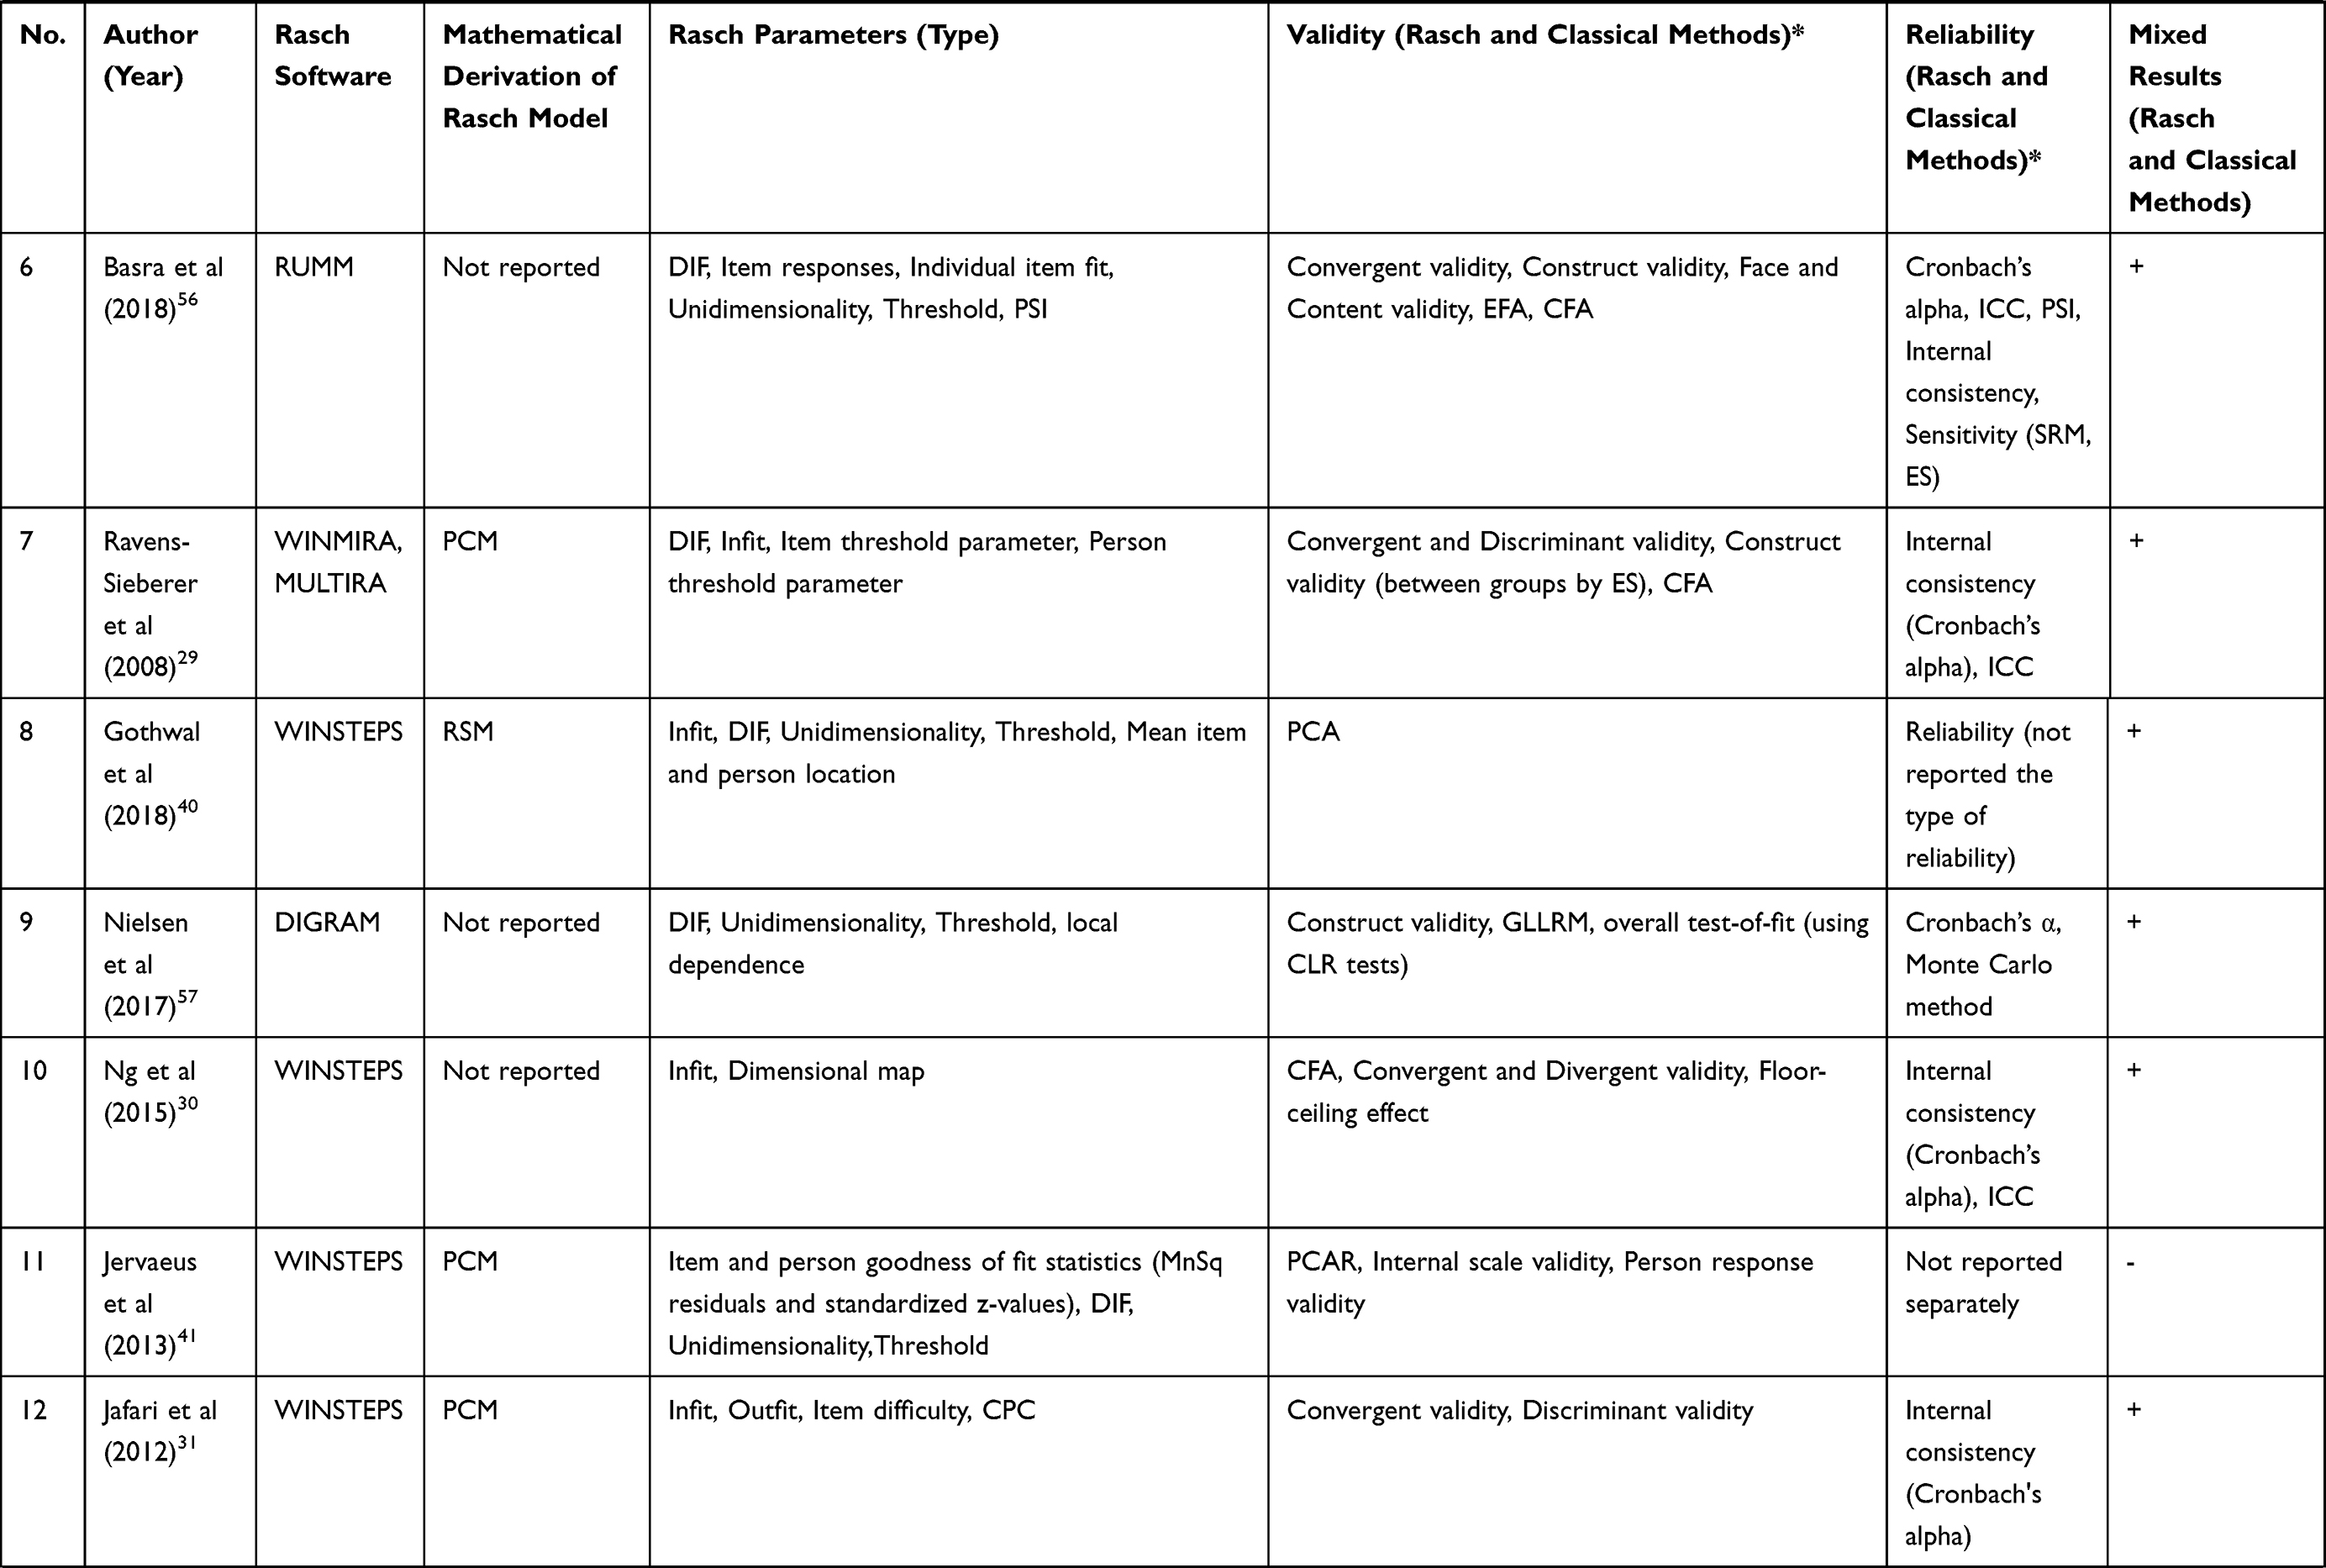
Table 3 Psychometric Properties of the Selected QoL Studies in Adolescents (n = 31) |
Among current studies, most of them (n = 29, 93.5%) reported infit and or outfit mean square for item fit, and a few reported another statistic test (Q-index) (n = 2, 6.4%). Out of these, 2 studies (6.4%) did not address item fit. Only 8 studies (25.8%) reported person fit. 17 studies (54.8%) reported DIF, but 14 studies (45.1%) did not mention it. Based on the reliability results, PSI (n = 10, 32.2%), item separation ratio (n = 6, 19.3%), and Cronbach’s alpha by RUMM (n = 1, 3.2%) were reported in studies. In 3 studies (9.6%), indicators of reliability were not reported. Except for 6 studies (19.3%), the rest of the studies reported unidimensionality (n = 25, 80.6%). In none of the studies was a transformation table drawn (Table 3). According to the QI checklist, around 71% of the studies (n = 22) reported between 4 to 7 Rasch parameters (Table 4). Rasch parameters, including application of the software program (n = 30, 96.7%), test of item fit to the Rasch model (n = 29, 93.5%), unidimensionality (n = 25, 80.6%), type of the identified mathematical Rasch model (n = 23, 74.1%) and threshold (n = 18, 58%) were reported with a higher percentage, respectively. Reliability was reported in most studies using two different approaches; Rasch (n = 12, 38.7%) and classical methods (n = 16, 51.6%). Reliability was not reported in only three studies (9.6%).
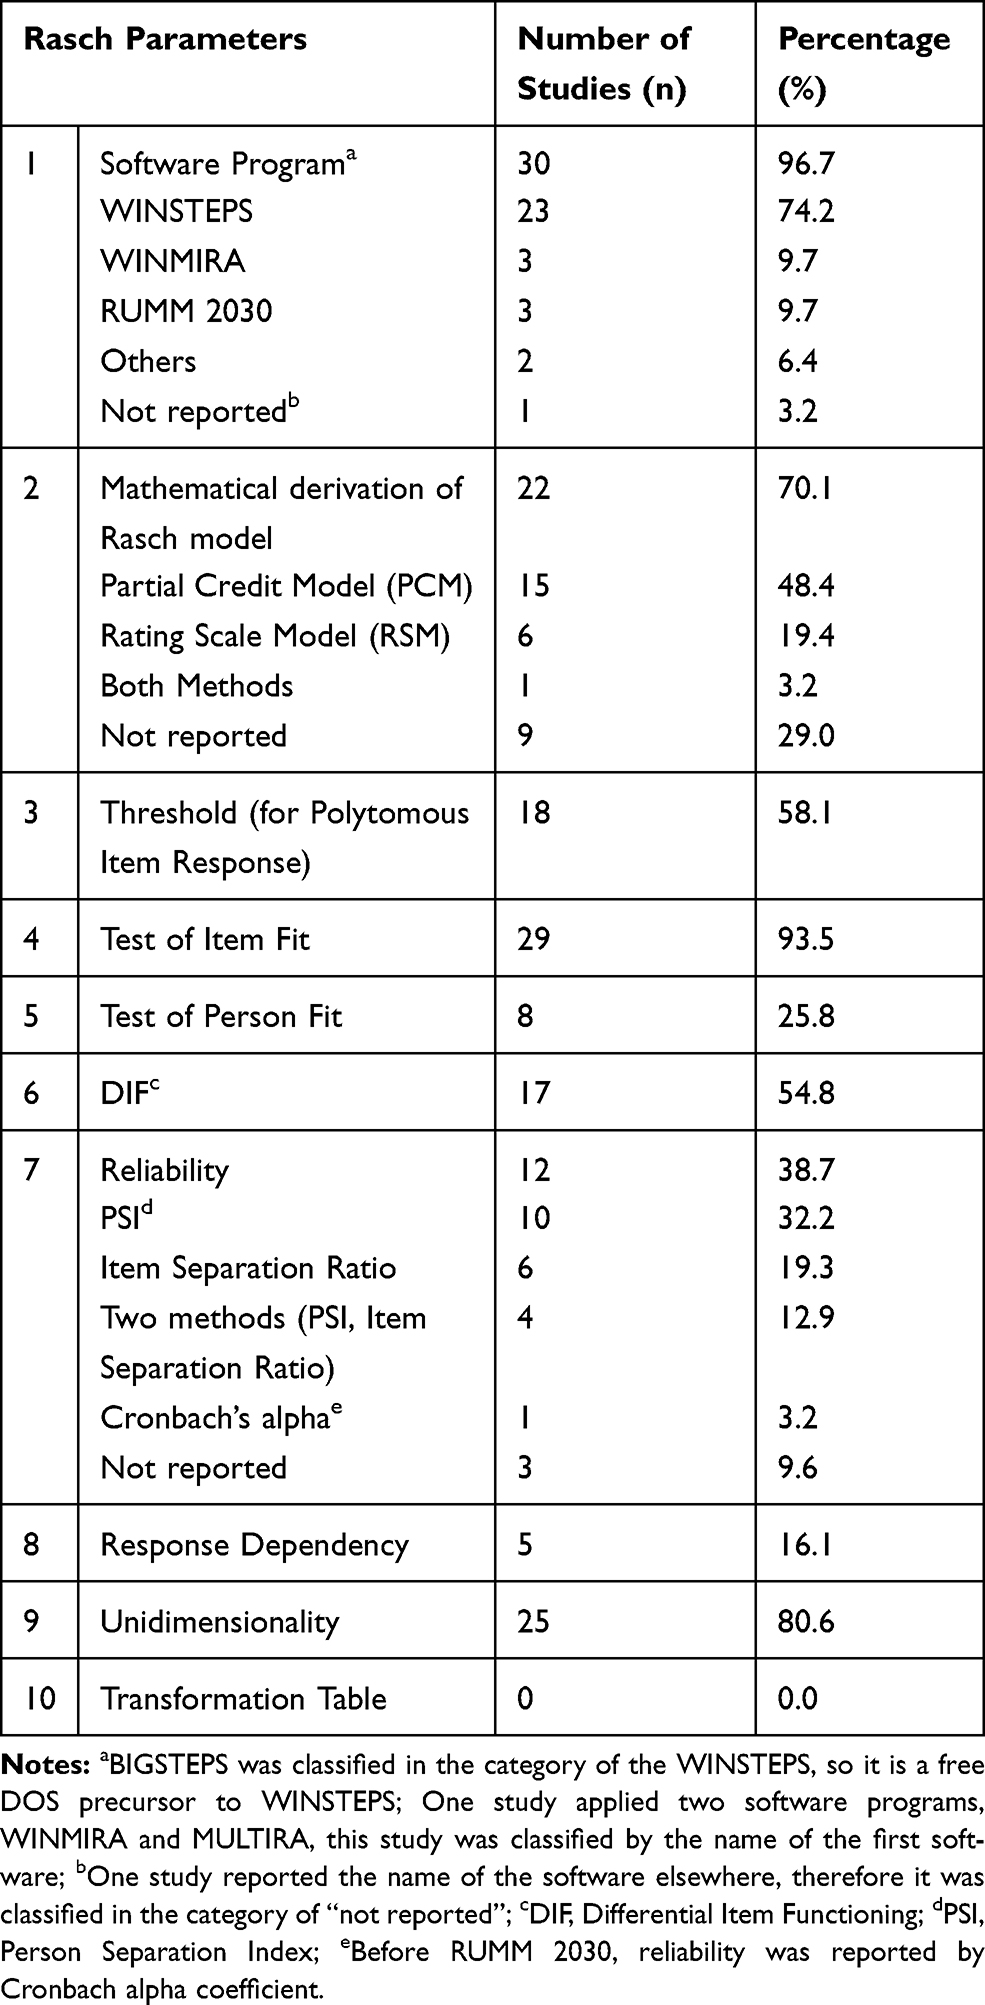 |
Table 4 Evaluation of the Quality of Reporting Rasch Parameters by the QI Checklist in Studies (n = 31) |
Discussion
The present study was conducted aimed at providing a systematic review of the application of Rasch analysis in psychometric assessment studies on adolescents’ QoL instruments. Overall results showed that, most of the selected studies used the Rasch method for instrument testing and fewer for instrument development. Results of this study showed that in the last decade, the number of these studies has increased. The diversity of QoL instruments using Rasch analysis is high, and KIDSCREEN has been mostly used in those studies, as it is applicable to a wide range of healthy and ill adolescents and children (10–18 years of age). This suggests that there is a place for further development and exploration of other QoL instruments in the future. Furthermore, most QoL instruments involve a wide range of ages, so they cover two stages of life, childhood and adolescence, such as KIDSCREEN, PedsQL, CFQ. In some of these instruments, it is not possible to distinguish adolescence from the childhood period, which may reduce their efficiency. In the present study, 12 types of instruments involved a wide range of ages, including childhood and adolescence (ISYQOL, KIDSCREEN, DCGM, PedsQL, CFQ, CHAQ, Sizing Me Up, KIDCAT, HRQOL, PODCI, CVAQC, and PinQ).
Evidence shows that there are a limited number of critical appraisal tools and available guidelines for writing papers in the field of Rasch21,22 and this can probably have an influence on the reporting of Rasch studies. The results of our study indicate that authors have reported a various number of Rasch parameters in their studies. Some parameters, such as application of the software program and test of item fit to the Rasch model were reported in more than 93% of studies. The type of identified mathematical Rasch model was described in more than 74% of studies, and unidimensionality, threshold and DIF were reported in around 80%, 58% and 54% of studies, respectively. But, parameters, such as response dependency, were reported less (around 16%), and the transformation table had not been reported in the selected studies. This is not a surprising result, so the results of an earlier systematic review in the field of rheumatology showed that the application of the transformation table was limited. From 1991 to 2012 in two periods, it was reported as static with a proportion of 11.4% and 12.2%, respectively.21 As the transformation table is a report about converting ordinal scales to the interval for the estimation of responsiveness and clinical changes in outcome variables, this limit can influence the application of Rasch transformed interval measurement in clinical practice. But, according to the study design and type of the QoL instrument, there is a possibility that it has not been in the objective of those studies. However, this can be an area for further development and evaluation of outcome measures in clinical practice in future Rasch QoL studies.
Furthermore, it should be noted that, the QI checklist was used in the present study as a critical appraisal tool to evaluate the quality of reporting of Rasch parameters in those studies,21 but the number of critical appraisal tools for Rasch papers is scarce. Following an extensive search by authors, only the QI checklist and the Rasch Box with 4 items at three levels in the COSMIN (Consensus‐based Standards for selection of health status Measurement Instruments) were found.59 Although, there is a guide with five headings, 22 items and a number of useful references for writing Rasch papers in the Journal of Applied Measurement,58 it has been presented as a general guide and not in the format of a critical appraisal tool. In this study, the QI checklist was applied for assessment of the Rasch parameters in the studies, because of the variety of items and ease of use. QI checklist seems to be a good tool for criticizing Rasch analysis studies, but it is not widely used, so its validity and reliability has not been entirely confirmed. One of the criticisms of this 10-item checklist is an unclear response level for items, and another one is about the method of scoring. However, it seems that there is a requirement for more rigorous critical appraisal tools and guidelines to evaluate the quality of Rasch papers and Rasch parameters. Evidence shows that, few studies have used the QI checklist, and it is recommended to conduct further research on this tool and to identify the strengths and weaknesses of it. Therefore, application of the Rasch model in adolescents’ QoL studies needs a criterion for using necessary parameters, as available evidence indicates that, some papers have only reported several parameters in adolescents’ QoL instruments.
Limitations
There were some limitations in this study. The current systematic review was limited to English language papers, thus information in other languages was not reported in this study. Furthermore, Gray literature, consisting of dissertations and congress abstracts, was not included in the study. Also, we assessed only the presence of Rasch parameters according to the QI checklist without evaluating the quality of parameters’ analysis.
Conclusions
Application of the Rasch model for psychometric assessment of adolescents’ QoL instruments has increased in recent decades. There were 20 types of adolescents’ QoL instruments which were evaluated by the Rasch models. The most commonly used instrument was, KIDSCREEN, administered in different countries. Six Rasch parameters were reported with a higher percentage in the studies, including application of the software program (96.7%), test of item fit to the Rasch model (93.5%), unidimensionality (80.6%), type of the identified mathematical Rasch model (74.1%), threshold (58%) and DIF (54.8%). Our results indicate that although Rasch analysis is a robust method in adolescents’ QoL studies due to documented instruments’ measurement functioning, no access to the strong critical appraisal tools may influence the high power application of it.
Author Contributions
All authors made substantial contributions to conception and design, acquisition of data, or analysis and interpretation of data; took part in drafting the article or revising it critically for important intellectual content; agreed on the journal to which the article will be submitted; gave final approval of the version to be published; and agree to be accountable for all aspects of the work.
Funding
There was no funding.
Disclosure
The authors declare that they have no competing interests.
References
1. Huang Y, Zhong X-N, Li Q-Y, et al. Health-related quality of life of the rural-China left-behind children or adolescents and influential factors: a cross-sectional study. Health Qual Life Outcomes. 2015;13(1):29. doi:10.1186/s12955-015-0220-x
2. World Health Organization (WHO). Recognizing adolescence. WHO; 2014. Available from: https://apps.who.int/adolescent/second-decade/section2/page1/recognizing-adolescence.html.
3. Adamson P, Bradshaw J, Hoelscher P, Richardson D Child poverty in perspective: an overview of child well-being in rich countries; 2007. Available from: https://www.unicef-irc.org/publications/pdf/rc7_eng.pdf.
4. World Health Organization (WHO). Adolescent friendly health services: an agenda for change. World Health Organization. 2002. Available from: https://apps.who.int/iris/handle/10665/67923.
5. Solans M, Pane S, Estrada MD, et al. Health‐related quality of life measurement in children and adolescents: a systematic review of generic and disease‐specific instruments. Value Health. 2008;11(4):742–764. doi:10.1111/j.1524-4733.2007.00293.x
6. Temin M, Levine R Start with a girl: a new agenda for global health: center for Global Development; 2009. Availale from: https://www.cgdev.org/sites/default/files/1422899_file_Start_with_a_Girl_FINAL_0.pdf.
7. Dijkhuis RR, Ziermans TB, Van Rijn S, Staal WG, Swaab H. Self-regulation and quality of life in high-functioning young adults with autism. Autism. 2017;21(7):896–906. doi:10.1177/1362361316655525
8. World Health Organization (WHO). WHOQOL: measuring quality of life. Available from: https://www.who.int/healthinfo/survey/whoqol-qualityoflife/en/.
9. O’Connor RM. Measuring Quality of Life in Health. Edinburgh: Churchill Livingstone; 2004.
10. Bakas T, McLennon SM, Carpenter JS, et al. Systematic review of health-related quality of life models. Health Qual Life Outcomes. 2012;10(1):134. doi:10.1186/1477-7525-10-134
11. Netuveli G, Blane D. Quality of life in older ages. Br Med Bull. 2008;85(1):113–126. doi:10.1093/bmb/ldn003
12. Reich M, Lesur A, Perdrizet-Chevallier C. Depression, quality of life and breast cancer: a review of the literature. Breast Cancer Res Treat. 2008;110(1):9–17. doi:10.1007/s10549-007-9706-5
13. Moslehi S, Atefimanesh P, Farid AA. The relationship between problem-focused coping strategies and quality of life in schizophrenic patients. Med J Islam Repub Iran. 2015;29:288.
14. Kagawa-Singer M, Padilla GV, Ashing-Giwa K, editors. Health-Related Quality of Life and Culture. Seminars in Oncology Nursing. Elsevier; 2010.
15. Grant M, Sun V, editors. Advances in Quality of Life at the End of Life. Seminars in Oncology Nursing. Elsevier; 2010.
16. Sun A, Wong‐Kim E, Stearman S, Chow EA. Quality of life in Chinese patients with breast cancerm. Cancer. 2005;104(S12):2952–2954. doi:10.1002/cncr.21516
17. Polit DF, Beck CT. Nursing Research: Generating and Assessing Evidence for Nursing Practice. Lippincott Williams & Wilkins; 2008.
18. Wilson M, Hoskens M. Multidimensional Item Responses: Multimethod-Multitrait Perspectives. Applied Rasch Measurement: A Book of Exemplars. Springer; 2005.
19. Wang W-C, Yao G, Tsai Y-J, Wang J-D, Hsieh C-L. Validating, improving reliability, and estimating correlation of the four subscales in the WHOQOL-BREF using multidimensional Rasch analysis. Qual Life Res. 2006;15(4):607–620. doi:10.1007/s11136-005-4365-7
20. Moher D, Liberati A, Tetzlaff J, Altman DG; The PRISMA Group. Preferred reporting items for systematic reviews and meta- analyses: the PRISMA statement. PLoS Med. 2009;6(7):e1000097. doi:10.1371/journal.pmed1000097
21. Leung -Y-Y, Png M-E, Conaghan P, Tennant A. A systematic literature review on the application of Rasch analysis in musculoskeletal disease-A special interest group report of OMERACT 11. J Rheumatol. 2014;41(1):159–164. doi:10.3899/jrheum.130814
22. Tennant A, Conaghan PG. The Rasch measurement model in rheumatology: what is it and why use it? When should it be applied, and what should one look for in a Rasch paper? Arthritis Care Res (Hoboken). 2007;57(8):1358–1362.
23. Kelderman H. Multidimensional Rasch models for partial-credit scoring. Appl Psychol Meas. 1996;20(2):155–168. doi:10.1177/014662169602000205
24. Kook SH, Varni JW. Validation of the Korean version of the pediatric quality of life inventory™ 4.0 (PedsQL™) generic core scales in school children and adolescents using the Rasch model. Health Qual Life Outcomes. 2008;6(1):41. doi:10.1186/1477-7525-6-41
25. Hagquist C, Andrich D. Recent advances in analysis of differential item functioning in health research using the Rasch model. Health Qual Life Outcomes. 2017;15(1):1–8. doi:10.1186/s12955-017-0755-0
26. Andrich D. The Rasch Model Explained. Applied Rasch Measurement: A Book of Exemplars. Springer; 2005.
27. Linacre JM. User’s Guide to WINSTEPS. Chicago, IL: MESA Press; 2011.
28. Sapin C, Simeoni M-C, El Khammar M, Antoniotti S, Auquier P. Reliability and validity of the VSP-A, a health-related quality of life instrument for ill and healthy adolescents. J Adolesc Health. 2005;36(4):327–336. doi:10.1016/j.jadohealth.2004.01.016
29. Ravens-Sieberer U, Gosch A, Rajmil L, et al. The KIDSCREEN-52 quality of life measure for children and adolescents: psychometric results from a cross-cultural survey in 13 European countries. Value Health. 2008;11(4):645–658. doi:10.1111/j.1524-4733.2007.00291.x
30. Ng JY, Burnett A, Ha AS, Sum KW. Psychometric properties of the Chinese (Cantonese) versions of the KIDSCREEN health-related quality of life questionnaire. Qual Life Res. 2015;24(10):2415–2421. doi:10.1007/s11136-015-0973-z
31. Jafari P, Bagheri Z, Safe M. Item and response-category functioning of the Persian version of the KIDSCREEN-27: Rasch partial credit model. Health Qual Life Outcomes. 2012;10(1):127. doi:10.1186/1477-7525-10-127
32. Aires MT, Auquier P, Robitail S, Werneck GL, Simeoni M-C. Cross-cultural adaptation and psychometric properties of the Brazilian-Portuguese version of the VSP-A (Vécu et Santé Perçue de l’Adolescent), a health-related quality of life (HRQoL) instrument for adolescents, in a healthy Brazilian population. BMC Pediatr. 2011;11(1):8. doi:10.1186/1471-2431-11-8
33. Vélez C-M, Lugo-Agudelo L-H, Hernández-Herrera G-N, García-García H-I. Colombian Rasch validation of KIDSCREEN-27 quality of life questionnaire. Health Qual Life Outcomes. 2016;14(1):67. doi:10.1186/s12955-016-0472-0
34. Ravens-Sieberer U, Herdman M, Devine J, et al. The European KIDSCREEN approach to measure quality of life and well-being in children: development, current application, and future advances. Qual Life Res. 2014;23(3):791–803.
35. Erhart M, Hagquist C, Auquier P, et al. A comparison of Rasch item‐fit and Cronbach’s alpha item reduction analysis for the development of a quality of life scale for children and adolescents. Child Care Health Dev. 2010;36(4):473–484.
36. Robitail S, Ravens-Sieberer U, Simeoni M-C, et al. Testing the structural and cross-cultural validity of the KIDSCREEN-27 quality of life questionnaire. Qual Life Res. 2007;16(8):1335–1345. doi:10.1007/s11136-007-9241-1
37. Chae S, Park E-Y, Choi Y-I. The psychometric properties of the Childhood Health Assessment Questionnaire (CHAQ) in children with cerebral palsy. BMC Neurol. 2018;18(1):151. doi:10.1186/s12883-018-1154-9
38. Park MS, Chung CY, Lee KM, et al. Rasch analysis of the pediatric outcomes data collection instrument in 720 patients with cerebral palsy. J Pediatr Orthop. 2012;32(4):423–431. doi:10.1097/BPO.0b013e31824b2a1f
39. Erhart M, Ravens-Sieberer U, Dickinson HO, Colver A. Rasch measurement properties of the KIDSCREEN quality of life instrument in children with cerebral palsy and differential item functioning between children with and without cerebral palsy. Value Health. 2009;12(5):782–792. doi:10.1111/j.1524-4733.2009.00508.x
40. Gothwal VK, Bharani S, Mandal AK. Parent-child agreement on health-related quality of life in congenital glaucoma. Transl Vis Sci Technol. 2018;7(4):15. doi:10.1167/tvst.7.4.15
41. Jervaeus A, Kottorp A, Wettergren L. Psychometric properties of KIDSCREEN-27 among childhood cancer survivors and age matched peers: a Rasch analysis. Health Qual Life Outcomes. 2013;11(1):96. doi:10.1186/1477-7525-11-96
42. Robitail S, Simeoni M-C, Erhart M, et al. Validation of the European proxy KIDSCREEN-52 pilot test health-related quality of life questionnaire: first results. J Adolesc Health. 2006;39(4):
43. Huang I-C, Wen P-S, Revicki DA, Shenkman EA. Quality of life measurement for children with life-threatening conditions: limitations and a new framework. Child Indic Res. 2011;4(1):145–160. doi:10.1007/s12187-010-9079-x
44. Huang I-C, Quinn GP, Wen P-S, et al. Using three legacy measures to develop a health-related quality of life tool for young adult survivors of childhood cancer. Qual Life Res. 2012;21(8):1437–1450. doi:10.1007/s11136-011-0055-9
45. Caronni A, Sciumè L, Donzelli S, Zaina F, Negrini S. ISYQOL: a Rasch-consistent questionnaire for measuring health-related quality of life in adolescents with spinal deformities. Spine J. 2017;17(9):1364–1372. doi:10.1016/j.spinee.2017.05.022
46. Simeoni M-C, Schmidt S, Muehlan H, Debensason D, Bullinger M, Group D. Field testing of a European quality of life instrument for children and adolescents with chronic conditions: the 37-item DISABKIDS chronic generic module. Qual Life Res. 2007;16(5):881–893. doi:10.1007/s11136-007-9188-2
47. Landfeldt E, Mayhew A, Straub V, Lochmüller H, Bushby K, Lindgren P. Psychometric analysis of the pediatric quality of life inventory 3.0 neuromuscular module administered to patients with duchenne muscular dystrophy: a Rasch analysis. Muscle Nerve. 2018;58(3):367–373. doi:10.1002/mus.26109
48. Bray P, Bundy AC, Ryan MM, North KN. Can in-the-moment diary methods measure health-related quality of life in Duchenne muscular dystrophy? Qual Life Res. 2017;26(5):1145–1152. doi:10.1007/s11136-016-1442-z
49. Strong C, Lin Y-C, Tsai M-C, Lin C-Y. Factor structure of sizing me up, a self-reported weight-related quality of life instrument, in community children across weight status. Child Obes. 2017;13(2):111–119. doi:10.1089/chi.2016.0259
50. Bower W, Wong E, Yeung C. Development of a validated quality of life tool specific to children with bladder dysfunction. Neurourol Urodyn. 2006;25(3):221–227. doi:10.1002/nau.20171
51. Caronni A, Zaina F, Negrini S. Improving the measurement of health-related quality of life in adolescent with idiopathic scoliosis: the SRS-7, a Rasch-developed short form of the SRS-22 questionnaire. Res Dev Disabil. 2014;35(4):784–799. doi:10.1016/j.ridd.2014.01.020
52. Henry B, Aussage P, Grosskopf C, Goehrs J-M. Development of the Cystic Fibrosis Questionnaire (CFQ) for assessing quality of life in pediatric and adult patients. Qual Life Res. 2003;12(1):63–76. doi:10.1023/A:1022037320039
53. Khadka J, Ryan B, Margrain TH, Woodhouse JM, Woodhouse JM. Development of the 25-item Cardiff visual ability questionnaire for children (CVAQC). Br J Ophthalmol. 2010;94(6):730–735. doi:10.1136/bjo.2009.171181
54. Oluboyede Y, Hulme C, Hill A. Development and refinement of the WAItE: a new obesity-specific quality of life measure for adolescents. Qual Life Res. 2017;26(8):2025–2039.
55. Smidt AC, Lai J-S, Cella D, Patel S, Mancini AJ, Chamlin SL. Development and validation of Skindex-Teen, a quality-of-life instrument for adolescents with skin disease. Arch Dermatol. 2010;146(8):865–869. doi:10.1001/archdermatol.2010.161
56. Basra M, Salek M, Fenech D, Finlay AY. Conceptualization, development and validation of T‐QoL©(Teenagers’ Quality of Life): a patient‐focused measure to assess quality of life of adolescents with skin diseases. Br J Dermatol. 2018;178(1):161–175. doi:10.1111/bjd.15853
57. Nielsen JB, Kyvsgaard JN, Sildorf SM, Kreiner S, Svensson J. Item analysis using Rasch models confirms that the Danish versions of the DISABKIDS® chronic-generic and diabetes-specific modules are valid and reliable. Health Qual Life Outcomes. 2017;15(1):44. doi:10.1186/s12955-017-0618-8
58. Smith R, Linacre J, Smith E. Guidelines for manuscripts. J Appl Meas. 2003;4(2):198–204.
59. Mokkink LB, Prinsen CA, Bouter LM, de Vet HC, Terwee CB. The COnsensus-based Standards for the selection of health Measurement INstruments (COSMIN) and how to select an outcome measurement instrument. Braz J Phys Ther. 2016;20(2):105–113. doi:10.1590/bjpt-rbf.2014.0143
 © 2020 The Author(s). This work is published and licensed by Dove Medical Press Limited. The full terms of this license are available at https://www.dovepress.com/terms.php and incorporate the Creative Commons Attribution - Non Commercial (unported, v3.0) License.
By accessing the work you hereby accept the Terms. Non-commercial uses of the work are permitted without any further permission from Dove Medical Press Limited, provided the work is properly attributed. For permission for commercial use of this work, please see paragraphs 4.2 and 5 of our Terms.
© 2020 The Author(s). This work is published and licensed by Dove Medical Press Limited. The full terms of this license are available at https://www.dovepress.com/terms.php and incorporate the Creative Commons Attribution - Non Commercial (unported, v3.0) License.
By accessing the work you hereby accept the Terms. Non-commercial uses of the work are permitted without any further permission from Dove Medical Press Limited, provided the work is properly attributed. For permission for commercial use of this work, please see paragraphs 4.2 and 5 of our Terms.