")
Back to Journals » Journal of Inflammation Research » Volume 14
Application of Artificial Intelligence Modeling Technology Based on Multi-Omics in Noninvasive Diagnosis of Inflammatory Bowel Disease
Authors Huang Q, Zhang X, Hu Z
Received 16 February 2021
Accepted for publication 21 April 2021
Published 14 May 2021 Volume 2021:14 Pages 1933—1943
DOI https://doi.org/10.2147/JIR.S306816
Checked for plagiarism Yes
Review by Single anonymous peer review
Peer reviewer comments 2
Editor who approved publication: Dr Monika Sharma
Qiongrong Huang,1,2 Xiuli Zhang,2 Zhiyuan Hu1– 4
1Fujian Provincial Key Laboratory of Brain Aging and Neurodegenerative Diseases, School of Basic Medical Sciences, Fujian Medical University, Fuzhou, 350108, Fujian Province, People’s Republic of China; 2CAS Key Laboratory of Standardization and Measurement for Nanotechnology, CAS Key Laboratory for Biomedical Effects of Nanomaterials and Nanosafety, CAS Center for Excellence in Nanoscience, National Center for Nanoscience and Technology of China, Beijing, 100190, People’s Republic of China; 3School of Nanoscience and Technology, Sino-Danish College, University of Chinese Academy of Sciences, Beijing, 100049, People’s Republic of China; 4School of Chemical Engineering and Pharmacy, Wuhan Institute of Technology, Wuhan, 430205, People’s Republic of China
Correspondence: Zhiyuan Hu
Fujian Provincial Key Laboratory of Brain Aging and Neurodegenerative Diseases, School of Basic Medical Sciences, Fujian Medical University, Fuzhou, 350108, Fujian Province, People’s Republic of China
Tel/Fax +86 10 6265 2116
Email [email protected]
Xiuli Zhang
National Center for Nanoscience and Technology (NCNST),No.11 ZhongGuanCun BeiYiTiao, Beijing, 100190, People’s Republic of China
Tel +010 8254 5752
Email [email protected]
Purpose: Inflammatory bowel disease (IBD) is difficult to diagnose and classify. The purpose of this study is to establish an artificial intelligence model based on fecal multi-omics data for multi-classification diagnosis of IBD and its subtypes.
Materials and Methods: A total of 299 clinical cohort studies were included in this study, including 86 healthy people, 140 CD patients and 73 UC patients. Based on the idea of hierarchical modeling for different groups, we model the total population and the groups with self-evaluation of “very well” and “slightly below par”, respectively. The original total features were fecal multi-omics data, including metagenomics, metatranscriptomics, proteomics, metabolomics, viromics, faecal calprotectin. The importance, collinearity and other feature engineering methods were used to evaluate the features. Finally, three individualized diagnosis models with less features and high accuracy were obtained.
Results: First, we screened 111 features to form the optimal feature set for the total population and established a three-classification individual diagnosis model with AUC of 0.83, which can simultaneously diagnose health, CD and UC. Secondly, according to the hierarchical modeling of the total population, we established two models for population with different self-evaluation. For “very well” population, we screened 59 features and established a three-classification diagnostic model with AUC of 0.85. For the self-evaluation population with “slightly below par”, we finally included 22 features and established a three-classification diagnostic model with AUC of 0.84. Only metabolomics and metatranscriptomics features were included in the optimal feature sets.
Conclusion: This study provides a valuable method for high accuracy, noninvasive diagnosis and subtype identification of IBD patients. Researchers can choose biomarkers in different models according to different self-evaluation of patients. Simple noninvasive fecal sampling can be used to detect metabolomics and metatranscriptomics data, thus replacing the tedious and painful clinical colonoscopy and biopsy procedures.
Keywords: inflammatory bowel diseases, artificial intelligence, multi-omics, noninvasive, precision medicine
Introduction
Inflammatory bowel disease (IBD) is a chronic and incurable disease with a high incidence rate, which seriously affects patients’ health and life span.1,2 IBD mainly includes Crohn’s disease (CD) and ulcerative colitis (UC).3 Intestinal tract is the largest immune organ in human body. The imbalance of host intestinal microenvironment is closely related to a variety of intestinal diseases.4 Therefore, the accurate diagnosis of IBD and its subtypes and other intestinal diseases is very important.
At present, the clinical diagnosis of IBD and its subtypes are mostly invasive methods such as colonoscopy and pathological examination.5 Mossotto et al reported their support vector machine (SVM) model, which distinguishes CD and UC with an accuracy of 0.833 in test data set (48 people), using only eight histological and endoscopic features.6 In a study of identifying the severity of IBD, they use convolutional neural network model to distinguish mayo 0 vs mayo 1–3 with an AUC of 0.86 in 3981 pictures of 114 UC patients. The AUC for distinguishing mayo 0–1 vs mayo 2–3 was 0.98.7 The defect of invasive testing is that patients bear more pain, risk and cost. Using blood and stool samples for noninvasive detection and artificial intelligence modeling analysis is expected to solve the diagnosis dilemma of IBD patients. Franzosa et al established a random forest model based on the multi-omics data of fecal samples for the diagnosis of CD, UC and control groups. When only 47 metabolite features were used, the accuracy of training set was 63.87%, and that of independent test set was 76.9%. When 76 features (47 metabolite features + 29 microbial features) were used, the accuracy of training set was 65.16%, and that of independent test set was 76.92%.8 There is still room for improvement in the existing three classification diagnosis models for patients with nonIBD, CD and UC.
In this study, we established an artificial intelligence diagnosis model based on 6-dimensional multi-omics data of stool samples from nonIBD, CD and UC groups. In order to accurately stratify the target population, we implemented feature engineering and deep learning modeling for patients with different self-evaluation. The results showing that among the people who self-evaluated as “very well”, 59 features were used to identify nonIBD, UC and CD, achieving an AUC of 0.8503. Similarly, among people who self-evaluated as “slightly below par”, only 22 features were used to obtain an AUC of 0.8355. This study provides more non-invasive diagnostic technology for IBD patients with different self-evaluation status.
Data and Methods
We download all available data from the Inflammatory Bowel Disease Multi-omics Database (IBDMDB) database portal at http://ibdmdb.org/protocols provided by Lloyd-Price et al.4 The available data includes of microbial metagenomics, metatranscriptomics, metabolomics, proteomics, viromics and host faecal calprotectin obtained from stool, 16S rRNA gene sequencing and host transcriptomes obtained from colon biopsy tissues, and serological profiles obtained from blood samples. Due to the lack of data at a large number of sampling time points, we comprehensively considered the maximum number of samples and omics that can be included in the analysis. A total of 6 omics were included in the analysis process, including microbial metagenomics, metatranscriptomics, metabolomics, proteomics, viromics and host faecal calprotectin.
Data preprocessing uses Python (v.3.8). The process includes removing features with a missing rate higher than 5%, then filling in missing values with min/2 of each feature. Then the z-score standardization (0–1 standardization) method is performed to make the data obey the N (0,1) distribution.
Feature engineering dimensionality reduction includes two aspects: the importance of features and the collinearity between features. Feature importance selection uses recursive feature elimination cross validation (RFECV) to eliminate low importance. First, we choose a linear model to calculate all feature coefficients, then make a loop to eliminate zero importance features until the decrease in the number of features threatens the accuracy of prediction. This method is provided in RFECV function which is in the scikit-learn library in Python. The screening of high collinearity features uses the “identify_collinear” function of the Feature Selector to calculate the correlation coefficient between the features. We set the threshold at 0.9 and remove the features whose correlation is greater than 0.9. The machine learning models we use include linear model and nonlinear model. Among them, the linear model uses linear support vector machine, and the nonlinear model includes AdaBoost, random forest and multilayer perceptron. Among them, linear support vector machine, random forest, AdaBoost use the function of scikit learn module of python, multilayer perceptron, and python module of Python. In the above four models, we use default parameters for the first three models; for multilayer, we use the default parameters Perceptron, we use a feedforward neural network composed of eight hidden layers and one output layer.
Results and Discussion
All samples of 6 omics sampled at the same time are included in the first model. The feature engineering process of this model included a total of 144 samples (69 people). 144 samples were randomly divided into training set (100 samples) and test set (44 samples) at a ratio of 3:1, then the training set is divided into training set (75 samples) and validation set (25 samples) at the ratio of 4:1. First, we input all features into feature engineering screening. All features are filtered by RFECV three times with steps of 0.01, 3, and 1, respectively. The “cumulative importance” threshold is set to 1, and all features with a contribution degree of 0 are removed to obtain 355 features (Figure 1A). Then, we filter 355 features through collinearity, delete all features with collinearity higher than 0.9, leaving 111 features (Figure 1B). Through these two screening steps, we successfully filtered out the non-redundant features that are most important for subtype identification. The remaining noise features do not participate in the final model prediction. 111 features, which consists of 96 metabolites and 15 metatranscripts (Figure 1C). We use these 111 features to test in all datasets. No cross-validation is used between the training set, validation set, and test set. The testB contains 155 samples (76 persons), of which the number of samples is nonIBD: UC: CD =38:41:76 (number of people=18:20:38). In conclusion, the model included a total of 299 samples for prediction, of which the ratio of nonIBD: UC: CD samples was 86:73:140 (number of people=26:28:46) (Supplementary Figure s1A).
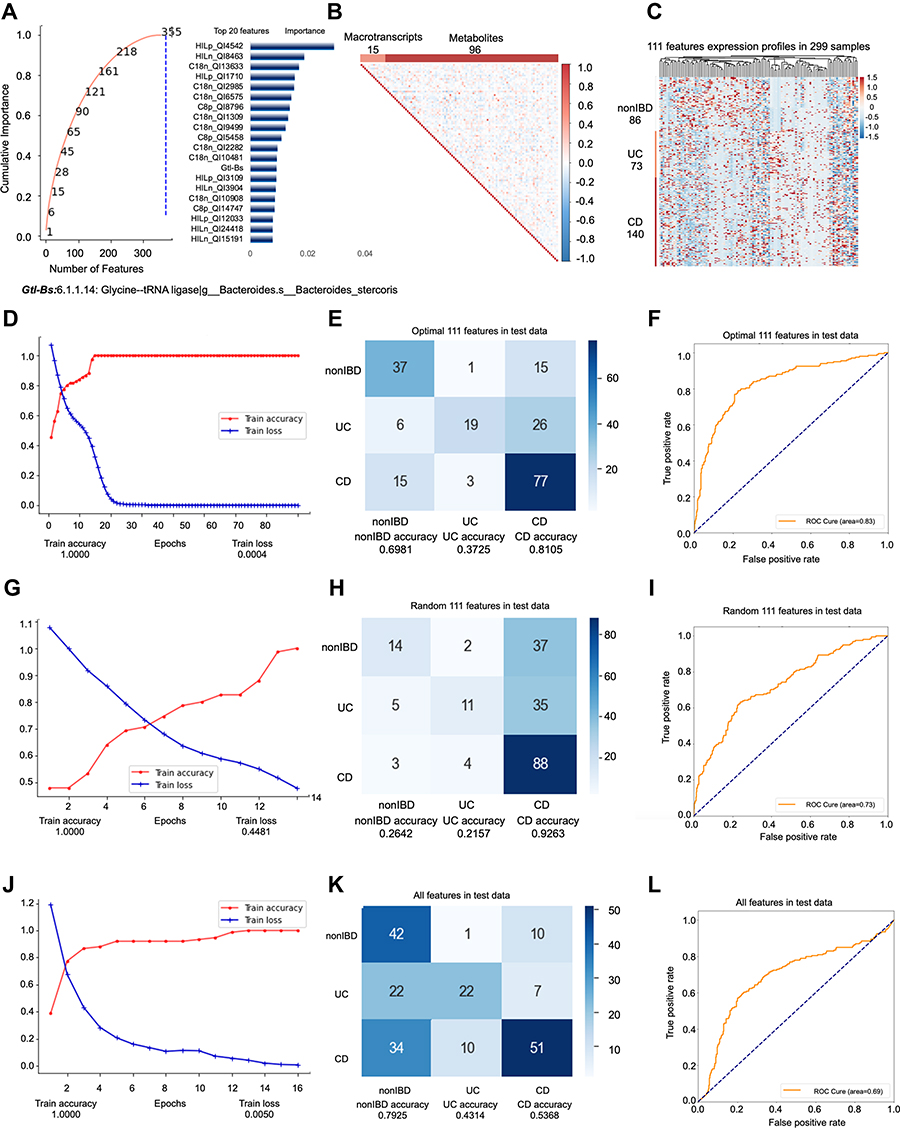 |
Figure 1 Key information and results of model 1 modeling. Notes: In the importance screening process, the cumulative importance scores of the features obtained in the third importance screening (left) and the 20 features with the highest importance scores (right) (A). The correlation between 111 features obtained through collinearity screening, 111 features including 15 metatranscripts and 96 metabolites (B). The expression of 111 features in 299 samples. The samples are arranged in the order of nonIBD, UC and CD. The distance between features is calculated using Canberra distance, and the clustering method uses complete linkage (C). Using the optimal 111 features modeling, the accuracy and the loss value of the training dataset in 300 epochs (D). The confusion matrix of the optimal 111 features (E). The AUC score of the optimal 111 features (F). Using the random 111 features modeling, the accuracy and the loss value of the training dataset in 300 epochs (G). The confusion matrix of the random 111 features (H). The AUC score of the random 111 features (I). Using the all features modeling, the accuracy and the loss value of the training dataset in 300 epochs (J). The confusion matrix of the all features (K). The AUC score of the all features (L). |
In order to further examine the superiority of the features after dimensionality reduction, we compare the prediction performance of the optimal 111 features (Accuracy=0.6683; AUC=0.8280) (Figure 1D–F, Supplementary Figure s1B-E) with the same number of random 111 features (Accuracy=0.5678; AUC=0.7314) (Figure 1G–I) and all features (Accuracy=0.5779; AUC=0.6885) (Figure 1J–L) without dimensionality reduction. It turns out that even though the number of original features without dimensionality reduction far exceeds 111, the prediction performance of the model is far lower than the optimal 111 features. This phenomenon shows that the original features contain a lot of noise, which interferes with or even misleads the prediction of the model. The predictability of 111 random features is also far lower than the optimal 111 features.
To improve the modeling results (including 1. reducing the number of features and 2. improving the accuracy of prediction), we stratified the samples based on self-evaluation of IBD patients. We discarded the “poor”, “very poor”, and “terrible” groups with too few samples. By evaluating the maximum number of omics and the number of samples that can be included, we finally included 6 omics and established two stratified models for people who self-evaluated as “very well” and “slightly below par” (Supplementary Table s1). From a demographic point of view, there is little difference between the “very well” and “slightly below par” populations in terms of gender and diagnosis ratio. We evaluated 11 indicators, including “Anal fissure”, “Abscess”, “Abdominal pain”, “Number of liquid or very soft stools in the past 24 hours”, “Arthralgia”, “hbi”, “Arthralgias”, “Bowel frequency during the day”, “Urgency of defecation”, “Blood in the stool”, “sccai”. Basically, all indicators show that the symptoms of people who self-evaluate as “very well” are milder and more stable than those of people who are “slightly below par”.
We adopt a method of stratifying samples based on the self-evaluation of patients, and determine their disease activity through the evaluation of syndromes during the sampling period, thereby subdividing the confounding data into 2 layers. The two layers of samples can cover 90.97% of the overall sample, which is enough to represent the mixed sample itself. We can tell that people who self-evaluate as “slightly below par” have significantly more active disease statues than those who self-evaluate as “very well” (Supplementary Table s1). Therefore, the biomarkers obtained by hierarchical modeling are more in line with the features of the samples contained in the specific layer, the noise features are filtered and deleted, so it is possible to obtain better prediction results with fewer features.
Among the people whose self-evaluation is “very well”, the second model predicts a total of 207 samples (83 people), and the nonIBD: UC: CD sample ratio is 86:39:82 (26:19:38 people) (Supplementary Figure s2A). Among them, the data set participating in the feature engineering dimensionality reduction includes 107 samples. The test set (33 samples) is obtained according to the ratio of 3:1, and the remaining samples are divided into training set (55 samples) and validation set (19 samples) at a ratio of 4:1. No cross-validation is used between the training set, validation set, and test set. The testB contains 100 samples (59 persons), of which the number of samples is nonIBD: UC: CD =38:18:44 (number of people=18:14:27). Similar to model 1, we use all features as input for feature engineering screening. All features are first screened by RFECV twice, with steps of 0.03 and 4, respectively. We set the “cumulative importance” threshold to 0.999, and remove the low-contribution features to obtain 164 features. TThen, we filter 164 features through collinearity, and delete all features with collinearity higher than 0.9, leaving 64 features (Figure 2B). Finally, the step is adjusted to 5, the RFECV screening is performed again to obtain 59 final features (Figure 2A). The 59 features include 5 metatranscripts and 54 metabolites (Figure 2C), and they participate in the construction of predictive models. We found that hierarchical modeling not only greatly reduces the number of features, but also achieves better prediction performance, especially AUC.
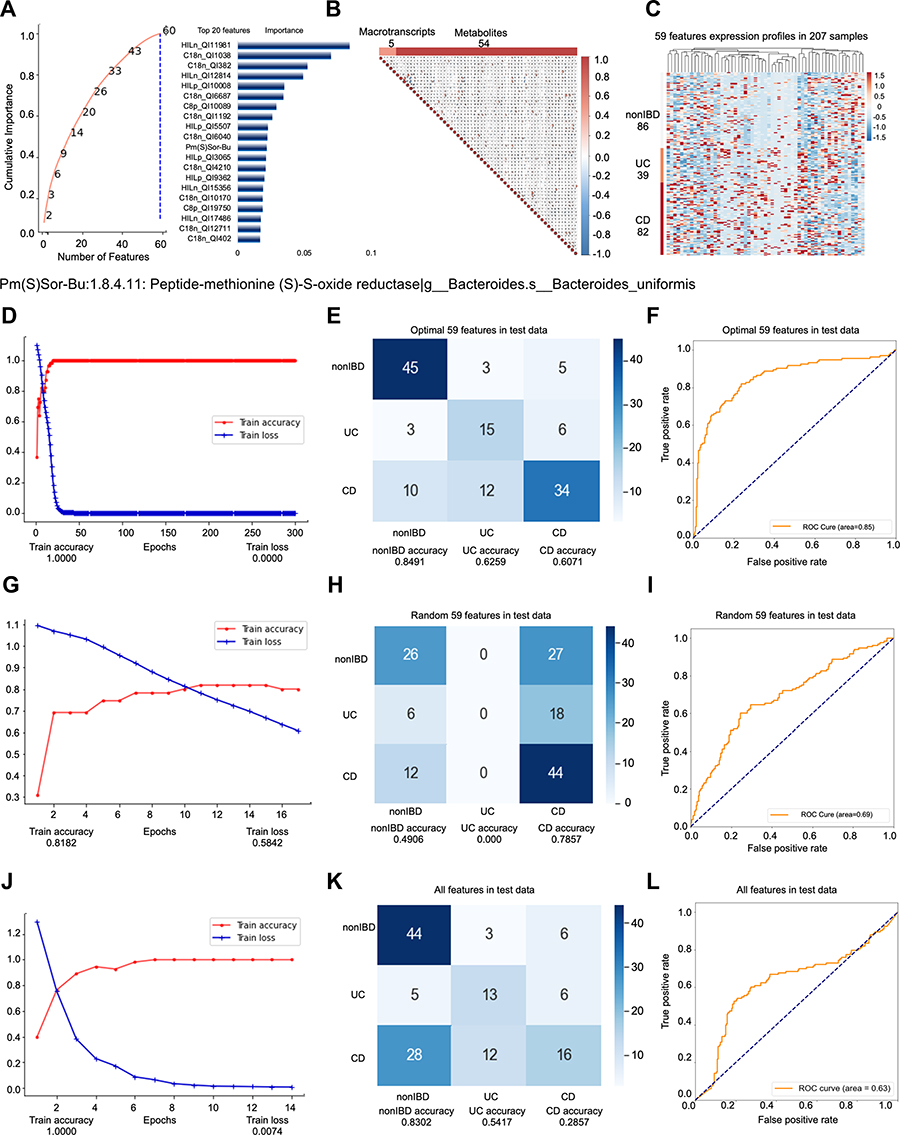 |
Figure 2 Key information and results of model 2 modeling. Notes: In the importance screening process, the cumulative importance scores of the features obtained in the third importance screening (left) and the 20 features with the highest importance scores (right) (A). The correlation between 59 features obtained through collinearity screening, 59 features including 5 metatranscripts and 54 metabolites (B). The expression of 59 features in 207 samples. The samples are arranged in the order of nonIBD, UC and CD. The distance between features is calculated using Canberra distance, and the clustering method uses complete linkage (C). Using the optimal 59 features modeling, the accuracy and the loss value of the training dataset in 300 epochs (D). The confusion matrix of the optimal 59 features (E). The AUC score of the optimal 59 features (F). Using the random 59 features modeling, the accuracy and the loss value of the training dataset in 300 epochs (G). The confusion matrix of the random 59 features (H). The AUC score of the random 59 features (I). Using the all features modeling, the accuracy and the loss value of the training dataset in 300 epochs (J). The confusion matrix of the all features (K). The AUC score of the all features (L). |
The optimal 59 features obtained by modeling after stratification are reduced by almost 1/2 compared with the optimal 111 features before stratification. Once more, we compare the perform predictive performance of the optimal 59 features (Accuracy=0.7068; AUC=0.8503) (Figure 2D–F, Supplementary Figure s2B-E) with the same number of random 59 features (Accuracy=0.5263; AUC=0.6895) (Figure 2G–I) and all the features without dimension reduction (Accuracy=0.5489; AUC=0.6292) (Figure 2J–L). The results show that while greatly reducing the number of features, the optimal 59 features not only have better prediction effects than the original features without dimensionality reduction, but also better than the optimal 111 features obtained by the unhierarchical model (Accuracy=0.6683; AUC =0.8280) (Figure 1D–F). The prediction performance of random 59 features is the worst.
Among the people whose self-evaluation was “slightly below par”, the third model predicted a total of 151 samples (69 people), and the ratio of nonIBD: UC: CD samples was 86:29:36 (26:17:26 people) (Supplementary Figure s3A). The data set participating in the feature engineering dimensionality reduction includes 77 samples (45 people). The data set is split in exactly the same way as the above two models to obtain a training set (39 samples), a validation set (14 samples) and Test set (24 samples). Again, this model does not use cross-validation. The testB contains 74 samples (46 persons), of which the number of samples is nonIBD: UC: CD = 38:18:18 (number of people= 20:9:14). In model 3, all features are filtered by RFECV only once, with a step of 0.66. We set the “cumulative importance” threshold to 1, and remove features with 0 contribution (Figure 3A). After that, we deleted all the features with collinearity higher than 0.9, leaving 22 features (Figure 3B), including 3 metatranscripts and 19 metabolites (Figure 3C), and they jointly participated in the construction of the prediction model. Again, we used fewer features to build a better prediction model than the unhierarchical model, and the model accuracy is the best among the three models.
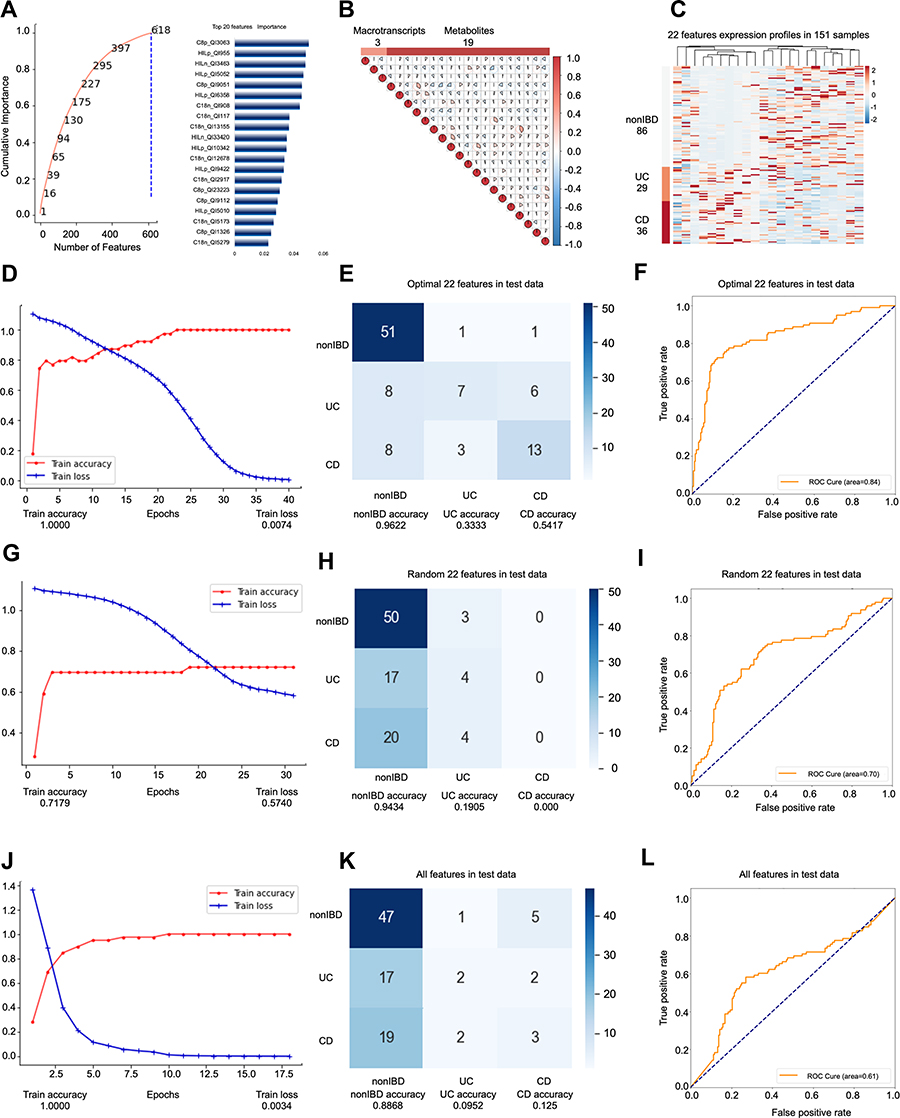 |
Figure 3 Key information and results of model 3 modeling. Notes: In the importance screening process, the cumulative importance scores of the features obtained in the importance screening (left) and the 20 features with the highest importance scores (right) (A). The correlation between 22 features obtained through collinearity screening, 22 features including 3 metatranscripts and 19 metabolites (B). The expression of 22 features in 151 samples. The samples are arranged in the order of nonIBD, UC and CD. The distance between features is calculated using Canberra distance, and the clustering method uses complete linkage (C). Using the optimal 22 features modeling, the accuracy and the loss value of the training dataset in 300 epochs (D). The confusion matrix of the optimal 22 features (E). The AUC score of the optimal 22 features (F). Using the random 22 features modeling, the accuracy and the loss value of the training dataset in 300 epochs (G). The confusion matrix of the random 22 features (H). The AUC score of the random 22 features (I). Using the all features modeling, the accuracy and the loss value of the training dataset in 300 epochs (J). The confusion matrix of the all features (K). The AUC score of the all features (L). |
Based on the optimal 22 features obtained by modeling all samples of IBD patients whose self-evaluation was a little worse (slightly below par), the best accuracy rate among the three models was obtained. Similarly, we compare the optimal 22 features (Accuracy=0.7245; AUC=0.8355) (Figure 3D–F, Supplementary Figure s3B-E) with the same number of random 22 (Accuracy=0.4592; AUC=0.5866) (Figure 3G–I) features and all features without dimensionality reduction (Accuracy=0.5306; AUC= 0.6148) (Figure 3J–L). The optimal prediction result achieved by stratifying the overall sample according to the specific label verifies for the second time that the hierarchical modeling method is feasible and superior. In this model, the accuracy rate and AUC are also improved while the number of features is greatly reduced.
The modeling results prove the superiority of the sample layered modeling method. As expected, compared with the mixed sample (model 1), the sample stratification method uses fewer features to obtain a better prediction effect. We used only 59 features to obtain an AUC of 0.8503 in the test set of the self-evaluated “very well” population (model 2), and use only 22 features to get an AUC of 0.8355 in the test set of the self-evaluated “slightly below par” population (model 3). Franzosa et al did the similar work,8 whose research uses random forest classifiers to classify nonIBD, UC and CD. The accuracy of the training set is 65.16% (155 samples), and the accuracy of the verification set is 76.92% (65 samples). The random forest method was tested on 111/59/22 features obtained from the three models constructed in this study, and the prediction accuracy rates of 69.35%, 64.66% and 64.29% were obtained, respectively (Supplementary Figure s4A-C). Using the same biomarkers in the three models, the prediction accuracy obtained by the random forest classifier is lower than the result obtained by the artificial neural network.
Among 111 features, a metatranscript named Methylenetetrahydrofolate reductase (1.5.1.20: Methylenetetrahydrofolate reductase (NAD(P)H)) is potentially related to IBD. Its mutant 677T leads to the accumulation of homocysteine, which may increase the risk of thrombosis in patients with IBD.9 Peptide deformylase (3.5.1.88: Peptide deformylase|g__Parabacteroides.s__Parabacteroides_merdae) is a class of metalloenzyme responsible for catalyzing the removal of the N-formyl group from N-terminal methionine after translation.10 It plays a key role in the process of bacterial synthesis of protein, but it is not necessary for normal human cells to synthesize protein. Therefore, PDF is one of the few antibacterial targets.11 Its relationship with IBD requires further experiments to analyze. In order to further explore the potential link between biomarkers in nonIBD, UC and CD, we used Wilcoxon rank-sum test to perform a difference analysis (Supplementary Table s2-4). 1-deoxy-d-xylulose-5-phosphate reductoisomerase (1.1.1.267: 1-deoxy-D-xylulose-5-phosphate reductoisomerase|g__Parabacteroides.s__Parabacteroides_distasonis) is the second key rate-limiting enzyme in the 2-C-methyl-d-erythritol-4-phosphate (MEP) pathway. The MEP pathway is an essential pathway for pathogenic microorganisms to synthesize terpenoids. Therefore, it is also used as an important target for screening antibiotics.12,13 We found that UC (log2FC=1.52, p=0.0006) and CD (log2FC=0.7703, p=0.4311) had an up-regulation trend relative to nonIBD, but the expression level of CD (log2FC=−0.7497, p =0.0021) was significantly suppressed compared to UC, this phenomenon implies that there are different degrees of intestinal flora MEP pathway metabolic disorders in both UC and CD, which affect the normal physiological functions of intestinal flora. Abnormal fumarate hydratase (FH) (4.2.1.2: Fumarate hydratase|g__Faecalibacterium.s__Faecalibacterium_prausnitzii) can lead to cancer, metabolic dysregulation is not only a consequence of oncogenic transformation but that it can be a driving factor for cancer. The results of difference analysis showed that the FH expression of CD was significantly down-regulated relative to UC (log2FC=−1.0173, p =0.0007) and nonIBD (log2FC=−0.4424, p =0.0104), while UC (log2FC=0.5749, p =0.2580) had a slight up-regulated trend relative to nonIBD. FAD synthetase (2.7.7.2: FAD synthetase|g__Clostridium.s__Clostridium_leptum) is responsible for the synthesis of FAD. FAD participates in the key metabolic processes of organisms.14 The lack of FAD in intestinal bacteria will cause the lack of FAD in the host’s intestinal cells and the reduction of related enzyme functions. FAD participates in the execution of many functions.15 FAD is the strongest free radical scavenger, and glutathione (GSH) constitutes the most important antioxidant barrier for cells. FAD can also convert homocysteine into S- adenosyl methionine (SAM), thereby avoiding the accumulation of homocysteine. The disorder of FAD may lead to decreased mitochondrial function of the patient’s intestinal cells, and decreased repair ability after DNA damage. The massive death of intestinal cells is related to the formation of local intestinal ulcers and inflammation. Compared with the nonIBD group, the FAD enzymes in the UC (log2FC=−1.6483, p =0.0841) and CD groups were greatly reduced, especially CD (log2FC=−0.6701, p =0.0035), suggesting a more serious intestinal metabolic disorder and damage to the intestinal barrier in CD. Among the 59 features obtained in model 2, 4 of the 5 metatranscripts included are significantly different between the groups. Studies have shown that partial inhibition of DNA synthesis stimulates the production of inorganic diphosphatase.16 Notably, consistent with previous research results, we found that, compared with nonIBD, in UC and CD, the significant down-regulation of DNA helicase (3.6.4.12: DNA helicase|g__Ruminococcus.s__Ruminococcus_lactaris) (log2FC=−0.5214, p=0.0198) (log2FC=−0.4085, p=0.0410) is accompanied by significant up-regulation of inorganic diphosphatase (3.6.1.1: Inorganic diphosphatase|g__Lachnospiraceae_noname.s__Lachnospiraceae_bacterium_7_1_58FAA) (log2FC=3.7212, p=0.0665) (log2FC=1.8134, p=0.0143). The potential connection between this phenomenon and IBD deserves further investigation. Phosphoenolpyruvate carboxykinase (PC) (4.1.1.49: Phosphoenolpyruvate carboxykinase (ATP)|g__Odoribacter.s__Odoribacter_splanchnicus) regulate metabolic adaptation and achieve glucose-independent tumor growth,17 which expression level was significantly up-regulated in CD relative to nonIBD (log2FC=0.7869, p=0.5727) and UC (log2FC=1.8889, p=0.0007). In contrast, PC was significantly down-regulated in UC (log2FC=−1.1021, p=0.0008) compared to nonIBD. This situation may imply that the protection mechanism of UC plays a certain compensatory function.
When we look for markers that are significantly different among the three groups of nonIBD, UC and CD, it is interesting that they are basically metabolites (Supplementary Table s2-4). The most significant differences are all unknown compounds, emphasizing the need for further compound annotation efforts and follow up to determine the significance of these compounds in IBD.4 We provide a wealth of candidate information for follow-up research and development, including m/z and retention time (RT) information (Supplementary Table s5). Among 111 features. Features with the greatest differences included C18n_QI6575 (m/z = 386.2704, RT = 15.34 min), and a feature named HILn_QI3222 with an m/z of 460.2348 and RT of 6.59 min. Compared with nonIBD, C18n_QI6575 (log2FC=12.963, p=3.15E-22) (log2FC=11.6072, p=2.08E-11) and HILn_QI3222 (log2FC=8.9885, p=8.43E-19) (log2FC=8.2486, p=2.60E-06) were significantly up-regulated in UC and CD, and relative to UC, the expression in CD was both down-regulated (log2FC=−1.3558, p=3.94E-08) (log2FC=−0.7399, p=4.60E-07). Among the 59 features obtained by model 2, C18n_QI382 (m/z = 123.0076, RT = 1.58 min), which has the largest difference, and C18n_QI3056 (m/z = 273.0519, RT = 0.75 min), which has the largest difference obtained by model 3, showed surprising similarity to the expression patterns of the two markers with the largest difference among 111 features. The features with the largest difference overall showed a significant increase in UC (log2FC=3.9564, p=4.84E-11) (log2FC=7.8504, p=3.32E-10) and CD (log2FC=2.8606, p=5.50E-12) (log2FC=7.2542, p=0.0002), while the upregulation of CD was inhibited (log2FC=−1.0958, p=0.0009) (log2FC=−0.5963, p=0.0100). This phenomenon implies that metabolic physiology is disturbed in UC and CD, and it is likely that there is a certain compensatory mechanism in CD, which can suppress this disorder to a certain extent.
The artificial intelligence model we developed for the diagnosis and subtype identification of IBD is applicable. Firstly, according to the universal approximation theorem, the artificial neural network can approach the target function infinitely.18 Although the models are similar to a “black box”, we can still try to explain the mechanism of the interaction between features and models through the importance weight of features and the relative expression abundance between groups.
Secondly, from the perspective of application, our model possess important clinical application value. First, the patient’s stool samples could be collected for metabolome and metatranscriptome testing. We can obtain the individual expression profile of 3 different optimal biomarker combination, including the abundance of bacterial transcripts and the metabolite-related information such as mass charge ratio (m/z) and retention time. According to the patients’ different self-evaluation status, we can chose the optimal model for further prediction. The method we developed is highly accurate and non-invasive. The disadvantage is the high cost. In the future research, we can consider designing specific targeting primers to directly detect the metatranscription biomarkers included in the model. With the development of sequencing analysis technology, the metabolites are annotated and standard products can be targeted for detection, we can directly target metabolites (instead of omics) to further reduce costs. Based on the above considerations, our method can directly detect the biomarkers to be tested in stool samples for the diagnosis and subtype identification of IBD, instead of the complicated and painful clinical colonoscopy and biopsy process.
In summary, we used a stratified method to improve the artificial intelligence modeling accuracy of IBD and its subtypes. We screened out the most important features from the 6 omics, which are all directly derived from stool samples and directly related to the state of the intestine. Interestingly, the biomarkers screened by the three models only include metabolites and metatranscripts at the same time, indicating that IBD subtypes are most closely related to these two omics. Through the characteristics of the metatranscriptome, we can also trace back to which bacteria the metatranscript came from, which may reveal the potential connection between the host and its gut microbes, which can provide great value for subsequent research. In addition, the number of people with poor self-evaluation in this model is too small (including “poor”, “very poor” and “terrible”), and the sample we model does not cover this part of the population. Moreover, the accuracy of model 1 obtained by artificial neural network modeling is not high enough, and no other classifiers are used for modeling. Finally, many of the biomarkers we obtained were unidentified, which requires further research to identify and sort these valuable metabolites.
Conclusion
In this study, we established artificial intelligence models by using non-invasive data for IBD diagnosis. Totally, we included expression profiles from 6 omics features. In order to accurately stratify the target population, we implemented feature engineering and deep learning modeling for patients with different self-evaluation. Using sample stratification modeling, we reduced the feature numbers and improved the diagnosis accuracy. The models could include 90.97% total individuals. Compared to nonIBD group, many selected feature biomarkers are up-regulated in ulcerative colitis (UC) and Crohn’s disease (CD) patients, and their expression level were suppressed to a certain extent in CD compare to UC, which may imply the compensatory effect in CD group. Furthermore, the model constructed in this study can be applied to the clinic. According to the patients’ different self-evaluation statue, biomarkers in different models are selected for prediction. The method we developed can diagnose and subtype IBD with high accuracy and non-invasiveness only by collecting stool samples, instead of complicated and painful clinical colonoscopy and biopsy procedures.
Data Sharing Statement
This study did not generate additional unpublished data.
Acknowledgments
We thank Professor Curtis Huttenhower from Broad Institute of MIT and Harvard to provide the charge mass ratio (m/z) and retention time data of selected features.
Author Contributions
All authors made a significant contribution to the work reported, whether that is in the conception, study design, execution, acquisition of data, analysis and interpretation, or in all these areas; took part in drafting, revising or critically reviewing the article; gave final approval of the version to be published; have agreed on the journal to which the article has been submitted; and agree to be accountable for all aspects of the work.
Funding
This work was supported by the National Natural Science Foundation of China (32027801, 31870992, 21775031), the Strategic Priority Research Program of Chinese Academy of Sciences (Grant No. XDB36000000, XDB38010400), CAS-JSPS (Grant No.. GJHZ094), Science and Technology Service Network Initiative of the Chinese Academy of Sciences (Grant No.. KFJSTS-ZDTP-079), Research Foundation for Advanced Talents of Fujian Medical University (XRCZX2017020, XRCZX2019005), Beijing Natural Science Foundation Haidian original innovation joint fund (L202023). The funding body had no role in the design of the study and collection, analysis, and interpretation of data and in writing the manuscript.
Disclosure
The authors report no conflicts of interest for this work.
References
1. Kaplan GG. The global burden of IBD: from 2015 to 2025. Nat Rev Gastroenterol Hepatol. 2015;12(12):720–727. doi:10.1038/nrgastro.2015.150
2. Sexton KA, Walker JR, Targownik LE, et al. The inflammatory bowel disease symptom inventory: a patient-report scale for research and clinical application. Inflamm Bowel Dis. 2019;25(8):1277–1290. doi:10.1093/ibd/izz038
3. Kinsey L, Burden S. A survey of people with inflammatory bowel disease to investigate their views of food and nutritional issues. Eur J Clin Nutr. 2016;70(7):852–854. doi:10.1038/ejcn.2016.57
4. Lloyd-Price J, Arze C, Ananthakrishnan AN, et al. Multi-omics of the gut microbial ecosystem in inflammatory bowel diseases. Nature. 2019;569(7758):655–662. doi:10.1038/s41586-019-1237-9
5. Lamb CA, Kennedy NA, Raine T, et al. British society of gastroenterology consensus guidelines on the management of inflammatory bowel disease in adults. Gut. 2019;68(Suppl 3):s1–s106. doi:10.1136/gutjnl-2019-318484
6. Mossotto E, Ashton JJ, Coelho T, Beattie RM, MacArthur BD, Ennis S. Classification of paediatric inflammatory bowel disease using machine learning. Sci Rep. 2017;7(1):2427. doi:10.1038/s41598-017-02606-2
7. Ozawa T, Ishihara S, Fujishiro M, et al. Novel computer-assisted diagnosis system for endoscopic disease activity in patients with ulcerative colitis. Gastrointest Endosc. 2019;89(2):416–421 e1. doi:10.1016/j.gie.2018.10.020
8. Franzosa EA, Sirota-Madi A, Avila-Pacheco J, et al. Gut microbiome structure and metabolic activity in inflammatory bowel disease. Nat Microbiol. 2019;4(2):293–305. doi:10.1038/s41564-018-0306-4
9. Oussalah A, Gueant JL, Peyrin-Biroulet L. Meta-analysis: hyperhomocysteinaemia in inflammatory bowel diseases. Aliment Pharmacol Ther. 2011;34(10):1173–1184. doi:10.1111/j.1365-2036.2011.04864.x
10. Sangshetti JN, Khan FA, Shinde DB. Peptide deformylase: a new target in antibacterial, antimalarial and anticancer drug discovery. Curr Med Chem. 2015;22(2):214–236. doi:10.2174/0929867321666140826115734
11. Leeds JA, Dean CR. Peptide deformylase as an antibacterial target: a critical assessment. Curr Opin Pharmacol. 2006;6(5):445–452. doi:10.1016/j.coph.2006.06.003
12. Proteau PJ. 1-Deoxy-D-xylulose 5-phosphate reductoisomerase: an overview. Bioorg Chem. 2004;32(6):483–493. doi:10.1016/j.bioorg.2004.08.004
13. Singh N, Cheve G, Avery MA, McCurdy CR. Targeting the methyl erythritol phosphate (MEP) pathway for novel antimalarial, antibacterial and herbicidal drug discovery: inhibition of 1-deoxy-D-xylulose-5-phosphate reductoisomerase (DXR) enzyme. Curr Pharm Des. 2007;13(11):1161–1177. doi:10.2174/138161207780618939
14. Serrano A, Ferreira P, Martinez-Julvez M, Medina M. The prokaryotic FAD synthetase family: a potential drug target. Curr Pharm Des. 2013;19(14):2637–2648. doi:10.2174/1381612811319140013
15. Gnainsky Y, Zfanya N, Elgart M, et al. Systemic regulation of host energy and oogenesis by microbiome-derived mitochondrial coenzymes. Cell Rep. 2021;34(1):108583. doi:10.1016/j.celrep.2020.108583
16. Kukko E, Saarento H. Diphosphate concentration does not correlate with the level of inorganic diphosphatase in Escherichia coli. Folia Microbiol (Praha). 1984;29(4):282–287. doi:10.1007/BF02875958
17. Vincent EE, Sergushichev A, Griss T, et al. Mitochondrial phosphoenolpyruvate carboxykinase regulates metabolic adaptation and enables glucose-independent tumor growth. Mol Cell. 2015;60(2):195–207. doi:10.1016/j.molcel.2015.08.013
18. Hornik K, Stinchcombe M, White H. Multilayer feedforward networks are universal approximators. Neural Netw. 1989;2(5):359–366. doi:10.1016/0893-6080(89)90020-8
 © 2021 The Author(s). This work is published and licensed by Dove Medical Press Limited. The full terms of this license are available at https://www.dovepress.com/terms.php and incorporate the Creative Commons Attribution - Non Commercial (unported, v3.0) License.
By accessing the work you hereby accept the Terms. Non-commercial uses of the work are permitted without any further permission from Dove Medical Press Limited, provided the work is properly attributed. For permission for commercial use of this work, please see paragraphs 4.2 and 5 of our Terms.
© 2021 The Author(s). This work is published and licensed by Dove Medical Press Limited. The full terms of this license are available at https://www.dovepress.com/terms.php and incorporate the Creative Commons Attribution - Non Commercial (unported, v3.0) License.
By accessing the work you hereby accept the Terms. Non-commercial uses of the work are permitted without any further permission from Dove Medical Press Limited, provided the work is properly attributed. For permission for commercial use of this work, please see paragraphs 4.2 and 5 of our Terms.