")
Back to Journals » Cancer Management and Research » Volume 11
Apolipoprotein M could inhibit growth and metastasis of SMMC7721 cells via vitamin D receptor signaling
Authors Yu M , Pan L , Sang C, Mu Q, Zheng L, Luo G , Xu N
Received 24 January 2019
Accepted for publication 5 April 2019
Published 30 April 2019 Volume 2019:11 Pages 3691—3701
DOI https://doi.org/10.2147/CMAR.S202799
Checked for plagiarism Yes
Review by Single anonymous peer review
Peer reviewer comments 2
Editor who approved publication: Dr Kenan Onel
Miaomei Yu,1 Lili Pan,1 Chen Sang,2 Qinfeng Mu,1 Lu Zheng,1 Guanghua Luo,1 Ning Xu3
1Comprehensive Laboratory, the Third Affiliated Hospital of Soochow University, Changzhou 213003, People’s Republic of China; 2Department of Cardiothoracic Surgery, the Third Affiliated Hospital of Soochow University, Changzhou 213003, People’s Republic of China; 3Section of Clinical Chemistry and Pharmacology, Institute of Laboratory Medicine, Lunds University, Lund S‑22185, Sweden
Objective: Hepatocellular carcinoma (HCC) is one of the most common malignant tumors with high mortality-to-incidence ratios. Apolipoprotein M (ApoM), a member of the apolipoprotein family, is mainly synthesized in the liver, whereas its role in HCC has not been elucidated. Here, we examined the effect of ApoM on the biological behavior of HCC cells and the possible mechanisms.
Methods: We used CRISPR/Cas9 technology to knock out ApoM in SMMC7721 cells. Differentially expressed genes before and after ApoM knockout (KO) were analyzed by GeneChip microarrays and confirmed by qRT-PCR. Cell assays of proliferation, apoptosis, migration and invasion were performed in SMMC7721 cells, and the expression of epithelial–mesenchymal transition (EMT) markers was performed by western blot. And we performed functional recovery experiments by overexpressing vitamin D receptor (VDR) in SMMC7721.
Results: The ApoM-KO SMMC7721 cell line was successfully constructed using the CRISPR/Cas9 technology. Our results showed that silencing ApoM suppressed apoptosis and promoted proliferation, migration, invasion and EMT of SMMC7721 cells. The microarray data revealed that a total of 1,868 differentially expressed genes were identified, including VDR. The qRT-PCR and western blot verification results demonstrated that knocking out ApoM could significantly reduce the expression of VDR. The functional recovery experiments indicated that VDR overexpression could offset the inhibition of cell apoptosis and the promotion of cell proliferation, migration, invasion and EMT caused by knocking out ApoM in SMMC7721 cells.
Conclusion: ApoM could function as a tumor suppressor to inhibit the growth and metastasis of SMMC7721 cells via VDR signaling in HCC.
Keywords: apolipoprotein M, CRISPR/Cas9, hepatocellular carcinoma cells, GeneChip microarrays, vitamin D receptor
Introduction
Hepatocellular carcinoma (HCC) is the sixth most common malignant tumors and the third leading cause of cancer-related death worldwide, with high mortality-to-incidence ratios.1,2 Microvascular invasion, occult metastasis, recurrence and resistance to chemotherapy contribute to the poor prognosis in patients of HCC. The liver is the key organ for the metabolism of lipids, lipoproteins and apolipoproteins, and the majority of apolipoproteins are synthesized by the liver.3,4 Apolipoprotein M (ApoM), first discovered and isolated by Xu and Dahlbäck in 1999, belongs to the lipocalin superfamily.5 ApoM is predominantly associated with high-density lipoprotein (HDL) particles in plasma and accounts for about 5% of HDL and an even smaller proportion (0.2~1%) of low-density lipoprotein (LDL) particles.6,7 ApoM is mainly expressed in liver and kidney and exercises a series of function. However, there are few reports on the role of ApoM in tumorigenesis. Our previous study revealed that ApoM was expressed in human intestinal tissues and might be associated with lymph node metastasis of colorectal cancer.8 Moreover, ApoM could increase the mRNA levels of vitamin D receptor (VDR) in colorectal cancer tissues.9 In addition, both ApoM mRNA levels and protein mass were significantly lower in HCC tissues than in its adjacent tissues,10 which may suggest that ApoM could have potential regulatory mechanism in HCC tissues and may have certain relationship with the VDR.
VDR is a karyophilic protein which belongs to the steroid-thyroid receptor superfamily. The bioactive, hormonal ligand for VDR is 1,25-dihydroxyvitamin D3 [1,25-(OH)2D3].11 VDR is widely distributed in various tissues and organs and highly expressed in colon, kidney, skeleton and lymphocytes. VDR functions as a ligand-induced nuclear transcription factor to regulate various biological processes.12 Preclinical studies have established that VDR has multifarious antitumor effects, including antiproliferation, prodifferentiation, proapoptosis, antiangiogenesis and anti-inflammatory effects.13,14
In the present study, the CRISPR/Cas9 technique was applied to knock out ApoM in HCC cell line SMMC7721 cells. Differentially expressed genes before and after ApoM knockout (KO) were analyzed by the GeneChip microarrays. Moreover, we investigated the effect of ApoM on the biological behavior of SMMC7721 cells, such as proliferation, apoptosis, migration, invasion and epithelial–mesenchymal transition (EMT). Meanwhile, we performed functional recovery by overexpressing VDR in SMMC7721 to verify whether ApoM might affect the function of liver cancer cells through VDR and further explored possible downstream signaling pathways.
Materials and methods
Cell culture
Human HCC cell line SMMC7721 was purchased from the Type Culture Collection of the Chinese Academy of Sciences (Shanghai, China) and identified by short tandem repeat analysis. Cells were cultured in RPMI 1640 medium (Gibco, Life Technologies, NY, USA) containing 10% FBS (Gibco, Life Technologies, Melbourne, Australia), 100 U/mL penicillin and 100 μg/mL streptomycin (Gibco, Life Technologies, NY, USA), and incubated at 37°C in a humidified atmosphere with 5% CO2.
CRISPR/Cas9 vector construction and transfection
A specific single-guide RNA (sgRNA) sequence of ApoM was designed using the CRISPR design tool at
GeneChip microarrays
Affymetrix GeneChip microarrays were performed by Shanghai GeneChem Co., Ltd. (Shanghai, China). Total RNA from SMMC7721 cells of ApoM-KO group and negative control (NC) group were isolated with NanoDrop 2,000 (Thermo Scientific), and the quality and integrity were checked with Agilent 2100 Bioanalyzer. Reverse transcription, double-stranded DNA template conversion, in vitro transcription for a cRNA synthesis and labeling were performed according to the manufacturer’s instructions (Affymetrix, Santa Clara, CA, USA). Fluorescent probes were hybridized, washed and stained with GeneChip Hybridization Wash and Stain Kit (Affymetrix) in Hybridization Oven 645 and Fluidics Station 450 (Affymetrix). Slides were scanned by GeneChip Scanner 3,000 and Command Console Software 3.1 (Affymetrix) with default settings. Visualization, quantification and gene expression analysis were performed with GENEPIX 3.0 software (AXON)(Union City, CA, USA). The genes with their false discovery rates (FDRs) ≤0.05 and the fold change ≥2 were defined as differentially expressed.
RNA extraction and qRT-PCR
Total RNA was extracted by the Total RNA Purification Kit (Biocolor, Shanghai, China) according to the manufacturer’s instructions. Concentration and purity of RNA were spectrophotometrically assessed, measuring absorbance at 260/280 nm by BioPhotometer (Eppendorf, Germany). cDNA from total RNA was synthesized by the RevertAid First Strand cDNA Synthesis kit (Thermo Scientific). All the PCR assays were performed on the LightCycler (Roche, Biocolor, Switzerland) RT-PCR system. Quantification of target gene mRNA levels was performed by normalizing to glyceraldehyde 3‑phosphate dehydrogenase (GAPDH) mRNA level by the comparative threshold cycle method (2−ΔCt). Sequences of primers and probes are presented in Table 1.
 | Table 1 Sequences of primers and probes |
Lentivirus infection
Recombined LV-GV358-VDR-EGFP and NC vector were synthesized by GeneChem Co, Ltd (Shanghai, China). Lentiviral vectors were transfected into SMMC7721 cells according to the manufacturer’s instructions. Cells were seeded (2×10⁵ cells/mL) in 6-well plates and incubated for 24 hrs to reach 50% confluence, and then replaced with infection medium containing lentiviral vectors at a multiplicity of infection (MOI) of 20 plaque-forming units/cell. Successfully infected cells were green fluorescent protein (GFP) positive and observed under a fluorescent microscope after 72 hrs, and the efficiency of VDR overexpression was evaluated using quantitative real-time PCR (qRT-PCR).
Flow cytometry assay
Cells from ApoM-KO group and NC group were harvested at 72 hrs post-transfection by trypsinization. Cell pellets were resuspended at a density of 1×10⁶ cells/mL in 1× binding buffer solution. After double staining with Annexin V/Alexa Fluor 647 and propidium iodide (PI) using the Annexin V-Alexa Fluor 647 Apoptosis Detection Kit (Fcmacs, Nanjing, China) for 15 mins at room temperature, samples were analyzed on a FACScan flow cytometer equipped with Cell Quest software (BD Biosciences, San Jose, CA, USA). Annexin V- and PI- cells were used as controls, and Annexin V+ and PI+ cells were designated as necrotic.
Caspase3/7 activity assay
Cells from each group were harvested at 48 hrs post-transfection and caspase activity was detected by Caspase-Glo 3/7 Assay kit (Promega, Shanghai, China) according to the manufacturer’s instructions. Cells in each group were seeded into a 96-well plate (1×10⁴ cells/well), and a group without cells (only containing 100 μL/well of medium) was set as blank control. 100 μL caspase-Glo 3/7 reagent was added to each well of the plates, followed by mixing on the plate shaker for 30 mins. Absorbance values were measured after incubation at room temperature for 2 hrs. Four repetitions were performed for each experiment.
Cell proliferation assay
Cell proliferation was measured using a Cell Counting Kit-8 (CCK-8) (Dojindo, Kumamoto, Japan) according to the manufacturer’s instructions. Briefly, cells were seeded into a 96-well plate (5×10³ cells/well), with six replicate wells per group. CCK-8 was added to wells at 1, 2, 3, 4 and 5 day post-infection (10 μL/well) and examined 1 hr later. OD values were measured at 450 nm to estimate viable cells. OD 450-fold represented OD values at each time point relative to the average of day 1, indicating changes in cell proliferation fold. Three repetitions were performed for each experiment.
Cell migration assay
Cells from each group were seeded in 6-well plates at 5×10⁵ cells/mL and cultured until confluent. Then, cells were washed twice with PBS and replaced with culture medium containing 5% FBS for 24 hrs. Scratch wounds were created across the center of each well using a sterile 200 μL pipette tip, and any nonadherent cells were washed off. Wound images were captured with an inverted microscope (Olympus CKX41, Tokyo, Japan) and a digital camera (Olympus, Japan) at 0, 24, 48 and 72 hrs after wounding.
Cell density was adjusted to 1×10⁵ cells/well with the basic medium. The apical chamber was loaded with 100 μL of cell suspension, and the basolateral chamber was supplied with 600 μL of the culture medium containing 30% FBS. After 48 hrs of incubation, the medium was removed from the upper chamber and cells were scraped off with a cotton swab. Cells that invaded to the other side of the membrane were fixed with 4% paraformaldehyde for 30 mins, followed by staining with Giemsa (Sigma-Aldrich, St Louis, MO, USA). Invaded cells were counted under an inverted microscope (200×) in at least three randomly selected fields.
Cell invasion assay
Cell density was adjusted to 1×10⁵ cells/well with the basic medium. Before seeding, 24-well transwell chambers with 8 μm pores (Corning, NY, USA) were coated with Matrigel (BD Biosciences, San Jose, CA, USA), followed by the hydration of the Matrigel matrix layer. The apical chamber was loaded with 500 μL of cell suspension, and the basolateral chamber was supplied with 750 μL of the culture medium containing 30% FBS. After 48 hrs of incubation, the medium was removed from the upper chamber and cells were scraped off with a cotton swab. Cells that invaded to the other side of the membrane were stained with Giemsa. Invaded cells were counted under an inverted microscope in at least three randomly selected fields.
Western blot analysis
Cells were harvested and washed twice with ice-cold PBS, and then lysed using a total protein extraction kit (Bestbio, Shanghai, China). Protein was measured using a BCA protein quantitative kit (Bestbio). Protein samples were mixed with 5× SDS-PAGE loading buffer (Beyotime, Nantong, China) and boiled for 5 mins. A total of 30 μg of protein was separated using 10% SDS-PAGE, then transferred onto polyvinylidene fluoride membranes (Merck Millipore, Billerica, MA, USA). Subsequently, membranes were blocked in 3% BSA for 2 hrs at room temperature, and then incubated with anti-E-cadherin (#14472, Cell Signaling Technology, Boston, MA, USA), anti-Snail (#3879, CST), anti-Twist (ab50581, Abcam, Cambridge, MA, USA), anti-Fibronectin (ab6328, Abcam), anti-VDR (ab109234, Abcam) antibody overnight at 4°C. GAPDH (sc-32233, SANTA CRUZ, CA, USA) was used as the internal control to normalize protein loading. After washing three times with TBST, membranes were incubated for 2 hrs at room temperature with horseradish peroxidase-conjugated affinipure anti-mouse IgG (SA00001-1, Proteintech, Chicago, IL, USA) or anti-rabbit IgG (SA00001-2, Proteintech). Protein bands were visualized with a Pierce ECL Western Blotting Substrate kit (Thermo Scientific) after washing with TBST.
Statistical analysis
Statistical analyses were performed using GraphPad Prsim 6.0 software (Inc, San Diego, CA, USA). Data were presented as means ± SEM. A Student’s t test (two-tailed) was used to determine statistical differences between the two groups. One-way ANOVA was followed by Dunn’s multiple comparison test for multiple comparisons. Results were considered significant when P-values <0.05.
Results
Knocking out ApoM in SMMC7721 cells by using CRISPR/Cas9 technique
The SMMC7721 cells were successfully transfected with the GFP-labeled plasmid vector. As shown in Figure 1A, transfection efficiency was >50% based on the percentages of GFP-positive cells after transfection, which could be used for the following experiments. After limited-dilution culture for 10 days, the Celigo confluence application was used to scan the monoclone formation of the cells. The optimal plating density for SMMC-7721 cell clones in a 96-well plate was 3–4 cells/well, and these cells possessed strong monoclonal forming ability and growth rate (Figure 1B). Sequencing results showed that this sgRNA cleavage activity was high enough to knock out the ApoM gene. The target fragments of mixed clones and monoclone were identified a novel T insertion mutation lying +240 bp to the translation initiation site by Sanger sequencing (Figure 1C), thus leading to the fact that ApoM gene can be translated to 105 amino acids. The 79 amino acids of N-terminal were identical to those before CRISPR/Cas9 treatment (Figure 1D). Western blot results further verified that all subclones substantially lack ApoM protein, indicating that ApoM knocking out in SMMC7721 cells was highly efficient (Figure 1E).
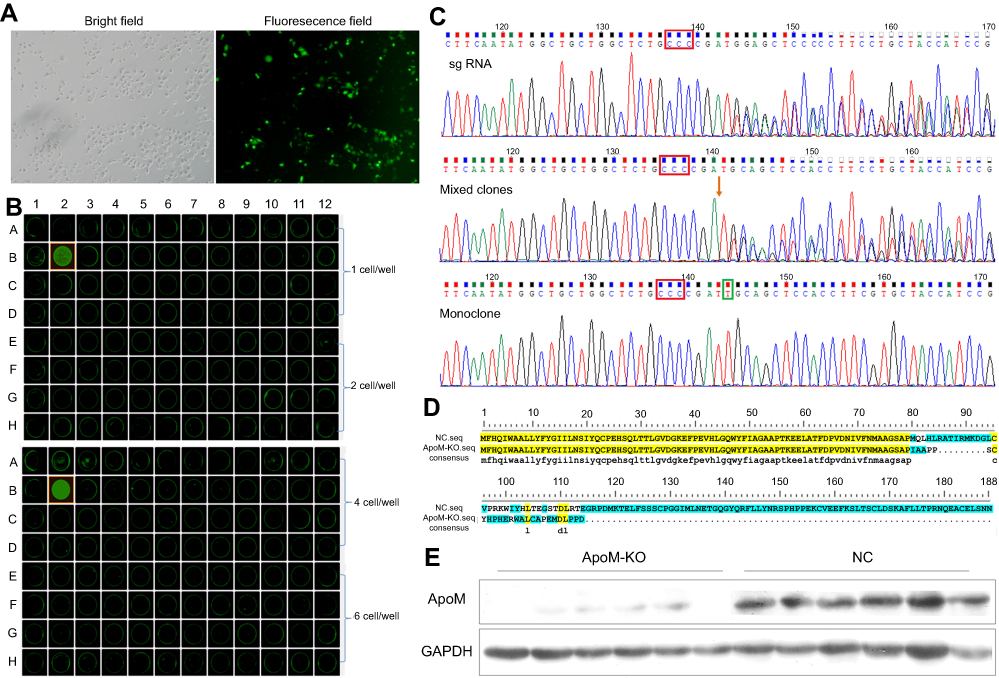 | Figure 1 CRISPR/Cas9-mediated ApoM knocking out in SMMC7721 cells. (A) The optical microscopy images of SMMC7721 cells transfected by the GFP-labeled plasmid vector in bright and fluorescence field. Scare bar =100 μm. (B) After limited-dilution culture for 10 days, the optimal plating density for monoclonal formation of SMMC-7721 cells in 96-well plates was recorded with Celigo. (C) Sequencing peak map of sgRNA, mixed clones and monoclone. Red boxes marked the PAM sequence, red arrowhead denoted the Cas9 cutting site, green box marked the inserted base. (D) The amino acid sequence translated from ApoM gene before (NC.seq) and after (ApoM-KO.seq) CRISPR/Cas9 treatment. Yellow shades represent the same amino acid sequence and green shades represent the different one. (E) ApoM protein expression was analyzed using western blot in ApoM-KO and NC group. GAPDH was a loading control.Abbreviations: ApoM, Apolipoprotein M; GFP, green fluorescent protein; sgRNA, single-guide RNA; NC, negative control; KO, knock-out; GAPDH, glyceraldehyde 3‑phosphate dehydrogenase. |
Silencing ApoM suppressed apoptosis of SMMC7721 cells
The effects of ApoM knocking out on cell apoptosis were examined by flow cytometry. It is demonstrated that the apoptosis rate in ApoM-KO group was significantly lower than in NC group for SMMC7721 cells (P<0.05, Figure 2A). Meanwhile, caspase3/7 activity of ApoM-KO group was significantly lower than NC group in SMMC7721 cells, which also indicated that silencing ApoM suppressed apoptosis of SMMC7721 cells compared with NC group (P<0.05, Figure 2B).
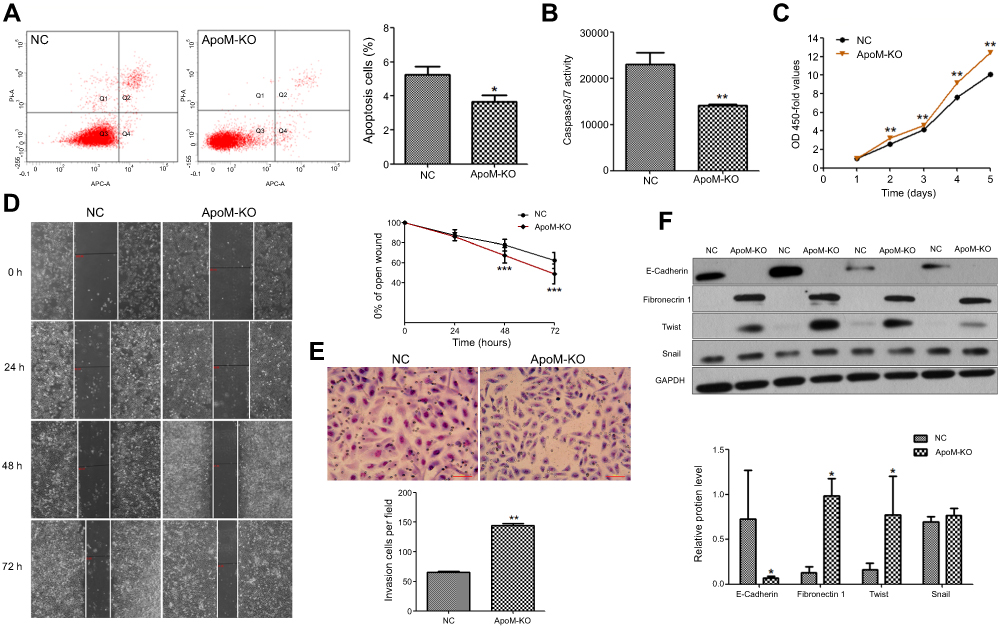 | Figure 2 Changes of biological behavior after silencing ApoM. (A) Apoptosis rate in ApoM-KO group was lower than the NC group in SMMC7721 cells. Q1 represents necrotic cells, Q2 represents late apoptosis cells, Q3 represents viable cells and Q4 represents early apoptosis cells. Apoptosis is designated Q2+Q4. (B) Caspase3/7 activity of ApoM-KO group was lower than the NC group in SMMC7721 cells. (C) OD 450-fold values of ApoM-KO group were higher than NC group in SMMC7721 cells at day 2, 3, 4 and 5. (D) Cell migration of ApoM-KO and NC group was measured using a wound healing assay. Wound images were captured using a digital camera and an inverted microscope at 0, 24, 48 and 72 hrs after wounding. (E) Cell invasion of ApoM-KO and NC group was measured with transwell assays. Cells that invaded were stained with Giemsa and imaged and counted under a microscope. Scare bar =150 μm. (F) E-cadherin, fibronectin, Twist and Snail protein levels were analyzed using western blot in ApoM-KO and NC groups. GAPDH was a loading control. Data are means ± SEM. Student’s t test was used to analyze significant differences, * P<0.05, ** P<0.01, *** P<0.001 versus NC.Abbreviations: ApoM, Apolipoprotein M; KO, knock-out; NC, negative control; GAPDH, glyceraldehyde 3‑phosphate dehydrogenase. |
Silencing ApoM promoted proliferation, migration, invasion and EMT of SMMC7721 cells
CCK-8 assays demonstrated that ApoM-KO could promote SMMC7721 cell growth, and the difference was significant (P<0.01, Figure 2C). Wound healing and transwell invasion assays were used to assess ApoM on the regulation of cell migration and invasion. The results showed that ApoM-KO significantly enhanced migration (Figure 2D) and invasion (Figure 2E). Moreover, we determined the expressions of EMT markers in ApoM-KO and in NC group. As shown in Figure 2F, the ApoM knocking out could dramatically decrease the epithelial marker (E-cadherin) and increase the mesenchymal marker (Fibronectin) as well as EMT transcription regulators (Twist and Snail). Taken together, these results suggested that ApoM might play an important role in regulating metastasis of HCC cells.
VDR was significantly downregulated in the ApoM-KO SMMC7721 cells
We applied GeneChip® PrimeView™ Human Gene Expression Array to compare the gene expression profiles of SMMC7721 cells in ApoM-KO and in NC group. After validating the quality of microarray data, the volcano plot is shown in Figure 3A and the scatter plot shown in Figure 3B. Volcano plot demonstrated the distribution of the differentially expressed genes between ApoM-KO and NC group. The red color represents all the genes whose expression levels were of >2 fold-difference at a significant level of P<0.05. Scatter plot exhibited the distribution of the signals between ApoM-KO and NC group in the Cartesian coordinate plane. The red spots above the upper green lines represent the upregulated probes, while the green spots below the lower green lines represent the downregulated probes in ApoM-KO group compared to those of the NC group. Based on the screening criteria, the differentially expressed genes were identified. A total of 1,264 upregulated genes and a total of 604 downregulated genes in the ApoM-KO group were identified. For example, the upregulated genes included U1, RANP1, PDZK1P1, SBF2-AS1 and MIR4521, and the downregulated genes included TRAF1, VDR, ICAM1, IL1β and IL6 (Table 2). We applied qRT-PCR and western blot to further verify the expression level of VDR, a representative downregulated gene. As shown in Figure 3, the result indicated that VDR mRNA and protein level were significantly decreased in ApoM-KO group compared with the NC group (Figure 3C and D).
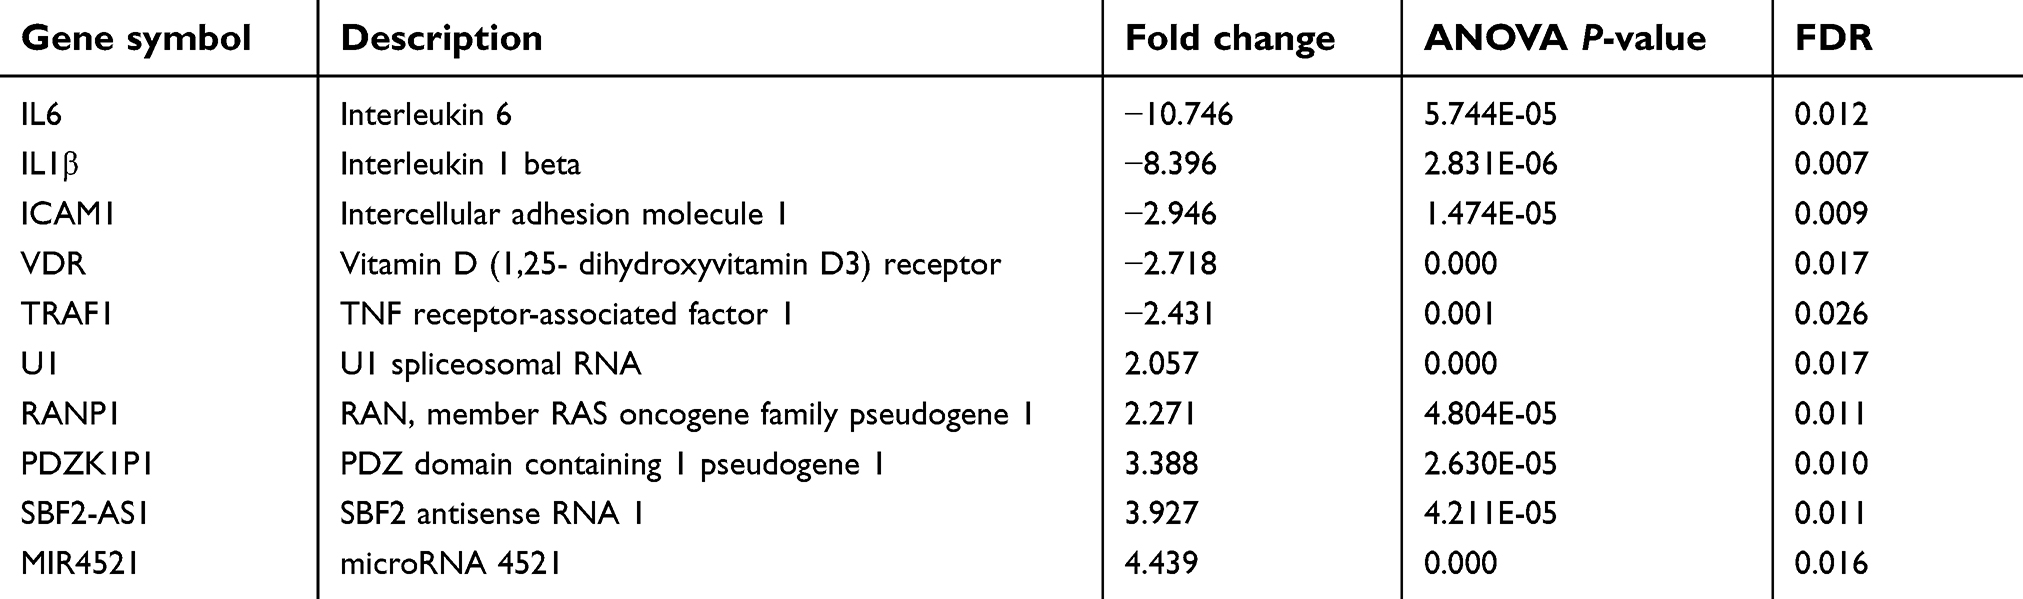 | Table 2 Partial differentially expressed genes between ApoM-KO and NC group |
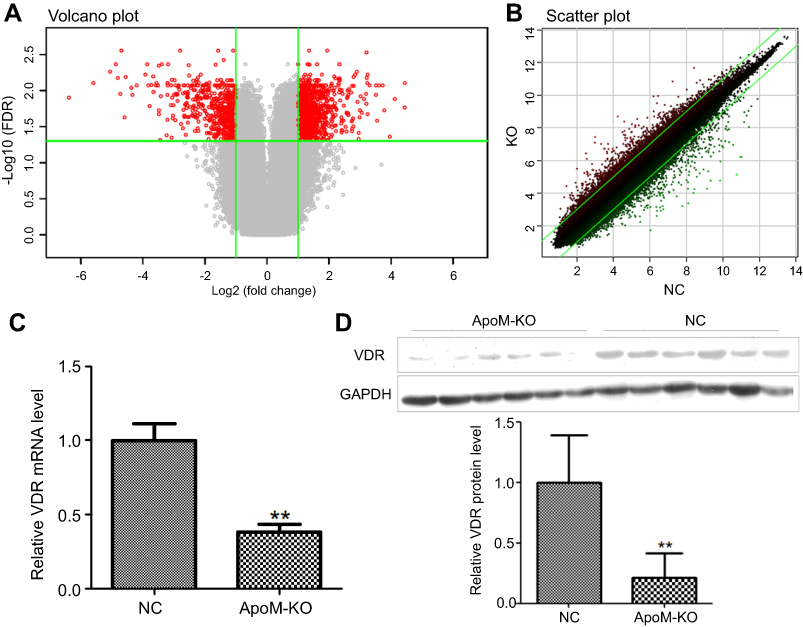 | Figure 3 Differentially expressed genes between ApoM-KO and NC group. (A) Volcano plot, which demonstrated the distribution of the differentially expressed genes between ApoM-KO and NC group. The X-axis represents the logarithm conversion of the fold difference to base 2 and the Y-axis represents the logarithm conversion of the corrected significant levels to base 10. The red color represents all the probes with fold difference >2 and FDR <0.05. (B) Scatter plot, which exhibited the distribution of the signals between ApoM-KO and NC group in the Cartesian coordinate plane. The X-axis represents the NC group and the Y-axis represents ApoM-KO group. The ordinate value and the abscissa of each spot represent the expression values of one probe in ApoM-KO and NC group. The red spots above the green lines represent the relatively upregulated probes in ApoM-KO group. The green spots underneath the green lines represent the relatively upregulated probes in the NC group. (C) VDR mRNA was quantified by qRT-PCR in ApoM-KO and NC group, normalized to GAPDH. Fold change was calculated using 2−ΔCt. (D) Quantification of VDR protein expression with western blot presented as a ratio relative to expression of the NC group. GAPDH was a loading control. Data are means ± SEM. Student’s t test was used to analyze significant differences, ** P<0.01 versus NC. Abbreviation: ApoM, Apolipoprotein M; KO, knock-out; NC, negative control; FDR, false discovery rate; VDR, vitamin D receptor; GAPDH, glyceraldehyde 3‑phosphate dehydrogenase. |
ApoM affects the biological functions of SMMC7721 cells via VDR signaling
To further explore its biological role in HCC, VDR overexpression lentiviral vector (VDR-OE) and negative control vector (NC) were stably transfected into ApoM-KO SMMC7721 cells. The qRT-PCR result showed that VDR mRNA level was significantly higher in VDR-OE group than in the NC group (P<0.001, Figure 4A). CCK-8 assays showed that VDR overexpression could counteract the promotion of cell proliferation caused by ApoM knocking out in SMMC7721 cells, and this reduction had significant differences at 4- and 5-day postinfection (P<0.001, Figure 4B). As shown in Figure 4C, caspase3/7 activity of VDR-OE group was significantly increased than that of the NC group in ApoM-KO SMMC7721 cells (P<0.05). In addition, transwell assays data showed that VDR overexpression significantly reduced migration (Figure 4D) and invasion (Figure 4E) of ApoM-KO SMMC7721 cells compared with NC group (P<0.01). As shown in Figure 4F, VDR-OE dramatically increased the level of epithelial marker (E-cadherin) and decreased the level of mesenchymal marker (Fibronectin) and EMT transcription regulators (Twist and Snail) in ApoM-KO SMMC7721 cells.
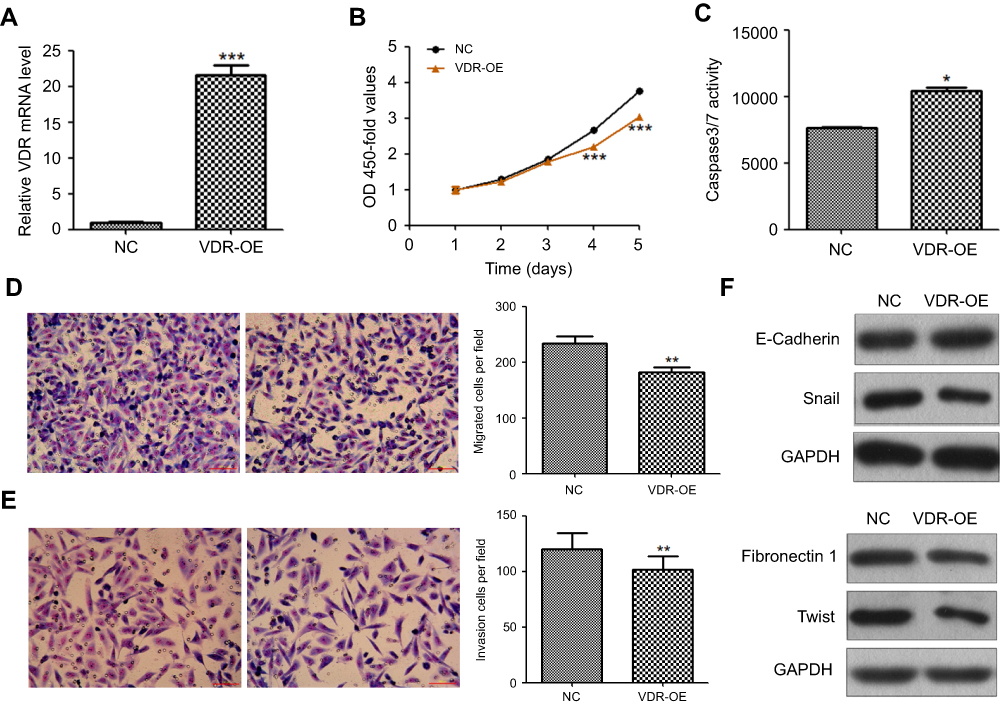 | Figure 4 Effect of VDR on the biological function of ApoM-KO SMMC7721 cells. (A) VDR mRNA was quantified by qRT-PCR in VDR-OE and NC group, normalized to GAPDH. (B) OD 450-fold values of VDR-OE group were lower than NC group in ApoM-KO SMMC7721 cells, especially at day 4 and 5. (C) Caspase3/7 activity of VDR-OE group was higher than NC group in ApoM-KO SMMC7721 cells. (D, E) Cell migration and invasion of VDR-OE and NC group were measured with transwell assays. Cells that invaded were stained with Giemsa and imaged and counted under a microscope. Scare bar =150 μm. (F) E-cadherin, fibronectin, Twist and Snail protein levels were analyzed using western blot. GAPDH was a loading control. Data are means ± SEM. Student’s t-test was used to analyze significant differences, * P<0.05, ** P<0.01, *** P<0.001 versus NC. Abbreviations: VDR, vitamin D receptor; ApoM, Apolipoprotein M; KO, knock-out; OE, overexpression; NC, negative control; GAPDH, glyceraldehyde 3‑phosphate dehydrogenase. |
Discussion
HCC is one of the most common malignant tumors in China, and a large proportion of HCC patients are frequently accompanied by other chronic liver diseases (CLDs), such as chronic hepatitis and/or cirrhosis, which are often associated with plasma lipid and lipoprotein aberrations.15 ApoM, as a lipoprotein-associated plasma protein of the apolipoprotein family, is specifically expressed in liver and highly hydrophobic, and co-circulate with lipoprotein particles in the bloodstream.6 Our previous studies demonstrated that plasma ApoM levels were significantly higher in HCC patients than in normal subjects, whereas they were lower than in the chronic hepatitis and cirrhosis patients, which could be speculated that ApoM synthesis was abnormal in HCC as well as CLD. However, the clinical roles of ApoM in HCC remain to be elucidated.
In the present study, we successfully constructed ApoM-KO SMMC7721 cell line by the CRISPR/Cas9 technique, which had been confirmed by the western blot analysis showing that ApoM synthesis in the knockout group was substantially blocked. The possible reason of residual ApoM expression in these ApoM-KO SMMC7721 cells was that the insertion of base T caused ApoM to be translated into 105 amino acids and terminated prematurely, while the first 79 amino acids were the same as before the mutation. Polyclonal antibody against ApoM may be able to bind partially to this part of the sequence to yield bands. However, this residual ApoM expression does not influence our study. Interestingly, the functional experiments showed that silencing ApoM could suppress apoptosis and promote proliferation, migration, invasion and EMT of SMMC7721 cells, which might indicate that ApoM could function as a tumor-suppressor gene in the development, progression and metastasis of HCC. It is well known that hepatocyte nuclear factor (HNF)-1α, a liver-enriched transcription factor, is widely involved in the cell growth, differentiation and metabolic processes,16 whereas HNF-1α could directly activate the expression of ApoM by binding to the conservative sites (−103 to −88) of its promoter region.7,17 Ma et al18 provided evidence that propofol could upregulate ApoM expression by enhancing HNF-1α expression and then inhibit proinflammatory cytokine production in lipopolysaccharide (LPS)-stimulated cells. Moreover, Ding et al19 reported that the inhibitory effect of HNF-1α on the proliferation, migration and invasion in HCC cells was also partially abolished by the missense mutation of HNF-1α (p.Q511L). Therefore, we speculated that the antitumorigenesis effect of ApoM in HCC might be regulated via the HNF-1α.
Moreover, the microarray analyses revealed that a total of 1,868 differentially expressed genes were identified, including 1,264 upregulated and 604 downregulated genes. Partial differentially expressed genes between ApoM-KO and NC group are shown in Table 2. Among these genes, IL6 had been reported to suppress inflammation-associated HCC development by modulating NK cells.20 Intercellular adhesion molecule 1 (ICAM1) was considered closely related to occurrence, development, metastasis and invasion process of HCC.21 VDR gene promoter methylation was significantly higher in the HCC group compared to both CLD and control groups,22 and the reduced expression of VDR mRNA decreased the bioavailability of 1,25-(OH)2D3, providing an escape mechanism from the antitumor effect.23 TNF receptor-associated factor 1 (TRAF1) as a unique TRAF protein interacts with multiple TNFR family members, regulatory proteins, kinases and adaptors to perform diverse functions in multiple tumors.24 Upregulated long noncoding RNA SBF2-AS1 promotes proliferation in esophageal squamous cell carcinoma25 and nonsmall cell lung cancer.26 Based on the function of these differentially expressed genes, we suggest that ApoM might play an important role in the carcinogenesis of HCC, and most reports were consistent with its tumor-suppressor effect.
The qRT-PCR and western blot verification results showed that ApoM KO significantly reduced the expression level of VDR, which were consistent with the microarray data. So how does ApoM regulate VDR expression? According to our previous research27 and related reports, ApoM, as a physiological carrier of sphingosine-1-phosphate (S1P), together with the S1P receptor signaling pathway constitutes the ApoM-S1P axis, which is involved in diverse biological processes such as anti-atherosclerosis, lipoprotein metabolism, endoplasmic reticulum (ER) stress and tumorigenesis.28,29 Shin et al30 reported that S1P synthesized by the phosphorylation of sphingosine by sphingosine kinases (SphK) could activate nuclear factor-kB (NF-kB). In addition, Sun et al31 reported that VDR could play an inhibitory role on the regulation of NF-kB activation. Moreover, Chen et al32 defined a novel mechanism whereby VDR could inhibit NF-kB activation. Summarizing these findings, we could hypothesize that lack of the carrier ApoM, S1P could not effectively bind to the receptor, and therefore could not activate the classical NF-κB pathway via S1P receptor-independent mechanisms, which may feedback reduce the expression of VDR to promote the activation of NF-kB. The possible mechanisms remain to be confirmed by further investigations.
Subsequently, the functional recovery experiments indicated that VDR overexpression could offset the inhibition of cell apoptosis and the promotion of cell proliferation, migration, invasion and EMT caused by ApoM knocking out in SMMC7721 cells. Studies from in vivo animal and in vitro cell culture have shown that VDR could inhibit cell proliferation, angiogenesis, invasion and promote differentiation and apoptosis via different signal pathways.33 Chen et al34 reported that VDR could function as a tumor suppressor in renal cell carcinoma cells and suppressed the proliferation, migration and invasion of RCC through regulating the expression of the epithelial Ca2+ channel transient receptor potential vanilloid subfamily 5 (TRPV5). The VDR induced reduction of proinflammatory cytokines, ie, cyclooxygenase-2, prostaglandin and NF-κB, could inhibit cell proliferation and cancer-associated inflammation.12,35 In addition, VDR could enhance the tumor-suppressor activity by activating TGF-β-signaling pathway36 and VDR could enhance the expression of E-cadherin and the nuclear export of β-catenin and induced the dickkopf 1, an extracellular inhibitor of Wnt signaling, all of which results in the inhibition of cancer growth.12,36 It could be suggested that VDR may affect cytoskeletal organization and function by altering the expression of genes encoding cytoskeletal proteins, resulting in increased cell adhesion and decreased cell motility, further suppressing cancer growth.12,33
In conclusion, ApoM could function as a tumor suppressor to inhibit the growth and metastasis of SMMC7721 cells via VDR signaling in HCC.
Acknowledgments
This work was supported by the International Cooperation Item of Changzhou (No. CZ20150012), Changzhou High-Level Medical Talents Training Project (No. 2016ZCLJ002) and Jiangsu Provincial Natural Science Foundation of China (BK20151179).
Disclosure
The authors report no potential conflicts of interest in this work.
References
1. Torre LA, Bray F, Siegel RL, Ferlay J, Lortet-Tieulent J, Jemal A. Global cancer statistics, 2012. CA Cancer J Clin. 2015;65(2):87–108. doi:10.3322/caac.21262
2. Singh AK, Kumar R, Pandey AK. Hepatocellular carcinoma: causes, mechanism of progression and biomarkers. Curr Chem Genom Transl Med. 2018;12:9–26. doi:10.2174/2213988501812010009
3. Nemes K, Aberg F, Gylling H, Isoniemi H. Cholesterol metabolism in cholestatic liver disease and liver transplantation: from molecular mechanisms to clinical implications. World J Hepatol. 2016;8(22):924–932. doi:10.4254/wjh.v8.i22.924
4. Jiang JT, Xu N, Zhang XY, Wu CP. Lipids changes in liver cancer. J Zhejiang Univ Sci B. 2007;8(6):398–409. doi:10.1631/jzus.2007.B0831
5. Xu N, Dahlback B. A novel human apolipoprotein (apoM). J Biol Chem. 1999;274(44):31286–31290. doi:10.1074/jbc.274.44.31286
6. Huang LZ, Gao JL, Pu C, et al. Apolipoprotein M: research progress, regulation and metabolic functions (Review). Mol Med Rep. 2015;12(2):1617–1624. doi:10.3892/mmr.2015.3658
7. Ren K, Tang ZL, Jiang Y, Tan YM, Yi GH. Apolipoprotein M. Clin Chim Acta. 2015;446:21–29. doi:10.1016/j.cca.2015.03.038
8. Luo G, Zhang X, Mu Q, et al. Expression and localization of apolipoprotein M in human colorectal tissues. Lipids Health Dis. 2010;9:102. doi:10.1186/1476-511X-9-102
9. Yu MM, Yao S, Luo KM, et al. Apolipoprotein M increases the expression of vitamin D receptor mRNA in colorectal cancer cells detected with duplex fluorescence reverse transcription-quantitative polymerase chain reaction. Mol Med Rep. 2017;16(2):1167–1172. doi:10.3892/mmr.2017.6716
10. Jiang J, Wu C, Luo G, et al. Expression of apolipoprotein M in human hepatocellular carcinoma tissues. Acta Histochem. 2011;113(1):53–57. doi:10.1016/j.acthis.2009.08.005
11. Gonzalez-Parra E, Rojas-Rivera J, Tunon J, Praga M, Ortiz A, Egido J. Vitamin D receptor activation and cardiovascular disease. Nephrol Dial Transplant. 2012;27(Suppl 4):iv17–21. doi:10.1093/ndt/gfs534
12. Christakos S, Dhawan P, Verstuyf A, Verlinden L, Carmeliet G. Vitamin D: metabolism, molecular mechanism of action, and pleiotropic effects. Physiol Rev. 2016;96(1):365–408. doi:10.1152/physrev.00014.2015
13. Campbell MJ, Trump DL. Vitamin D receptor signaling and cancer. Endocrinol Metab Clin North Am. 2017;46(4):1009–1038. doi:10.1016/j.ecl.2017.07.007
14. Jeon SM, Shin EA. Exploring vitamin D metabolism and function in cancer. Exp Mol Med. 2018;50(4):20. doi:10.1038/s12276-018-0038-9
15. Cicognani C, Malavolti M, Morselli-Labate AM, Zamboni L, Sama C, Barbara L. Serum lipid and lipoprotein patterns in patients with liver cirrhosis and chronic active hepatitis. Arch Intern Med. 1997;157(7):792–796.
16. Swenson ES, Guest I, Ilic Z, et al. Hepatocyte nuclear factor-1 as marker of epithelial phenotype reveals marrow-derived hepatocytes, but not duct cells, after liver injury in mice. Stem Cells. 2008;26(7):1768–1777. doi:10.1634/stemcells.2008-0148
17. Richter S, Shih DQ, Pearson ER, et al. Regulation of apolipoprotein M gene expression by MODY3 gene hepatocyte nuclear factor-1alpha: haploinsufficiency is associated with reduced serum apolipoprotein M levels. Diabetes. 2003;52(12):2989–2995. doi:10.2337/diabetes.52.12.2989
18. Ma X, Hu YW, Zhao ZL, et al. Anti-inflammatory effects of propofol are mediated by apolipoprotein M in a hepatocyte nuclear factor-1alpha-dependent manner. Arch Biochem Biophys. 2013;533(1–2):1–10. doi:10.1016/j.abb.2013.03.002
19. Ding CH, Deng LF, Chen F, et al. p.Q511L mutation of HNF1alpha in hepatocellular carcinoma suppresses the transcriptional activity and the anti-tumor effect of HNF1alpha. Biochem Biophys Res Commun. 2018;495(1):86–91. doi:10.1016/j.bbrc.2017.10.174
20. Ji T, Li G, Chen J, et al. Distinct role of interleukin-6 and tumor necrosis factor receptor-1 in oval cell- mediated liver regeneration and inflammation-associated hepatocarcinogenesis. Oncotarget. 2016;7(41):66635–66646. doi:10.18632/oncotarget.11365
21. Zhu XW, Gong JP. Expression and role of icam-1 in the occurrence and development of hepatocellular carcinoma. Asian Pac J Cancer Prev. 2013;14(3):1579–1583. doi:10.7314/APJCP.2013.14.3.1579
22. Abdalla M, Khairy E, Louka ML, Ali-Labib R, Ibrahim EA. Vitamin D receptor gene methylation in hepatocellular carcinoma. Gene. 2018;653:65–71. doi:10.1016/j.gene.2018.02.024
23. Horvath E, Balla B, Kosa J, et al. [Vitamin D metabolism and signaling in human hepatocellular carcinoma and surrounding non-tumorous liver]. Orv Hetil. 2016;157(48):1910–1918.
24. Wang Q, Gao G, Zhang T, et al. TRAF1 is critical for regulating the BRAF/MEK/ERK pathway in non-small cell lung carcinogenesis. Cancer Res. 2018;78(14):3982–3994. doi:10.1158/0008-5472.CAN-18-0429
25. Chen R, Xia W, Wang X, et al. Upregulated long non-coding RNA SBF2-AS1 promotes proliferation in esophageal squamous cell carcinoma. Oncol Lett. 2018;15(4):5071–5080.
26. Lv J, Qiu M, Xia W, et al. High expression of long non-coding RNA SBF2-AS1 promotes proliferation in non-small cell lung cancer. J Exp Clin Cancer Res. 2016;35:75. doi:10.1186/s13046-016-0444-6
27. Wang M, Luo GH, Liu H, et al. Apolipoprotein M induces inhibition of inflammatory responses via the S1PR1 and DHCR24 pathways. Mol Med Rep. 2019;19(2):1272–1283.
28. Blaho VA, Galvani S, Engelbrecht E, et al. HDL-bound sphingosine-1-phosphate restrains lymphopoiesis and neuroinflammation. Nature. 2015;523(7560):342–346. doi:10.1038/nature14462
29. Hajny S, Christoffersen C, Novel A. Perspective on the ApoM-S1P axis, highlighting the metabolism of ApoM and its role in liver fibrosis and neuroinflammation. Int J Mol Sci. 2017;18(8). doi:10.3390/ijms18081636
30. Shin K, Kim KP, Cho Y, et al. Both sphingosine kinase 1 and 2 coordinately regulate cathelicidin antimicrobial peptide production during keratinocyte differentiation. J Invest Dermatol. 2019;139(2):492–494. doi:10.1016/j.jid.2018.08.015
31. Sun J, Kong J, Duan Y, et al. Increased NF-kappaB activity in fibroblasts lacking the vitamin D receptor. Am J Physiol Endocrinol Metab. 2006;291(2):E315–322. doi:10.1152/ajpendo.00359.2005
32. Chen Y, Zhang J, Ge X, Du J, Deb DK, Li YC. Vitamin D receptor inhibits nuclear factor kappaB activation by interacting with IkappaB kinase beta protein. J Biol Chem. 2013;288(27):19450–19458. doi:10.1074/jbc.M113.467670
33. Khammissa RAG, Fourie J, Motswaledi MH, Ballyram R, Lemmer J, The Biological FL. Activities of vitamin D and its receptor in relation to calcium and bone homeostasis, cancer, immune and cardiovascular systems, skin biology, and oral health. Biomed Res Int. 2018;2018:9276380. doi:10.1155/2018/9276380
34. Chen Y, Liu X, Zhang F, et al. Vitamin D receptor suppresses proliferation and metastasis in renal cell carcinoma cell lines via regulating the expression of the epithelial Ca2+ channel TRPV5. PLoS One. 2018;13(4):e0195844. doi:10.1371/journal.pone.0195844
35. Rosen CJ, Adams JS, Bikle DD, et al. The nonskeletal effects of vitamin D: an endocrine society scientific statement. Endocr Rev. 2012;33(3):456–492. doi:10.1210/er.2012-1000
36. Dimitrov V, Salehi-Tabar R, An BS, White JH. Non-classical mechanisms of transcriptional regulation by the vitamin D receptor: insights into calcium homeostasis, immune system regulation and cancer chemoprevention. J Steroid Biochem Mol Biol. 2014;144(Pt A):74–80. doi:10.1016/j.jsbmb.2013.07.012
 © 2019 The Author(s). This work is published and licensed by Dove Medical Press Limited. The full terms of this license are available at https://www.dovepress.com/terms.php and incorporate the Creative Commons Attribution - Non Commercial (unported, v3.0) License.
By accessing the work you hereby accept the Terms. Non-commercial uses of the work are permitted without any further permission from Dove Medical Press Limited, provided the work is properly attributed. For permission for commercial use of this work, please see paragraphs 4.2 and 5 of our Terms.
© 2019 The Author(s). This work is published and licensed by Dove Medical Press Limited. The full terms of this license are available at https://www.dovepress.com/terms.php and incorporate the Creative Commons Attribution - Non Commercial (unported, v3.0) License.
By accessing the work you hereby accept the Terms. Non-commercial uses of the work are permitted without any further permission from Dove Medical Press Limited, provided the work is properly attributed. For permission for commercial use of this work, please see paragraphs 4.2 and 5 of our Terms.