")
Back to Journals » International Journal of Nanomedicine » Volume 13
Antitumor effect of a Pt-loaded nanocomposite based on graphene quantum dots combats hypoxia-induced chemoresistance of oral squamous cell carcinoma
Authors Wei Z, Yin XT , Cai Y , Xu WG, Song CH , Wang YF, Zhang JW, Kang A, Wang ZY, Han W
Received 14 November 2017
Accepted for publication 11 January 2018
Published 13 March 2018 Volume 2018:13 Pages 1505—1524
DOI https://doi.org/10.2147/IJN.S156984
Checked for plagiarism Yes
Review by Single anonymous peer review
Peer reviewer comments 2
Editor who approved publication: Professor Lei Yang
Zheng Wei,1,2,* Xiteng Yin,1,2,* Yu Cai,2,3 Wenguang Xu,1,2 Chuanhui Song,1,2 Yufeng Wang,1,2 Jingwei Zhang,4 An Kang,5 Zhiyong Wang,1,2 Wei Han1,2
1Department of Oral and Maxillofacial Surgery, Nanjing Stomatological Hospital, Medical School of Nanjing University, Nanjing, China; 2Central Laboratory of Stomatology, Nanjing Stomatological Hospital, Medical School of Nanjing University, Nanjing, China; 3Key Laboratory of Flexible Electronics and Institute of Advanced Materials, Jiangsu National Synergetic Innovation Center for Advanced Materials, School of Pharmaceutical Sciences, Nanjing Tech University, Nanjing, China; 4Key Laboratory of Drug Metabolism and Pharmacokinetics, China Pharmaceutical University, Nanjing, China; 5School of Pharmacy, Nanjing University of Chinese Medicine, Nanjing, China
*These authors contributed equally to this work
Background: Tumor microenvironment plays an important role in the chemoresistance of oral squamous cell carcinoma (OSCC). Hypoxia in the microenvironment is one of the important factors that contributes to OSCC chemoresistance; therefore overcoming hypoxia-mediated chemoresistance is one of the great challenges in clinical practice.
Methods: In this study, we developed a drug delivery system based on Pt-loaded, polyethylene glycol-modified graphene quantum dots via chemical oxidation and covalent reaction.
Results: Our results show that synthesized polyethylene glycol-graphene quantum dots-Pt (GPt) is about 5 nm in diameter. GPt sensitizes OSCC cells to its treatment in both normoxia and hypoxia conditions. Inductively coupled plasma-mass spectrometry assay shows that GPt enhances Pt accumulation in cells, which leads to a notable increase of S phase cell cycle arrest and apoptosis of OSCC cells in both normoxia and hypoxic conditions. Finally, compared with free cisplatin, GPt exhibits a strong inhibitory effect on the tumor growth with less systemic drug toxicity in an OSCC xenograft mouse tumor model.
Conclusion: Taken together, our results show that GPt demonstrates superiority in combating hypoxia-induced chemoresistance. It might serve as a novel strategy for future microenvironment-targeted cancer therapy.
Keywords: hypoxia tumor microenvironment, graphene oxide quantum dots, chemoresistance, Pt-loaded nanocomplexes, oral squamous cell carcinoma
Introduction
Despite rapid advances in therapeutic technologies and extensive research, the 5-year survival rate of oral squamous cell carcinoma (OSCC) has not improved in recent years and remains at 40%–60%.1,2 Chemotherapy is an alternative choice for patients with lymph node metastasis or tumor relapse after surgery.3 According to the treatment protocols for OSCC, cisplatin (cisdiamminedichloroplatinum (II) [CDDP])-based chemotherapeutic regimens are the first-line drugs recommended for OSCC patients. Theoretically, CDDP is able to bind with cell DNA, which could later lead to cell cycle arrest and finally cell death.4 However, many OSCC patients do not respond to conventional chemotherapy well due to drug resistance. In addition, the therapeutic performance of CDDP is also strongly affected by its poor solubility, systemic toxicity, and drug resistance.5 Thus, new strategies to overcome the drawbacks of free CDDP in chemotherapy are urgently needed.
Chemoresistance is mediated by multiple factors, such as abnormal uptake and metabolism of drugs, drug inactivation, and phenotype changes of tumor cells, etc.6 Recently, many studies have shown that tumor microenvironment plays a pivotal role in the development of chemoresistance.7 Hypoxia around tumor cells is widely regarded as a prominent factor of this microenvironment.8,9 To date, accumulating evidence suggests that tumor hypoxia contributes greatly to chemoresistance.10 In accordance with previous reports, our group has also demonstrated that tumor hypoxia promotes OSCC resistance to the treatment of CDDP, with hypoxia inducible factor-1α (HIF-1α) acting as a key mediator.11,12 Tumor microenvironment is a double-edged sword, because facts have proved that these special endogenous properties inside the tumor can be applied to trigger the release of cancer therapeutics.13 Vascular abnormalities and tumor metabolic activity seek increased glycolysis. Increased glycolysis leads to decreased pH and the pH could decline to 5.14 Currently, several studies have demonstrated that the acidic condition in the tumor site is a promising means of eliciting drug release.15–18 And, in our work, we found that drug molecules of Pt were preferentially released from the nanodrug in acidic conditions compared with the normal physical condition.
Currently, considerable efforts have been made to develop advanced drug delivery systems, aiming to improve the efficacy and reduce the side effects of chemotherapy.19,20 Recent studies have demonstrated that graphene quantum dots (GQDs) might be an ideal candidate.21–23 Different from conventional nano-sized drug platforms, GQDs exhibit extraordinary drug loading capacity via strong π–π stacking interactions and functional modification.21 Notably, functionalized GQDs are assumed to have a single atomic layer and dimensions <20 nm.24,25 Even with the loading of traditional anticancer drugs, such as CDDP, they can still be prepared in nano-sizes, enabling them to easily pass through the nuclear pore complex and reside within the cells, and that might help combat hypoxia-induced drug efflux and chemoresistance. Moreover, GQDs are made from carbon ensuring good water solubility, extraordinary biocompatibility, minimal toxicity, and stable fluorescence.21,23,26,27
In this study, we developed a tumor-targeted polyethylene glycol-graphene quantum dots-Pt (GPt) nanocomposite, based on polyethylene glycol (PEG)-modified GQDs to carry Pt. It was demonstrated that GPt could dramatically improve the chemotherapeutic efficacy for OSCC in vitro and in vivo, which might serve as a useful method for future tumor-targeted treatment.
Materials and methods
Materials and agents
Cis-Pt(NH3)2Cl2 (purity >98%), 4arm-PEG-Amine, 1-ethyl-3-[3-dimethylaminopropyl]carbodiimide hydrochloride (EDC), N-hydroxysuccinimide (NHS), O-phenylenediamine (OPDA), and dimethylformamide (DMF) were purchased from Sigma-Aldrich Co (St Louis, MO, USA). OPDA was used as an adjuvant to detect the existence form of CDDP. CX-72 carbon black was purchased from Cabot Corporation, Boston, MA, USA. Other reagents were obtained from Adamas-beta, Shanghai, China and Sigma-Aldrich Co. All solutions were prepared with ultrapure water (18.2 MU·cm) from a Millipore system (Millipore SAS, Molsheim, France). Dulbecco’s Modified Eagle’s Medium (DMEM, high glucose) and phosphate-buffered saline (PBS) were purchased from HyClone (GE Healthcare Life Sciences, Little Chalfont, UK). Fetal bovine serum (FBS) was purchased from Biological Industries Israel Beit-Haemek, Kibbutz Beit-Haemek, Israel. Annexin V-fluorescein isothiocyanate, an apoptosis detection kit (Vazyme Biotech Co, Ltd, Nanjing, China). A cell counting kit (CCK-8) was obtained from Sigma-Aldrich Co. Cell cycle analysis kit was purchased from KeyGene Inc (Nanjing, China). Hypoxia environment in the patient-derived tongue tumor xenograft (PDX) model was detected with Hypoxyprobe™-1 Plus Kit and the probe was purchased from Hypoxyprobe Inc (Burlington, MA, USA).
Preparation of graphene oxide (GO) quantum dots
GQDs were prepared following the method reported by Dong et al.28 Briefly, 0.2 g dried CX-72 carbon black was added to 50 mL HNO3 (6 M). The product was centrifuged (2,770× g) for 10 minutes to separate the supernatant and sediment. The sediment was washed with 1 M HCl and centrifuged (2,770× g) three times, and subsequently was dried under vacuum. Then, the dried sample was placed in 50 mL H2O, and thereafter the solution was adjusted to a pH of about 8 with 10 mM ammonia water. Dialysis was performed for 24 hours with a 100 kDa molecular weight cutoff membrane (Amicon Ultra-4; Merck Millipore, Billerica, MA, USA). Then, the supernatants were collected and freeze-dried to obtain GQDs.
Synthesis and characterization of GQDs-COOH, Pt-GQDs-COOH, and PEG-GQDs-Pt (GPt)
The surfaces of GQDs exhibit hydroxyl (OH), epoxy, and carboxyl (COOH) groups. To convert the OH and epoxy groups to COOH groups, 1.2 g NaOH and 1.0 g ClCH2COOH were added to 10 mL of aqueous GQDs solution (2 mg/mL), and the mixture was sonicated for 3 hours at room temperature to obtain GQDs-COOH. The product, GQDs-COOH, was neutralized with HCl and filtered and rinsed with distilled water at least three times.29 CDDP was loaded onto the GQDs-COOH by forming a covalent bond.30 To identify the best reaction ratio between CDDP and GQDs-COOH, CDDP (10 μM in 10−4 M hydrochloric acid) was added into GQDs-COOH suspensions at different concentrations. The mixture was bath-sonicated for 30 minutes and then stirred overnight at room temperature. EDC (12 mg) and NHS (18 mg) were added to the 5 mL Pt-GQDs-COOH suspension at pH 5.6, and the mixture was sonicated for 15 minutes.23 4arm PEG-NH2 (50 mg) was then added to the above suspension and stirred overnight at room temperature.23,29 The resultant solution was dispersed in 30 mL distilled water and immersed in a dialysis bag (molecular weight, 10,000 MD) to remove free substrates. Finally, the solution was dried with lyophilization to obtain GPt. To verify that CDDP had been attached to the GQDs, we used the method reported by Anilanmert et al and Raghavan and Mulligan.31,32 The product of CDDP interacting with OPDA can exhibit an ultraviolet (UV) absorption peak at 705 nm based on the ligand-exchange reaction between CDDP and OPDA, thus producing a new complex with a maximum absorbance at 705 nm.32 OPDA (14 mg) was dissolved in 10 mL DMF to prepare an OPDA stock solution. A suspension of GPt (100 μL) was added into 100 μL OPDA stock solution, and the mixture was heated for 30 minutes at 90°C. After cooling to room temperature, a mixture of DMF/water (7/3, v/v) was added to a total volume of 1 mL. The absorbance of the product was monitored at 705 nm. The GPt obtained was dissolved in distilled water for further experiments and atomic absorption spectrometry (AAS) was utilized to examine the Pt in the GPt solution.
UV–visible absorption spectra of GQDs, Pt-GQDs-COOH, and GPt in the spectral range of 200–500 nm were recorded by a UV-3600 UV–vis spectrophotometer (Shimadzu Corporation, Kyoto, Japan). Emission spectra were recorded by using an F-4600 spectrofluorophotometer (Hitachi Ltd, Tokyo, Japan). Both examinations were conducted with a 2-nm slit width at a scan speed of 200 nm/min. Transmission electron microscopy (TEM) and atomic force microscopy (AFM) were used to characterize the sizes of the GQDs and GPt. Diameter statics analysis was conducted by Nano Measurer 1.2 software (Jie Xu, Fudan University, Shanghai, China). Later on, dynamic light scattering (DLS; NanoPlus particle size analyzer; Brookhaven Instruments Corporation, Holtsville, NY, USA) was also utilized to detect the particle size of GQDs and GPt. In addition, the NanoPlus particle size analyzer was also utilized to detect the zeta potential of GQDs and GPt.
Pt release
The pH-responsive Pt-release behavior was observed using inductively coupled plasma-mass spectrometry (ICP-MS). Pt released from the GQDs was detected at pH 5.0 as follows: 5 mL of GPt was transfused into a dialysis bag (molecular weight: 10000 Da), and the bag was immersed in 30 mL of acetate buffer (pH 5) at room temperature. At each time point, the outer dialysate was collected and replaced with fresh acetate buffer. Pt released at pH 7.4 was evaluated using the same procedure except that the dialysate buffer was changed to PBS (pH 7.4). CDDP solutions with five concentrations served as standard samples.
Cell lines and cell culture
OSCC cell lines (HSC3, SCC4, and CAL-27) were obtained from the Cell Bank of the Chinese Academy of Sciences (Shanghai, China). Cells were cultured in a monolayer in DMEM supplemented with 10% FBS, 100 μg/mL streptomycin, and 100 U/mL penicillin in a humidified incubator (5% CO2/20% O2, normoxia or 5% CO2/1% O2, hypoxia) at 37°C. Confluent cells were trypsinized with 0.05% trypsin containing 0.02% ethylenediaminetetraacetic acid.
Cytotoxicity assay
The toxicities of CDDP, GQDs, PEG, and GPt were tested using CCK-8 kits. Cells were plated in 96-well plates at densities of 5,500–6,500 cells in 100 μL complete culture medium. Blank control wells containing the same volume of complete culture medium were included in each assay. The microplate was incubated for 3–5 hours at 37°C until cells adhered to the plates. The cells were then washed with PBS buffer and incubated with CDDP, GQDs, PEG, and GPt, which were serially diluted in the complete culture medium before use. The plate was incubated for a further 24–36 hours. CCK-8 (10 μL) was added to each well. The optical density (OD) of formazan at 450 nm was recorded every 0.5 hour until the OD was 1.0–2.0. Six wells corresponded to each concentration of the above drugs. Cell viability was calculated as follows: cell viability = ([OD]test − [OD]control)/([OD]control − [OD]blank) ×100%.
Measurement of Pt inside cells
The cell suspension was further lysed by sonication on an ultrasonic processor for 10 seconds at 20% amplitude. A portion of the lysate (750 μL) was then combined with 750 μL of a 2% HNO3 (v/v) solution, and the remainder of the lysate was quantified for protein concentration by bicinchoninic acid (BCA) assay. The 1% HNO3 solution was analyzed for Pt content using a PerkinElmer NexION 300x ICP-MS instrument (PerkinElmer Inc, Waltham, MA, USA). Pt counts were normalized to the amount of protein determined from the BCA analysis (to obtain [Pt]/[protein]). Every experiment was repeated three times.
Cell cycle analysis
Flow cytometry was used to detect the cell cycle using cell cycle kits. HSC3 cells were fixed with 70% cooled ethanol for 2 hours at 4°C and then washed three times with PBS. After treatment with RNase for 15 minutes at 37°C, 50 μg/mL propidium iodide (PI) was added to the cells followed by incubation for 15 minutes in the dark. Samples were detected with a FACSVerse flow cytometer (BD Biosciences, San Jose, CA, USA) and the data obtained were analyzed by FlowJo (FlowJo LLC, Ashland, OR, USA).
Apoptosis detection
Cells (HSC3 and SCC4) were incubated with CDDP, GQDs, PEG, and GPt or without any treatment. The concentration of Pt was the mean of the half maximal inhibitory concentration (IC50) values of CDDP and GPt. These cells were cultured in six-well plates. Apoptotic cells were quantified by dual staining with Annexin V and PI. After washing with PBS, the cells were suspended in cold binding buffer. Annexin V (5 μL) and 100 μL PBS were added into each well for 10 minutes at 4°C. Subsequently, 200 μL binding buffer containing 5 μL PI was added. Finally, the entire mixture was incubated at 4°C for another 15 minutes. All the incubation was performed in the dark. Samples were detected with a FACSVerse flow cytometer (BD Biosciences) and the data obtained were analyzed by FlowJo.
Measurement of GPt distribution in cells
Images were taken using a Nikon ECLIPSE Ti-S microscope (Nikon Corporation, Tokyo, Japan). HSC3 cells were cultured with GPt and Pt-GQD-COOH for 2, 5, 8, and 24 hours, respectively. The cell membrane was stained with 1,1′-Dioctadecyl-3,3,3′,3′-tetramethylindocarbocyanine perchlorate (Dil) in red. Pt-GQDs-COOH was used as the control.
Measurement of anticancer effect of GPt in xenograft tumor mouse model in vivo
Tumors were transplanted in BALB/cJNJu-Foxn1nu/Nju (4 weeks old) male mice via a hypodermic injection of 1×10⁶ HSC3 cells suspended in 100 μL PBS solution in each mouse. Each tumor was measured with calipers, and its volume VT was calculated as V = L* W*W/2. Chemotherapy began when VT reached ~100 mm3. Mice were randomly stratified into four experimental groups (n=5/group), which received the following treatments via tail vein injection: group A, PBS (100 μL); group B, CDDP (concentration of Pt 5 mg/kg; 100 μL); group C, GQDs (200 μg/mL; 100 μL), and group D, GPt (concentration of Pt 5 mg/kg; 100 μL). Treatments were repeated every 3 days for a total of 15 days. Mice were monitored daily for tumor growth (using digital calipers), cachexia, and weight loss. Finally, the mice were sacrificed by cervical dislocation under anesthesia.
Histopathological analysis and immunohistochemistry (IHC)
The major organs including heart, liver, kidney, and tumors were dissected and fixed in paraformaldehyde (PFA; 4%). Then, these tissues were dehydrated, embedded in paraffin, and stained with hematoxylin and eosin. Histologies were examined by a microscope (Olympus Corporation, Tokyo, Japan). Tumor sections counterstained with hematoxylin for nuclear coloration were observed using the microscope. The expression of HIF-1α in neoplastic tissues was detected to investigate the hypoxia environment in tumor sections before and after treatment. Apoptosis in the tumor specimens from mice was performed by the terminal deoxynucleotidyl transferase-mediated dUTP-biotin nick end labeling assay (TUNEL) assay using an in situ cell death kit (Hoffman-La Roche Ltd, Basel, Switzerland) according to the manufacturer’s protocol. The expression of HIF-1α and TUNEL in tumor tissues was detected by IHC. After treatment with the different formulations, tumor tissues were excised and fixed in 4% PFA until further use. The samples were rehydrated through a graded alcohol series before embedding with paraffin. The expression of HIF-1α proteins in these tissues was evaluated using biotinylated rabbit anti-human HIF-1α antibodies (Abcam, Cambridge, UK; ab216842).
Measurement of distribution of Pt inside tissues
ICP-MS (NexION 350D; PerkinElmer Inc) was used to detect the distribution of Pt inside major organs and tumors. Tumors and major organs were dissected from the mice after cervical dislocation and weighed. For ICP-MS analysis, solutions with five concentrations of CDDP (500, 50, 5, 0.5, and 0.05 ng/mL) were configured as standard samples. Tissue homogenate was digested with nitric acid for 20 minutes and then sonicated for 10 minutes. After all digests were centrifuged at 12,000 rpm for 10 minutes, 0.5 mL of supernatant was removed and diluted to 1 mL with redistilled water for analysis by ICP-MS. The amount of Pt was calculated using the standard samples.
Statistical analysis
All data were expressed as mean ± standard deviation. Statistical differences were measured using an unpaired two-sided Student’s t-test or one-way analysis of variance for multiple comparisons when appropriate. A p-value <0.05 was considered as a statistically significant difference. SPSS (SPSS Inc, Chicago, IL, USA), GraphPad (GraphPad Software Inc, La Jolla, CA, USA), and Origin (OriginLab Corporation, Northampton, MA, USA) software were used for the statistical analysis. Nano Measurer 1.2 was used to analyze the size of nanodrugs. Every experiment was repeated at least three times.
Ethics statement
Institutional review board approval was obtained from Nanjing Stomatological Hospital Ethics Committee (approval number, 2016NL-016[KS]). All animal experiments and experimental protocols were in accordance with the Animal Care and Use Committee of the Medical School of Nanjing University.
Results
Preparation and characterization of GQDs, GQDs-Pt, and GPt
The preparation process of GPt is illustrated in Figure 1. Materials were characterized by UV absorption, fluorescence emission, DLS, TEM, and AFM. UV-visible spectroscopy showed that the absorbance of GQDs ranged from 200 to 350 nm; however, there was an obvious extra small peak between 250 and 300 nm after Pt was loaded onto the GQDs (Figure 2A). GPt could be excited at 200 and 405 nm (Figure 2B). Intriguingly, strong emission could also be observed at 405 nm (Figure 2B). The interaction between GQDs and CDDP was verified by the decrease in UV–visible absorbance at 705 nm (Figure 2C). The UV–visible spectra of CDDP and OPDA in the presence of different concentrations of GQDs are shown in Figure 2E. No interaction was observed between GQDs and OPDA (Figure 2C, purple line). The strongest absorbance was exhibited by the complex formed by OPDA and free CDDP (Figure 2C, black line). However, the absorbance at 705 nm declined upon the addition of GQDs. Among all the tested GQDs-COOH concentrations, the addition of 200 μg/mL GQDs-COOH produced the lowest absorbance, indicating that CDDP had almost completely reacted with the GQDs-COOH. Considering no interaction occurred between GQDs-COOH and OPDA, the reduction in intensity at 705 nm was clearly caused by the interaction between GQDs and CDDP. Therefore, we used a 200 μg/mL/0.5 mM ratio of GQDs-COOH to CDDP in the following experiments. The GPt obtained was dissolved in distilled water for further experiments. AAS was utilized to examine the Pt in the GPt solution. Pt in the final GPt suspension was measured as 64.00 mg/L. So, the productive rate of Pt in the whole synthesis was 42% (productive rate = [64/300.05]/0.5×100%).
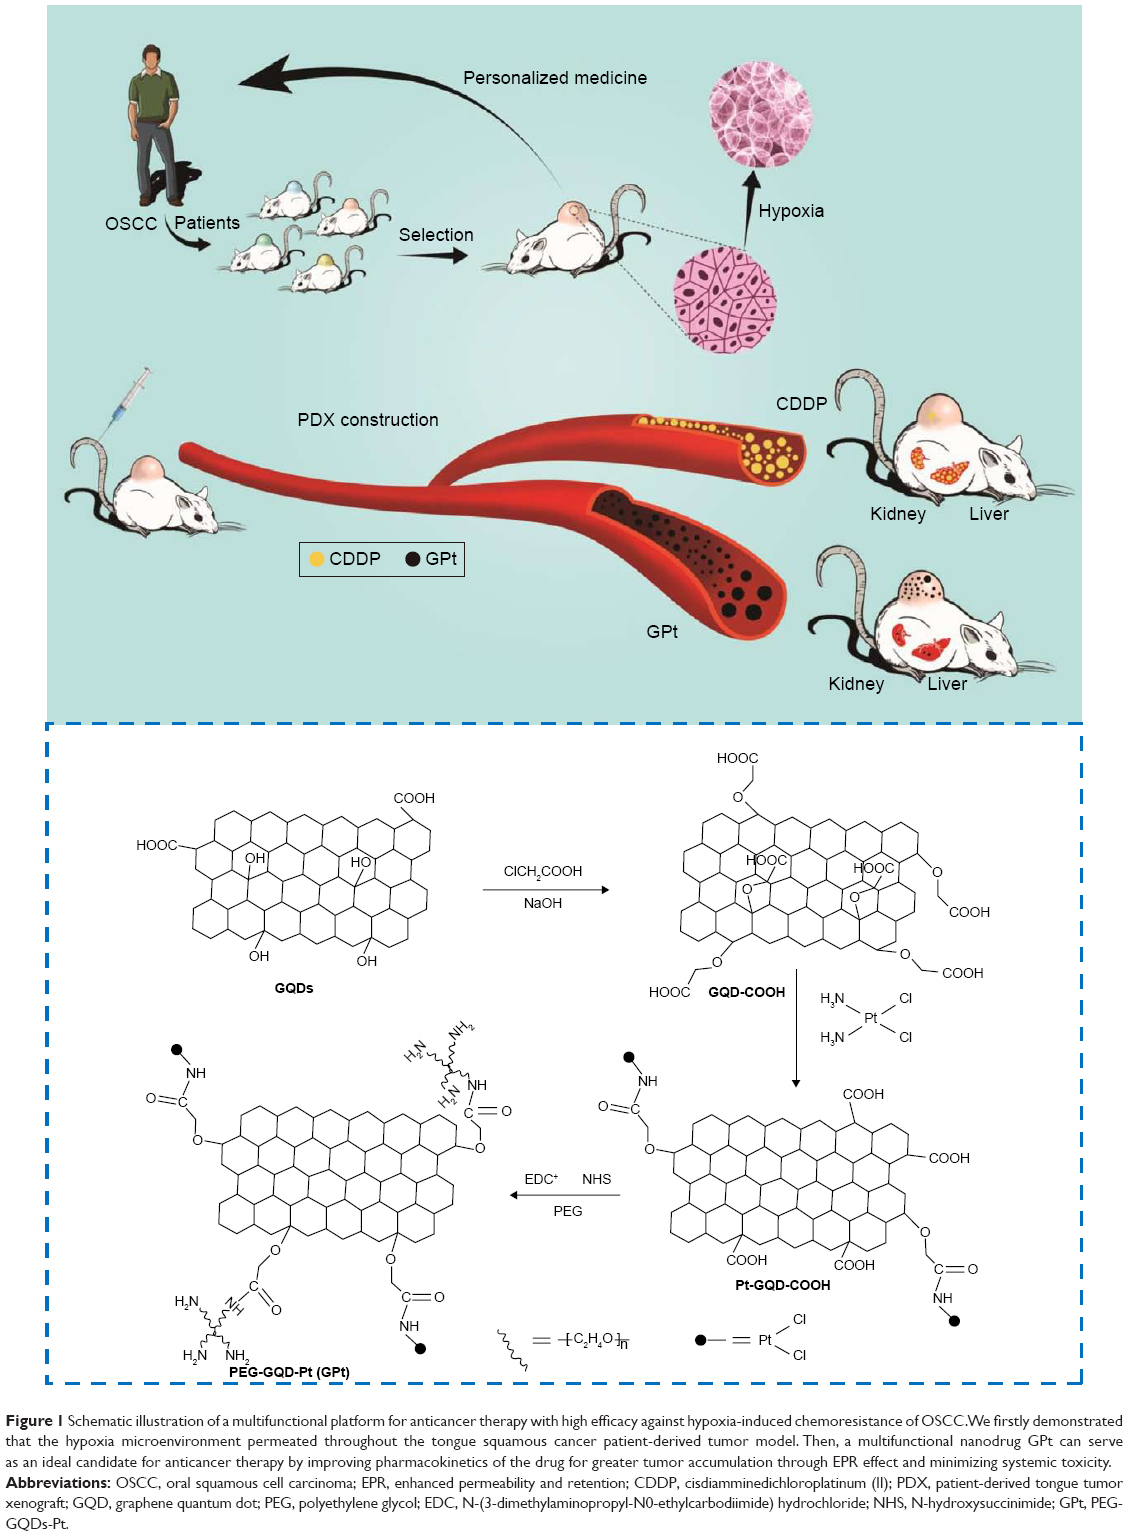 | Figure 1 Schematic illustration of a multifunctional platform for anticancer therapy with high efficacy against hypoxia-induced chemoresistance of OSCC. We firstly demonstrated that the hypoxia microenvironment permeated throughout the tongue squamous cancer patient-derived tumor model. Then, a multifunctional nanodrug GPt can serve as an ideal candidate for anticancer therapy by improving pharmacokinetics of the drug for greater tumor accumulation through EPR effect and minimizing systemic toxicity. |
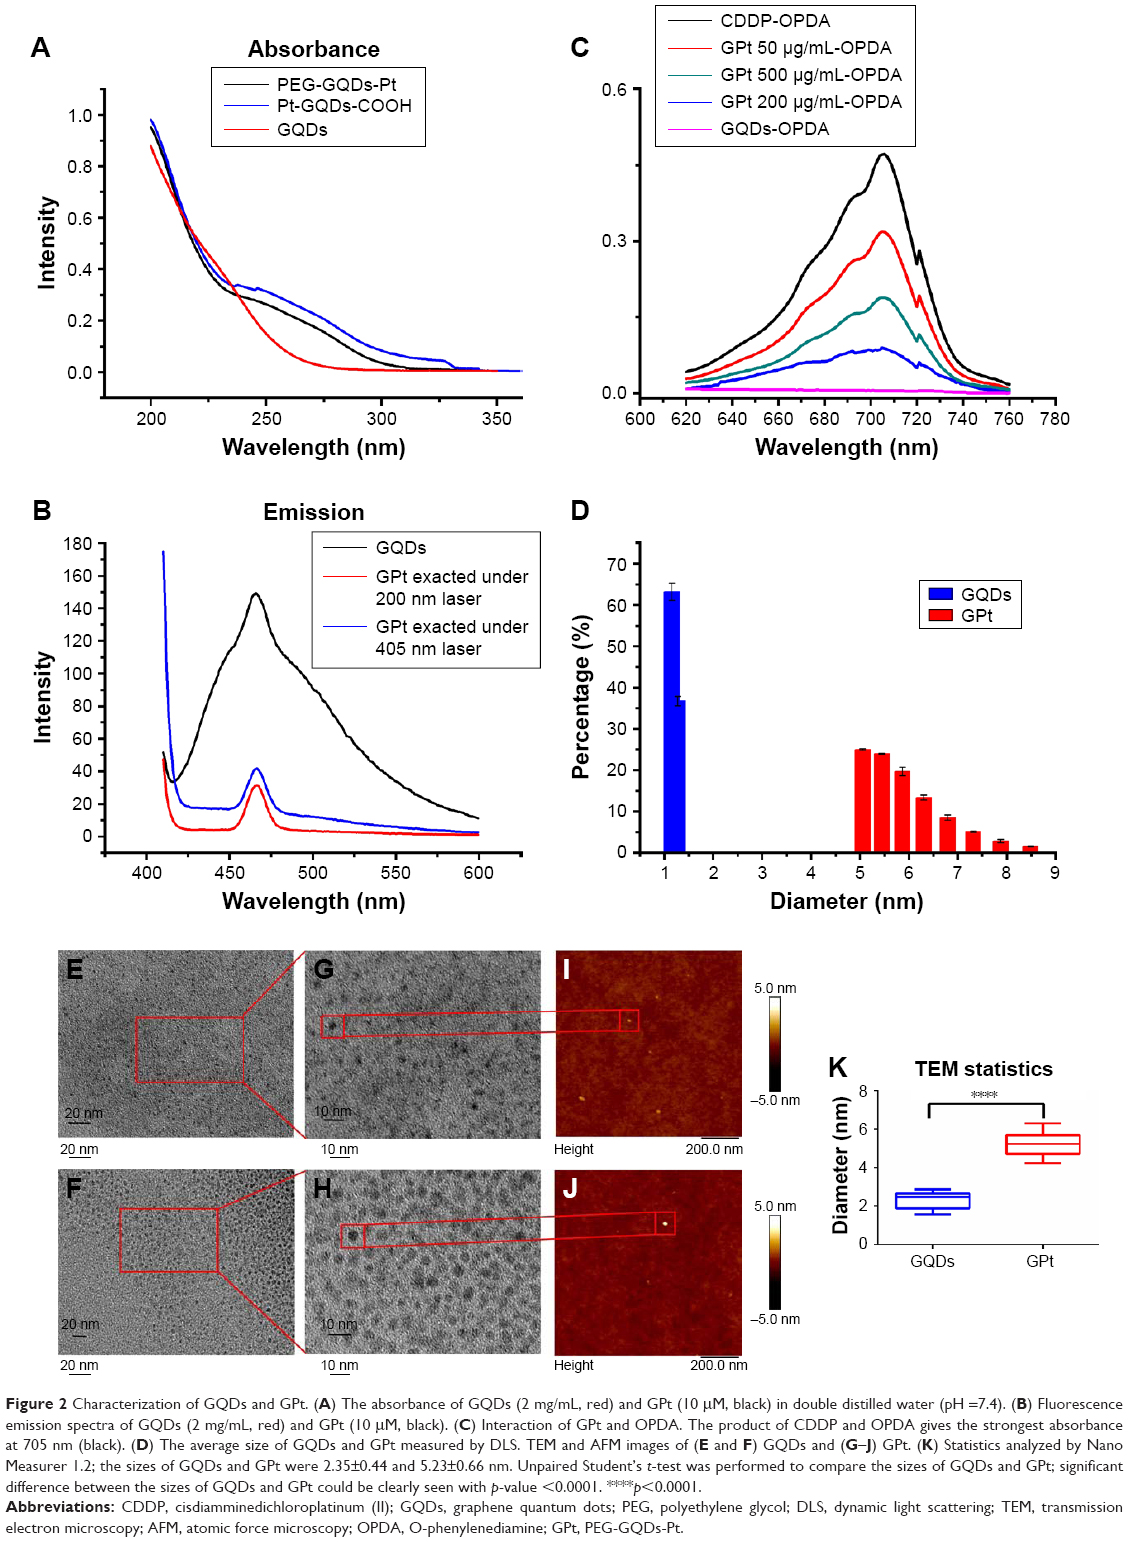 | Figure 2 Characterization of GQDs and GPt. (A) The absorbance of GQDs (2 mg/mL, red) and GPt (10 μM, black) in double distilled water (pH =7.4). (B) Fluorescence emission spectra of GQDs (2 mg/mL, red) and GPt (10 μM, black). (C) Interaction of GPt and OPDA. The product of CDDP and OPDA gives the strongest absorbance at 705 nm (black). (D) The average size of GQDs and GPt measured by DLS. TEM and AFM images of (E and F) GQDs and (G–J) GPt. (K) Statistics analyzed by Nano Measurer 1.2; the sizes of GQDs and GPt were 2.35±0.44 and 5.23±0.66 nm. Unpaired Student’s t-test was performed to compare the sizes of GQDs and GPt; significant difference between the sizes of GQDs and GPt could be clearly seen with p-value <0.0001. ****p<0.0001. |
The average sizes of GQDs and GPt were 1.35 and 5.72 nm, respectively, as measured by DLS (Figure 2D). Detailed information is provided in Table S1. The TEM and AFM images showed that GQDs and GPt were well dispersed with a uniform lateral size (Figure 2E–K). Nano Measurer 1.2 was used to analyze the result of TEM of nanodrugs. As shown in Figure 2K, the average size of GQDs was 2.35±0.44 nm and the average size of GPt was 5.23±0.66 nm which was similar to the result obtained by DLS (Figure 2D). Thus, the binding of PEG and Pt to the GQDs increased the diameter of the GQDs by ~2.88–4.37 nm. Zeta potential measurements were evaluated by NanoPlus and the result indicated that GQDs and GQDs-COOH acquired negative surface charge: −13.95±5.66 mV for GQDs (Figure S1A) and −15.57±6.08 mV for GQDs-COOH (Figure S1B). Four-armed PEG-NH2 could reverse the negative charge to positive surface charge, +9.61±3.82 mV (Figure S1C). The positive potential of GPt on one hand could avoid GQD aggregation and on the other hand could enhance cellular uptake.
pH-dependent release of Pt
The initial concentration of Pt in the final GPt suspension in PBS was measured as 64 mg/L. The pH-triggered release of Pt from GPt was calculated by AAS. Pt release was evaluated in acidic environments (pH =5.0) at eight different time points, which is a key feature of the environment both around tumor cells and within tumor cells, especially in lysosomes. The released Pt was filtrated at the defined time intervals and assayed by AAS (Table S1). It was demonstrated that there was much more Pt released at lower pH. Nearly 80% and 84.41% of Pt was released in 24 and 48 hours, respectively, at pH 5.0, which was nearly two-fold more than the amount released at pH 7.4 (Figure 3A). This pH-sensitive Pt-release behavior is very important for “smart” drug carriers since many pathological environments in tumor tissues, intracellular lysosomes, and endosomes have a lower pH than in normal tissues and cells.16,33 To improve the stability of GQDs in physiological solution, GQDs were sonicated into smaller pieces. Four-armed PEG-amine was conjugated to the carboxylic acid groups on GQDs-Pt via amide formation.29,34 As seen in Figure 3B and C, GPt exhibited remarkable stability in all biological solutions, including stroke-physiological saline solution, PBS, and DMEM (Figure 3B), while nano GO existed as a mass of sediment in these solutions as shown in Figure 3C. On one hand, GPt can be triggered in acidic condition at a pH of 5. On the other hand, GPt nanodrug can still keep stable with clean solution without visual sediment, which is superior to GO, as GO would tend to aggregate in sediment (Figure S2).
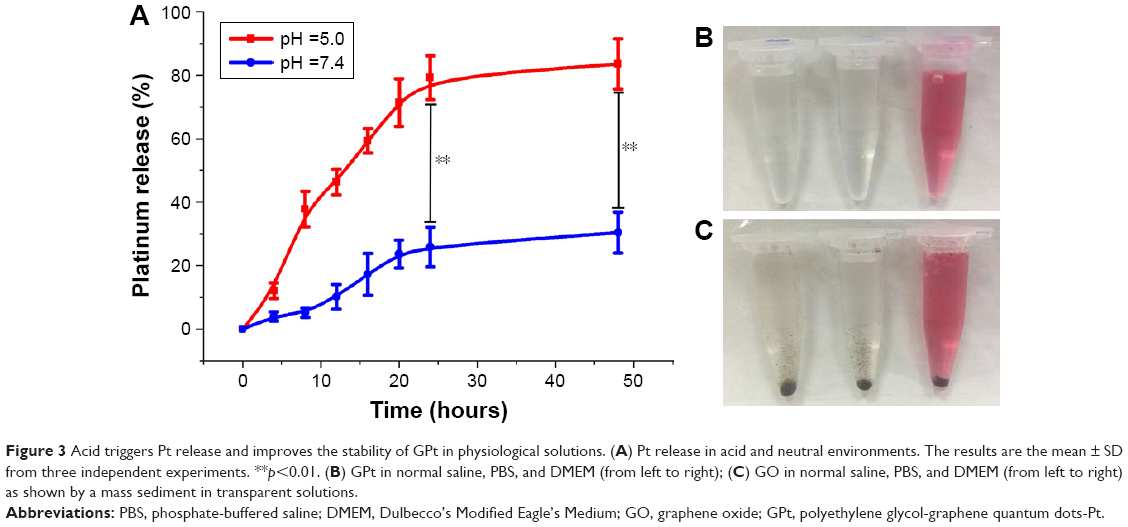 | Figure 3 Acid triggers Pt release and improves the stability of GPt in physiological solutions. (A) Pt release in acid and neutral environments. The results are the mean ± SD from three independent experiments. **p<0.01. (B) GPt in normal saline, PBS, and DMEM (from left to right); (C) GO in normal saline, PBS, and DMEM (from left to right) as shown by a mass sediment in transparent solutions. |
In vitro antitumor effect of GPt in normoxia condition
CDDP, which has the ability to inhibit cell proliferation, serves as a first-line medicine for the treatment of testicular and ovarian cancers along with cervical, bladder, and head and neck cancers.4,35 To evaluate the therapeutic efficacy of GPt, the cytotoxicity of different formulations was evaluated in HSC3, SCC4, and CAL-27 cells (Figure 4A–D).
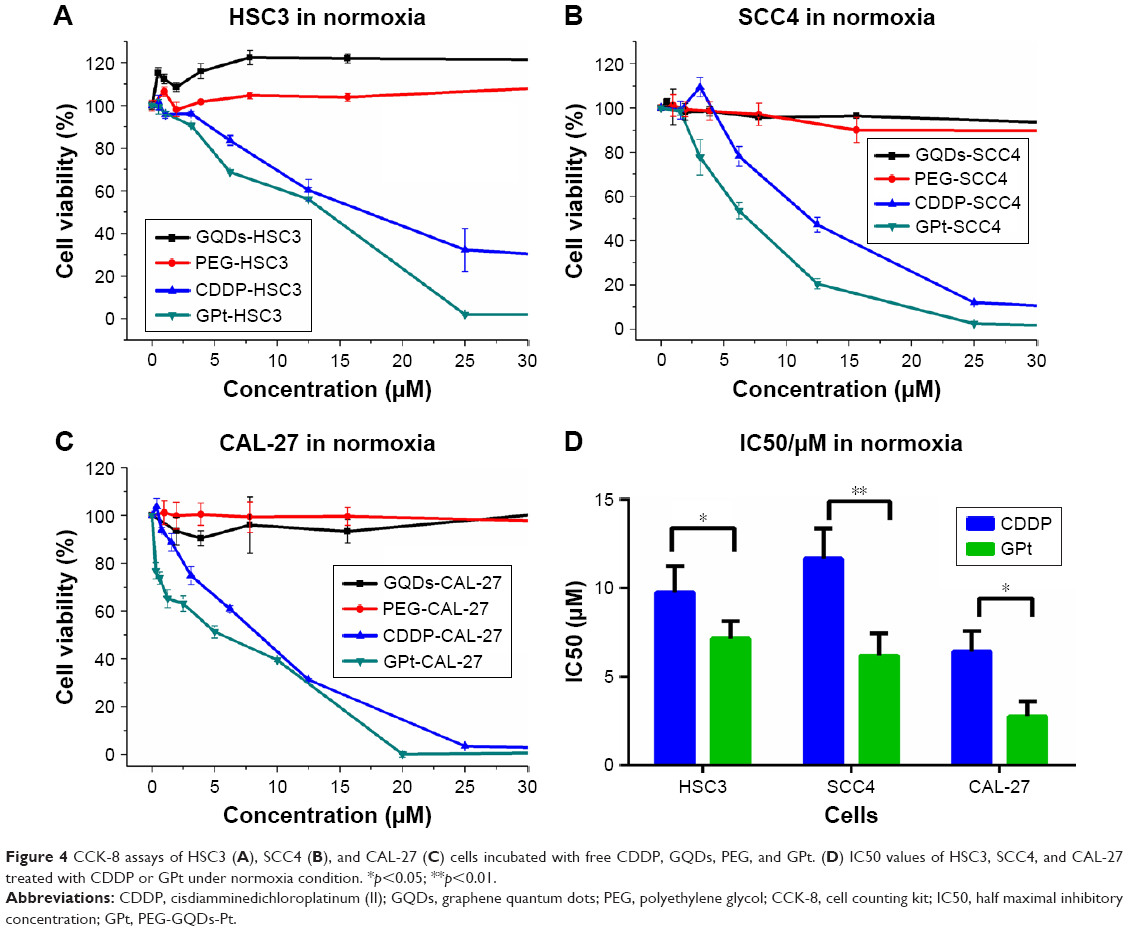 | Figure 4 CCK-8 assays of HSC3 (A), SCC4 (B), and CAL-27 (C) cells incubated with free CDDP, GQDs, PEG, and GPt. (D) IC50 values of HSC3, SCC4, and CAL-27 treated with CDDP or GPt under normoxia condition. *p<0.05; **p<0.01. |
As shown in Figure 4A, both PEG and GQDs showed almost no cytotoxicity to HSC3 cells with the cell viability remaining at ~90% after 24 hours of incubation. In contrast, the nanoplatform constructed by the GQDs significantly enhanced the cytotoxicity of Pt to tumor cells. The IC50 value of free CDDP for HSC3 cells after 24 hours of incubation was 9.77±1.49 μM, whereas the IC50 value of GPt was only 7.15±0.99 μM and nearly 70% of tumor cells could be killed by 9.77 μM GPt after 24 hours (Figure 4D). The same trend was observed in the CAL-27 and SCC4 cell lines (Figure 4B and C). The IC50 values were 6.42±1.16 and 2.77±0.84 μM for CAL-27 cells, and 11.67±1.70 and 6.19±1.25 μM for SCC4 cells when treated with CDDP and GPt, respectively (Figure 4B and C). These results together demonstrated that GPt dramatically improved the anticancer efficacy in vitro.
In vitro antitumor effect of GPt in hypoxia condition
Hypoxyprobe was used to demonstrate the existence of a hypoxia microenvironment in a PDX model (Figure S3). Antitumor effect of GPt was detected in vitro in hypoxia condition. The results proved that both HSC3 and SCC4 cells became resistant to free CDDP, resulting in a much higher IC50 value than that in normoxia condition (Figure 5A–C). Specifically, IC50 values of HSC3 and SCC4 treated with free CDDP changed from 9.77±1.49 and 11.67±0.41 μM in normoxia to 17.87±3.95 and 25.74±1.13 μM in hypoxia (Figure 5C). In contrast, the IC50 values of GPt did not change greatly between normoxia and hypoxia condition (ie, from 7.15±0.99 to 7.87±2.86 μM for HSC3 cells, and from 6.19±1.25 to 13.27±0.68 μM for SCC4 cells, respectively) (Figure 5C). Taken together, these results demonstrated that tumor hypoxia could lead to chemoresistance, and GPt was superior to free CDDP in its cytotoxic ability to kill OSCC cells in hypoxia.
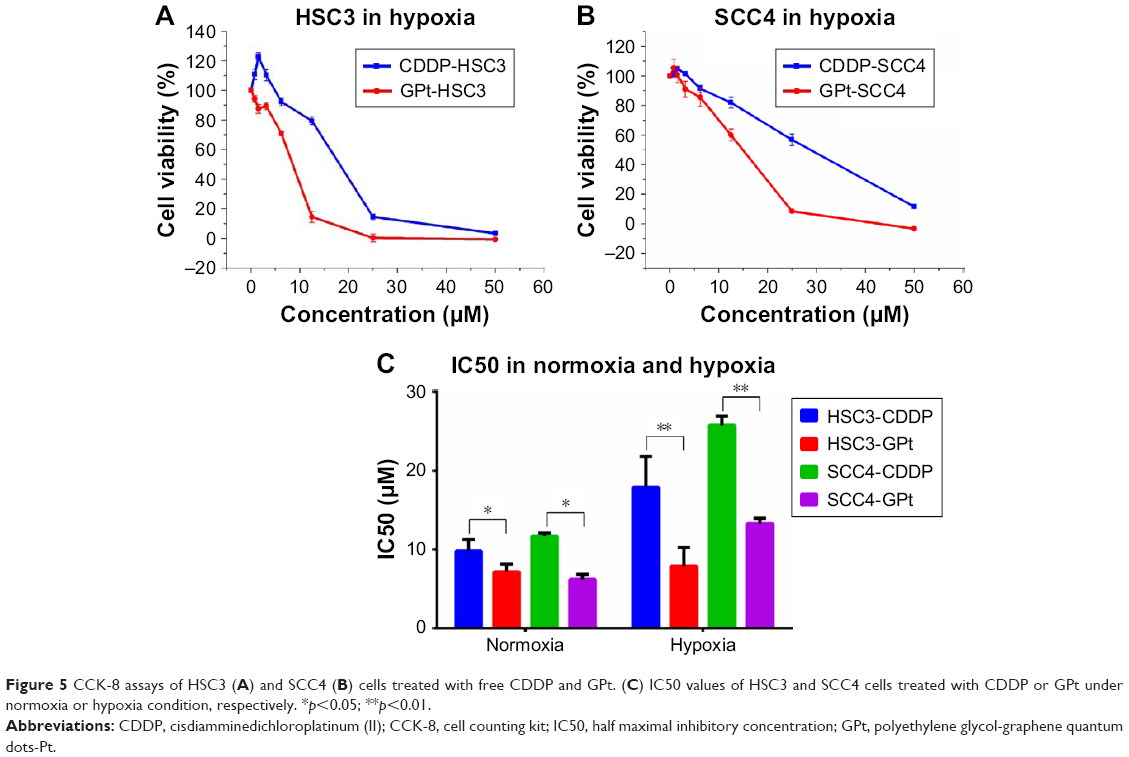 | Figure 5 CCK-8 assays of HSC3 (A) and SCC4 (B) cells treated with free CDDP and GPt. (C) IC50 values of HSC3 and SCC4 cells treated with CDDP or GPt under normoxia or hypoxia condition, respectively. *p<0.05; **p<0.01. |
GPt enhances cell cycle arrest and promotes OSCC cells apoptosis
Destruction of the cell cycle is generally accepted as one of the possible mechanisms to kill cells.4,36 Consistent with this, after HSC3 cells were treated with the mean value of free CDDP and GPt IC50 in normoxia or hypoxia (8.46 μM for normoxia, and 12.84 μM for hypoxia), both free CDDP and GPt led to a significant but comparable cell cycle arrest at the S phase (74.65%±2.49% vs 68.39%±1.33%) in normoxia (Figure 6A–H, Table S2). In contrast, cells remained at the G1 phase as a direct response to the effect of hypoxia. However, it was still observed that GPt had the ability to cause more cells arrest in S phase compared with CDDP and control groups (p<0.05), which partially explained the mechanism GPt applied to promote cell apoptosis (Figure 6E–H).
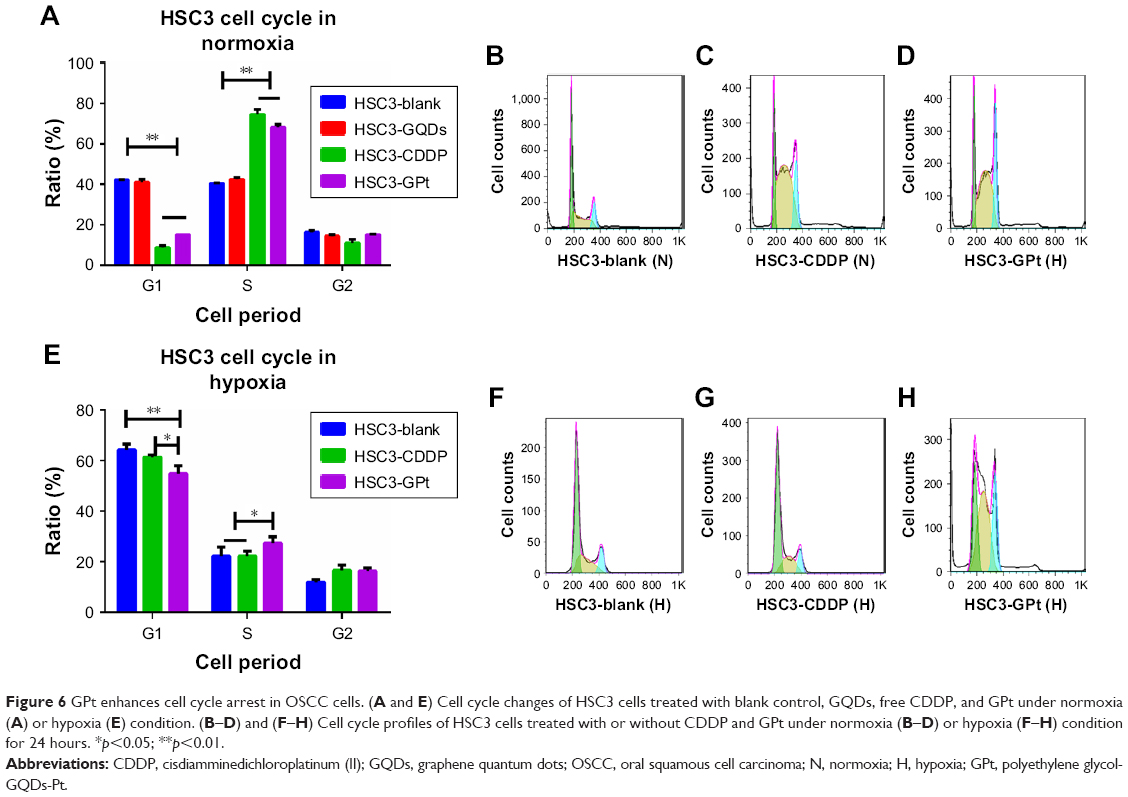 | Figure 6 GPt enhances cell cycle arrest in OSCC cells. (A and E) Cell cycle changes of HSC3 cells treated with blank control, GQDs, free CDDP, and GPt under normoxia (A) or hypoxia (E) condition. (B–D) and (F–H) Cell cycle profiles of HSC3 cells treated with or without CDDP and GPt under normoxia (B–D) or hypoxia (F–H) condition for 24 hours. *p<0.05; **p<0.01. |
In addition to cell cycle arrest, GPt treatment promoted cell apoptosis compared with free CDDP (Figure 7). In normoxia, GPt treatment resulted in over 70% and 50% cell apoptosis in HSC3 and SCC4 cells, respectively, whereas free CDDP induced only ~50% and 30% (Figure 7A, C, D, and F). Similarly, in hypoxia, GPt treatment led to nearly 30% and 52.34% cell apoptosis in HSC3 and SCC4 cells, respectively, whereas free CDDP induced only ~9.02% and 32.3% (Figure 7B, C, E, and F).
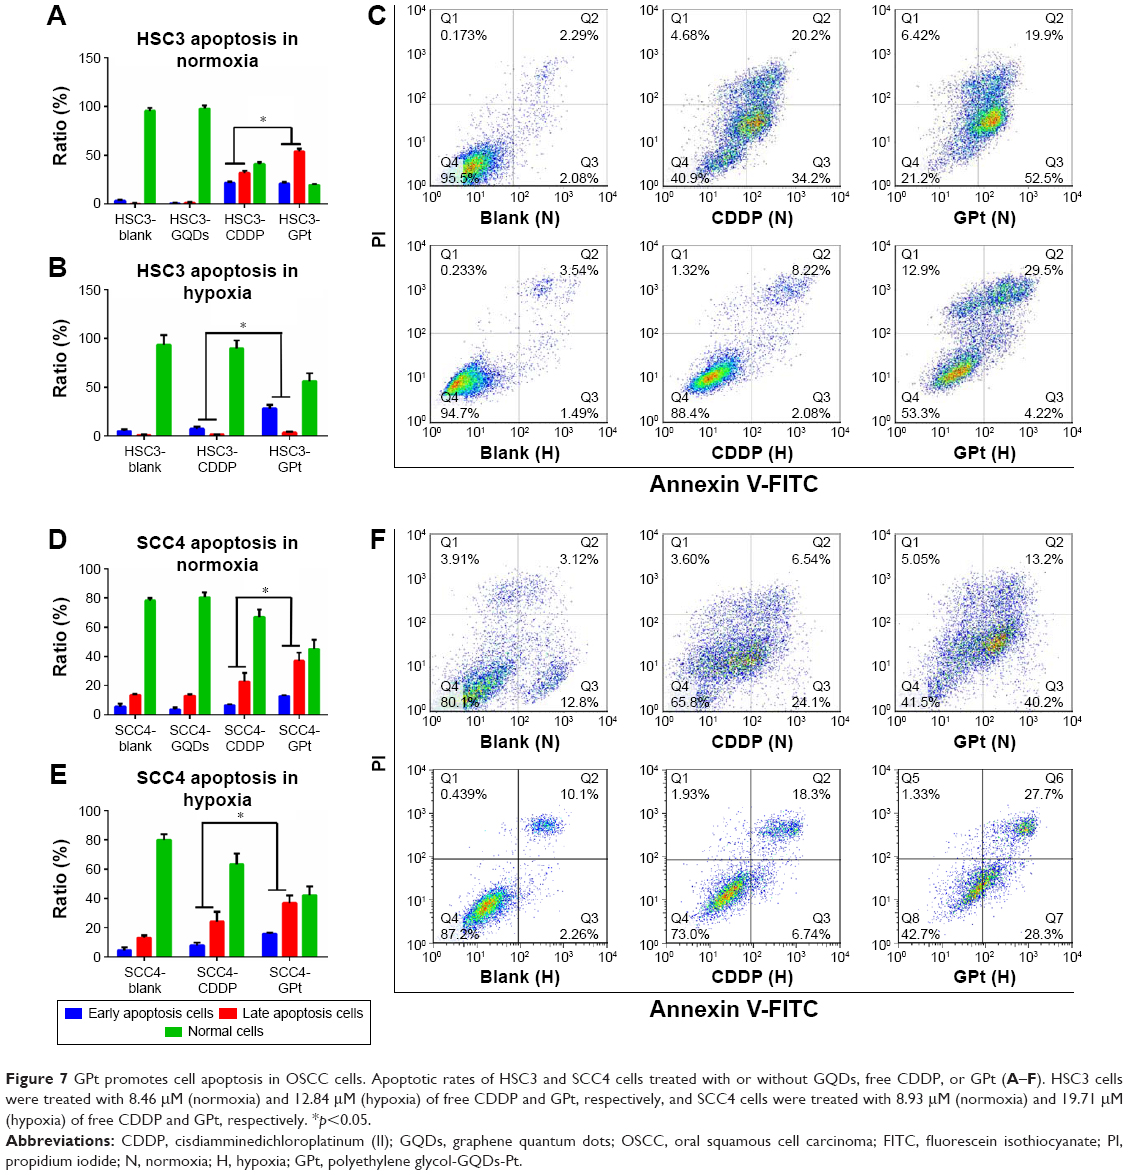 | Figure 7 GPt promotes cell apoptosis in OSCC cells. Apoptotic rates of HSC3 and SCC4 cells treated with or without GQDs, free CDDP, or GPt (A–F). HSC3 cells were treated with 8.46 μM (normoxia) and 12.84 μM (hypoxia) of free CDDP and GPt, respectively, and SCC4 cells were treated with 8.93 μM (normoxia) and 19.71 μM (hypoxia) of free CDDP and GPt, respectively. *p<0.05. |
Taken together, these results demonstrate that GPt has a much more potent ability to induce OSCC cell cycle arrest and enhance cell apoptosis than free CDDP.
GPt increases Pt accumulation in cells and promotes Pt translocation into the nucleus
CDDP delivery systems based on nanocarriers such as micelles, nanoparticles, and graphene have been shown to have the ability to increase uptake of Pt and reduce side effects.37 Hence, we studied Pt accumulation in GPt-treated cells using ICP-MS. As shown in Figure 8A and Table S3, the amount of Pt loaded on GQDs inside the cells was 3.13- to 5.02-fold greater than that for free CDDP inside the HSC3, SCC4, and CAL-27 cells in normoxia. A similar increase was also observed in hypoxia (Figure 8B, Table S3). Thus, the GQD-based nanoplatform significantly enhanced the accumulation of Pt inside OSCC cells in both normoxia and hypoxia.
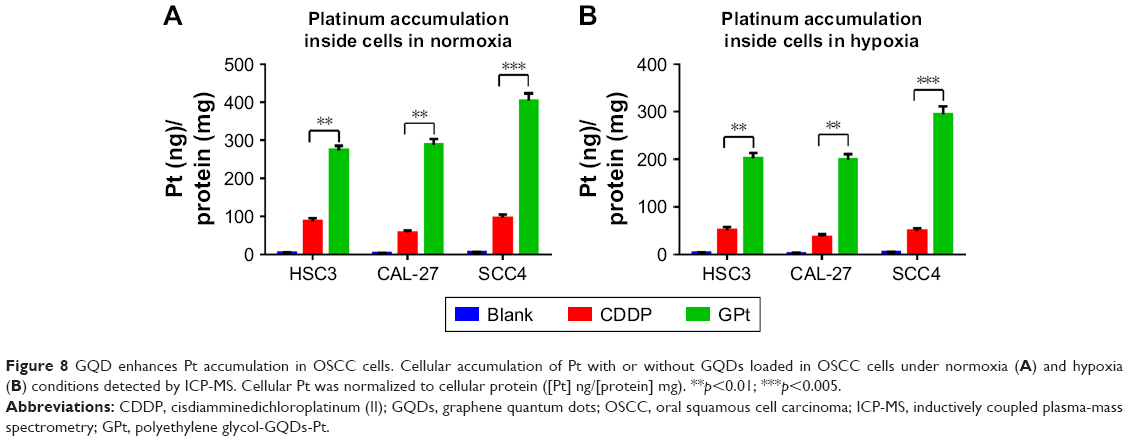 | Figure 8 GQD enhances Pt accumulation in OSCC cells. Cellular accumulation of Pt with or without GQDs loaded in OSCC cells under normoxia (A) and hypoxia (B) conditions detected by ICP-MS. Cellular Pt was normalized to cellular protein ([Pt] ng/[protein] mg). **p<0.01; ***p<0.005. |
To further visually identify the distribution of GQD-based nanosystems in cells, confocal laser scanning microscopy was used. Two hours after incubation, GPt was observed mostly in the cytoplasm (Figure 9A). Five to eight hours after incubation, GPt could be observed in the nucleus, but still mostly remained in the cytoplasm (Figure 9B and C). With the incubation time increased to 24 hours, the luminescence of GPt in the nucleus became much stronger and the cell morphology became more irregular (Figure 9D). This demonstrates that the GQDs can transfer Pt into the cell nucleus, suggesting that the GQDs are potential nucleus-targeted platforms for drug delivery. Pt-GQD-COOH was used as a control to demonstrate that the positive charge of GPt could enhance Pt accumulated in cells. As shown in Figure S4, compared with GPt, the intensity of fluorescence inside the cells was weak. Variance between GPt and Pt-GQD-COOH suggested that the positive charge also played a role in increasing Pt cellular uptake.
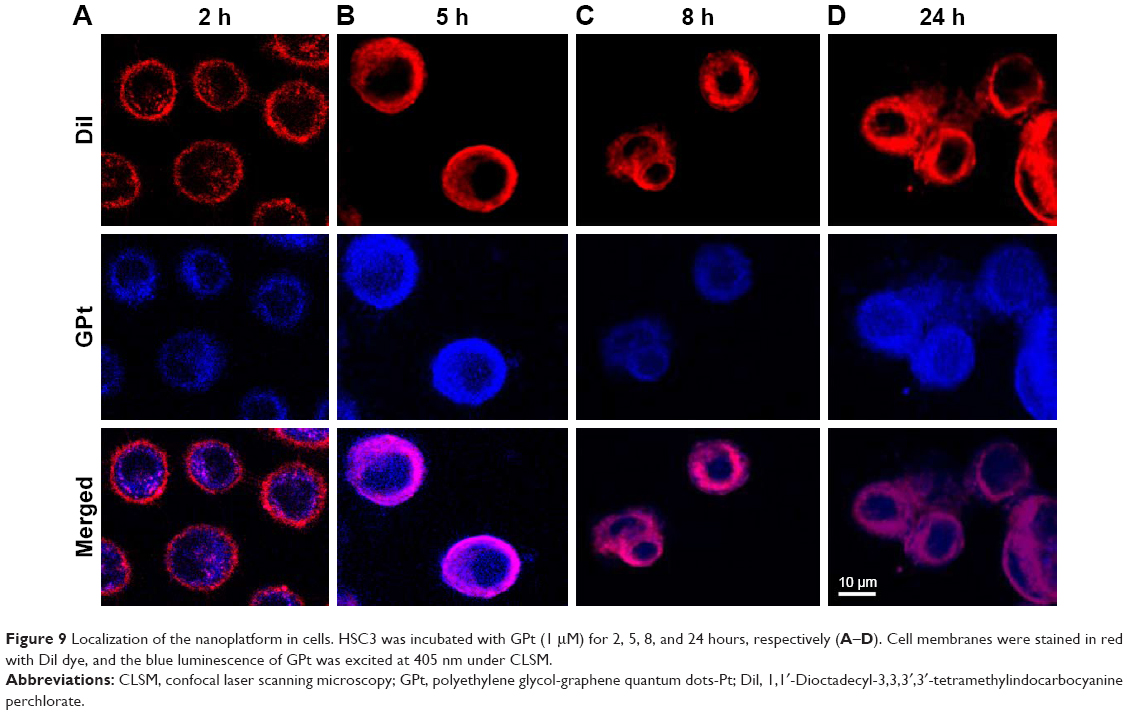 | Figure 9 Localization of the nanoplatform in cells. HSC3 was incubated with GPt (1 μM) for 2, 5, 8, and 24 hours, respectively (A–D). Cell membranes were stained in red with Dil dye, and the blue luminescence of GPt was excited at 405 nm under CLSM. |
GPt inhibits tumor growth in vivo
Finally, the in vivo tumor growth inhibitory effect was investigated. As shown in Figure 10A, CDDP injection led to a slight decrease in animal weight compared with other groups, which was likely due to the systemic toxicity of CDDP (Figure 10A and C). Moreover, a significant growth inhibitory effect was observed in the GPt group (Figure 10B), suggesting that GPt exerted a more powerful anticancer effect than CDDP alone in vivo. HIF-1α expression was also detectable before and after treatment, suggesting that hypoxia did function as an important factor (Figures 10D and S5). Increased cell apoptosis stained with TUNEL was observed in the GPt group compared with the control and CDDP groups (Figure 10D).
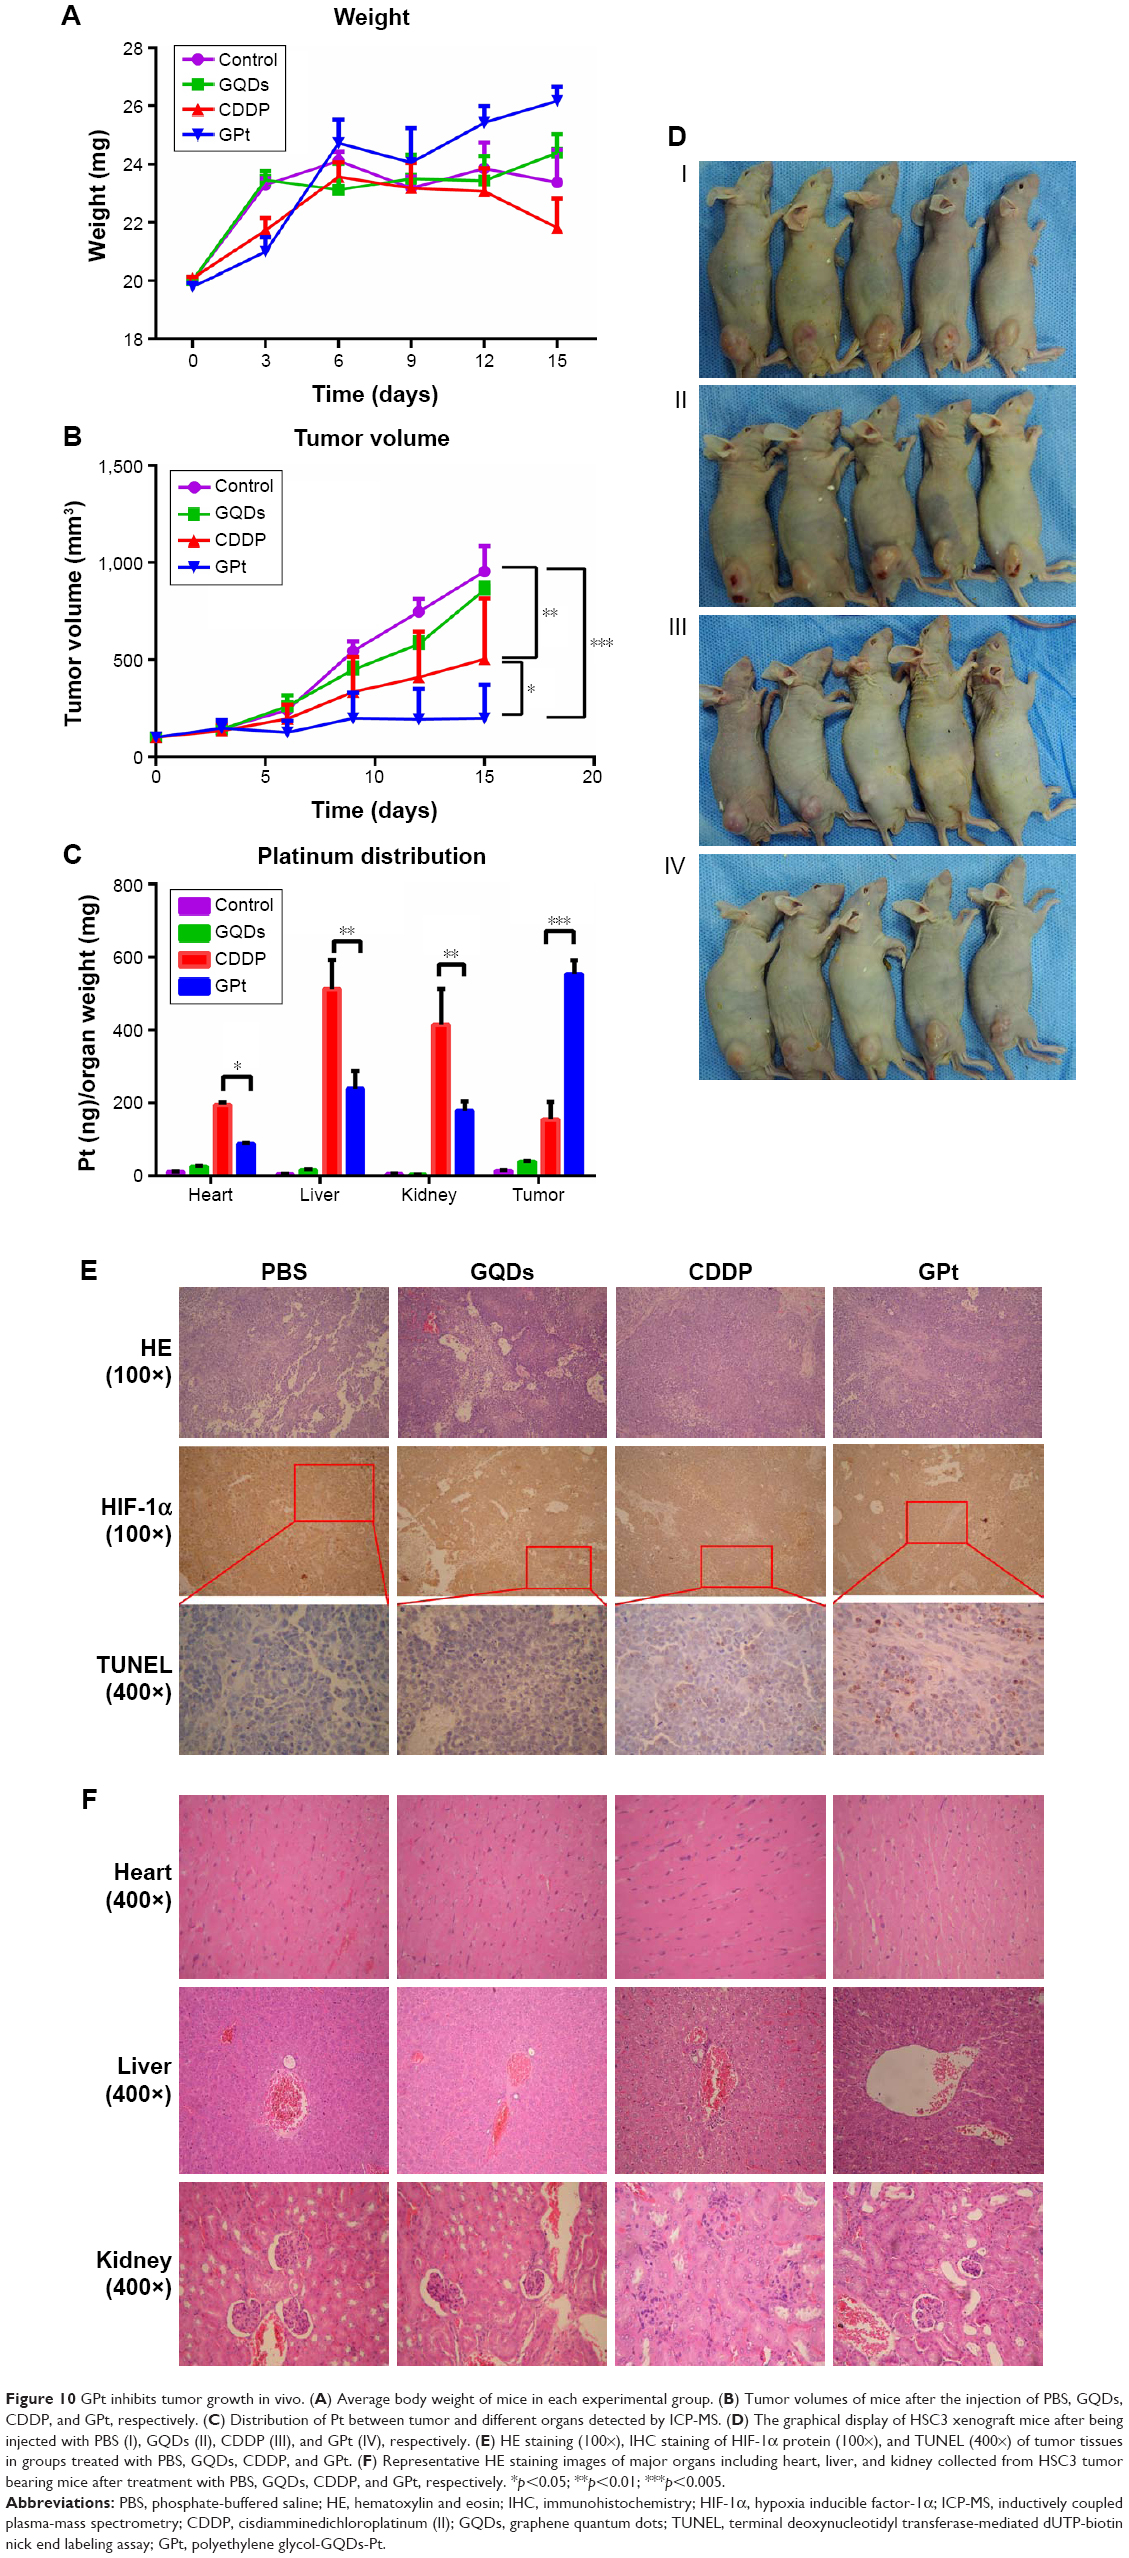 | Figure 10 GPt inhibits tumor growth in vivo. (A) Average body weight of mice in each experimental group. (B) Tumor volumes of mice after the injection of PBS, GQDs, CDDP, and GPt, respectively. (C) Distribution of Pt between tumor and different organs detected by ICP-MS. (D) The graphical display of HSC3 xenograft mice after being injected with PBS (I), GQDs (II), CDDP (III), and GPt (IV), respectively. (E) HE staining (100×), IHC staining of HIF-1α protein (100×), and TUNEL (400×) of tumor tissues in groups treated with PBS, GQDs, CDDP, and GPt. (F) Representative HE staining images of major organs including heart, liver, and kidney collected from HSC3 tumor bearing mice after treatment with PBS, GQDs, CDDP, and GPt, respectively. *p<0.05; **p<0.01; ***p<0.005. |
To investigate the systemic side effects, major organs of treated mice were collected. Livers in the CDDP group showed a sizable amount of inflammatory cell infiltration in the portal area, while there were tiny/small cells of denaturation observed in the GPt group (Figure 10E). Hearts exhibited no obvious differences among all groups; kidneys in the CDDP group had more swelling and vacuolation of proximal tubular epithelial cells, and inflammatory cell infiltration compared with the control and GPt groups (Figure 10E). Furthermore, Pt biodistribution in the major organs and tumor sites detected by ICP-MS analysis indicated a larger amount of Pt (553.62±38.09 ng [Pt]/mg [Tumor]) accumulated in tumor sites in the GPt group than the amount of Pt (154.70±48.19 ng [Pt]/mg [Tumor]) in the CDDP group (Figure 10F). Meanwhile, mice injected with CDDP showed a wide distribution of Pt in different organs such as kidney (414.97±98.24 ng [Pt]/mg [Kidney]) and liver (512.04±81.26 ng [Pt]/mg [Liver]), whereas much less Pt accumulation was observed in kidney (178.18±26.80 ng [Pt]/mg [Kidney]) and liver (239.16±48.50 ng [Pt]/mg [Liver]) in the GPt group (Figure 10F). These results together proved that GQDs could serve as an ideal candidate for cancer targeting drug carriers, which could significantly improve cancer therapeutic effects and reduce systemic side effects.
Discussion
As tumor recurrence and metastasis are commonly observed in OSCC patients, chemotherapy is still regarded as one of the most effective means. Unfortunately, many patients develop chemotherapy resistance due to various reasons.38 Tumor hypoxia has been widely recognized as a major factor for chemoresistance.11,39 So far, many attempts have been made to enhance the efficacy of Pt by using adjuvants, drug combinations, and nanomedicine systems. For instance, survivin inhibitor YM155 and 3′,4′,5′,5,7-pentamethoxyflavone were shown to have the ability to sensitize cancer cells to CDDP.18,40 Previously, our group has also improved CDDP efficacy in hypoxia by the combined use of metformin to inhibit the activation of NF-κB/HIF-1α signaling.12 However, the systemic toxicity of CDDP cannot be avoided.
Recently, the application of nanoparticles for drug delivery has attracted considerable attention. For instance, enhanced antitumor efficacy of CDDP was observed by co-loading CDDP and miRNA-375 into lipid nanoparticles.40 However, studies on nanocarriers have rarely focused on hypoxia-induced chemoresistance. Herein, we developed a drug delivery nanosystem based on GQDs. Our results showed that GPt has the ability to promote Pt accumulation in tumor cells, reverse hypoxia-induced therapeutic resistance, and decrease the side effects of CDDP. Graphene-like materials are preeminent multifunctional materials in biomedicine because of their outstanding characteristics, including biosecurity, and excellent thermal properties.21 Unfortunately, the large lateral size of GO and the interactions among GO layers could cause GO accretion.18 To avoid accretion of GO, GQDs were used to ensure that the nanocomposite became more stable and thus could be stored for weeks before use. Additionally, the nanosystem developed in this study has good solubility and stability because of improved size and shape and its blue photoluminescence used for cell imaging.
The nanodrug system developed in this study exhibited great advantages in the treatment of OSCC compared with free CDDP. These results can be explained by the different cellular uptake mechanisms between GQDs and CDDP. It was demonstrated that GQDs were internalized via caveolae-mediated endocytosis, while free CDDP entered the cells via copper transportation systems.41,42 Our in vivo study confirmed that GPt could not only promote the accumulation of Pt in tumor sites, but also significantly decreased the distribution in the liver and kidney. The cytotoxic effect of GPt on the normal cell lines in normoxia and hypoxia was also detected, and it turned out that GPt actually killed normal cells in both conditions (Figure S6). Therefore, the reason for GPt’s reduced systemic side effects in vivo is that GPt could gather more in tumor tissues via enhanced permeability and retention effect, not that GPt had no cytotoxic effect on normal cells.
Conclusion
GPt, a multifunctional nanocomposite based on GQDs, was successfully developed in our study. GPt could enhance cell cycle arrest in the S phase and lead to cell apoptosis. It could increase Pt accumulation inside cells in both normoxia and hypoxia. The performance of GPt in vivo showed that GPt could be an ideal candidate for anticancer therapy by improving pharmacokinetics of the drug for greater tumor accumulation and minimizing systemic toxicity. Therefore, our synthesized nano delivery system is expected to have wide clinical applications in future anticancer treatment.
Acknowledgments
This study was supported by the Jiangsu Provincial Key Research and Development Program (BE2017741), Nanjing Foundation for Development of Science and Technology (2017sc512031 and 201605042), and Jiangsu Provincial Natural Science Foundation (BK 20160051). In addition, we are grateful to Professor Zhou Ge from MD Anderson Cancer Center, Houston, TX, USA, for his help in English language review of the article.
Disclosure
The authors report no conflicts of interest in this work.
References
Lambert R, Sauvaget C, de Camargo Cancela M, Sankaranarayanan R. Epidemiology of cancer from the oral cavity and oropharynx. Eur J Gastroenterol Hepatol. 2011;23(8):633–641. | ||
Kimple AJ, Welch CM, Zevallos JP, Patel SN. Oral cavity squamous cell carcinoma – an overview. Oral Health Dent Manag. 2014;13(3):877–882. | ||
Pfister DG, Ang K, Brockstein B, et al. NCCN practice guidelines for head and neck cancers. Oncology. 2000;14(11A):163–194. | ||
Langer T, am Zehnhoff-Dinnesen A, Radtke S, Meitert J, Zolk O. Understanding platinum-induced ototoxicity. Trends Pharmacol Sci. 2013;34(8):458–469. | ||
Ferreira JA, Peixoto A, Neves M, et al. Mechanisms of cisplatin resistance and targeting of cancer stem cells: adding glycosylation to the equation. Drug Resist Updat. 2016;24:34–54. | ||
Senthebane DA, Rowe A, Thomford NE, et al. The role of tumor microenvironment in chemoresistance: to survive, keep your enemies closer. Int J Mol Sci. 2017;18(7):pii:E1586. | ||
Castells M, Thibault B, Delord JP, Couderc B. Implication of tumor microenvironment in chemoresistance: tumor-associated stromal cells protect tumor cells from cell death. Int J Mol Sci. 2012;13(8):9545–9571. | ||
Coleman CN. Hypoxia in tumors: a paradigm for the approach to biochemical and physiologic heterogeneity. J Natl Cancer Inst. 1988;80(5):310–317. | ||
Finger EC, Giaccia AJ. Hypoxia, inflammation, and the tumor microenvironment in metastatic disease. Cancer Metastasis Rev. 2010;29(2):285–293. | ||
Wilson WR, Hay MP. Targeting hypoxia in cancer therapy. Nat Rev Cancer. 2011;11(6):393–410. | ||
Han S, Xu W, Wang Z, et al. Crosstalk between the HIF-1 and Toll-like receptor/nuclear factor-κB pathways in the oral squamous cell carcinoma microenvironment. Oncotarget. 2016;7(25):37773–37789. | ||
Qi X, Xu W, Xie J, et al. Metformin sensitizes the response of oral squamous cell carcinoma to cisplatin treatment through inhibition of NF-κB/HIF-1α signal axis. Sci Rep. 2016;6:35788. | ||
Alshememry AK, El-Tokhy SS, Unsworth LD. Using properties of tumor microenvironments for controlling local, on-demand delivery from biopolymer-based nanocarriers. Curr Pharm Des. Epub 2017 May 21. | ||
Damaghi M, Gillies R. Phenotypic changes of acid-adapted cancer cells push them toward aggressiveness in their evolution in the tumor microenvironment. Cell Cycle. 2017;16(19):1739–1743. | ||
Kostka L, Šubr V, Laga R, et al. Nanotherapeutics shielded with a pH responsive polymeric layer. Physiol Res. 2015;64(Suppl 1):S29–S40. | ||
Zhou T, Xiao C, Fan J, et al. A nanogel of on-site tunable pH-response for efficient anticancer drug delivery. Acta Biomater. 2013;9(1):4546–4557. | ||
Choy CJ, Ley CR, Davis AL, et al. Second-generation tunable pH-sensitive phosphoramidate-based linkers for controlled release. Bioconjug Chem. 2016;27(9):2206–2213. | ||
Li J, Lyv Z, Li Y, et al. A theranostic prodrug delivery system based on Pt(IV) conjugated nano-graphene oxide with synergistic effect to enhance the therapeutic efficacy of Pt drug. Biomaterials. 2015;51:12–21. | ||
Wang Y, Wang K, Zhao J, et al. Multifunctional mesoporous silica-coated graphene nanosheet used for chemo-photothermal synergistic targeted therapy of glioma. J Am Chem Soc. 2013;135(12):4799–4804. | ||
Oh SS, Lee BF, Leibfarth FA, et al. Synthetic aptamer-polymer hybrid constructs for programmed drug delivery into specific target cells. J Am Chem Soc. 2014;136(42):15010–15015. | ||
Tian F, Lyu J, Shi J, Yang M. Graphene and graphene-like two-denominational materials based fluorescence resonance energy transfer (FRET) assays for biological applications. Biosens Bioelectron. 2016;89(Pt 1):123–135. | ||
Su X, Chan C, Shi J, et al. A graphene quantum dot@Fe3O4@SiO2 based nanoprobe for drug delivery sensing and dual-modal fluorescence and MRI imaging in cancer cells. Biosens Bioelectron. 2016;92:489–495. | ||
Chen H, Wang Z, Zong S, et al. A graphene quantum dot-based FRET system for nuclear-targeted and real-time monitoring of drug delivery. Nanoscale. 2015;7(37):15477–15486. | ||
Markovic ZM, Ristic BZ, Arsikin KM, et al. Graphene quantum dots as autophagy-inducing photodynamic agents. Biomaterials. 2012;33(29):7084–7092. | ||
Suryawanshi A, Biswal M, Mhamane D, et al. Large scale synthesis of graphene quantum dots (GQDs) from waste biomass and their use as an efficient and selective photoluminescence on–off–on probe for Ag(+) ions. Nanoscale. 2014;6(20):11664–11670. | ||
Ciobotaru CC, Damian CM, Matei E, Iovu H. Covalent functionalization of graphene oxide with cisplatin. Mater Plast. 2014;51(1):75–80. | ||
Hwang DW, Kim HY, Li F, et al. In vivo visualization of endogenous miR-21 using hyaluronic acid-coated graphene oxide for targeted cancer therapy. Biomaterials. 2017;121:144–154. | ||
Dong Y, Chen C, Zheng X, et al. One-step and high yield simultaneous preparation of single- and multi-layer graphene quantum dots from CX-72 carbon black. J Mater Chem. 2012;22(18):8764–8766. | ||
Zhang W, Guo Z, Huang D, Liu Z, Guo X, Zhong H. Synergistic effect of chemo-photothermal therapy using PEGylated graphene oxide. Biomaterials. 2011;32(33):8555–8561. | ||
Tian L, Pei X, Zeng Y, et al. Functionalized nanoscale graphene oxide for high efficient drug delivery of cisplatin. J Nanopart Res. 2014;16(11):2709. | ||
Anilanmert B, Yalcin G, Ariöz F, Dölen E. The spectrophotometric determination of cisplatin in urine, using o-phenylenediamine as derivatizing agent. Anal Lett. 2001;34(1):113–123. | ||
Raghavan R, Mulligan JA. Low-level (PPB) determination of cisplatin in cleaning validation (rinse water) samples. I. An atomic absorption spectrophotometric method. Drug Dev Ind Pharm. 2000;26(4):423–428. | ||
Wu W, Shen J, Gai Z, Hong K, Banerjee P, Zhou S. Multi-functional core-shell hybrid nanogels for pH-dependent magnetic manipulation, fluorescent pH-sensing, and drug delivery. Biomaterials. 2011;32(36):9876–9887. | ||
Liu Z, Robinson JT, Sun X, Dai H. PEGylated nano-graphene oxide for delivery of water insoluble cancer drugs. J Am Chem Soc. 2008;130(33):10876–10877. | ||
Jamieson ER, Lippard SJ. Structure, recognition, and processing of cisplatin-DNA adducts. Chem Rev. 1999;99(9):2467–2498. | ||
Chaney SG, Campbell SL, Bassett E, Wu Y. Recognition and processing of cisplatin- and oxaliplatin-DNA adducts. Crit Rev Oncol Hematol. 2005;53(1):3–11. | ||
Pan Y, Sahoo NG, Li L. The application of graphene oxide in drug delivery. Expert Opin Drug Deliv. 2012;9(11):1365–1376. | ||
Yu ZW, Zhong LP, Ji T, Zhang P, Chen WT, Zhang CP. MicroRNAs contribute to the chemoresistance of cisplatin in tongue squamous cell carcinoma lines. Oral Oncol. 2010;46(4):317–322. | ||
Selvendiran K, Bratasz AM, Kuppusamy ML, Tazi MF, Rivera BK, Kuppusamy P. Hypoxia induces chemoresistance in ovarian cancer cells by activation of signal transducer and activator of transcription 3. Int J Cancer. 2009;125(9):2198–2204. | ||
Yang T, Zhao P, Rong Z, et al. Anti-tumor efficiency of lipid-coated cisplatin nanoparticles co-loaded with microRNA-375. Theranostics. 2016;6(1):142–154. | ||
Wu C, Wang C, Han T, Zhou X, Guo S, Zhang J. Insight into the cellular internalization and cytotoxicity of graphene quantum dots. Adv Healthc Mater. 2013;2(12):1613–1619. | ||
Safaei R, Howell SB. Regulation of the cellular pharmacology and cytotoxicity of cisplatin by copper transporters. In: Teicher BA, editor. Cancer Drug Resistance. New York: Humana Press; 2006:309–327. |
Supplementary materials
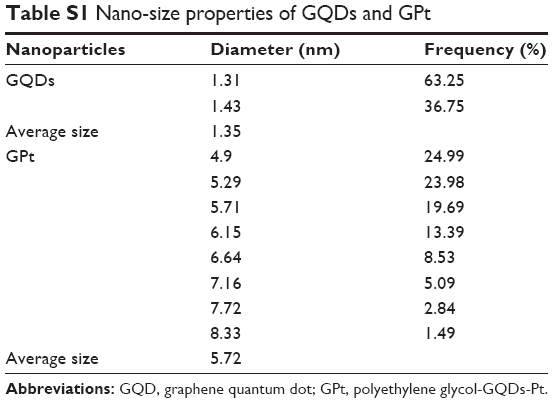 | Table S1 Nano-size properties of GQDs and GPt |
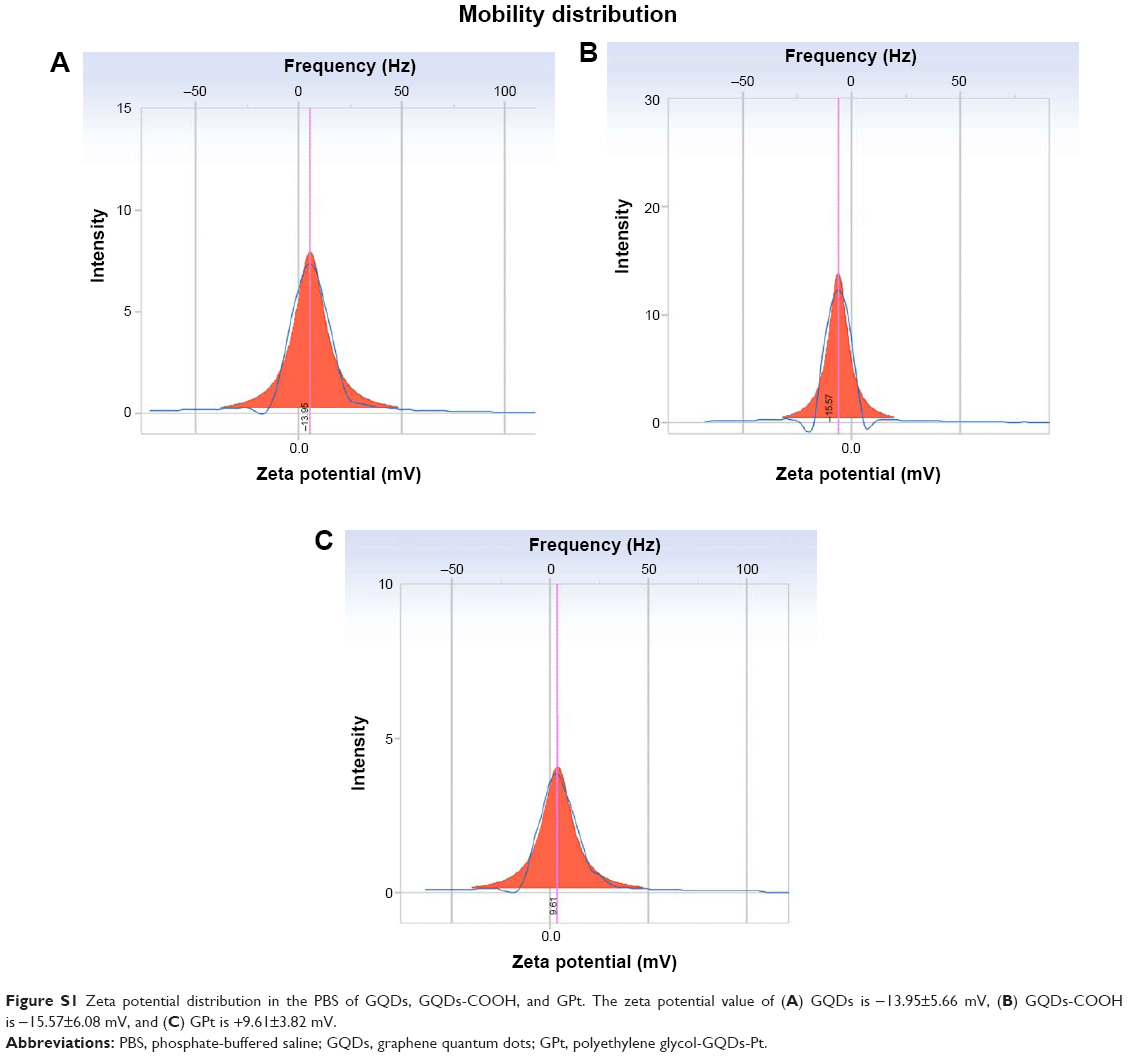 | Figure S1 Zeta potential distribution in the PBS of GQDs, GQDs-COOH, and GPt. The zeta potential value of (A) GQDs is −13.95±5.66 mV, (B) GQDs-COOH is −15.57±6.08 mV, and (C) GPt is +9.61±3.82 mV. |
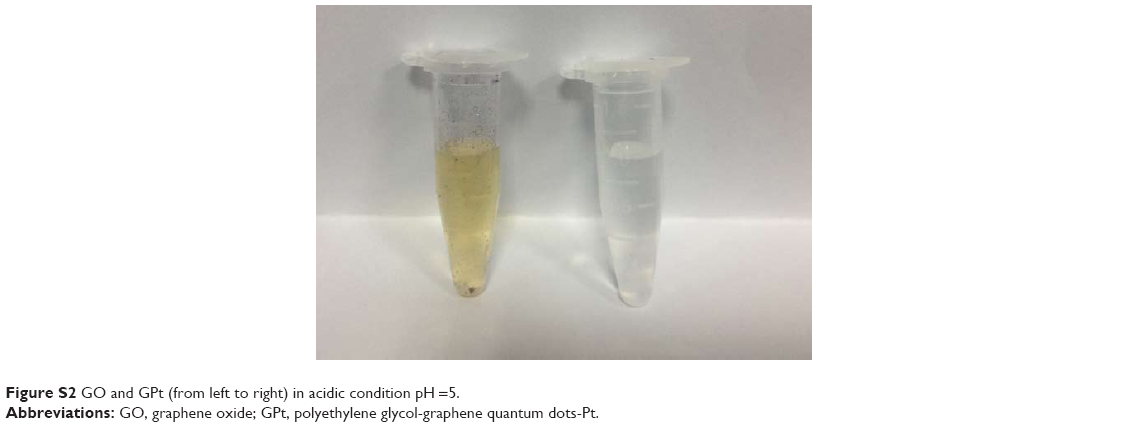 | Figure S2 GO and GPt (from left to right) in acidic condition pH =5. |
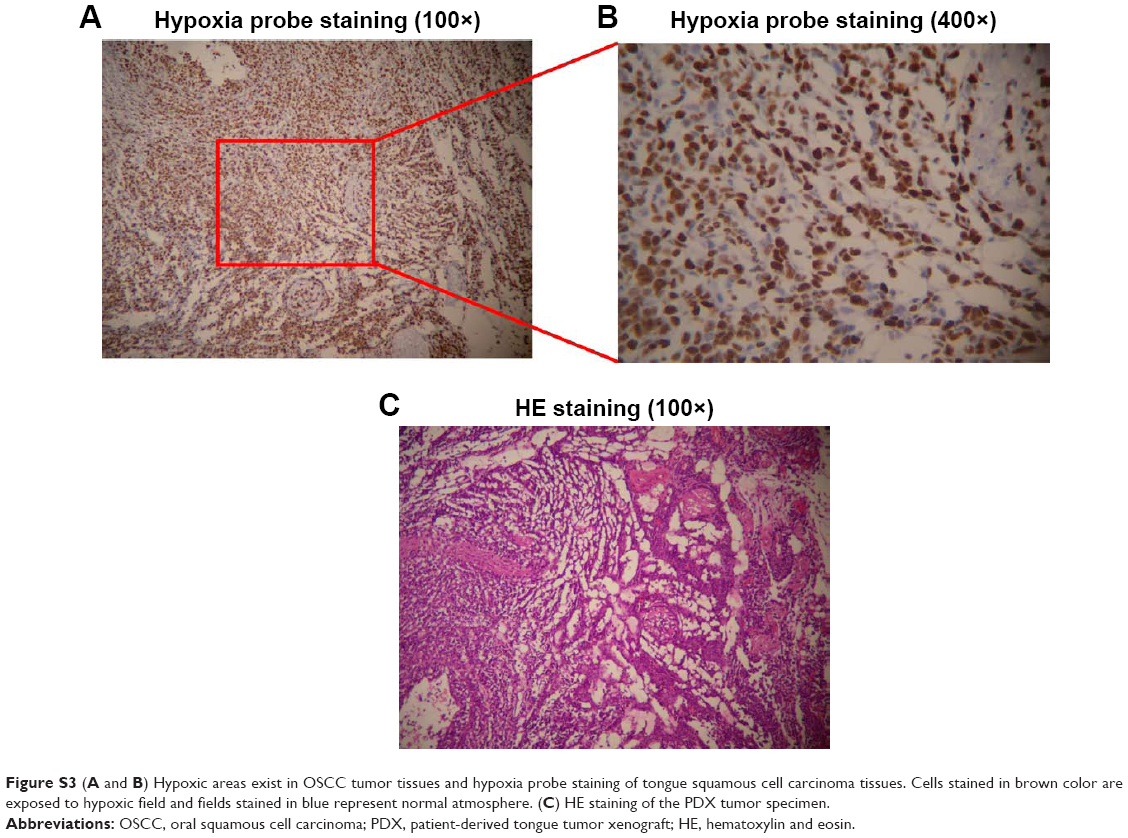 | Figure S3 (A and B) Hypoxic areas exist in OSCC tumor tissues and hypoxia probe staining of tongue squamous cell carcinoma tissues. Cells stained in brown color are exposed to hypoxic field and fields stained in blue represent normal atmosphere. (C) HE staining of the PDX tumor specimen. |
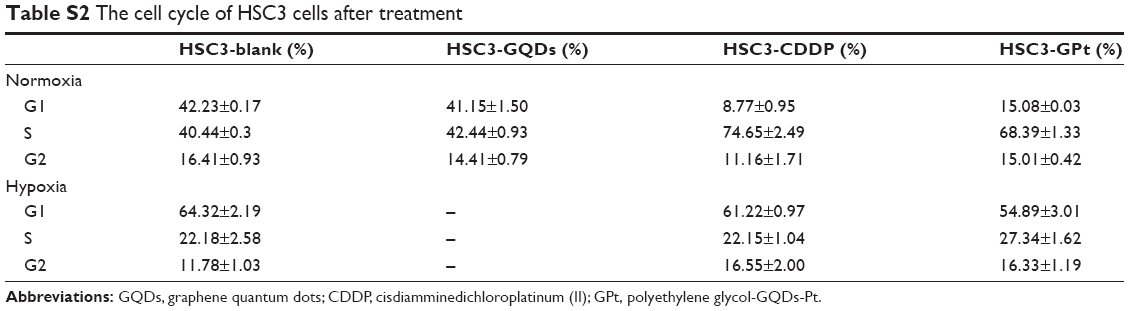 | Table S2 The cell cycle of HSC3 cells after treatment |
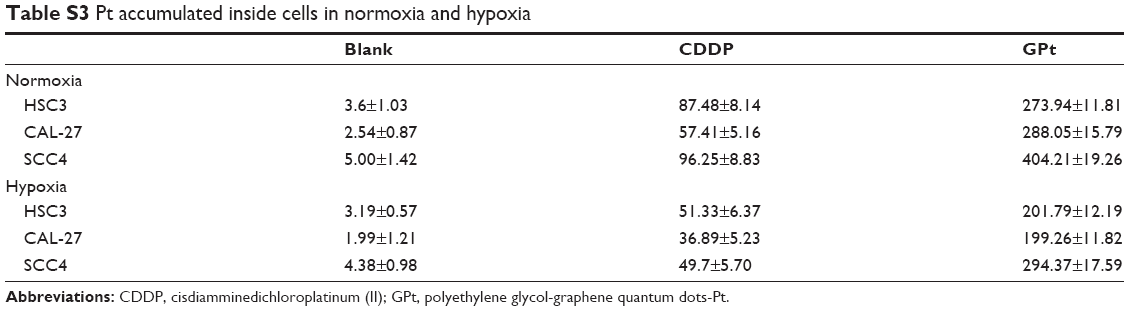 | Table S3 Pt accumulated inside cells in normoxia and hypoxia |
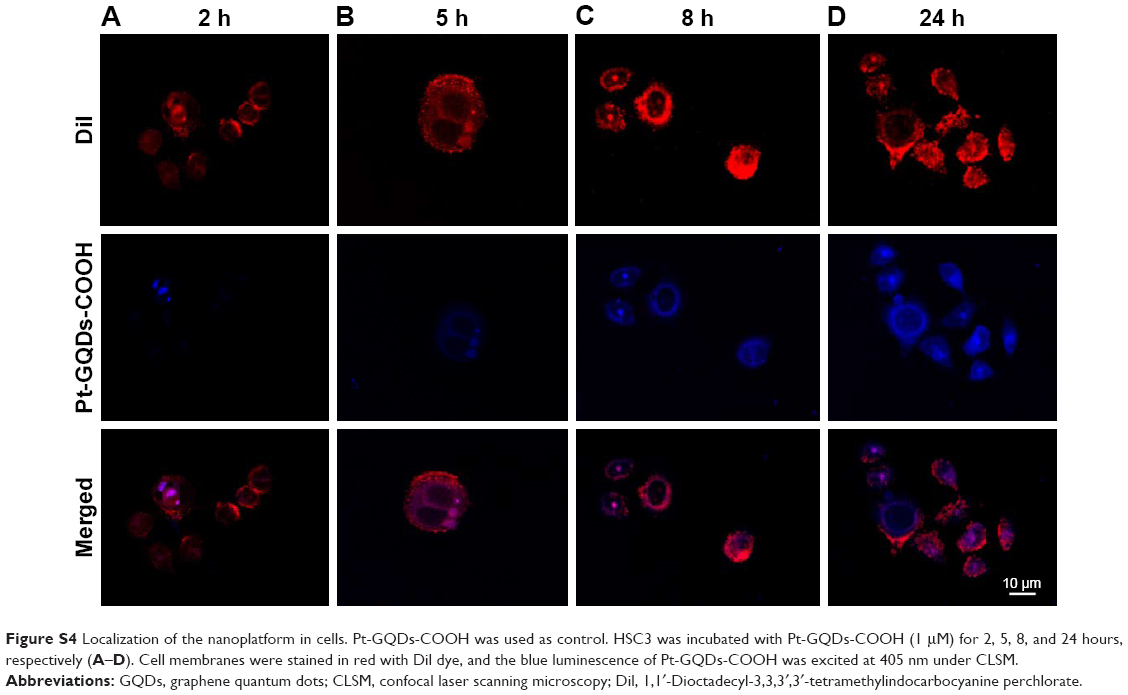 | Figure S4 Localization of the nanoplatform in cells. Pt-GQDs-COOH was used as control. HSC3 was incubated with Pt-GQDs-COOH (1 μM) for 2, 5, 8, and 24 hours, respectively (A–D). Cell membranes were stained in red with Dil dye, and the blue luminescence of Pt-GQDs-COOH was excited at 405 nm under CLSM. |
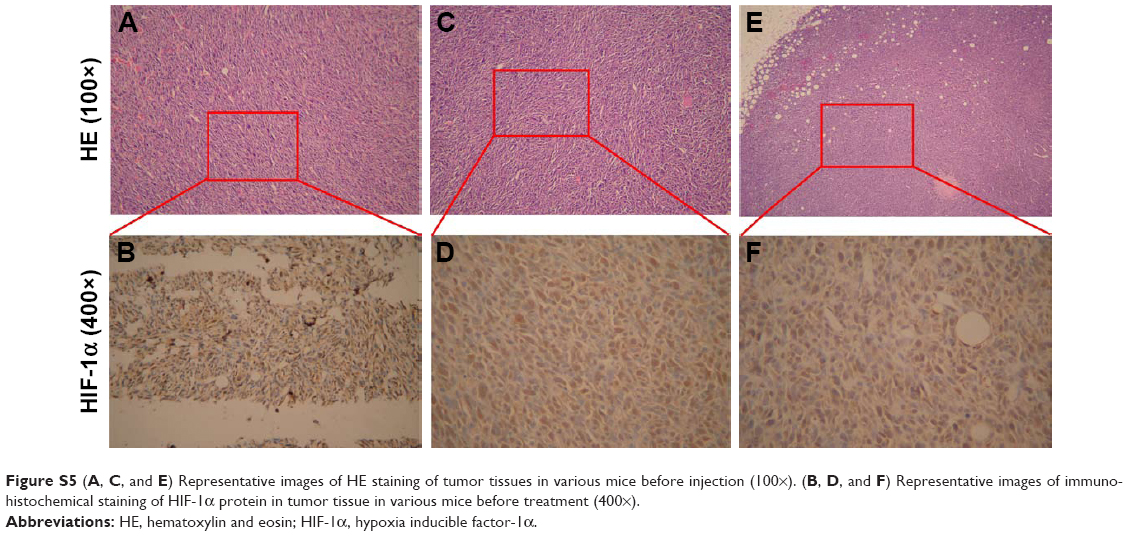 | Figure S5 (A, C, and E) Representative images of HE staining of tumor tissues in various mice before injection (100×). (B, D, and F) Representative images of immunohistochemical staining of HIF-1α protein in tumor tissue in various mice before treatment (400×). |
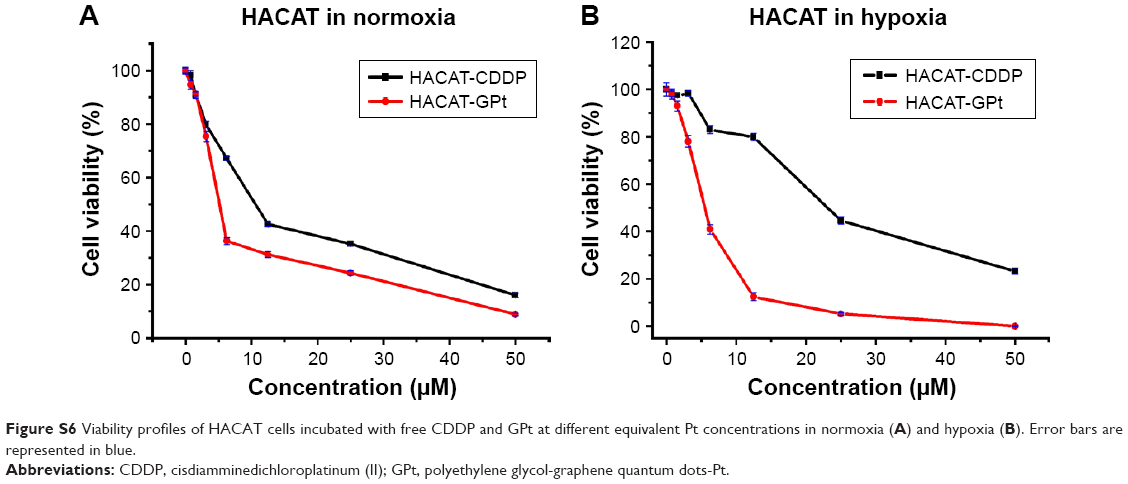 | Figure S6 Viability profiles of HACAT cells incubated with free CDDP and GPt at different equivalent Pt concentrations in normoxia (A) and hypoxia (B). Error bars are represented in blue. |
 © 2018 The Author(s). This work is published and licensed by Dove Medical Press Limited. The full terms of this license are available at https://www.dovepress.com/terms.php and incorporate the Creative Commons Attribution - Non Commercial (unported, v3.0) License.
By accessing the work you hereby accept the Terms. Non-commercial uses of the work are permitted without any further permission from Dove Medical Press Limited, provided the work is properly attributed. For permission for commercial use of this work, please see paragraphs 4.2 and 5 of our Terms.
© 2018 The Author(s). This work is published and licensed by Dove Medical Press Limited. The full terms of this license are available at https://www.dovepress.com/terms.php and incorporate the Creative Commons Attribution - Non Commercial (unported, v3.0) License.
By accessing the work you hereby accept the Terms. Non-commercial uses of the work are permitted without any further permission from Dove Medical Press Limited, provided the work is properly attributed. For permission for commercial use of this work, please see paragraphs 4.2 and 5 of our Terms.