")
Back to Journals » International Journal of Nanomedicine » Volume 13
Antitumor effect of a new nano-vector with miRNA-135a on malignant glioma
Authors Liang C , Sun W, He H, Zhang B, Ling C, Wang B , Huang T, Hou B, Guo Y
Received 2 August 2017
Accepted for publication 13 November 2017
Published 29 December 2017 Volume 2018:13 Pages 209—220
DOI https://doi.org/10.2147/IJN.S148142
Checked for plagiarism Yes
Review by Single anonymous peer review
Peer reviewer comments 2
Editor who approved publication: Professor Lei Yang
Chaofeng Liang, 1,* Weitong Sun, 2,* Haiyong He, 1,* Baoyu Zhang, 1 Cong Ling, 1 Bocheng Wang, 1 Tengchao Huang, 1 Bo Hou, 1 Ying Guo 1
1Department of Neurosurgery, 3rd Affiliated Hospital of Sun Yat-sen University, Sun Yat-sen University, Guangdong, China; 2The Pharmaceutical College of Jiamusi University, Jiamusi University, Jiamusi, China
*These authors contributed equally to this work
Introduction: MiR-135a is found to selectively induce apoptosis in glioma cell but not in normal neurons and glial cells. However, low transfection efficacy limits its application in vivo as other miRNAs. We prepared a new kind of nano-vector based on polyethylene glycol methyl ether (mPEG) and hyper-branched polyethylenimine (hy-PEI) in order to improve the miRNA delivery system into the glioma cells.
Methods: The mPEG-g-PEI/miR-135a was constructed and detected by 1H NMR and FTIR analyses. Transmission electron microscope was utilized for its characteristics. Stability and release efficiency was assessed by electrophoresis. Biocompatibility was observed and analyzed through co-culture with astrocytes and malignant glioma cells (C6). Transfection rate was monitored by laser confocal microscopy and flow cytometry. The antitumor effect of mPEG-g-PEI/miR-135a to C6 was confirmed in vivo by MR scanning, pathology and survival curve. RT-PCR was used to assay transfection efficiency of mPEG-g-PEI/miR-135a in vitro and in vivo. And Western blotting was used to assess the expressions of the targeted proteins of miR-135a.
Results: In this experiment, we found the optimal N/P ratio of mPEG-g-PEI/miR-135a was about 6 judged by Zeta potential, particle size and encapsulation ability. The stability of mPEG-g-PEI/miR-135a in serum and the release efficiency in acid(pH=5.0) of mPEG-g-PEI/miR-135a were simulated the environment in vivo and in tumor. The mPEG-g-PEI nano-vector was co-cultured with malignant glioma cell C6 and normal astrocytes in vitro and showed good biocompatibility evaluated by CCK8 assay. The cell experiments in vitro indicated that mPEG-g-PEI could significantly improve miR-135a transfection by enhancing uptake effect of both normal glial and glioma cells. Given the C6 implanted in situ model, we discovered that the mPEG-g-PEI/miR-135a could obviously increase the survival period and inhibit the growth of glioma confirmed by MRI and histochemistry. In addition, the transfection efficiency of mPEG-g-PEI was better than that of other transfection agents either in vitro or in vivo confirmed by RT-PCR. Moreover, the expressions of the targeted proteins of miR-135a were consistent with the in vitro results.
Conclusion: These results suggest that mPEG-g-PEI is expected to provide a new effective intracellular miRNA delivery system with low toxicity for glioma therapy.
Keywords: nano-vector, miRNA-135a, malignant glioma, gene delivery, Micro RNA
Corrigendum for this paper has been published
Introduction
Glioma is the most common tumor of the central nervous system (CNS). The incidence of gliomas in China and Western countries is increasing year by year. Because of its invasive growth, difficulty to completely remove, susceptibility to relapse, and other characteristics, it has a poor prognosis and a high mortality. At present, treatments are mainly surgery, chemotherapy, and radiotherapy.1 Although surgery combined with radiotherapy and chemotherapy is the preferred treatment for a newly diagnosed glioblastoma multiforme (GBM), it has an unsatisfactory prognosis, with an average survival time ranging from 12 to 15 months.2
In recent years, a variety of new treatment methods have emerged, among which gene therapy has become a hotspot in this field. Micro RNAs (miRNAs) are a class of noncoding small molecule single-stranded RNAs that are closely related to gene expression regulation discovered in recent years. They specifically bind to the 3′ noncoding region of the target mRNA, thereby inducing degradation or inhibiting translation of the target mRNA and further regulating gene expression.3 The abnormal expression of miRNAs is closely related to the occurrence and development of tumors. According to our previous work, miR-135a had been explored in brain tissue with a highest expression level, which was positively correlated with the degree of glioma differentiation. Further studies have shown that miR-135a plays a role in selectively inducing apoptosis of glioma cells by simultaneously targeting multiple genes (STAT6, SMAD5, and BMPR2), but no such effect is found in normal neurons and glial cells.4
However, like other miRNAs, miR-135a also encounters the following problem in vivo: low transfection efficiency.5 To date, the major challenge in gene therapy is to develop a highly effective gene-delivery system with low toxicity. Nonviral vector is still an attractive option, although the agents currently being used display disadvantages such as low transfection efficiency and high toxicity.6 A wide variety of nano-vectors have been developed as drug carriers for treatment of cancers.7 Early clinical trials of some drug-incorporated nano-vectors have shown their efficiency in cancer treatments owing to the passive accumulation of nanoparticles in the tumors by enhanced permeability and retention effect and by reducing the side effects of drugs to the system.8 Some molecular targeting drugs have been loaded into nanoparticles for drug delivery in the treatment of GBM.9 Our authors have previously used polyethylene glycol methyl ether (mPEG) grafted hyper-branched polyethylenimine (hy-PEI) to prepare a new nano-vector known as mPEG-g-PEI. Folic acid was added with 5-fluorocytosine to mPEG-g-PEI in the treatment of glioma. It shows a promising anti-tumor result both in vivo and in vitro models.10 In view of the fact that gene therapy has a more precise targeting than chemotherapy and the gene is smaller than chemotherapeutic drugs, more genes can be loaded on the same vector than chemotherapeutic drugs. Therefore, in this study, we aimed to evaluate the feasibility of miR-135a delivered by mPEG-g-PEI nano-vector and its therapeutic efficacy for glioma.
Methods
Preparation of mPEG-g-PEI
The mPEG-OH was vacuum dried at 60°C for 5 h, dissolved in tetrahydrofuran, slowly added to N,N′-carbonyldiimidazole (CDI), and stirred at room temperature for 12 h. A small amount of water was added to deactivate excess CDI for 0.5 h. A large amount of anhydrous ether was added twice. A white powder was obtained by filtering and drying. hy-PEI (Mn=25 kDa) was added and the obtained white powder was dissolved in 10 mL CHCl3, stirred overnight, precipitated with anhydrous ether three times, and dried.
Characteristics of mPEG-g-PEI/miR-135a
The samples were determined by proton nuclear magnetic resonance (1H NMR) dissolved in dimethy sulfoxide-d6 at 300 Hz (Bruker ACF300). Fourier transform infrared (FTIR) was obtained by spectrometry (Vertex 70; Bruker, Billerica, MA, USA). The IR spectra in the absorbance mode were recorded using a diamond crystal plate, which were obtained in the spectral region of 400–4,000 cm−1 with a resolution of 4 cm−1 and 20 scans per sample.
mPEG-g-PEI and miR-135a were dissolved in Dulbecco’s Modified Eagle’s Medium (DMEM) based on different N/P ratios, then shaken at room temperature for 10 seconds, and incubated at room temperature for 30 min. An mPEG-g-PEI/miR-135a complex with different N/P ratios was obtained, and the particle size and surface zeta potential of mPEG-g-PEI/miR-135a were measured using a NanoZS90 nanometer particle size potential analyzer.
Then, in order to detect the binding ability of mPEG-g-PEI and miR-135a under different N/P ratios, we used miR-135a with Cy3 to prepare mPEG-g-PEI/Cy3-miR-135a for agarose gel electrophoresis in a ratio of 2, 3, 4, 5, 6, 7, and 8, respectively. After testing, N/P=6 was used in mPEG-g-PEI/miR-135a follow-up experiments. The mPEG-g-PEI/miR-135a complex morphology was observed by transmission electron microscopy.
Characteristics of mPEG-g-PEI/miR-135a mimic in in vivo and intratumoral environments
MPEG-g-PEI/miR-135a and fetal bovine serum were mixed at a mass ratio of 1:1 and incubated at 37°C. At 0, 2 h, 6 h, 12 h and 24 h, 15 ml mixture was added with 5 ml 2%SDS, and 2 ml 80% glycerol. Agarose gel electrophoresis was run with Gel RedTM. Fluorescence intensity was observed after 30 min. The miR-135a mimic without mPEG-g-PEI was used as a control group.
miR-135a with Cy3 was bound with mPEG-g-PEI and centrifuged at 13,000 rpm for 10 min. The precipitates were dissolved in aqueous solution at a pH of 5.0 and 7.4 for 30 min, 1 h, 2 h, 4 h, 8 h, 12 h, 24 h, 48 h, 96 h, and 144 h, respectively. Then the concentration of Cy3-miR-135a in the supernatant was determined by multifunctional microplate assay. The obtained concentration is the amount of Cy3-miR released from the nanometer system.
Cell culture
The glioma C6 cell line was generously gifted by Prof Yan from the Department of Pharmacology, Zhongshan School of Medicine, Sun Yat-sen University (Guangzhou, China), who purchased the cell from American Type Culture Collection (USA). Astrocytes as a representative of glial cells were primarily cultured using Suder’s method.11 The glioma C6 cells and astrocytes were cultured in DMEM respectively, supplemented with 100 U/mL penicillin. Cultures were maintained at 37°C in a humidified 5% CO2 incubator.
Cytotoxic analysis
C6 glioma cells and astrocytes were seeded in 96-well plates at a density of 5×10³ cells/well and subsequently incubated in serum-containing culture medium at 37°C under 5% CO2. Overnight, mPEG-g-PEI was mixed with serum-free DMEM at concentrations of 1, 5, 10, 20, 40, 80, and 100 μg/mL, respectively; cultured at 37°C under 5% CO2 for 24 h; then added to 10 μL CCK8; and cultured for 2 h. The culture medium was used as blank control. The absorbance at 540 nm was detected using a microplate reader (Bio-Rad).
Cellular uptake study
Cellular uptake by glioma cells was evaluated by confocal laser scanning microscopy (CLSM) with Cy3 as a fluorescent marker. Cells were seeded in 6-well plates and allowed to adhere for 24 h. Cy3-loaded mPEG-g-PEI/miR-135a was incubated with C6 cells at different time points (2, 4, and 6 h). At the end of incubation, cells were washed and then observed under CLSM.
For the quantification study, these cells were washed twice with phosphate-buffered saline (PBS) before being trypsinized and centrifuged at a speed of 1,000 rpm for 5 min. Then, the cell pellets were resuspended in PBS. The uptake was measured by analyzing 20,000 events for each sample with a flow cytometer (Beckman Coulter, Brea, CA, USA) system using excitation wavelength of 570 nm and an emission wavelength of 660 nm.
Transfection efficiency of mPEG-g-PEI in vitro
The miR-135a expression in C6 cells and astrocytes transfected by mPEG-g-PEI were also examined using real-time polymerase chain reaction (RT-PCR). Lipofectamine® 3000 (Lipo3000) was used as a positive control and mPEG-g-PEI/scrambled siRNA (SCR) as a blank control. RT-PCR was done using QuantiTect Reverse Transcription and SYBR Green PCR kits according to manufacturer’s specifications (Qiagen, Valencia, CA, USA). The miR-135a-specific RT-primers were obtained from Ribobio (Guangzhou, China).
Therapeutic efficacy of mPEG-g-PEI/miR-135a on C6 glioma model in vivo
SD rats (160±10 g) were provided by the Animal Center of Sun Yat-sen University. All the animal experiments were conducted strictly according to the Guiding Principles for the Use of Laboratory Animals and were approved by the Institutional Animal Care and Use Committee of Sun Yat-sen University. With a Hamilton syringe, C6 glioma cells (5×10⁵) in 10 μL of 5% methylcellulose dissolved by serum-free DF/12 were stereotactically implanted into the right caudate nucleus.
The rats were divided into four groups (eight rats per group); and different treatments were carried out on the original location of each group every seven days and after the C6 cells implantation for 3 weeks. The rats are divided as follows: group 1: 10 μL of 0.9% normal saline (NS); group 2: 1 nmol of SCR with mPEG-g-PEI; group 3: 1 nmol of Agomir-135a as positive group; group 4: 1 nmol of mPEG-g-PEI/miR-135a; group 5: four normal rats as control.
On day 7 and 28 post-inoculation, we detected the volume of tumor in brain by MR (GE, model: Discovery 750, New York, NY, USA).The total volume of the tumor was calculated by summing up the cross-sectional areas. All animals were kept under the same laboratory conditions with no steroids or antibiotics. When symptoms including severe paresis and/or ataxia, or more than 20% of body weight loss, were observed, the animals were sacrificed. Survival rate was analyzed by a log-rank test based on Kaplan–Meier survival analysis by using MedCalc statistical software.
According to Kaplan–Meier curve, different injections were designed to carry out on days 7 and 14 after C6 cells inoculation, and the animals were sacrificed on day 21. Animals were perfused intracranial with warm NS (150 mL) followed by 4% paraformaldehyde (150 mL). The brains were removed and all the buffered formalin-fixed, paraffin-embedded tissue sections were cut at a thickness of 3 mm. After deparaffinization, sections were cut at a thickness of 6 μm and stained with hematoxylin & eosin (HE). For histopathological analysis, at least five paraffin sections from each animal were used for HE staining.
Transfection efficiency of mPEG-g-PEI in vivo
Total RNA from tumors was analyzed using mirVANA PARIS RNA isolation kit (Ambion, Austin, TX, USA) following manufacturer’s instructions. The transfection efficiency of mPEG-g-PEI in vitro was assessed by RT-PCR.
For protein analysis, the tumors were harvested on day 21 following different treatments as described earlier and washed with cold PBS. Proteins were extracted from C6 tumors using M-PER® protein extraction reagent (Pierce, Rockford, IL, USA). Twenty microgram of total protein extracted from cells was loaded per lane and separated by a 4%–20% SDS–Tris glycine polyacrylamide gel electrophoresis. Gels were blotted onto nitrocellulose membranes and membranes probed with SMAD5 and STAT6 antibodies.
Results
Characteristics of mPEG-g-PEI
The chemical structure of the polymer was confirmed by 1H NMR and FTIR analyses. As shown in the 1H NMR spectra of mPEG-g-PEI (Figure 1A), the methoxyl and ethoxy groups of mPEG units showed their characteristic peaks at 3.4 and 3.6 ppm, the methylene chemical shift of diethylamino groups from PEI units was at 2.4–2.8 ppm, and the proton resonance signal of amide bond units was at 5–8.5 ppm, which confirmed the successful synthesis of mPEG-g-PEI.
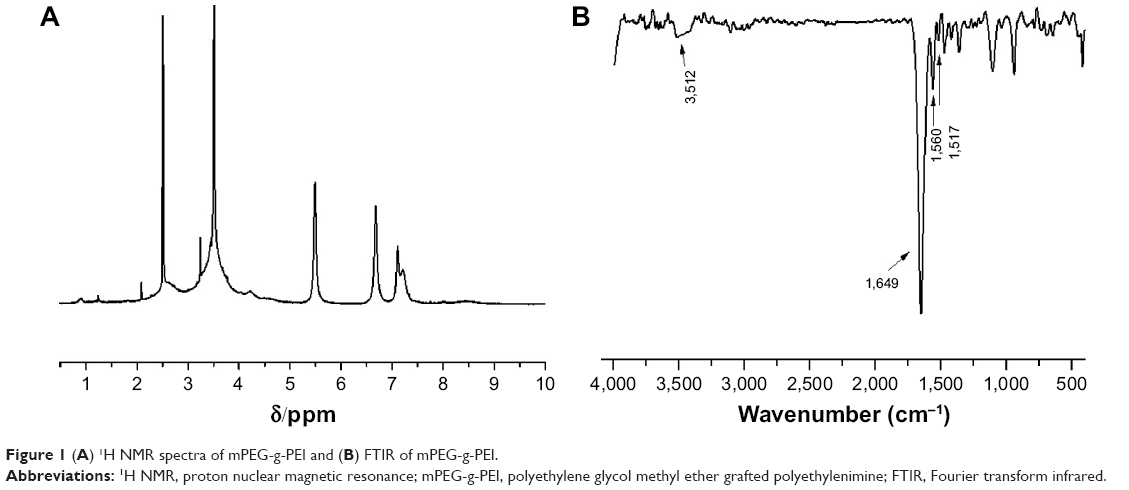 | Figure 1 (A) 1H NMR spectra of mPEG-g-PEI and (B) FTIR of mPEG-g-PEI. |
The FTIR spectra shown in Figure 1B further confirmed the amide bond structures of mPEG-g-PEI. After the conjugation reaction, a stronger absorption around 1,680–1,630 cm−1 was observed, which indicates the presence of νC=O. The peak at 1,570–1,510 cm−1 and 1,335–1,200 cm−1 are attributed to the main characteristic coupling absorption at amide II (δNH) and amide III (νC-N) bands, and the characteristic peak at 3,500–3,400 cm−1 indicating free amino, which all suggested the formation of mPEG-g-PEI.
Optimization of N/P ratio between mPEG-g-PEI and miR-135a
With the same amount of miRNA, the amount of mPEG-g-PEI complex was increased and the surface zeta potential and particle size characteristic formed under different N/P ratios were examined (Figure 2A and B). It can be seen from Figure 2A that the nanoparticle shows positive charge at an N/P ratio >4. It can also be seen from Figure 2B that the particle size of the nanoparticle did not change significantly after an N/P ratio >4.
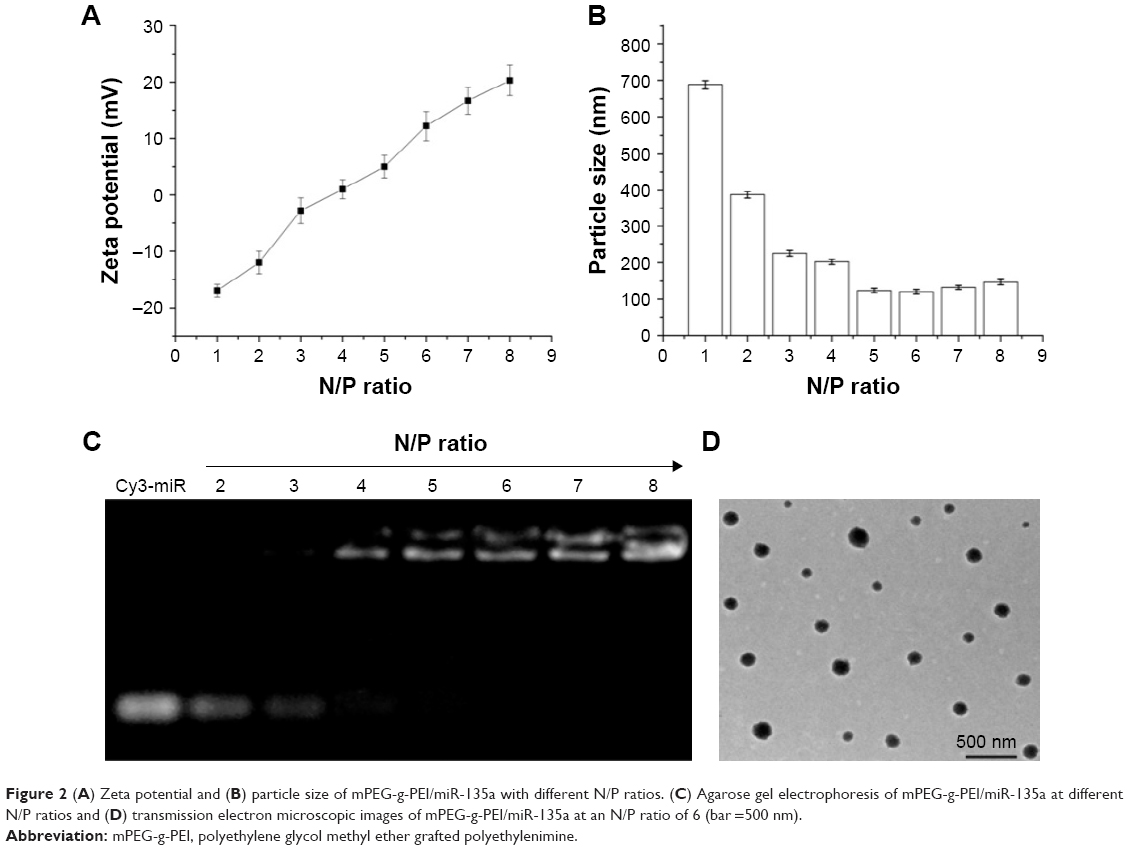 | Figure 2 (A) Zeta potential and (B) particle size of mPEG-g-PEI/miR-135a with different N/P ratios. (C) Agarose gel electrophoresis of mPEG-g-PEI/miR-135a at different N/P ratios and (D) transmission electron microscopic images of mPEG-g-PEI/miR-135a at an N/P ratio of 6 (bar =500 nm). |
Agarose gel electrophoresis was used to detect the ability of mPEG-g-PEI to absorb Cy3-miR-135a at different N/P ratios (Figure 2C). It showed elementary stability when the ratio of N/P was >4 for mPEG-g-PEI/miR-135a; therefore, we prepared mPEG-g-PEI/miR-135a with N/P =1:6 in the following experiment, and the morphology of the finally formed nanoparticles was observed by electron microscopy (Figure 2D). The range of particle size of the miRNA-loaded nanoparticles was 72.3–180.2 nm. The average diameter of the nanoparticles was 140.5 nm.
Stability and release rate of mPEG-g-PEI/miR-135a
It can be seen in Figure 3A that miR-135a mimic in serum started to degrade after 6 h and almost to completely degrade after 24 h. But mPEG-g-PEI/miR-135a did not show significant degradation after 24 h in serum, suggesting that mPEG-g-PEI/miR-135a significantly prevented miR-135a from being degraded in the serum environment, and the protection time was long.
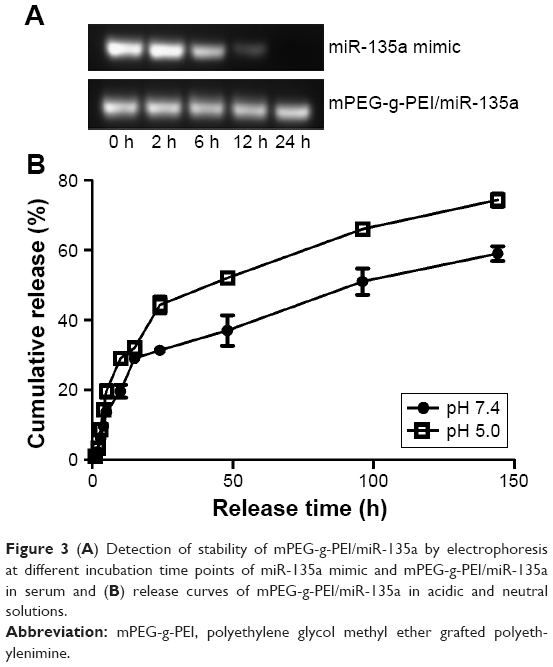 | Figure 3 (A) Detection of stability of mPEG-g-PEI/miR-135a by electrophoresis at different incubation time points of miR-135a mimic and mPEG-g-PEI/miR-135a in serum and (B) release curves of mPEG-g-PEI/miR-135a in acidic and neutral solutions. |
The release rate of mPEG-g-PEI/miR-135a in the acidic environment is faster than that in the neutral environment, suggesting that the nanoparticles could release miR-135a more efficiently in the simulated hypoxic growth environment. As can be seen from Figure 3B, a cumulative release rate of about 80% at about 150 h indicated that the sustained-release effect of the drug could be maintained for about 7 days. It suggested that follow-up animal experiments can use the 7-day administration.
Biocompatibility of mPEG-g-PEI
Cytotoxicity of mPEG-g-PEI was determined by CCK-8 assay in C6 cells and astrocyte. As shown in Figure 4A, even when mPEG-g-PEI concentration reached 100 μg/mL, the survival rate was still maintained above 80% in both normal astrocytes and C6 tumor cells.
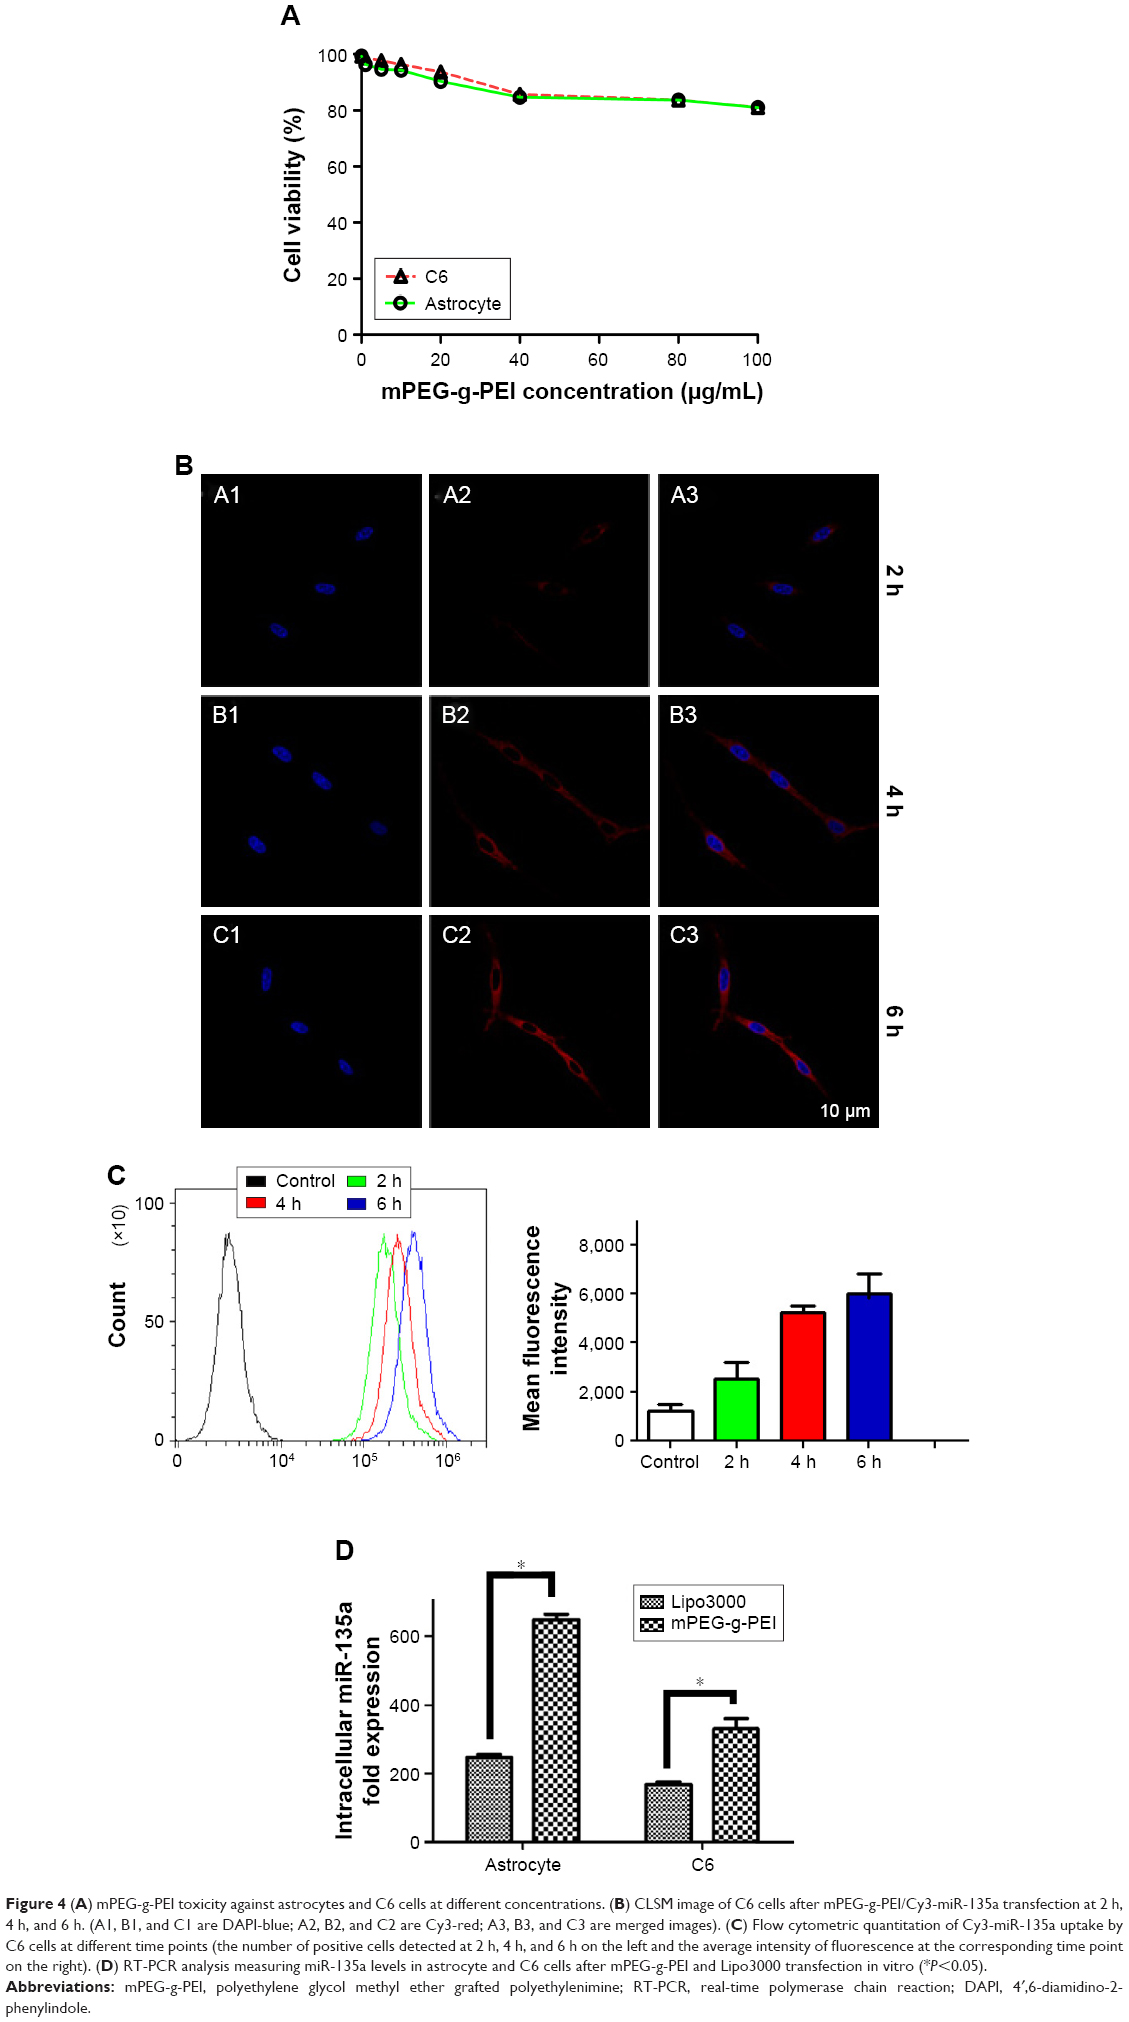 | Figure 4 (A) mPEG-g-PEI toxicity against astrocytes and C6 cells at different concentrations. (B) CLSM image of C6 cells after mPEG-g-PEI/Cy3-miR-135a transfection at 2 h, 4 h, and 6 h. (A1, B1, and C1 are DAPI-blue; A2, B2, and C2 are Cy3-red; A3, B3, and C3 are merged images). (C) Flow cytometric quantitation of Cy3-miR-135a uptake by C6 cells at different time points (the number of positive cells detected at 2 h, 4 h, and 6 h on the left and the average intensity of fluorescence at the corresponding time point on the right). (D) RT-PCR analysis measuring miR-135a levels in astrocyte and C6 cells after mPEG-g-PEI and Lipo3000 transfection in vitro (*P<0.05). |
Cellular uptake efficiency of mPEG-g-PEI/miR-135a in glioma cells
Cy3 as an indicator was used to construct mPEG-g-PEI/Cy3-miR-135a nanoparticle. The whole process of it entering C6 cells was observed by CLSM (Figure 4B), suggesting that mPEG-g-PEI can successfully carry Cy3-labeled miR-135a into C6 cells.
To quantify the efficiency of transfection, mPEG-g-PEI/Cy3-miR-135a on C6 cells was further measured by flow cytometry at different time points (2, 4, and 6 h) (Figure 4C).
Transfection efficiency of mPEG-g-PEI in vitro
The expression level of miR-135a post-transfection was detected by RT-PCR in astrocytes as representative of normal glial cells and glioma cell line C6. Lipo3000 was used as a positive control since it is commonly used in transfection in vitro. The expression of miR-135a in mPEG-g-PEI/miR-135a was found to be higher than that in Lipo3000 in both cells, respectively (Figure 4D).
Therapeutic efficacy of mPEG-g-PEI/miR-135a on C6 glioma model in vivo
The Kaplan–Meier survival curve of each group shows that the mean survival times of blank control group (injected with 0.9% saline) and negative control group (mPEG-g-PEI without miR-135a) were 29.5 and 29 days, respectively, significantly shorter than the experimental group (53 days) and the positive control group (45.5 days) (Figure 5A). But there was also significant difference between Agomir-135a group and mPEG-g-PEI/miR-135a group (P<0.05), suggesting that the mPEG-g-PEI/miR-135a we prepared had a stronger anti-glioma effect than Agomir-135a (commonly used in transfection in vivo).
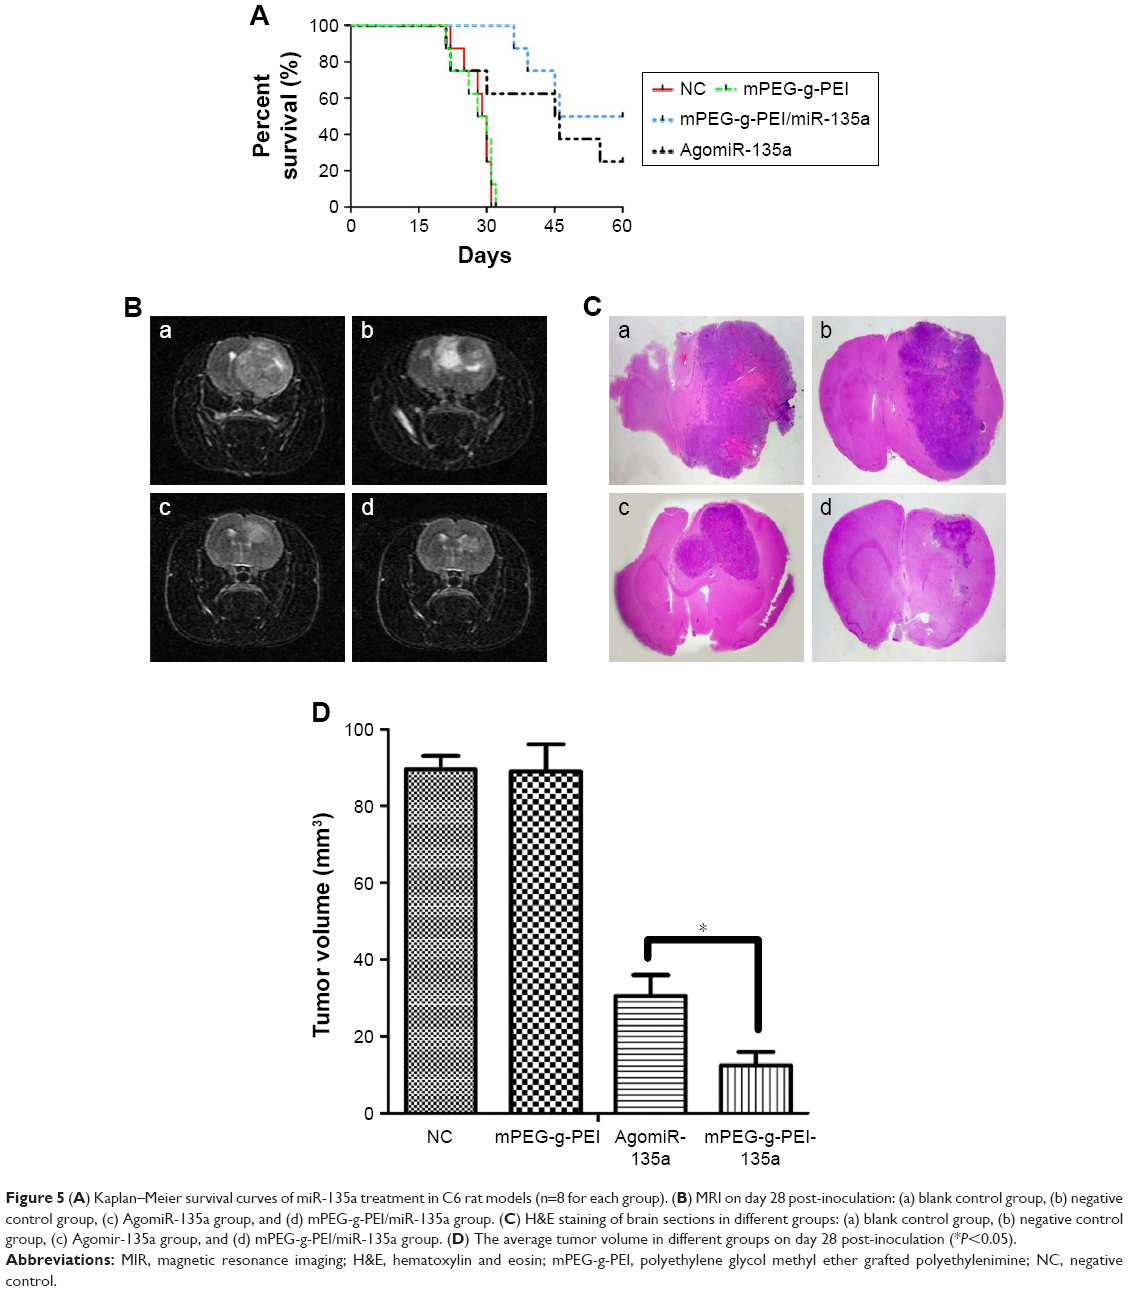 | Figure 5 (A) Kaplan–Meier survival curves of miR-135a treatment in C6 rat models (n=8 for each group). (B) MRI on day 28 post-inoculation: (a) blank control group, (b) negative control group, (c) AgomiR-135a group, and (d) mPEG-g-PEI/miR-135a group. (C) H&E staining of brain sections in different groups: (a) blank control group, (b) negative control group, (c) Agomir-135a group, and (d) mPEG-g-PEI/miR-135a group. (D) The average tumor volume in different groups on day 28 post-inoculation (*P<0.05). |
MRI examination was conducted on day 28 (Figure 5B). A huge intracranial tumor with midline shift was found in blank control group and negative control group. A similar result was also found using H&E staining on day 21 (Figure 5C). The average tumor volume for the blank control group was 89.5±6.2 mm3 and mPEG-g-PEI negative control group was 89±4.5 mm3, while the tumor volume for Agomir-135a group was 30.5±3.7 mm3 and for mPEG-g-PEI/miR-135a group was 12.5±2.2 mm3. According to our results (Figure 5D), the Agomir-135a and mPEG-g-PEI/miR-135a groups could significantly diminish the glioma tumor volume when compared with the blank control or negative control group (P<0.05).
Transfection efficiency of mPEG-g-PEI in vivo
The expression of miR-135a in tumor tissues after mPEG-g-PEI/miR-135a transfection in C6 model in vivo was detected by RT-PCR. The expression level of miR-135a after transfection was higher in the mPEG-g-PEI/miR-135a group than in AgomiR group (Figure 6A).
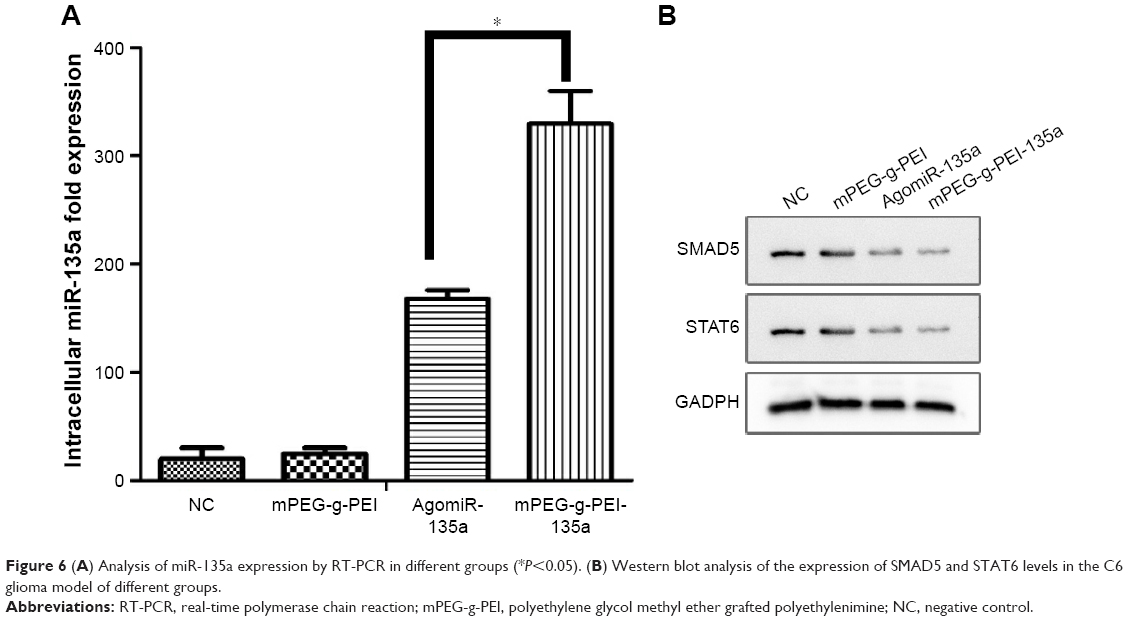 | Figure 6 (A) Analysis of miR-135a expression by RT-PCR in different groups (*P<0.05). (B) Western blot analysis of the expression of SMAD5 and STAT6 levels in the C6 glioma model of different groups. |
As previous study has shown that STAT6 and SMAD5 were downregulated in tumors after miR-135a transfection, miR-135a did not remarkably suppress the protein levels of STAT6 and SMAD5 in normal CNS-derived cells. Western blot studies were performed to confirm the expression of the SMAD5 and STAT6 proteins in tumors. As seen in Figure 6B, the expression of SMAD5 and STAT6 was significantly reduced in Agomir-135a group and mPEG-g-PEI/miR-135a group, suggesting that miR-135a was transfected into C6 cells and successfully inhibited the growth of tumor by inhibiting the effect of target gene protein.
Discussion
miRNA is a small noncoding RNA molecule containing about 22 nucleotides and appearing to have great functions in gene regulation.12 The most common mechanism is that miRNA inhibits protein translation of the target mRNA.13 Partially complementary miRNAs can also speed up deadenylation, causing mRNAs to be degraded sooner.14 A given miRNA may have hundreds of different mRNA targets and a given target might be regulated by multiple miRNAs.15 A big and complex regulation net was constructed and targeted therapies are gaining attention. Just as miRNA is involved in the normal functioning of physiological activity, so has dysregulation of miRNA been associated with disease.16 In the past decade, many miRNAs have been found to be related with cancers; therefore, miRNAs have the potential to be used as targets to treat different types of cancers.17
However, before miRNA-targeted therapeutics can migrate substantially from bench to bedside applications, there are several significant challenges ahead that need to be overcome. First, the negatively charged cellular membrane and miRNA molecules cannot interact directly, but the positively charged PEI encapsulating the miRNAs can facilitate uptake by the negatively charged cellular membrane.18 Second, from a pharmaceutical perspective, a poor pharmacokinetic profile of miRNA in vivo was observed due to the susceptibility of RNA molecules to serum nucleases, renal clearance, and non-targeted biodistribution. Nanoparticle-based delivery system seems a good application for miRNA in vivo. As one of the nonviral gene-delivery vectors, nanoparticles that are made of synthetic, natural cationic polymers or cationic species could potentially overcome extracellular and intracellular barriers, protect miRNA from degradation by serum ribozyme, and increase the uptake by target cells. Once taken up by the target cells, miRNA polyplexes are released from endosome into the cytoplasm and enter its pathway.
PEI is associated with high transfection efficiency due to its positive charge, but the positive charge would damage the cells. Therefore, PEI nanoparticles are still plagued by biosafety concerns.19,20 Fortunately, this setback could be partly reduced by modifying the surface of the complex with PEG, which can adjust the particle size, prevent them from aggregating, and further facilitate the steric stability of miRNAs payloads and uptake by target cells.21,22 More recently, researchers have developed liposomes with PEG coating as an miRNA delivery vehicle that can penetrate the blood–brain barrier and target glioma cells.23 Our authors have previously reported that a combination of SPION (superparamagnetic iron oxide nanoparticles) and FA (folate) based on mPEG-g-PEI nanoparticle shows great theranostic potential regarding combined gene therapy and MRI diagnosis in hepatocellular carcinoma which provides the possibility to deliver miRNA into glioma cells.24 We used similar method to construct a nanoparticle with miR-135a and observed the therapeutic effect in malignant glioma in vivo, in order to verify the capacity of mPEG-g-PEI nanoparticle with miRNA and to check whether it can be applied in future clinical practice.
The chemical structure of the polymer was confirmed by 1H NMR and FTIR analyses. As shown in the 1H NMR spectra of mPEG-g-PEI (Figure 1A), the methoxyl and ethoxy groups of mPEG units showed their characteristic peaks at 3.4 and 3.6 ppm, the methylene chemical shift of diethylamino groups from PEI units was at 2.4–2.8 ppm, and the proton resonance signal of amide bond units was at 5–8.5 ppm, which confirmed the successful synthesis of mPEG-g-PEI.
The FTIR spectra shown in Figure 1B further confirmed the amide bonds structure of mPEG-g-PEI. After the conjugation reaction, a stronger absorption around 1,680–1,630 cm−1 was observed, indicating the presence of C=O. The peak at 1,570–1,510 cm−1 and 1,335–1,200 cm−1 are attributed to the main characteristic coupling absorption at amide II (δNH) and amide III (νC-N) bands, and the characteristic peak at 3,500–3,400 cm−1 indicating the free amino, which all suggested the formation of mPEG-g-PEI.
Rational construction of mPEG-g-PEI/miR-135a improves the efficiency of drug delivery to the target cells. We first explored the appropriate N/P ratio, that is, the molar ratio of amino and miRNA phosphate in the nanoparticle, namely, ratio of PEI and miRNA. Regarding the zeta potential of the nanoparticle with different N/P ratios, Figure 2A shows that the nanoparticle had a positive charge when the N/P ratio was >4. When the N/P ratio was changed, the particle size was basically stable at an N/P ratio >4 (Figure 2B). The encapsulating ability of mPEG-g-PEI to miRNA was determined by gel electrophoresis. When the N/P ratio was >4, miR-135a began to be encapsulated by mPEG-g-PEI (Figure 2C). Since a high N/P ratio will increase the toxicity to cell, based on the zeta potential, particle size, and electrophoresis results, nanoparticles were prepared using a ratio of N/P =6 for subsequent experiments. The nanoparticles made by this ratio can maintain a uniform dispersion and can form a uniform size spherical particle in aqueous solution, as observed by electron microscopy (Figure 2D).
Then, we tested the nanoparticles in vitro. First, the serum environment was simulated. Nanoparticle could effectively protect miR-135a from degradation in the presence of serum. This was verified by agarose gel electrophoresis. The effect was prolonged to 24 h, suggesting that mPEG-g-PEI had the advantage of protecting miRNAs and was able to maintain stability in the presence of serum in vitro (Figure 3A).
In addition, because miR-135a needs to be used in tumor therapy, our study also simulated tumor acidic environment to determine the releasing efficiency of miR-135a from nanoparticle. As shown in Figure 3B, the nanoparticle was released faster in the acidic environment than in the neutral environment, suggesting that nanoparticle can release miR-135a more efficiently in case of tumor. Also, as the cumulative release rate reached 80% in about 150 h, it is suggested that the sustained release effect can be maintained for about 7 days. For this reason, the follow-up animal experiments were designed to give administration every 7 days.
After successful construction of the nanoparticle and the completion of stability testing, we need to evaluate the biocompatibility of the nano-vector delivery system in order to make sure the safety in the follow-up experiment in vitro and in vivo. Thus, the cytotoxic capacity of mPEG-g-PEI on normal glial and glioma cells was assessed by CCK8 method for primary cultured astrocytes and C6 gliomas. Although the activity of these cells decreased with an increase in mPEG-g-PEI concentration, the activity of the cells was still maintained at above 80% even when the vector concentration reached 100 μg/mL, suggesting that the biocompatibility of mPEG-g-PEI nano-vector is good for both normal glial and glioma cells.
Subsequently, this study evaluated the transfection efficiency of the nanoparticle both in vitro and in vivo. It was found that the Cy3-labeled nanoparticle could be successfully transfected into the cells by laser confocal microscopy. MiRNA was endocytosed by the C6 cells 2 h after transfection (Figure 4B). At the same time, the delivering efficiency of Cy3-labeled nanoparticle in C6 was evaluated at different time points by flow cytometry (Figure 4C). It was found that up to 100% of the C6 cells were transfected in 2 h, suggesting that the nanoparticle had a high transfection capacity. To further verify the nanoparticle delivering capacity, it was compared with Lipo3000, which was commonly used in in vitro transfection experiments. According to the results of RT-PCR detection, nanoparticles exhibited a higher delivering efficiency than Lipo3000 both in normal glial and glioma cells. As can be seen in Figure 4D, mPEG-g-PEI nano-vectors still maintained high delivering capacity even in normal glial cells.
In this study, the therapeutic efficacy of mPEG-g-PEI/miR-135a on C6 glioma model in vivo was evaluated by Kaplan–Meier survival curve and MRI. The animals received intratumor injection of nanoparticle and miRNA agonist (AgomiR), which were commonly used in in vivo transfection experiments as a positive control. Figure 5A shows that the mean survival times of the blank control group (0.9% saline) and the negative control group (only mPEG-g-PEI) were 29.5 and 29 days, respectively, and there was no significant difference between these two groups (P>0.05), suggesting a good biocompatibility of mPEG-g-PEI in vivo. By comparing Agomir-135a and mPEG-g-PEI/miR-135a, the mean survival times of these two groups were 45.5 and 53 days, respectively, and there was a significant difference between these two groups (P<0.05), suggesting a stronger anti-glioma effect of mPEG-g-PEI/miR-135a than Agomir-135a, which may be related to the ability of mPEG-g-PEI to release miR-135a slowly.
To further understand the changes of tumor in animals, this study carried out MRI examination in each group. By imaging comparison, we found that different tumor volumes in different groups could be seen on day 28 (Figure 5B). Tumor volumes in AgomiR-135a and mPEG-g-PEI/miR-135a group were smaller than blank control and negative control group (P<0.05). It was confirmed that miR135a had a tumor-inhibiting effect. Further comparison showed that tumor volume in the mPEG-g-PEI/miR-135a group was significantly smaller than the AgomiR-135a group (Figure 5D; P<0.05). The same results were observed in the subsequent analysis of the paraffin sections of the tumor tissue by HE staining (Figure 5C), suggesting a better anti-tumor effect of mPEG-g-PEI/miR-135a than Agomir-135a in vivo.
At present, Agomir is mainly used in miRNA transfection experiments in vivo.25 In this study, the expression of miR-135a in mPEG-g-PEI/miR-135a group was higher than that of Agomir group as analyzed by RT-PCR (Figure 6A). The first possible reason is that the transfection rate of mPEG-g-PEI/miRNA is higher than that of Agomir. Second, nanoparticle did not degrade after 24 h in the previous in vitro experiments, and miR-135a was released just up to 80% from the nanoparticle at 150 h post-incubation, which suggests that the nanoparticle might have a sustained release effect. In the literature, Agomir is generally recommended to be injected daily or every other day. This may be related to its degradation speed in vivo.26 Thus, this may result in a lower level of miR-135a expression in the tumor specimens harvested at day 7 post-intratumoral injection.
Although these results have suggested that mPEG-g-PEI/miR-135a group exhibited a longer survival time and higher transfection efficiency, it is still unclear whether its antitumor mechanism is consistent with in vitro experiments and whether it can interact with target protein to induce tumor cell apoptosis in vivo after transfected into the cell. This needs further validation. Therefore, Western blotting was carried out in tumor samples. As mentioned early, the effective delivery of miR-135a downregulates the expression of its downstream proteins SMAD5 and STAT6. In mPEG-g-PEI/miR-135a and Agomir-135a groups, a significant inhibition of the expression of SMAD5 and STAT6 proteins in tumor tissues was observed, which indicates that the miR-135a transfected into the tumor also has a multi-targeting inhibitory effect and selectively induces glioma apoptosis.
Conclusion
In summary, the mPEG-g-PEI/miR-135a nanoparticle constructed in this study has good biocompatibility and can efficiently deliver miR-135a into cells both in vitro and in vivo and selectively induces glioma cell apoptosis. By encapsulating the miRNA molecules within this new nano-vector, stability of the miRNA could be significantly enhanced, as well as high miRNA transduction efficiency and effective bioactivity could be achieved, which are expected to provide a new, low-toxicity and high-efficiency miRNA transfection leading to clinical applications.
Acknowledgments
This work was supported by the Science and Technology Project of Guangdong Province (no 2013B021800086); Science and Technology Program of Guangzhou, China (201604020080); and Science and Technology Project of Guangdong Province (2015A020212016 and 2016A020214007); Natural Science Youth Foundation (Grant No 22Zq201502) and the National Undergraduate Training Programs for Innovation and Entrepreneurship (Grant No 201510222014).
Disclosure
The authors report no conflicts of interest in this work.
References
Stupp R, Mason WP, Mj VDB, et al. Radiotherapy plus concomitant and adjuvant temozolomide for glioblastoma. N Engl J Med. 2005;352(10):987–996. | ||
Dolecek TA, Propp JM, Stroup NE, Kruchko C. CBTRUS statistical report: primary brain and central nervous system tumors diagnosed in the united states in 2005–2009. Neuro Oncol. 2012;1(4 Suppl 5):v1–v49. | ||
Berindan-Neagoe I, Monroig PDC, Pasculli B, et al. MicroRNAome genome: a treasure for cancer diagnosis and therapy. Cancer J Clin. 2014;64(5):311–336. | ||
Wu S, Lin Y, Xu D, et al. MiR-135a functions as a selective killer of malignant glioma. Oncogene. 2012;31(34):3866–3874. | ||
Wen J, Parker BJ, Jacobsen A, et al. MicroRNA transfection and AGO-bound CLIP-seq data sets reveal distinct determinants of miRNA action. RNA. 2011;17(5):820–834. | ||
Godbey WT, Wu KK, Mikos AG. Poly(ethylenimine) and its role in gene delivery. J Control Release. 1999;60:149–160. | ||
Vieira DB, Gamarra LF. Getting into the brain: liposome-based strategies for effective drug delivery across the blood–brain barrier. Int J Nanomed. 2016;11:5381. | ||
Davis ME, Cheng ZG, Shin DM. Nanoparticle therapeutics: an emerging treatment modality for cancer. Nat Rev Drug Discov. 2008;7(9):239–250. | ||
Kamali M, Dinarvand R, Maleki H, et al. Preparation of imatinib base loaded human serum albumin for application in treatment of glioblastoma. RSC Adv. 2015;5(76):62214–62219. | ||
Liang B, He ML, Chan CY, et al. The use of folate-PEG-grafted-hybranched-PEI nonviral vector for the inhibition of glioma growth in the rat. Biomaterials. 2009;30(23–24):4014. | ||
Suder P, Bodzonkulakowska A, Mak P, et al. The proteomic analysis of primary cortical astrocyte cell culture after morphine administration. J Proteome Res. 2009;8(10):4633. | ||
Huang Y, Zou Q, Wang SP, et al. The discovery approaches and detection methods of microRNAs. Mol Biol Rep. 2011;38(6):4125–4135. | ||
Williams AE. Functional aspects of animal microRNAs. Cell Mol Life Sci. 2008;65(4):545–562. | ||
Eulalio A, Huntzinger E, Nishihara T, et al. Deadenylation is a widespread effect of miRNA regulation. RNA. 2009;15(1):21. | ||
Friedman RC, Farh KK, Burge CB, et al. Most mammalian mRNAs are conserved targets of microRNAs. Genome Res. 2008;19(1):92–105. | ||
Mraz M, Pospisilova S. MicroRNAs in chronic lymphocytic leukemia: from causality to associations and back. Expert Rev Hematol. 2012;5(6):579–581. | ||
Musilova K, Mraz M. MicroRNAs in B-cell lymphomas: how a complex biology gets more complex. Leukemia. 2015;29(5):1004. | ||
Torchilin VP, Levchenko TS, Rammohan R, et al. Cell transfection in vitro and in vivo with nontoxic TAT peptide-liposome-DNA complexes. Proc Natl Acad Sci U S A. 2003;100(4):1972. | ||
Godbey WT, Wu KK, Mikos AG. Size matters: molecular weight affects the efficiency of poly(ethylenimine) as a gene delivery vehicle. J Biomed Mater Res A. 1999;45(3):268. | ||
Xuan L, Mo Y, Liu X, et al. Synthesis, characterisation and preliminary investigation of the haemocompatibility of polyethyleneimine-grafted carboxymethyl chitosan for gene delivery. Mater Sci Eng C. 2016;62:173–182. | ||
Xu H, Jia F, Singh PK, et al. Synergistic anti-glioma effect of a coloaded nano-drug delivery system. Int J Nanomed. 2017;12:29–40. | ||
Shi Z, Guo R, Li W, et al. Nanoparticles of deoxycholic acid, polyethylene glycol and folic acid-modified chitosan for targeted delivery of doxorubicin. J Mater Sci Mater Med. 2014;25(3):723. | ||
Jonas B, Larsen TB, Jolck RI, et al. Investigation of enzyme-sensitive lipid nanoparticles for delivery of siRNA to blood-brain barrier and glioma cells. Int J Nanomed. 2015;10(default):5995–6008. | ||
Guo Y, Wang J, Zhang L, et al. Theranostical nanosystem-mediated identification of an oncogene and highly effective therapy in hepatocellular carcinoma. Hepatology. 2016;63(4):1240. | ||
Krützfeldt J, Rajewsky N, Braich R, et al. Silencing of microRNAs in vivo with ‘antagomirs’. Nature. 2005;438(7068):685. | ||
Bonauer A, Carmona G, Iwasaki M, et al. MicroRNA-92a controls angiogenesis and functional recovery of ischemic tissues in mice. Science. 2009;324(5935):1710–1713. |
 © 2017 The Author(s). This work is published and licensed by Dove Medical Press Limited. The full terms of this license are available at https://www.dovepress.com/terms.php and incorporate the Creative Commons Attribution - Non Commercial (unported, v3.0) License.
By accessing the work you hereby accept the Terms. Non-commercial uses of the work are permitted without any further permission from Dove Medical Press Limited, provided the work is properly attributed. For permission for commercial use of this work, please see paragraphs 4.2 and 5 of our Terms.
© 2017 The Author(s). This work is published and licensed by Dove Medical Press Limited. The full terms of this license are available at https://www.dovepress.com/terms.php and incorporate the Creative Commons Attribution - Non Commercial (unported, v3.0) License.
By accessing the work you hereby accept the Terms. Non-commercial uses of the work are permitted without any further permission from Dove Medical Press Limited, provided the work is properly attributed. For permission for commercial use of this work, please see paragraphs 4.2 and 5 of our Terms.