")
Back to Journals » International Journal of Nanomedicine » Volume 14
Antidiabetic activity enhancement in streptozotocin + nicotinamide–induced diabetic rats through combinational polymeric nanoformulation
Authors Rani R, Dahiya S, Dhingra D, Dilbaghi N, Kaushik A , Kim KH , Kumar S
Received 14 February 2019
Accepted for publication 25 April 2019
Published 12 June 2019 Volume 2019:14 Pages 4383—4395
DOI https://doi.org/10.2147/IJN.S205319
Checked for plagiarism Yes
Review by Single anonymous peer review
Peer reviewer comments 3
Editor who approved publication: Dr Thomas Webster
Ruma Rani,1 Shakti Dahiya,1 Dinesh Dhingra,2 Neeraj Dilbaghi,1 Ajeet Kaushik,3 Ki-Hyun Kim,4 Sandeep Kumar1
1Department of Bio and Nano Technology, Guru Jambheshwar University of Science and Technology, Hisar 125001, India; 2Department of Pharmaceutical Science, Guru Jambheshwar University of Science and Technology, Hisar 125001, India; 3Center for Personalized Nanomedicine, Institute of NeuroImmune Pharmacology, Department of Immunology and Nano-Medicine, Herbert Wertheim College of Medicine, Florida International University (FIU), Miami, FL 33199, USA; 4Department of Civil and Environmental Engineering, Hanyang University, Seoul 04763, South Korea
Background: The bioactive compounds glycyrrhizin (GL) and thymoquinone (TQ) have been reported for antidiabetic activity in pure and nanoformulation (NF) form. However, the antidiabetic effect of a combined nanoformulation of these two has not been reported in the literature. Here, a combinational nanomedicine approach was investigated to enhance the antidiabetic effects of the two bioactive compounds of GL and TQ (GT), in type 2 diabetic rats in reference to metformin.
Methods: Two separately prepared NFs of GL (using polymeric nanoparticles) and TQ (using polymeric nanocapsules) were mixed to obtain a therapeutic cargo of nanomedicine and then characterized with respect to particle size, stability, morphology, chemical interaction, and in vivo behavior. Additionally, NFs were evaluated for their cytotoxic effect on Vero cell lines compared to the pure form. This nanomedicine was administered orally, both independently and in combination (pure form or NF) for 21 successive days to type 2 diabetic rats and the effect assessed in term of body weight, fasting blood-glucose level, and various biochemical parameters (such as lipid-profile parameters and HbA1c).
Results: When these nanomedicines were applied in combined rather than individual forms, significant decreases in blood glucose and HbA1c and significant improvements in body weight and lipid profile were observed, despite them containing lower amounts than the pure forms. The treatment of diabetic rats with GL and TQ, when administered independently in either pure or NF forms, did not lead to favorable trends in any studied parameters.
Conclusion: The administration of combined GT NFs exhibited significant improvement in studied parameters. Improvements in antidiabetic activity could have been due to a synergistic effect of combined NFs, leading to enhanced absorption of NFs and lesser cytotoxic effects compared to pure bioactive compounds. Therefore, GT NFs demonstrated potential as a new medicinal agent for the management of diabetes.
Keywords: glycyrrhizin, thymoquinone, nanoformulation, antidiabetic, lipid profile, glycated hemoglobin
Introduction
Diabetes mellitus, a major chronic disease that is prevalent worldwide, is characterized by increased blood glucose (BG), metabolic disturbances, and alteration in insulin secretion. This insulin-deficient action is due to shortage of insulin secretion (type 1 diabetes) and/or decline in cell response toward insulin (type 2 diabetes).1 Symptoms of hyperglycemia include polyuria, polydipsia, polyphagia, weight loss, ketonemia, and ketonuria. The number of people with diabetes has steadily risen over the past few decades, mainly due to a rise in prevalence of diabetes at all ages, as well as population growth. Worldwide, the number of people with diabetes increased substantially between 1980 and 2014, rising from 108 million to 422 million — an almost four fold increase.2
Recently, plant-based therapies have become an important mode of treatment for type 2 diabetes. Bioactive compounds have gained considerable attention, as they are regularly consumed in food and are also important sources of safe and effective alternative pharmaceuticals. Moreover, bioactive compounds have an effect on multiple biological functions, including the sustained secretion of insulin and regeneration of pancreatic islet cells.3 Similarly to pharmaceutical targets, bioactive compounds improve BG level (BGL) and decrease insulin resistance and glycated hemoglobin. However, oral administration of food-grade bioactive compounds results in substantial loss in bioactivity, diminishing the antidiabetic activity of the phytobioactive compounds. Bioavailability and bioactivity of a drug can be enhanced by using nanoparticle (NP) drug-delivery systems.4 Such nanoformulations (NFs) as biodegradable polymeric NFs (BPNs) play an important role in treatment of different types of diseases, medical imaging, biomarkers, biosensors, nanomachines, nanorobots, and nanoscale drug-delivery systems.5 BPN systems enhance pharmacokinetic properties, such as absorption, distribution, metabolism, and excretion of various drugs used in therapeutic applications.5,6 BPNs have several advantages, including improved bioavailability and solubility, sustained release of drug, targeted drug delivery, reduction in dose, and fewer side effects.7
Various bioactive compounds singly or in combination have shown enhanced antidiabetic activities.8 A combination therapy of rutin and silymarin in streptozotocin (STZ)-induced diabetic rats for 6 weeks reduced plasma-glucose levels and significantly increased antioxidant activity in diabetic rats.9 Kaur et al10 reported the influence of piperine and quercetin on the antidiabetic potential of curcumin, and found that a combination of the three had significant therapeutic potential when compared with curcumin alone. Therefore, the combinational intake of these with foods or synergistic efficacy of these bioactive compounds will be a future research area in diabetic disease management. The present report explores the combined effect of glycyrrhizin (GL) and thymoquinone (TQ), the main bioactive extracts from the herbs Glycyrrhiza glabra (family Fabaceae) and Nigella sativa (family Ranunculaceae), respectively, for enhanced antidiabetic potential. Both compounds have been reported to exhibit antihyperglycemic activity and many other pharmacological activities.11–14 GL has been reported for its poor/low bioavailability after oral administration, due to slow and incomplete absorption in the gastrointestinal tract.15 Similarly, TQ has also been reported for its poor bioavailability.16 The hydrophilic nature of GL, hydrophobic nature of TQ, and poor permeability and slow absorption of both result in low plasma levels after oral administration, which greatly limits their application. However, a novel NP drug-delivery system can be built to enhance the absorption and bioavailability of GL and TQ. Our research group has previously reported the preparation and evaluation of NFs of GL (20 and 40 mg/kg) and TQ (20, 40, and 80 mg/kg) in STZ + nicotinamide–induced diabetic rats individually, which conveyed an enhanced antidiabetic effect through an NP approach.17,18
The present study was planned to investigate the effect of subeffective doses in pure and combined NFs with a standard antidiabetic drug. However, to date, no reports have been published on the antihyperglycemic activity of their combined form, in either pure or NF composition. Therefore, in this study, a combined NF of GL and TQ (GT) was prepared and characterized for particle size, stability, morphology, chemical interaction, and in vitro cytotoxicity. Further, their dose effects were explored in various combinations, such as individual or combined forms in both pure and NF formulations, by administration for 21 successive days. The results were first compared to the standard antidiabetic drug metformin, and then evaluated for antihyperglycemic activity in STZ + nicotinamide–induced diabetic rats. The combined formulation in both pure form and NF showed more antidiabetic effect on diabetic rats compared to single formulations, either pure or NF.
Methods
Preparation of combined NF of glycyrrhizin-loaded NPs and thymoquinone-loaded nanocapsules
The GL-loaded NPs were prepared using ionotropic gelation with the biodegradable polymers chitosan and gum arabic.19 Aqueous GL (Sigma-Aldrich) solution (a seventh of polymer) was first added to the chitosan (Hi-Media) solution (prepared in 2% v:v acetic acid), followed by addition of gum arabic (Hi-Media) solution with constant stirring. Polysorbate 60 (1% v:v of the whole solution; Hi-Media) was then added to the solution.
TQ-loaded nanocapsules (NCs) were prepared by nanoprecipitation, in which the polymer induces the precipitation of NPs when the organic phase is added to the aqueous phase.18 The aqueous phase contained the surfactants polyvinyl alcohol (0.28% w:v; Hi-Media;) and polysorbate-80 (1 mL; Hi-Media). The organic phase (dichloromethane) contained gum-rosin polymer (0.08% w:v; Hi-Media), oleic acid (1 mL) with TQ (20 mg; MP Biomedicals), and lecithin (0.4% w:v; Hi-Media). TQ-loaded NCs were prepared by adding the organic phase (pale yellow) into the aqueous phase (transparent) with constant vigorous stirring at room temperature.
After synthesis of GL-loaded NPs and TQ-loaded NCs, their combination (ie, GT NF) was prepared by mixing. The combined NF was then characterized by dynamic light scattering, ζ-potential, transmission electron microscopy (TEM), Fourier-transform infrared (FTIR) spectroscopy, and differential scanning calorimetry (DSC). Figure 1 depicts the scheme of present investigation.
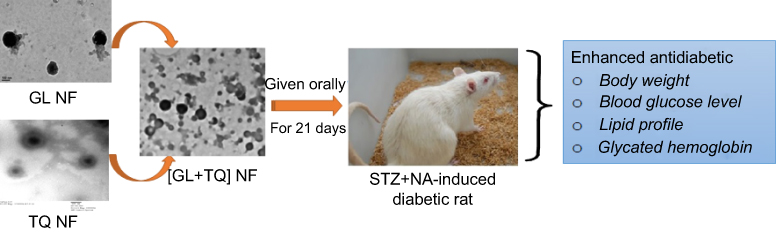 | Figure 1 Schematic representation of evaluation of combined NFs. Note: NFs given orally for 21 successive days to streptozotocin–nicotinamide (STZ+NA) diabetic rats for enhancement of antidiabetic parameters.Abbreviations: NFs, nanoformulations; differential scanning calorimetry; GL, glycyrrhizin; TQ, thymoquinone. |
Characterization of polymeric NFs
Particle size and ζ-potential
Dynamic light scattering was used to determine mean particle size and polydispersity index, while electrophoretic mobility of NPs in aqueous suspension was used to determine the ζ-potential of the combined GT NF using a Zetasizer Nano ZS (Malvern Instruments, Malvern, UK).
Morphological evaluation
TEM (Tecnai 268D; FEI) was used to study the morphology of the GT NF. A drop of nanosuspension was placed on a copper grid. It was kept at room temperature for 5 minutes to air-dry and then mounted in agoniometer for observation.
FTIR analysis
Samples of bioactive compounds prepared in four forms — GL, TQ, mixture of pure GT, and GT NF — were subjected to FTIR analysis (Alpha 12060280; Bruker) at 4,000–400 cm–1 using the KBr-pellet method. Pellets were formed by pressing the mixture of test sample and KBr at a ratio of 1:98.
DSC analysis
DSC of the four types of samples was performed on DSC equipment (Mettler). Different samples weighing 4–5 mg were placed in an aluminum pan and scanned in the range of 37°C–500°C at a heat-flow rate of 10°C/min under a continuous flow of nitrogen at 50 mL/min.
In vitro analysis
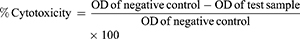
MTT assays were used to check the cytotoxicity of the pure drug and NFs on Vero cell lines. Vero cell lines were obtained from Centre for Animal Biotechnology, Chaudhary Charan Singh Haryana Agricultural University, Hisar, India, and the use of these received ethical approval from an institutional committee. the MTT assay is based on measuring the metabolic activity of living/viable cells by estimating the concentration of purple formed from the resulting product formazan. Vero cells (104/well) were cultured in a 96-well plate in DMEM and incubated for 24 hours at 37°C with 5% CO2. Thereafter, wells were exposed to 50 μL varying concentrations of samples — GL (20 and 40 ppm), GL-loaded NPs (20 and 40 ppm), TQ (20 and 40 ppm), TQ-loaded NCs (20 and 40 ppm), blank NPs (40 ppm) and blank NCs (40 ppm) — for 24 hours, followed by addition of 20 μL MTT solution (5 mg/mL in PBS). After removal of the supernatant from each well and washing twice with PBS, 100 μL solubilizing solution was then introduced to each well to dissolve formazan crystals. After incubation for another 4 hours, a dissolving agent was added to the wells and absorbance intensity analyzed by a microplate reader (SpectroStar Nano; BMG Labtech, Germany) at 570 nm. Cells treated with medium only served as a negative control group. All experiments were performed in triplicate, and percentage cytotoxicity was calculated:
In vivo antidiabetic studies
Animals and induction of diabetes
Wistar female albino rats weighing 140–175 g were purchased from Disease-Free Small Animal House (Lala Lajpat Rai University of Veterinary and Animal Sciences, Hisar, India). Before the experiment, rats were acclimatized for at least 5 days. Rats had free access to food and water and were maintained under standard laboratory conditions with a natural light–dark cycle. The experimental protocol was approved by the Institutional Animal Ethics Committee, Guru Jambheshwar University of Science and Technology, Hisar (CPCSEA/0436/PO/Re/S/2001) in its 30th meeting held on August 12, 2016. Animal care was performed as per the guidelines of the Committee for the Purpose of Control And Supervision of Experiments on Animals, Ministry of Environment, Forest, and Climate Change (New Delhi)
Rats were initially injected with a single intraperitoneal dose of 110 mg/kg body weight nicotinamide in physiological saline and 15 minutes later with 65 mg/kg body weight STZ.20 After 5 days of nicotinamide + STZ injections, fasting BGL was examined. Rats with BGL >200 mg/dL were selected as diabetic.
Experimental protocol and subject grouping
Rats with BGL >200 mg/dL were divided into ten groups of six rats each. Groups I and II were vehicle-treated controls that orally received distilled water (5 mL/kg) or oleic acid (5 mg/kg) for 21 successive days. Groups III–X were diabetic rats that received a single dose of nicotinamide (110 mg/kg) and STZ (65 mg/kg) intraperitoneally. Group III was a diabetic negative control group. Other diabetic rats were treated with 150 mg/kg metformin (group IV, positive control), 10 mg/kg GL (group V), 10 mg/kg TQ (group VI), 10 mg/kg GL plus 10 mg/kg TQ (group VII), 10 mg/kg GL-loaded NPs (group VII), 10 mg/kg thymoquinone-loaded NCs (group IX), or 10 mg/kg GL-loaded NPs plus 10 mg/kg thymoquinone-loaded NCs (group X, combined GT NF).
Measurement of body weight, fasting BGL, and biochemical estimation
Body weight and BGL of the rats were recorded on days 1, 7, 14, and 21. Blood samples were drawn from the tail vein of overnight-fasted animals for determination of BGL using blood glucometer strips (Gluco One BG03; Morepen, New Delhi, India).
After 21 days of oral dosing, blood samples of overnight-fasted rats were collected on day 22 from the retro-orbital plexus under mild general anesthesia. Biochemical parameters (such as total cholesterol [TC], triglyceride [TG], and high-density lipoprotein [HDL]) were estimated in serum using diagnostic kits (Biosystems Reagents and Instruments, Barcelona, Spain). Serum was separated from blood samples by centrifugation at 2,000 rpm using a cooling centrifuge (Remi R8C BL) for 10 minutes. HbA1c was estimated in whole-blood samples using a NycoCard HbA1c test kit (Alere Technologies, Oslo, Norway). Biochemical parameters were analyzed with an autoanalyzer (BS-200; Mindray, China). Very-low-density lipoprotein (VLDL) and LDL levels were calculated using the Friedewald formulas: VLDL = TG/5 and LDL =TC –(HDL + VLDL).21
Statistical analysis
Main experimental values (eg, body weight, BGL, various lipid profile parameters, and glycated hemoglobin) are expressed as means ± SEM. Experimental data were statistically analyzed using one-way ANOVA followed by Tukey–Kramer multiple-comparison post hoc testing (GraphPad version 3.0). P<0.05 was set as the basic criterion for statistical significance of each evaluation.
Results
Synthesis and characterization of combined NF (glycyrrhizin-loaded NPs + thymoquinone-loaded NCs)
Figure 2, A and B shows particle-size and ζ-potential images of the combined NF, respectively. The particle size and polydispersity index of the combined NF were 160.7 nm and 0.166, respectively, while the particle size of GL-loaded NPs and TQ-loaded NCs was 181.4 nm and 70.21 nm respectively. Also, the polydispersity index of GL-loaded NPs and TQ-loaded NCs was 0.256 and 0.251, respectively.18,19
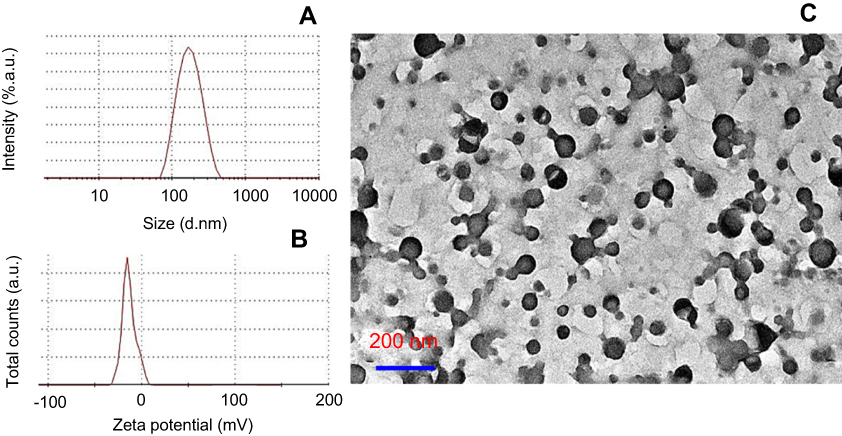 | Figure 2 (A) DLS-based particle size; (B) ζ-potential; (C) TEM of the combined GL+TQ nanoformulation. Abbreviations: DLS, differential scanning calorimetry; TEM, transmission electron microscopy; GL, glycyrrhizin; TQ, thymoquinone. |
The ζ-potential of the combined NF was settled at –13.8 mV. The ζ-potential of GL-loaded NPs and TQ-loaded NCs was 31.4 and –45.3 mV, respectively.17,18 From observation of ζ-potentials, it was revealed that differently charged particles interacted with one another. After the interaction, they produced a –13.8 mV net charge on the NF. Figure 2C shows TEM of the combined GT NF. It was observed that the NF of these bioactive compounds was spherical. The size of the combined NF was <100 nm.
Figure 3A shows the FTIR spectra of GL, TQ, combined pure GT, and combined GT NF. The GL spectrum showed OH stretching at 3,436.65 cm–1 and C–H stretching of alkanes at 2,921.74 and 2,859.60 cm–1. Peaks at 1,638.21, 1,460.16, and 1,104.16 cm–1 can be attributed to aromatic C=C stretching, C–H deformation, and C–O stretching vibration, respectively.19
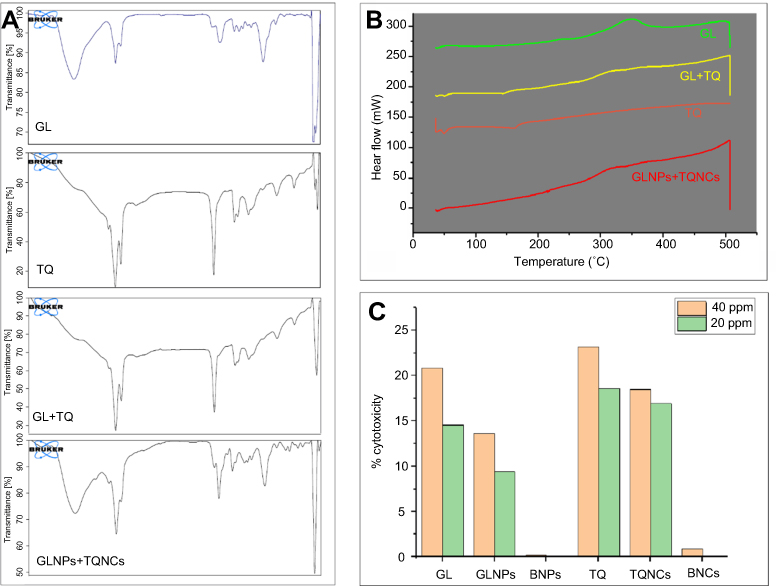 | Figure 3 FTIR spectra (A) and DSC (B) of GL, combined pure GL+TQ, TQ and combined GL+TQ NFs; (C) cytotoxic effect of different pure bioactive compounds and their NFs on Vero cell lines.Abbreviations: FTIR, Fourier-transform infared; DSC, differential scanning calorimetry; GLNPs, glycyrrhizin-loaded nanoparticles; BNPs, blank NPs; TQNCs, thymoquinone-loaded nanocapsules; BNCs, blank NCs; NFs, nanoformulations; GL, glycyrrhizin; TQ, thymoquinone. |
The TQ-spectrum peak at 2,925.77 cm–1 correspondedto the C–H stretching of tertiary carbon in the isopropyl group. The band at 2,856.44 cm–1 was attributed to the symmetric stretching modes of the three methyl groups. There was an intense band at 1,711.40 cm–1 for C=O stretching. The peaks at 1,459.31 and 1,416.61 cm–1 can be attributed to CH3 antisymmetric bending. In contrast, the peak at 1,285.16 cm–1 was for C–O stretching vibration, while those at 936.86 and 732.16 cm–1 can be assigned to N–H wagging.18,22
The IR spectra of combined pure GT documented the combined peaks of both GL and TQ, with intense peaks for each compound detected at 2,925.29 and 2,856.83 cm–1 (C–H stretching), 1,711.04 cm–1 (C=O stretching), 1,454.79 and 1,4.21.04 cm–1 (C–H deformation), 1,285.43 cm–1 (C-O stretching), and 937.69 and 723.42 cm–1 (N–H wagging).
Similarly, the IR spectra of combined GT NF exhibited combinations of their peaks, eg, broad bands at 3,429.24 cm–1 (OH stretching), 2,923.36 and 2,859.60 cm–1 (C–H stretching), 1,715.02 cm–1 (C=O stretching), 1,659.48 cm–1 (C=C stretching), 1,492.95 cm–1 (C–H deformation), 1, 257.56 cm–1 (C–O stretching), 1,093.61 cm–1 (C–O stretching), and 947.76 and 788.90 cm–1 (N–H wagging). The presence of these multiple peaks confirmed that the two bioactive compounds existed in the NF without any chemical alterations.
Figure 3B shows DSC of GL, TQ, and their combination in pure and NF forms. DSC of pure GL exhibited two endothermic peaks. The first endothermic transition peak at 38.6°C was of low intensity. The second endothermic peak at 213.9°C refers to the melting point of GL, as decomposition starts after 219.1°C.23 Additionally, peaks were of low intensity and not sharp, supporting an amorphous nature. The TQ DSC graph evidenced a sharp exothermic transition peak at 43.6°C and the first endothermic peak at 48.6°C. Exothermic peaks were sharp in the range of 44°C–45°C, reflecting crystallinity.24 Moreover, another endothermic peak was observed at 162.8°C, which may reflect the decomposition peak of TQ. The DSC graph of the combination of pure GT documents the combined peaks of GT at 36.8°C (endothermic peak of GL), 44.1°C (exothermic peak of TQ), 146.6°C (decomposition starting peak of TQ), and 235.5°C (decomposition peak of GL). As such, the presence of both bioactive compounds was identified. Moreover, the DSC graph of the combined GT NFs showed that no peaks were sharp, in agreement with the amorphous nature of the NFs. Both NFs were found to be amorphous.
Figure 3C shows the cytotoxicity profile of different samples on Vero cell lines at different concentrations. Two doses of GL, TQ and their NFs were evaluated for cytotoxicity parameters. From MTT in vitro experimental evaluation, it was demonstrated that cell viability was 80%–90% in NFs compared to 75%–85% for pure drugs). A concentration-dependent cytotoxic effect was observed on MTT cytotoxic assays. GL-loaded NPs (20 and 40 ppm) showed less cytotoxicity (35.68% and 34.49%, respectively) than pure GL. Similarly, TQ-loaded NCs (20 and 40 ppm) were less cytotoxic (8.7% and 20.5%, respectively) than their respective pure-TQ concentrations. Blank NPs and blank NCs showed <5% cytotoxicity on Vero cells.
In vivo antidiabetic activity
In this study, we investigated the antidiabetic effects of dosage administration using combined GT NFs in a type 2 diabetes model for the first time. To this end, subeffective doses of bioactive GT components were examined in six different forms: GL (10 mg/kg), TQ (10 mg/kg), mixture of GL and TQ (10+10 mg/kg), GL-loaded NPs (10 mg/kg), TQ-loaded NCs (10 mg/kg), and a mixture of GL-loaded NPs & TQ-loaded NCs (10+10 mg/kg, GT NF. Results were then evaluated in relation to body weight, fasting BGL, lipid profile, and glycated hemoglobin in nicotinamide + STZ–induced diabetic rats.
Induction of diabetes has been reported to cause loss or degradation of structural proteins, leading to decreased body weight.25 Bender and Mayes26 also reported that insulin deficiency results in decreased production of protein in all tissues, ultimately lowering body weight. Figure 4 shows the effects of various treatments on body weight of diabetic rats. There was no significant effect on body weight of diabetic rats on days 1 and 7. However, the weight of diabetic control rats (group III) decreased significantly on days 14 (P<0.01) and 21 (P<0.001) compared to oleic acid vehicle–treated control rats (group II). Moreover, there was a significant decrease in body weight of diabetic rats on day 21 (P<0.01) compared to distilled-water vehicle-treated control rats (group I). Diabetic rats treated with metformin (150 mg/kg), combined pure GT (10+10 mg/kg), and combined GT NF (10+10 mg/kg) significantly (P<0.05) showed reversed diabetes-induced decrease in body weight on day 14 compared to diabetic control rats. Moreover, diabetic rats treated with metformin (150 mg/kg), combined pure GT (10+10 mg/kg), and combined GT NF (10+10 mg/kg) (P<0.001, 0.001, and 0.01, respectively) showed significantly reversed diabetes-induced decrease in body weight on day 21 compared to diabetic control rats, while oral administration of GL (group V), TQ (group VI), and their NFs (group VIII and IX) had no effect on body weight on days 1, 7, 14, or 21 in diabetic rats compared to diabetic control rats.
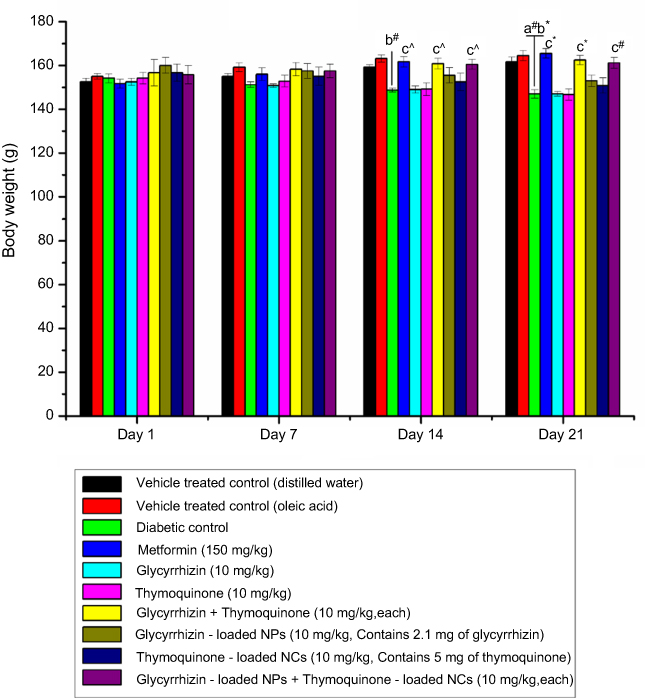 | Figure 4 Effects of various treatments on body weight of diabetic rats. Notes: Values presented as means ± SEM, n=6 in each group. Groups 3–10 were diabetic rats. Data were analyzed by one-way ANOVA followed by Tukey–Kramer multiple comparison, where “a” and “b” indicate significant differences compared to vehicle-treated control-distilled water and oleic acid. respectively, and “c” indicates significant differences compared to diabetic control. *P<0.001; #P<0.01; ^P<0.05.Abbreviations: NPs, nanoparticles; NCs, nanocapsules. |
Type 2 diabetes increases BGL through a decrease in the insulin secretion needed for carbohydrate metabolism. Figure 5 depicts the effects of various treatments on fasting BGL in rats. Treatment with nicotinamide + STZ significantly increased fasting BGL in rats of groups III–X on day 1 compared to the distilled-water vehicle-treated control (group I) and oleic acid vehicle–treated control (group II). BGL of diabetic rats increased significantly (P<0.001) on days 1, 7, 14, and 21 compared to vehicle-treated control rats (groups I and II). Metformin significantly (P<0.001) decreased the fasting BGL of diabetic rats compared to diabetic control rats on days 7, 14, and 21. GL, TQ, and their NFs, when applied independently, exerted no significant effect on BGL of diabetic rats compared to diabetic control rats. However, when bioactive compounds administered in a combined dose (GT: 10+10 mg/kg), fasting BGLs of diabetic rats were significantly decreased compared to diabetic control rats. Note that such patterns were apparent only on days 14 (P<0.05) and 21 (P<0.001), while no effect was observed on day 7. Moreover, combined GT NF dosage (10+10 mg/kg: actually containing 2.1 and 5 mg/kg, respectively) showed significantly decreased BGL in diabetic rats on day 7 (P<0.05), followed by day 14 (P<0.01) and day 21 (P<0.001) compared to diabetic control rats. Although the amount of each drug in the NF was lower (only 7.1 mg compared to 20 mg), it showed a better effect on BGL in diabetic rats.
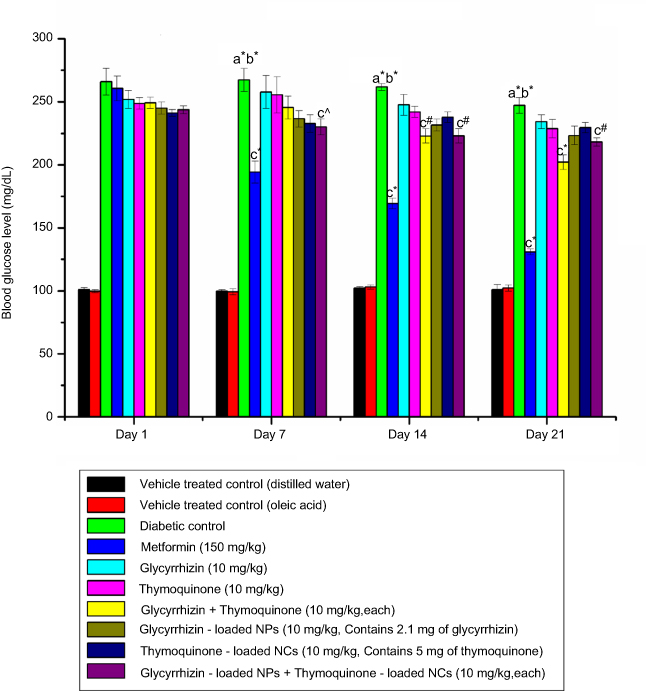 | Figure 5 Effects of various treatments on blood glucose level of diabetic rats. Values are presented as mean ± SEM; n=6 in each group. Notes: Groups 3–10 were diabetic rats. Data analyzed by one-way ANOVA followed by Tukey–Kramer multiple comparison, where “a” and “b” indicate significant differences compared to vehicle-treated control-distilled water and oleic acid, respectively, and “c” indicates significant differences compared to diabetic control. *P<0.001; #P<0.01; ^P<0.05.Abbreviations: NPs, nanoparticles; NCs, nanocapsules. |
Figure 6 shows the effects of various treatments on lipid profiles and glycated hemoglobin of diabetic rats on day 22. Type 2 diabetes can increase BGL through a decrease in insulin secretion, which is needed for carbohydrate metabolism. The decrease in fasting BGL of diabetic rats by GL and TQ observed in this study is also supported by the literature.13,27 HbA1c is an interactive product of BG and hemoglobin. In this study, rats in the diabetic control group showed an increase in HbA1c due to the interaction between large amounts of BG and hemoglobin, as supported by the literature.28 Rats in the diabetic control group showed significant (P<0.001) increases in plasma TC, TG, LDL, VLDL, and HbA1c, but a significant (P<0.001) decrease in plasma HDL (Figure 6D) compared to vehicle-treated control rats (groups I and II). GL, TQ, and their NFs had no significant effect on lipid profile or HbA1c of diabetic rats compared to diabetic control rats. The combined dose of pure GT (10+10 mg/kg) significantly decreased (P<0.01) the plasma TG and VLDL only, with no effect on plasma TC, LDL, HDL, or HbA1c in diabetic rats compared to diabetic control rats. However, oral administration of metformin to group IV rats and combined GT NFs (10+10 mg/kg, actually containing 2.1 and 5 mg/kg, respectively) to group X rats significantly decreased (P<0.001) TC, TG, LDL, VLDL, and HbA1c and significantly increased (P<0.001) HDL in diabetic rats on day 22 compared to diabetic control rats.
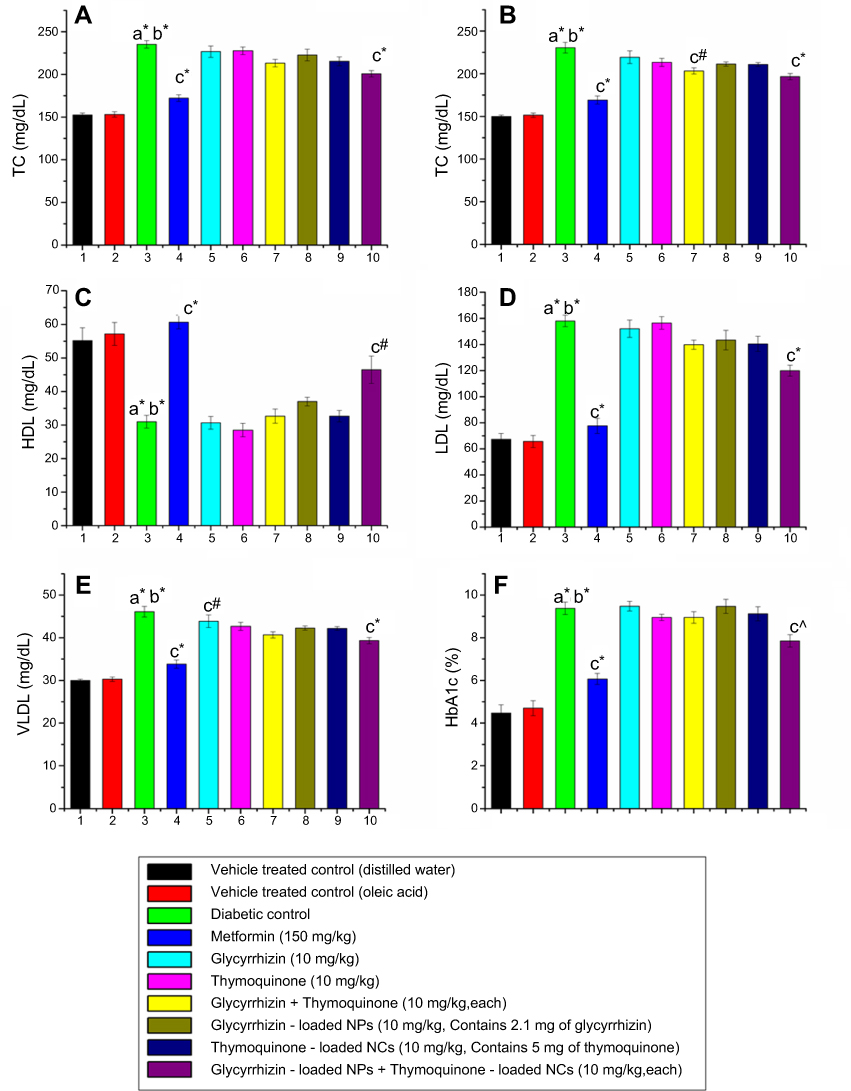 | Figure 6 Effects of various treatments on lipid profiles and glycated hemoglobin in diabetic rats on day 22. Notes: Values presented as means ± SEM, n=6 in each group. Groups 3–10 were diabetic rats. Data analyzed by one-way ANOVA followed by Tukey–Kramer multiple comparison, where “a” and “b” indicate significant difference compared to vehicle-treated control-distilled water and oleic acid respectively, and “c” indicates significant differences compared to diabetic control. *P<0.001; #P<0.01; ^P<0.05.Abbreviations: TC, total cholesterol; HDL, high-density lipoprotein; VLDL, very-low-density lipoprotein; NPs, nanoparticles; NCs, nanocapsules. |
Discussion
Biodegradable polymeric NFs exist in the form of micelles, emulsions, particulates, liposomes, nanogel, and dendrimers, which are all used as drug-delivery vehicles.29 GL-loaded NPs were prepared via ionotropic gelation using chitosan and gum arabic as encapsulation polymers. Synthesis of NPs was achieved by electrostatic interaction of a positively charged amine group (–NH2) of chitosan with negatively charged carboxylic groups (–COO) of gum arabic.30 TQ-loaded NCs were prepared by nanoprecipitation , also called solvent displacement or interfacial deposition. NC synthesis requires both organic (solvent) and aqueous (non solvent) phases. In this study, the solvent phase consisted of dichloromethane, which contained a film-forming polymer (gum rosin), the active substance (TQ), an oil core for dissolving the active substance (oleic acid), and a tensioactive species (lecithin). The nonsolvent phase consisted of a mixture of two surfactants (polyvinyl alcohol and polysorbate 80) in distilled water. The aqueous phase has high surface tension, while the organic phase has low surface tension. Since a liquid with high surface tension pulls more strongly on the surrounding liquid than one with low surface tension, this difference causes interfacial turbulence and thermal inequalities in the system. This creates a continuous formation of whirls of solvent at the interface of the aqueous and organic phases. This mutual miscibility causes violent spreading between the solvents to displace the solvent from regions of low surface tension. In the meantime, the polymer aggregates on the oil surface, resulting in formation of NCs.31
The particle shape and size of the combined NF was spherical and <100 nm, as predicted from TEM analysis. For in vivo studies, particles <200 nm are preferable, because particles of such size are not recognized by the reticuloendothelial system.32 Therefore, they have prolonged circulation and yield greater pharmacological effects. Additionally, the ζ-potential of the combined NF was –13.8 mV, which might have been an interactive outcome of two NFs (GL-loaded NPs [31.4 mV] and TQ-loaded NCs [–45.3 mV]), which might have had a chance of aggregation/agglomeration. In general, aggregation indicates strongly bonded or fused particles and agglomeration indicates more weakly bonded particles. In the present study, it may have been that the two different NFs did not have enough energy for the particles to get fused. Moreover, both the NP systems had high stability, thereby preventing them from aggregating, even though some agglomerates may exist in solutions, thereby affecting particle size to a smaller extent. Moreover, the combined NF with the two different type of NF having contrasting ζ-potentials was observed for some partial interactions, as supported by the literature.33 Moreover, negative ζ-potentials showed higher cellular uptake compared to positive ζ-potentials.34 FTIR and DSC analysis confirmed the presence of bioactive compounds in the combined NF without any chemical interaction and amorphous nature of combined NF respectively. Moreover, the present study revealed that the NFs were less toxic to cell lines than pure drugs, as supported by the literature.35,36 In the present investigation, single NF doses showed less cytotoxicity compared to pure bioactive compounds. From this, it can be concluded that the combined NF at sub effective dose would have less cytotoxic effect. Moreover, the preparation of NFs is very easy and requires only inexpensive chemicals. Therefore, the NP-product formulation would be in the economic range.
GL and TQ have been reported for their antihyperglycemic potential in diabetic rats. Improvements in body weight and lipid profile and reductions in BGL and HbA1c in diabetic rats by administration of GL and TQ has been reported.13,27 Moreover, the NFs of GL (20 and 40 mg/kg) and TQ (20, 40, and 80 mg/kg) have also been evaluated by our research group for antidiabetic activity in STZ + nicotinamide–induced diabetic rats.17,18 In our previous work, we observed very noticeable patterns: reversed diabetes-induced decrease in body weight, improvement in lipid profile, reduction in BG, and decrease in HbA1c in diabetic rats treated with GL-loaded NPs (20 and 40 mg/kg, actually containing 4.2 and 8.4 mg GL, respectively).17 Also, near-identical results were observed in diabetic rats treated with TQ-loaded NCs (20, 40, and 80 mg/kg, actually containing 10, 20, and 40 mg TQ, respectively).18
In this research, subeffective doses of two bioactive compounds in NF form were investigated independently (10 mg/kg) and in combination (after mixing) for their antidiabetic effect on STZ + nicotinamide–induced diabetic rats. Individual treatment showed no noticeable effect on some important parameters (eg, body weight, BG, HbA1c, and lipid profile), which might reflect insufficiency of the drugs in circulation. However, the combined GT doses, when administered in both pure and NF forms, exhibited noticeable improvements. Results between the two types of combined administration (pure vs NF) were dissimilar when compared in relation to all eight variables examined in this study. In the case of the pure forms, a significant effect was found on four parameters (body weight, BGL, TG level, and VLDL), while there was no significant effect on the other four variables (glycated hemoglobin, TC, LDL, and LDL). However, the administration of GT NF showed significant results in all eight parameters. In addition, the administration of combined NFs led to noticeable reversal trends in diabetes-induced reduction of body weight for diabetic rats. Further, combined NF dosage also significantly improved lipid profiles while reducing the BG and HbA1c of diabetic rats. In addition, it should be noted that the actual drug-loading amounts of GL and TQ in their combined NF dose were lower by four and two times, respectively, relative to those administered in pure forms. Nonetheless, they still produced effects comparable to metformin, a standard antidiabetic drug. The order of significance based on P- and Q-values for various treatments on different diabetic parameters examined in this study is shown in Table 1.
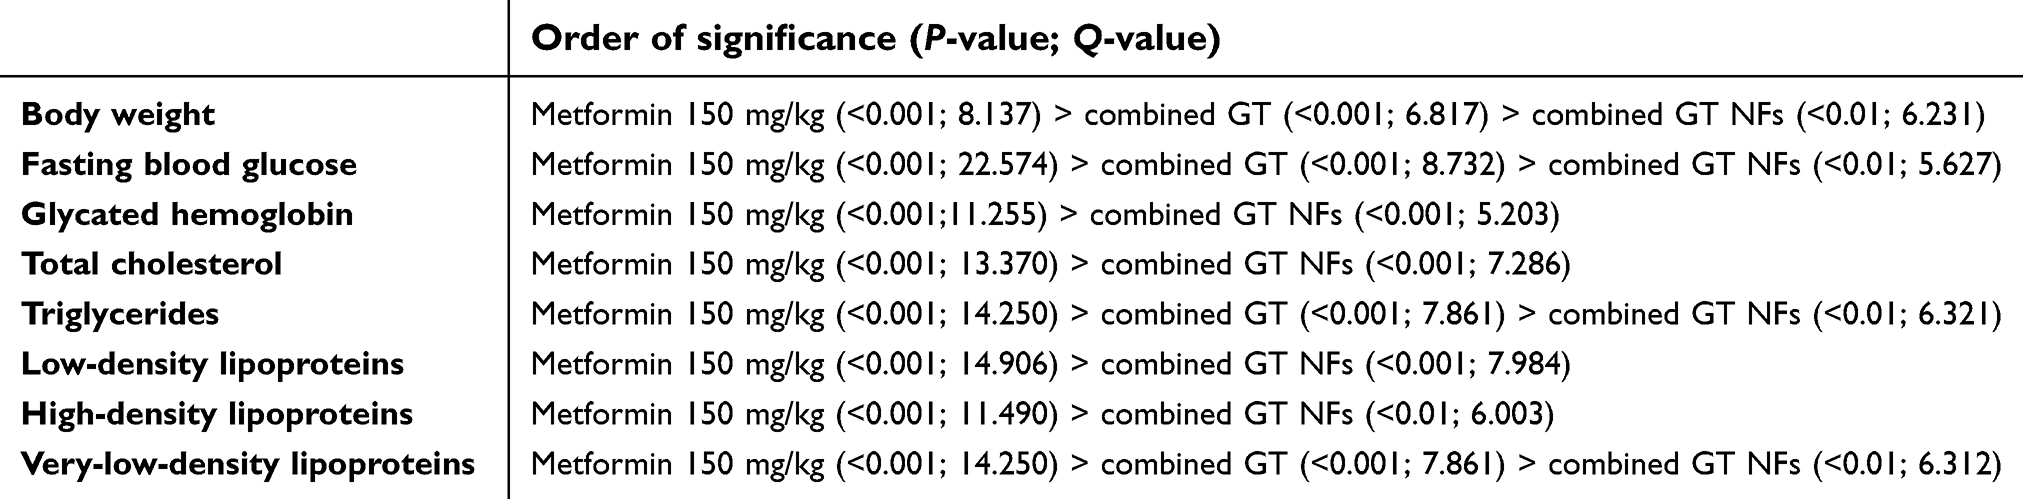 | Table 1 Relative order of significance of various parameters among different drug treatments employed for antidiabetic evaluation |
This effect could be due to increased absorption of bioactive compounds in the blood, leading to enhancement of bioavailability in the NFs.37,38 From this observation, it can be stated that subeffective NF doses of bioactive compounds had no apparent effect on the antidiabetic parameters studied, while combined NF doses exhibited significant antidiabetic effects, possibly due to enhanced absorption of NFs in the circulation. Another reason for improved antidiabetic activity is the synergistic effect of two NFs, which ultimately enhanced pharmacological activity, as supported by the literature.9,10
Conclusion
A combined dose of NFs, made as a mixture of GL-loaded NPs and TQ-loaded NCs, was administered to evaluate the effects of different treatment options of bioactive components of drugs, eg, between pure and NF forms and between individual and combined applications. Oral administration of combined GT NFs for 21 successive days to diabetic rats significantly decreased fasting BGL and glycated hemoglobin while improving lipid-profile parameters and body weight compared to their NFs individually. It is noteworthy that despite the lower amounts of the pure-drug components, the combined dosages of NFs still exerted a significant effect on type 2 diabetic rats compared to the diabetic control group. The performance of the combined GT NF was superior among all tested conditions, as evidenced by favorable responses in all eight studied parameters. Based on this study, we conclude that a combination NF of bioactive compounds is more effective than a single NF, even at a reduced drug load. Moreover, the NFs showed lower cytotoxicity than the respective pure drug/bioactive compound. Further research should elucidate the combined effect of NFs of GL and TQ as a new medicinal option for the management of diabetes.
Acknowledgments
The authors thank the Department of Science and Technology (DST), Government of India for providing assistance to establish research facilities. RR (IF 120268) also thank the DST, New Delhi for providing INSPIRE fellowships for a doctorate program. SK is grateful to DST-PURSE, sanctioned to Guru Jambheshwar University of Science and Technology, Hisar under PURSE program SR/PURSE phase 2/40(G). KHK acknowledges support given in part by grants from the National Research Foundation of Korea (NRF) funded by the Ministry of Science, ICT, and Future Planning (2016R1E1A1A01940995).
Disclosure
The authors report no conflicts of interest in this work.
References
1.
2.
3. Ganesan P, Arulselvan P, Choi DK. Phytobioactive compound-based nanodelivery systems for the treatment of type 2 diabetes mellitus–current status. Int J Nanomedicine. 2017;12:1097–1111. doi:10.2147/IJN.S124601
4. Kumar S, Dilbaghi N, Rani R, Bhanjana G, Umar A. Novel approaches for enhancement of drug bioavailability. Rev Adv Sci Eng. 2013;2(2):133–154. doi:10.1166/rase.2013.1038
5. Shukla SK, Shukla SK, Govender PP, Giri NG. Biodegradable polymeric nanostructures in therapeutic applications: opportunities and challenges. RSC Adv. 2016;6(97):94325–94351. doi:10.1039/C6RA15764E
6. Singh S, Pandey VK, Tewari RP, Agarwal V. Nanoparticle based drug delivery system: advantages and applications. Indian J Sci Technol. 2011;4(3):177–180.
7. Kumar S, Dilbaghi N, Saharan R, Bhanjana G. Nanotechnology as emerging tool for enhancing solubility of poorly water-soluble drugs. BioNanoScience. 2012;2(4):227–250. doi:10.1007/s12668-012-0060-7
8. Gothai S, Ganesan P, Park SY, Fakurazi S, Choi DK, Arulselvan P. Natural phyto-bioactive compounds for the treatment of type 2 diabetes: inflammation as a target. Nutrients. 2016;8(8):461. doi:10.3390/nu8080461
9. Al-Enazi MM. Protective effects of combined therapy of Rutin with Silymarin on experimentally-induced diabetic neuropathy in rats. Pharmacol Pharm. 2014;5(9):876–890. doi:10.4236/pp.2014.59098
10. Kaur G, Invally M, Chintamaneni M. Influence of piperine and quercetin on antidiabetic potential of curcumin. J Complement Integr Med. 2016;13(3):247–255. doi:10.1515/jcim-2016-0016
11. Asl MN, Hosseinzadeh H. Review of pharmacological effects of Glycyrrhiza sp. and its bioactive compounds. Phytother Res. 2008;22(6):709–724. doi:10.1002/ptr.2362
12. Darakhshan S, Pour AB, Colagar AH, Sisakhtnezhad S. Thymoquinone and its therapeutic potentials. Pharmacol Res. 2015;95–96:138–158.
13. Kalaiarasi P, Pugalendi KV. Antihyperglycemic effect of 18β-glycyrrhetinic acid, aglycone of glycyrrhizin, on streptozotocin-diabetic rats. Eur J Pharmacol. 2009;606(1):269–273. doi:10.1016/j.ejphar.2008.12.057
14. Sangi SMA, Sulaiman MI, El-Wahab MFA, Ahmedani EI, Ali SS. Antihyperglycemic effect of thymoquinone and oleuropein, on streptozotocin-induced diabetes mellitus in experimental animals. Pharmacogn Mag. 2015;11(Suppl 2):S251–S257. doi:10.4103/0973-1296.166017
15. Jin S, Fu S, Han J, et al. Improvement of oral bioavailability of glycyrrhizin by sodium deoxycholate/phospholipid-mixed nanomicelles. J Drug Target. 2012;20(7):615–622. doi:10.3109/1061186X.2012.702770
16. Alkharfy KM, Ahmad A, Khan RM, Al-Shagha WM. Pharmacokinetic plasma behaviors of intravenous and oral bioavailability of thymoquinone in a rabbit model. Eur J Drug Metab Pharmacokinet. 2015;40(3):319–323. doi:10.1007/s13318-014-0207-8
17. Rani R, Dahiya S, Dhingra D, Dilbaghi N, Kim KH, Kumar S. Evaluation of anti-diabetic activity of glycyrrhizin-loaded nanoparticles in nicotinamide-streptozotocin-induced diabetic rats. Eur J Pharm Sci. 2017;106:220–230. doi:10.1016/j.ejps.2017.05.068
18. Rani R, Dahiya S, Dhingra D, Dilbaghi N, Kim KH, Kumar S. Improvement of antihyperglycemic activity of nano-thymoquinone in rat model of type-2 diabetes. Chem Biol Interact. 2018;295:119–132. doi:10.1016/j.cbi.2018.02.006
19. Rani R, Dilbaghi N, Dhingra D, Kumar S. Optimization and evaluation of bioactive drug-loaded polymeric nanoparticles for drug delivery. Int J Biol Macromol. 2015;78:173–179. doi:10.1016/j.ijbiomac.2015.03.070
20. Mojani MS, Sarmadi VH, Vellasamy S, et al. Evaluation of metabolic and immunological changes in streptozotocin-nicotinamide induced diabetic rats. Cell Immunol. 2014;289(1):145–149. doi:10.1016/j.cellimm.2014.04.004
21. Friedewald WT, Levy RI, Fredrickson DS. Estimation of the concentration of low-density lipoprotein cholesterol in plasma, without use of the preparative ultracentrifuge. Clin Chem. 1972;18(6):499–502.
22. Raschi AB, Romano E, Benavente AM, Altabef AB, Tuttolomondo ME. Structural and vibrational analysis of thymoquinone. Spectrochim Acta A Mol Biomol Spectrosc. 2010;77(2):497–505. doi:10.1016/j.saa.2010.06.026
23. Lide DR. CRC Handbook of Chemistry and Physics.
24. Pagola S, Benavente A, Raschi A, Romano E, Molina MA, Stephens PW. Crystal structure determination of thymoquinone by high-resolution X-ray powder diffraction. AAPS PharmSciTech. 2004;5(2):24–31. doi:10.1208/pt050228
25. Rajkumar L, Srinivasan N, Balasubramanian K, Govindarajulu P. Increased degradation of dermal collagen in diabetic rats. Indian J Exp Biol. 1991;29(11):1081–1083.
26. Bender D, Mayes P. Gluconeogenesis and the control of blood glucose. In: Murray R, Granner D, Rodwell V, editors. Harper’S Illustrated Biochemistry. New York: McGraw-Hill; 2006:167–176.
27. Pari L, Sankaranarayanan C. Beneficial effects of thymoquinone on hepatic key enzymes in streptozotocin-nicotinamide induced diabetic rats. Life Sci. 2009;85(23):830–834. doi:10.1016/j.lfs.2009.10.021
28. Chattopadhyay RR. Possible mechanism of antihyperglycemic effect of Azadirachta indica leaf extract: part V. J Ethnopharmacol. 1999;67(3):373–376.
29. Pandey SK, Haldar C, Patel DK, Maiti P. Biodegradable polymers for potential delivery systems for therapeutics. In: Dutta PK, Dutta J, editors. Multifaceted Development and Application of Biopolymers for Biology, Biomedicine and Nanotechnology. Heidelberg: Springer; 2013:169–202.
30. Avadi MR, Sadeghi AMM, Mohammadpour N, et al. Preparation and characterization of insulin nanoparticles using chitosan and Arabic gum with ionic gelation method. Nanomedicine. 2010;6:58–63. doi:10.1016/j.nano.2009.04.007
31. Mora-Huertas CE, Fessi H, Elaissari A. Polymer-based nanocapsules for drug delivery. Int J Pharm. 2010;385(1):113–142. doi:10.1016/j.ijpharm.2009.10.018
32. Myerson JW, Anselmo AC, Liu Y, Mitragotri S, Eckmann DM, Muzykantov VR. Non-affinity factors modulating vascular targeting of nano-and microcarriers. Adv Drug Deliv Rev. 2016;99:97–112. doi:10.1016/j.addr.2015.10.011
33. Wu C, Wang L, Harbottle D, Masliyah J, Xu Z. Studying bubble-particle interactions by zeta potential distribution analysis. J Colloid Interface Sci. 2015;449(399–408). doi:10.1016/j.jcis.2015.01.040
34. Patil S, Sandberg A, Heckert E, Self W, Seal S. Protein adsorption and cellular uptake of cerium oxide nanoparticles as a function of zeta potential. Biomaterials. 2007;28(31):4600–4607. doi:10.1016/j.biomaterials.2007.07.029
35. Chauhan N, Dilbaghi N, Gopal M, Kumar R, Kim KH, Kumar S. Development of chitosan nanocapsules for the controlled release of hexaconazole. Int J Biol Macromol. 2017;97:616–624. doi:10.1016/j.ijbiomac.2016.12.059
36. Dilbaghi N, Kaur H, Ahuja M, Kumar S. Preparation and evaluation of enrofloxacin-loaded solid lipid nanoparticles. J Nanosci Nanotechnol. 2013;3(2):147–153.
37. Shi F, Wei Z, Zhao Y, Xu X. Nanostructured lipid carriers loaded with baicalin: an efficient carrier for enhanced antidiabetic effects. Pharmacogn Mag. 2016;12(47):198–202. doi:10.4103/0973-1296.186347
38. Xue M, Yang MX, Zhang W, et al. Characterization, pharmacokinetics, and hypoglycemic effect of berberine loaded solid lipid nanoparticles. Int J Nanomedicine. 2013;8:4677–4687. doi:10.2147/IJN.S51262
 © 2019 The Author(s). This work is published and licensed by Dove Medical Press Limited. The full terms of this license are available at https://www.dovepress.com/terms.php and incorporate the Creative Commons Attribution - Non Commercial (unported, v3.0) License.
By accessing the work you hereby accept the Terms. Non-commercial uses of the work are permitted without any further permission from Dove Medical Press Limited, provided the work is properly attributed. For permission for commercial use of this work, please see paragraphs 4.2 and 5 of our Terms.
© 2019 The Author(s). This work is published and licensed by Dove Medical Press Limited. The full terms of this license are available at https://www.dovepress.com/terms.php and incorporate the Creative Commons Attribution - Non Commercial (unported, v3.0) License.
By accessing the work you hereby accept the Terms. Non-commercial uses of the work are permitted without any further permission from Dove Medical Press Limited, provided the work is properly attributed. For permission for commercial use of this work, please see paragraphs 4.2 and 5 of our Terms.