")
Back to Journals » Diabetes, Metabolic Syndrome and Obesity » Volume 12
Anthropometric variables as cardiovascular risk predictors in a cohort of adult subjects with Turner syndrome
Authors Álvarez-Nava F , Racines M , Witt J, Guarderas J , Estévez M, Lanes R
Received 7 May 2019
Accepted for publication 23 July 2019
Published 9 September 2019 Volume 2019:12 Pages 1795—1809
DOI https://doi.org/10.2147/DMSO.S214787
Checked for plagiarism Yes
Review by Single anonymous peer review
Peer reviewer comments 2
Editor who approved publication: Prof. Dr. Antonio Brunetti
Francisco Álvarez-Nava1,2, Marcia Racines3, Julia Witt1, Jéssica Guarderas1, María Estévez3,4, Roberto Lanes5
1Biological Sciences School, Faculty of Biological Sciences, Central University of Ecuador, Quito, Ecuador; 2Genetic Research Institute, University of Zulia, Maracaibo, Venezuela; 3Institute of Biomedicine Research, Central University of Ecuador; Quito, Ecuador; 4Ecuadorian Foundation in Support of Turner Syndrome, Quito, Ecuador; 5Pediatric Endocrine Unit, Hospital de Clinicas Caracas, Caracas, Venezuela
Correspondence: Francisco Álvarez-Nava
Biological Sciences School, Faculty of Biological Sciences, Central University of Ecuador, Calle Iquique con Calle Sodiro Number N14-121, Parroquia San Blas, Quito, Pichincha 170113, Ecuador
Tel +593 252 8810
Fax +593 252 8810
Email [email protected]
Background and purpose: Excessive adiposity is associated with cardiometabolic complications in Turner syndrome (TS) subjects. Reference data for predictive anthropometric indices of overweight/obesity and metabolic syndrome (MetS) are lacking for subjects with TS. The purpose of this study was to identify the best anthropometric predictor of cardiometabolic risk in a Latin-American cohort of TS subjects.
Patients and methods: This was a cross-sectional correlational study conducted in adult TS subjects (n=88) over the past seven years. Anthropometric parameters, body composition and biochemical variables were evaluated in a study and in a reference (n=57) group. Overweight/obesity and MetS were diagnosed using international consensus. The area under the ROC curve (AUC-ROC) was then used to determine the value of each anthropometric variable in predicting MetS or overweight/obesity.
Results: The prevalence of MetS and overweight/obesity in TS subjects was 40% and 48%, respectively. All anthropometric and cardiometabolic variables were significantly increased in TS subjects when compared to the reference group, except for body mass index (BMI) and HDL-c. To detect MetS and overweight/obesity, waist to height ratio (WHtR) was found to have a higher correlation with cardiometabolic variables (TC, LDL-c, HDL-c levels and the LDL-c/HDL-c ratio), and to have a higher AUC-ROC and odds ratio than BMI, waist circumference (WC) and the waist to hip ratio (WHR).
Conclusion: The prevalence of MetS and overweight/obesity is elevated in TS subjects. WHtR was the most useful variable in predicting the presence of MetS and overweight and obesity in this TS cohort. A combination of WHtR with BMI or with WC could have the best clinical utility in identifying adult TS subjects with overweight/obesity and MetS, respectively.
Keywords: anthropometric indexes, body composition, cardiometabolic risk, metabolic syndrome, obesity, overweight, Turner syndrome
Introduction
Turner syndrome (TS) is a disorder characterized by a number of clinical features of variable intensity that may include dysmorphic stigmata, short stature, sexual infantilism, and renal, cardiac, skeletal, endocrine and metabolic abnormalities. It is the result of a missing or structurally abnormal second sex chromosome.1,2 This disorder is one the most common human chromosomal abnormalities, occurring in approximately 1:2500 live female births.2 Patients with TS generally have severely deficient body height and distorted body proportions when compared with healthy women.3–6 Congenital cardiovascular disease affects 30% of patients with TS and the risk of premature death by this condition is increased 20-fold in TS subjects.7 Adult patients also have an increased risk for ischemic heart disease with a 2.8-fold increase in the risk of premature.7 This atherosclerotic process starts early on8,9 and epidemiological data suggests that there is an associated 3-fold risk of mortality from cardiovascular diseases (myocardial infarction and stroke) in TS compared to the general female population.10,11 Thus, the life expectancy in TS is reduced by at least 10 years.11 Insulin resistance and dyslipidemia are probably the most common metabolic abnormalities found in adult patients with TS.7,12,13 Both are components of the Metabolic Syndrome (MetS),14,15 which consists of a cluster of risk factors which may lead to the development of type 2 diabetes mellitus (T2DM) and cardiovascular disease.16 The prevalence of each component of MetS is increased in adult TS patients.14,15 However, the incidence of MetS in TS adult patients has still not been well defined.
The dramatic rise in the prevalence of overweight/obesity in the USA and in European countries has become a major health concern. Latin American populations do not escape this pandemic.17 Overweight/obesity has been defined as an increase of total corporal adipose tissue out of proportion to other tissues. It is characterized by changes in body mass index (BMI) and further defined in terms of fat distribution via the waist–hip ratio (WHR) and through the presence of cardiovascular risk factors. Overweight/obesity has also been associated with an increased mortality rate, coronary heart disease, hypertension, dyslipidemia and T2DM in TS subjects.11,13,18
From a clinical point of view, there is a real need for an appropriate definition of overweight/obesity in TS, as there is no consensus regarding this matter.2 BMI has been validated by dual X-ray absorptiometry19 and recommended as a good adiposity index. Also, an increased BMI is strongly associated with complications resulting from an increased corporal fat mass. However, BMI measurements in subjects with altered phenotypes affecting body proportions, such as TS, can be imprecise and the significance of its association with total fat mass or percentage of corporal fat mass in these patients is unclear.6 For example, the shorter legs with respect to trunk length observed in TS patients, together with a wider shoulder girdle, could disturb weight-height proportions, affecting the reliability of BMI when trying to assess the degree of overweight/obesity in TS patients. The main objective of this study was to assess the value of anthropometric indexes as a measure of predicting cardiovascular risk, and consequently, to define the best anthropometric predictor of MetS and overweight/obesity in an adult population of Latin-American individuals with TS.
Materials and methods
Design study and study subjects
This was a cross-sectional correlational study carried out in two Latin-American universities over the past seven years (School of Biology, Central University of Ecuador, Quito, Ecuador; and the Genetic Research Institute, University of Zulia, Maracaibo, Venezuela). The study protocol was reviewed and approved by the Ethics Committee´s for Research in Human Subjects of the two participating institutions. Unrelated adult TS patients (>20 years old) were recruited through both sources. Venezuelan subjects (n=54) were periodically examined at the outpatient Medical Genetics clinic of the Genetic Research Institute, University of Zulia, between January 2010 and December 2016; a second group of Ecuadorian individuals (n=34) were recruited through the Ecuadorian Foundation in Support of Turner Syndrome. They were contacted using letters, e-mails and telephone calls and subsequently underwent a comprehensive health examination between January and November 2017. No statistical difference was found between subjects of the two different countries at the beginning of the study with respect to the demographic or genetic data (age, socio-economic status, education level, height-SDS, weight-SDS, BMI-SDS, karyotype distribution). The diagnosis of TS was established by lymphocyte chromosomal analysis in combination with clinical features. None of the subjects had received treatment with growth hormone or anabolic steroids. Information on exposure to estrogen (age at menarche, start of induction of puberty, premature ovarian failure, duration and cessation of hormone replacement therapy (HRT)) was collected. Information on exposure to estrogen (age at menarche, start of induction of puberty, premature ovarian failure, duration and cessation of hormone replacement therapy (HRT)) was collected. Five of the patients menstruated spontaneously. All patients, except six, received conventional HRT. Forty-nine TS subjects (56%) received HRT for more than 5 years. The remaining 39 subjects were either poorly or irregularly treated (for less than two-years (range: 6 months to 7.3 years) or never received HRT and seven of these patients received HRT for an unspecified period. If a patient was receiving HRT, it was discontinued four weeks prior to assessment. The distribution of the cytogenetic analysis among the patients was as follows: monosomy 45,X (n=37), 45,X/46,XX mosaicism (n=18), X-isochromosome ((45,X/46,X,i(Xq) or 46,X,i(Xq)) (n=15), and others, such as partial X deletions (n=6), multiple cell lines (n=5), marker or ring X-chromosome (n=4), and 45,X/46,XY mosaicism (n=3). Karyotypes with a total deletion of the p-arm (45,X plus X-isochromosome cases) were pooled as a sole group. The remaining cases, including structural anomalies and partial deletions of the p-arm, were grouped.
Measurements
Each participant was evaluated in the morning after an overnight fast of at least ten hours. Anthropometric evaluation was performed by trained physicians using standard techniques. Height of subjects was measured with a wall stadiometer. A non-extensive tape was used to measure hip- and waist-circumferences (HC and WC). Measurements were taken three times and their average was recorded. Body Mass Index (BMI), waist/standing height (WHtR) and waist/hip (WHR) ratios were then calculated. Systolic and diastolic blood pressures (SBP and DBP) were measured using an automated sphygmomanometer monitor. Following 10 mins of rest three readings in the sitting position were obtained from the left arm with an appropriate size cuff at 5 min intervals and, then were averaged. Bioelectrical impedance analysis was carried out in the morning by a trained investigator using a segmental two-frequency bio-impedance analyzer (Inbody 120, Biospace Co. Ltd., South Korea). Data output, as calculated by the algorithm manufacturer, included weight, total body water (TBW), total fat mass (FM), percentage fat mass (PFM), total fat free mass (FFM) and percentage fat free mass (PFFM).20
A reference group of 57 healthy women, 20–49 years of age, matched by age and BMI with the study group, was also included. These volunteers were required to be free of significant medical illnesses and not to be taking any medication known to affect body weight or metabolic processes. All of these women had regular menstrual cycles and had not been treated with or were presently receiving HRT or glucocorticoid therapy. None of the individuals (study or reference group) had evidence of decompensated organic disease. Subjects with T1DM or T2DM were excluded from this study. Although several TS patients had congenital heart disease, including corrected aortic coarctation, none of the TS subjects included in our study had severe or hemodynamically decompensated congenital heart disease or congenital renal anomalies predisposing them to hypertension. Individuals with either hyperthyroidism or uncontrolled or difficult to control hypothyroidism were excluded from the study. Similarly, subjects with leukemia or other type of cancers were also excluded. Patients with elevated liver enzymes were included in the study, but only if did not have any decompensated liver disease. No subjects had clinical or serological evidence of autoimmune disease. Subjects with decompensated renal or gastrointestinal disease, psychosocial deprivation, or any eating disorder were also excluded.
Laboratory analysis
Trained personnel collected a 10-mL fasting whole blood sample from an antecubital vein of each subject. The samples were immediately labelled, centrifuged, stored in iceboxes and sent to the laboratory within 3 hrs of collection. Serum fasting levels of glucose, total-, and HDL-cholesterol and triglyceride concentrations were measured in all subjects by the enzymatic method using a computerized analyzer. Low-density lipoprotein (LDL) cholesterol was derived from the lipids measured using the Friedewald calculation.
Definitions
Metabolic syndrome was diagnosed using the International Diabetes Federation (IDF) consensus.21 According to the new IDF definition, for a woman to be defined as having the MetS they must present: 1) Central obesity (defined as waist circumference ≥80 cm) plus any two of the following four factors: 2) fasting plasma glucose 5.6 mmol/L (100 mg/dL); 3) HDL-c level <1.29 mmol/L (<50 mg/dL); 4) TAG ≥1.7 mmol/L (>150 mg/dL) or specific treatment for this; and 5) blood pressure ≥130/85 mm Hg or treatment of previously diagnosed hypertension. Nutritional corporal status classification was performed by BMI, according to World Health Organization (WHO). The Castelli Index was calculated as TC/HDL-c ratio. The Atherogenic Index of Plasma was calculated through the formula of log (Triglycerides (mmo/mL)/HDLc (mmol/mL)).
Statistical analysis
Data were analyzed using IBM SPSS Statistics 19.0 (SPSS Inc., Chicago, IL, USA) and GraphPad InStat 7.00 (GraphPad Software, Inc., La Jolla, CA, USA). Results as determined by 95% confidence intervals and a value of P<0.05 were considered to be statistically significant. The general features of the participants are described as number of cases, mean and standard deviations. The prevalence of MetS and Overweight/Obesity are indicated as a percentage. To compare proportions of categorical variables, ie, differences of the percentages of MetS or overweight/obesity between study and reference groups, the two proportion Z-test was used. After checking the normality of the quantitative variables with the Kolmogorov-Smirnoff test (P<0.05), a Student t-test was performed to compare means between groups for continuous variables. Conversely, when the variables did not fit into the criteria of normality they were expressed as median (range) and a Mann–Whitney U-test was carried out. The association between anthropometric and cardio-metabolic variables was first examined using Pearson or Spearman correlation analysis, as appropriate. Likewise, a univariate linear regression analyses was performed with MetS or Overweight/Obesity as the dependent variables, while BMI, WC, WHR and WHtR were considered as the independent factors. Next, multi-variable models were constructed including age as the independent factor in the bivariable analysis. Adjusted odds ratios, along with the corresponding 95% confidence intervals were used to examine the strength of associations between anthropometric variables and MetS or Overweight/Obesity. Receiver Operating Characteristic (ROC) analyses was then used to calculate the area under the ROC curves (AUC-ROC) between each anthropometric variable and MetS or Overweight/Obesity adjusted for age. The best cut-off value was defined from the maximum Youden index on the AUC-ROC. The discriminating power of the anthropometric variables, ie, the ability of the model to differentiate between participants who have MetS or Overweight/Obesity and those who do not, was expressed as AUC and 95% confidence intervals. Furthermore, we grouped patients based on established cut off values for BMI, WC, WHR and WHtR to detect sensitivity and specificity using the ROC curves.
Results
Overall descriptive statistics
The baseline anthropometric, cardio-metabolic and bio-impedance data are shown in Table 1. Subjects with TS were shorter than reference individuals, but mean weight was similar in both groups. Subjects with TS had greater WC, WHR, WHtR, FM and PFM, fasting plasma glucose, triglycerides, LDL-c, Plasma Atherogenic Index, LDL-c/HDL-c ratio, and systolic and diastolic blood pressure than the reference group. By contrast, reference subjects had greater FFM, PFFM, FFM/FM ratio, TBW than the TS subjects. No significant differences in HDL-c levels between TS subjects and reference group were found.
 |
Table 1 Description of the study population |
Prevalence of MetS and overweight/obesity in TS subjects
The prevalence of MetS was 40% (35/88)) and 16% (9/57), respectively, for TS and reference subjects (P<0.05). The prevalence of the single components of Mets in TS subjects and reference groups is displayed in the Figure 1. All five components of MetS were significantly different in both these groups. Table 2 compares the baseline characteristics of TS subjects with (MetS) and without (Non-MetS) metabolic syndrome. TS subjects with MetS were significantly older, had a greater BMI, WC, WHR and WHtR, as well as increased FM and PFM, fasting plasma glucose, triglycerides, LDL-c levels, Atherogenic Index, LDL-c/HDL-c ratio, and systolic and diastolic blood pressure levels when compared to the Non-MetS group. Although the study and reference groups were age- and BMI-matched, Pearson correlation coefficients between BMI and central adiposity variables with MetS were stronger in the TS group with MetS than in the reference subjects. Additionally, several anthropometric, cardio-metabolic and bio-impedance variables tended to increase with age in TS subjects (Table S1). However, we found no correlation between age and WHtR.
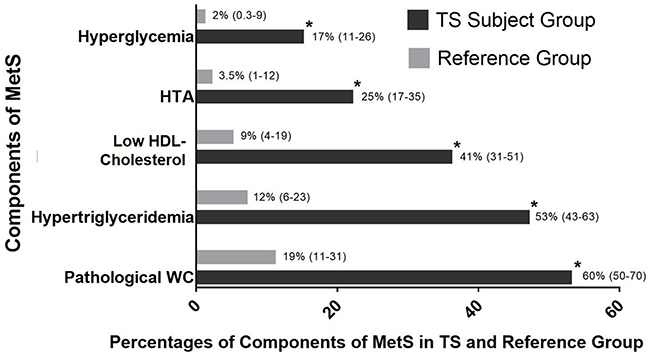 |
Figure 1 Prevalence of the single components of MetS for TS subject and reference groups. Notes: Prevalence expressed in % (95% CI). *Significant difference between both groups (two proportion Z-test). Abbreviations: HTA, Arterial Hypertension; Pathological WC, Waist Circumference ≥80 cm. |
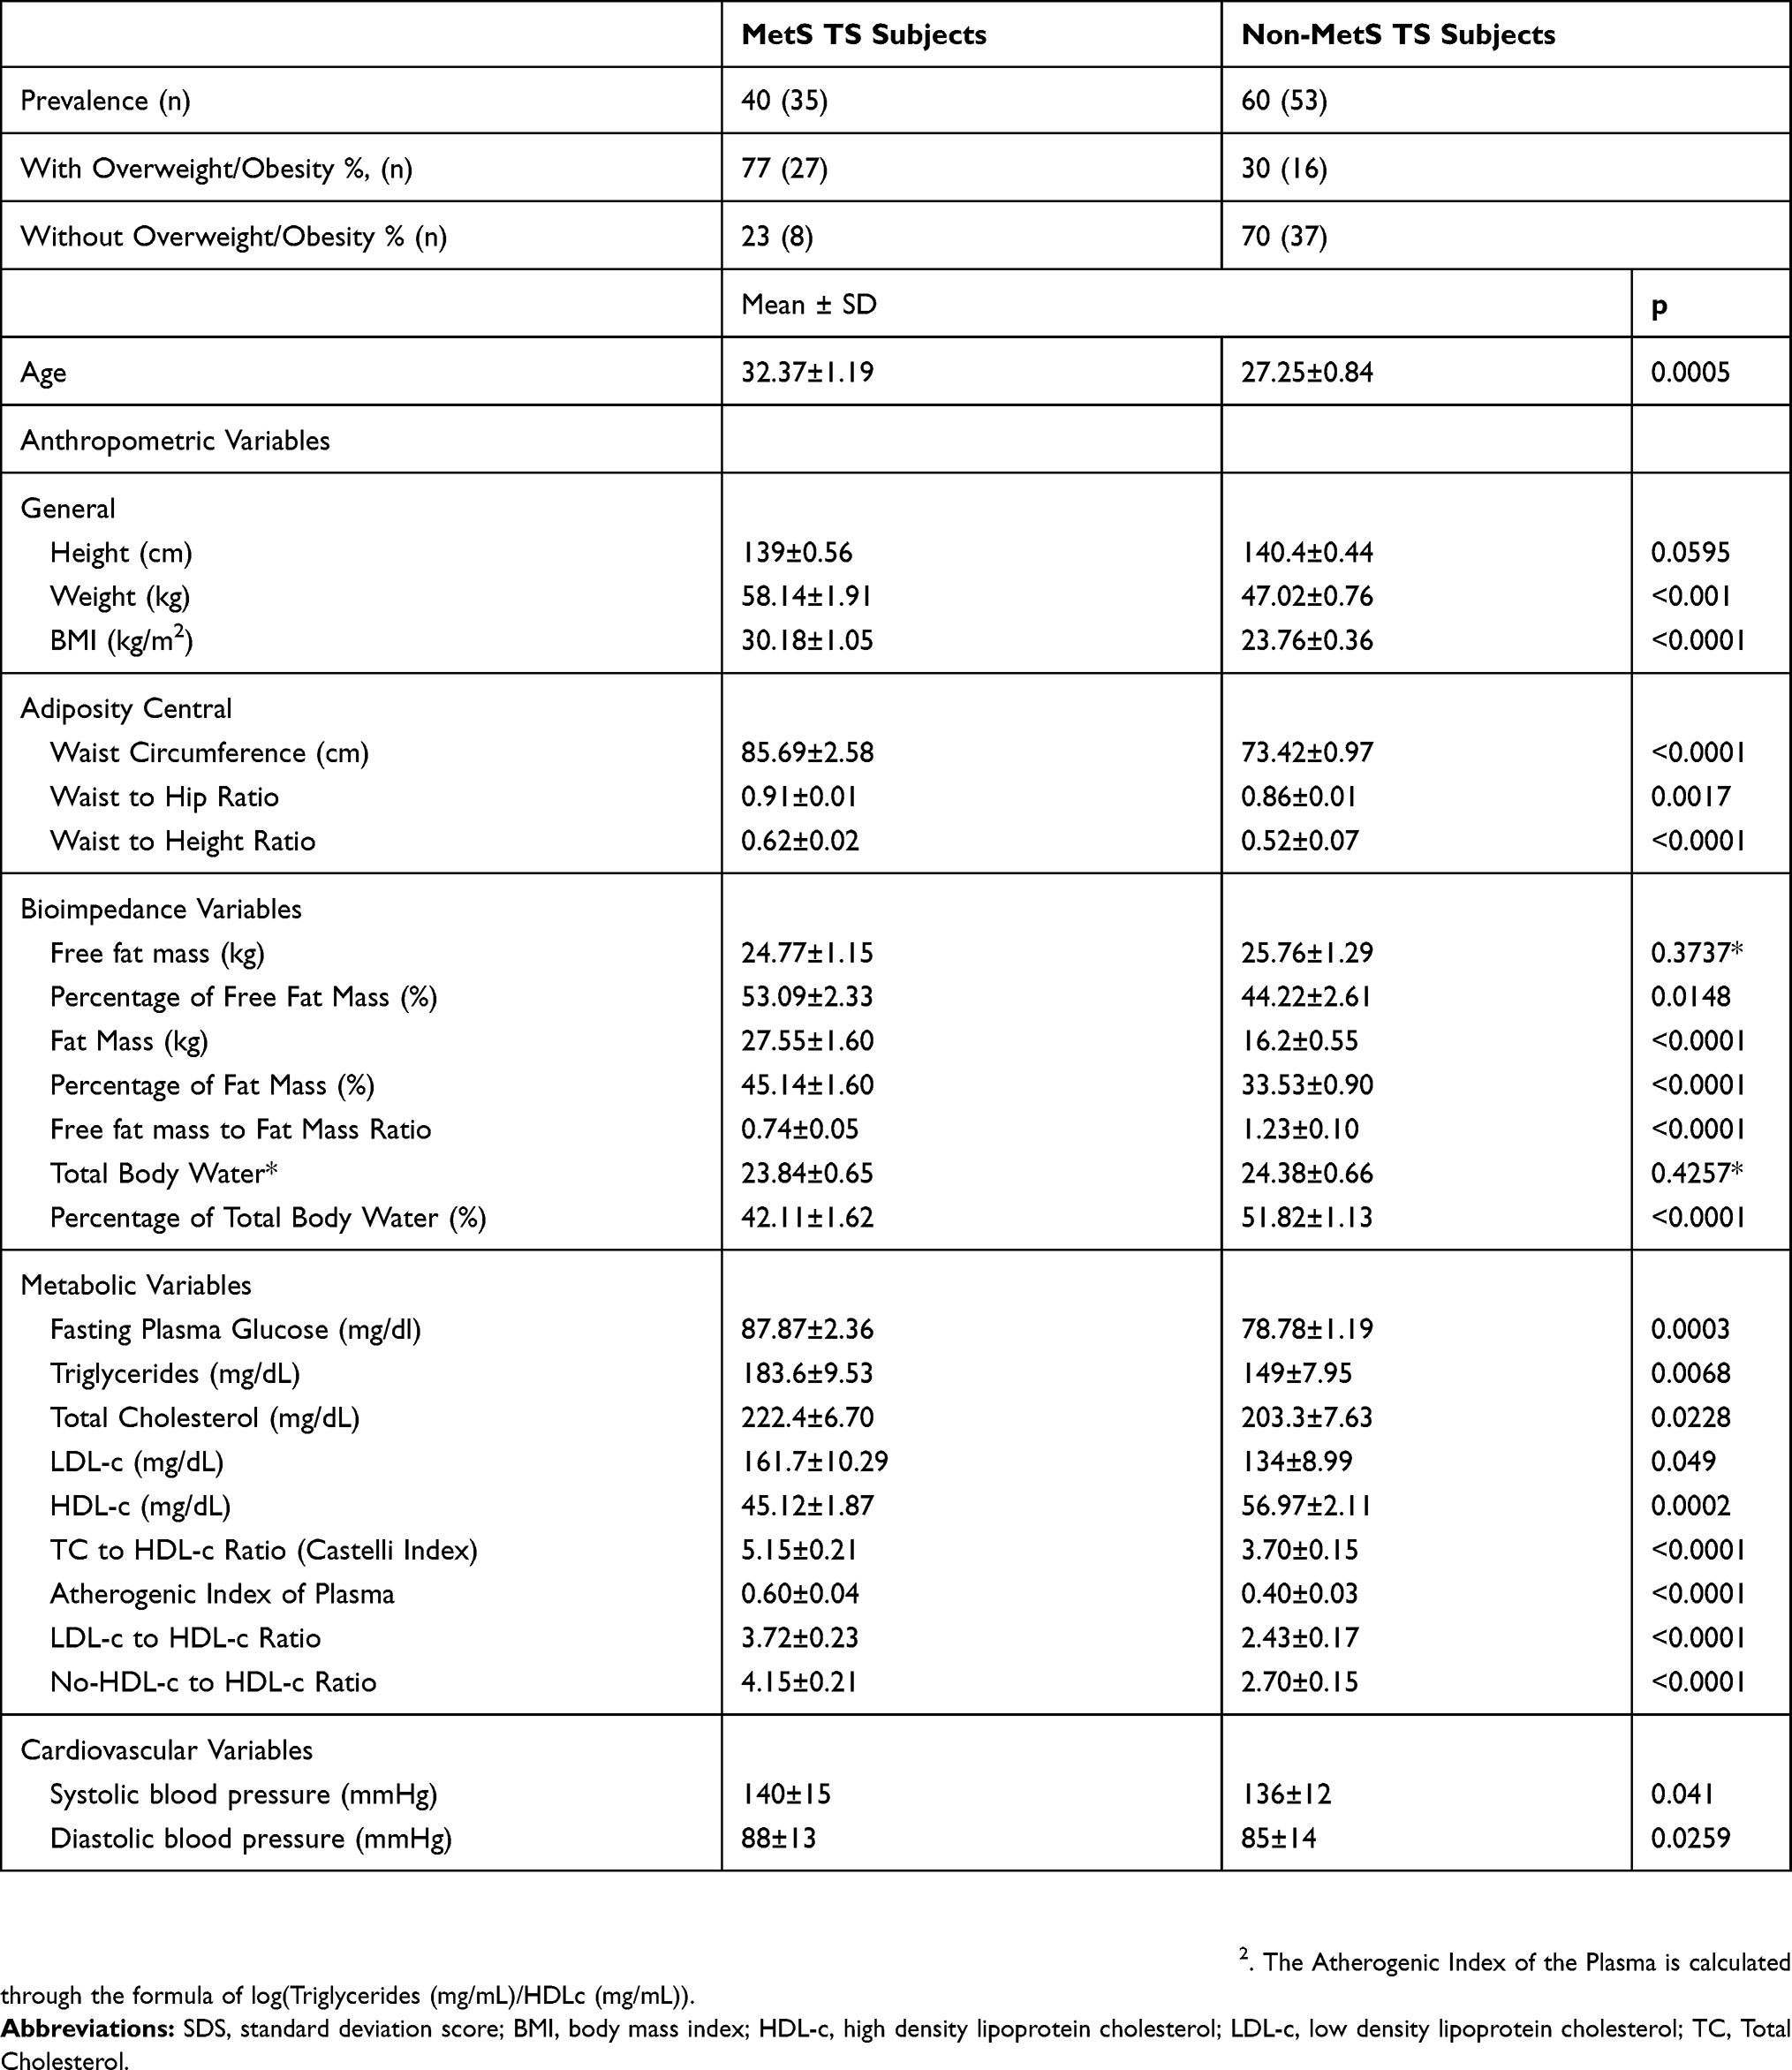 |
Table 2 Comparison between Turner syndrome subjects with and without metabolic syndrome |
Comparison between TS subjects with and without Overweight/Obesity is presented in Table 3. Twenty-six of our TS subjects were considered to be overweight (≥25 kg/m2<30 kg/m2) and 18 were obese (≥30 kg/m2). The prevalence of overweight or obesity was higher in TS (49%, n=43) than in the reference subjects (33.3%) (P<0.05; Table 1). Turner syndrome subjects with overweight/obese displayed significantly higher values for WC, WHR, WHtR, FM, PFM, fasting plasma glucose, triglycerides, Atherogenic Index, LDL-c/HDL-c ratio, Non-HDL-c/HDL-c ratio, systolic and diastolic blood pressure and significantly lower values for the FFM/FM ratio and HDL-c than non-overweight/obese TS individuals. There was no significant difference between these TS groups for FFM, PFFM, TBW, TC and LDL-c (Tables S2 and S3).
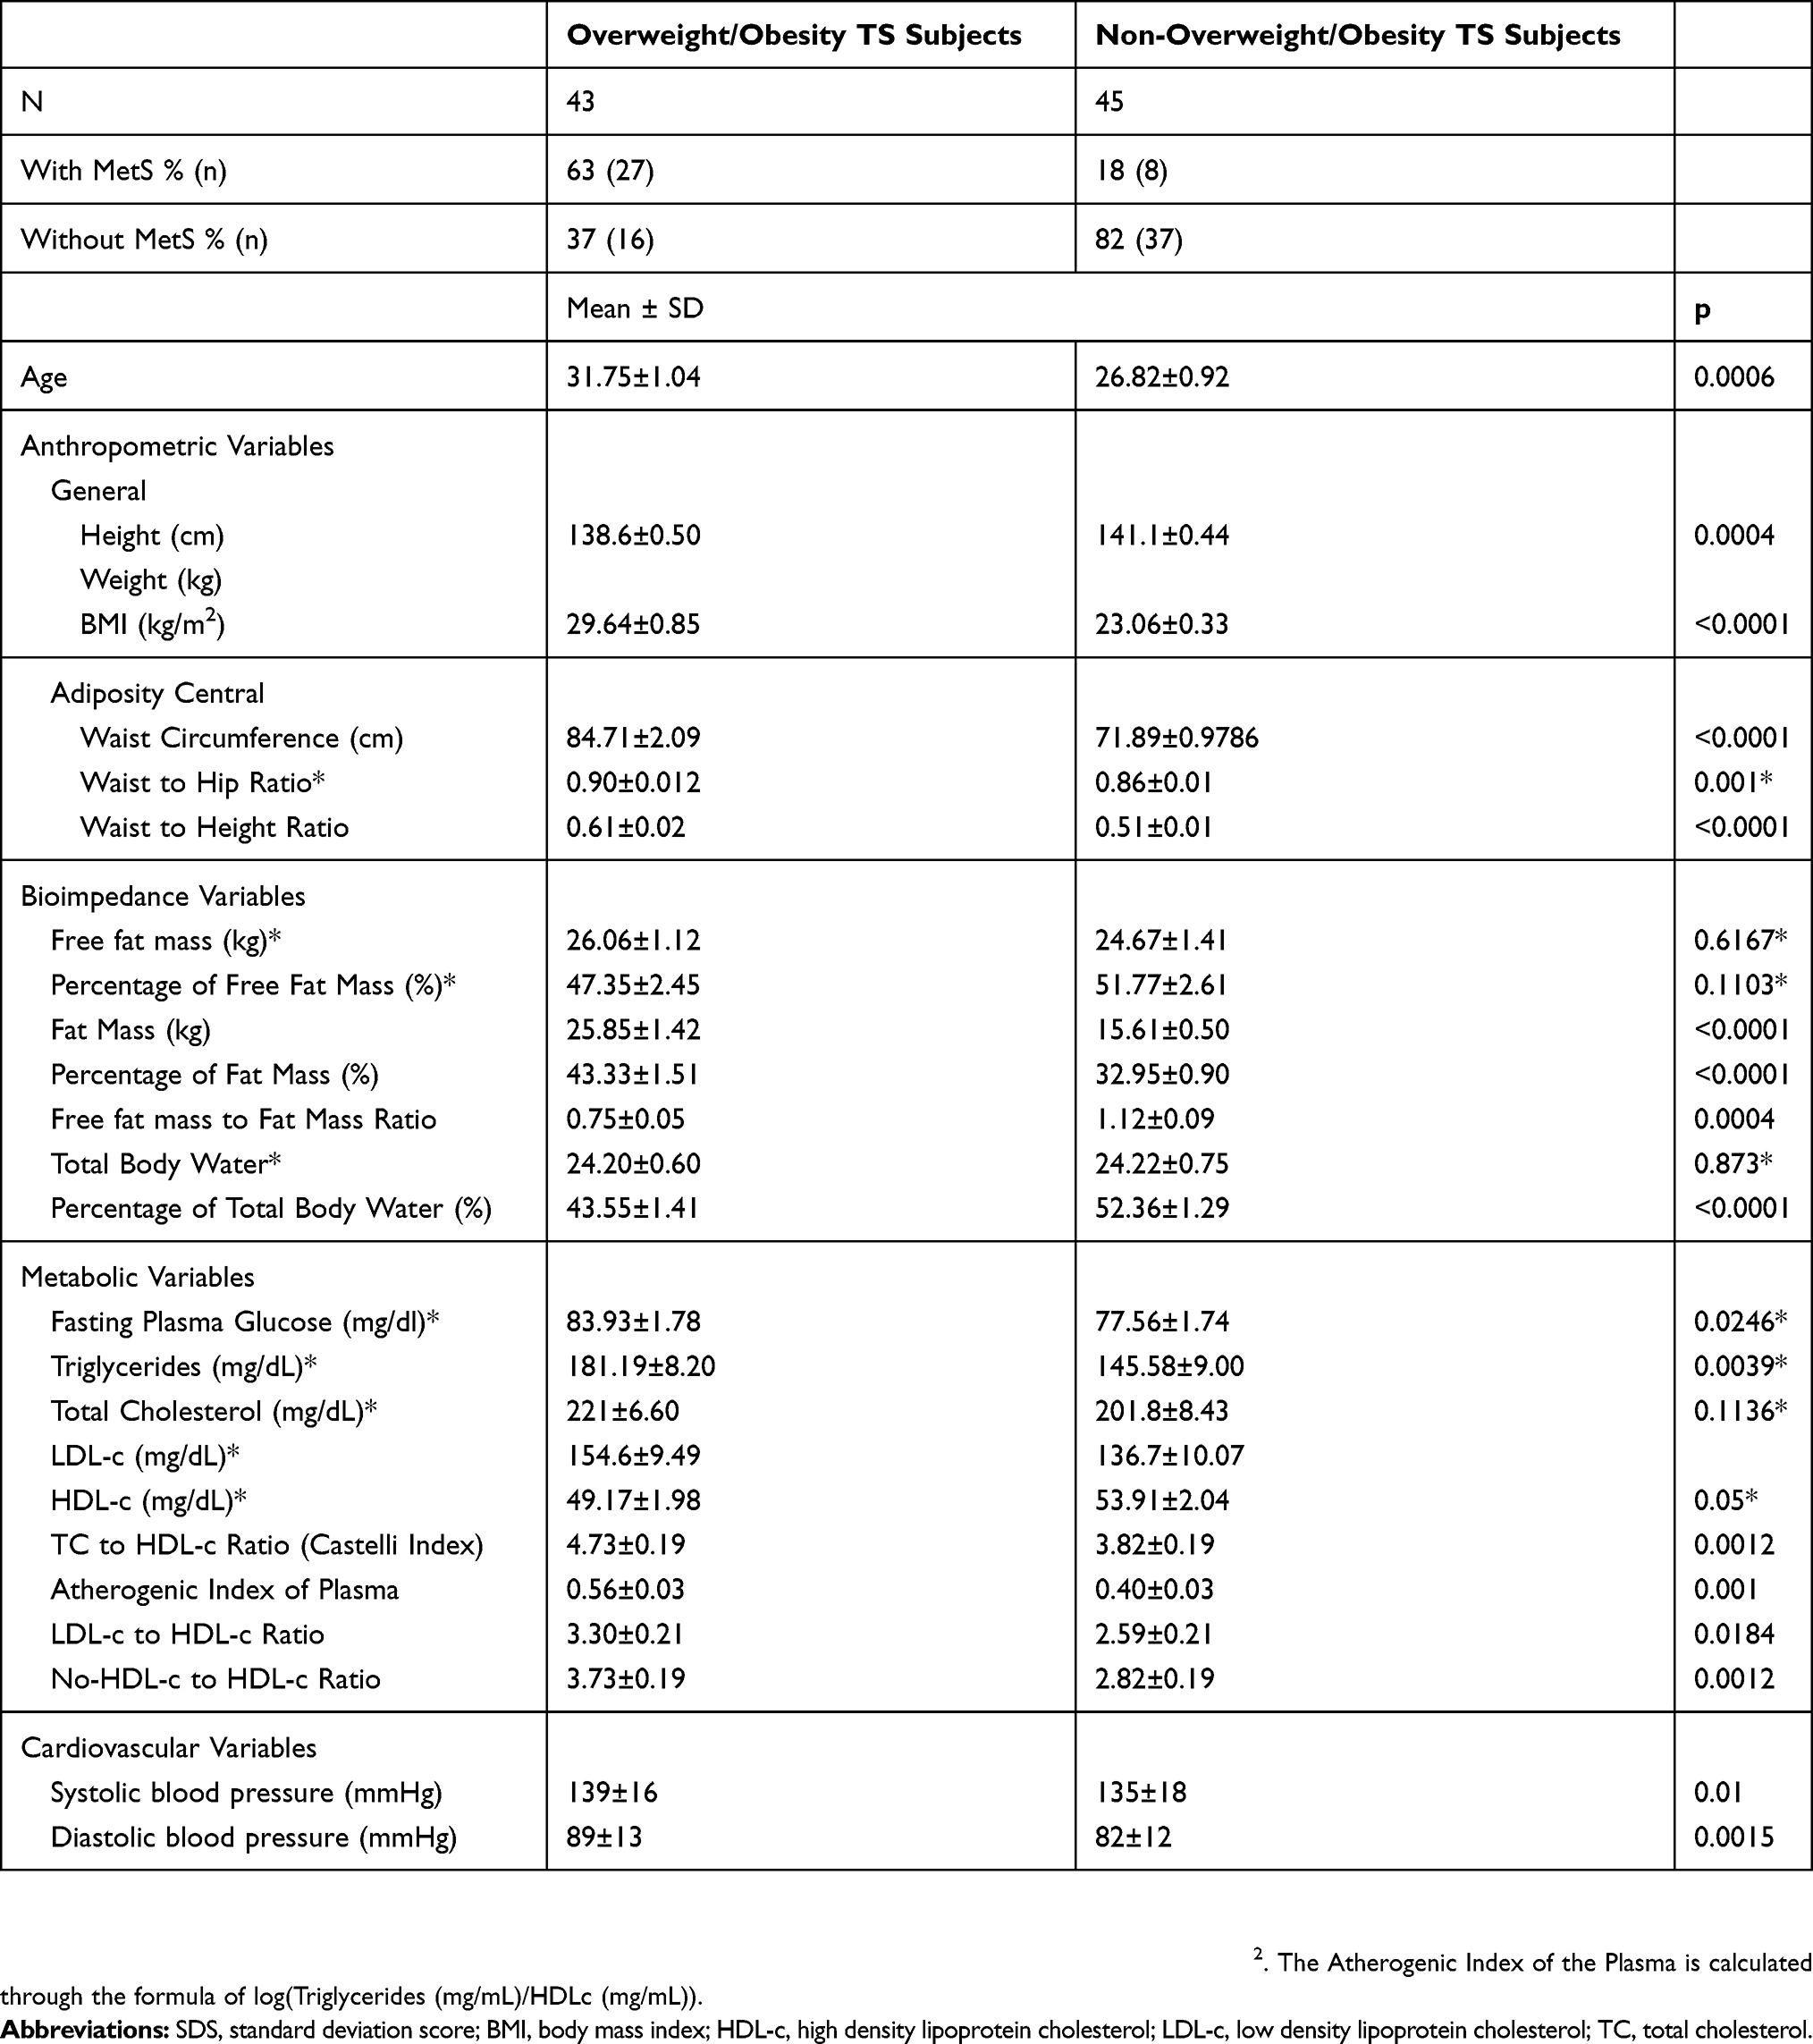 |
Table 3 Comparison between Turner syndrome subjects with and without overweight/obesity |
Correlations between anthropometric and cardio-metabolic variables
Waist circumference and WHtR had the highest correlations with cardio-metabolic variables in TS subjects with MetS. Among cardio-metabolic variables, TC and LDL-c demonstrated the highest correlation with all four anthropometric variables in TS subjects with MetS (Table S4). Among anthropometric variables, WHtR had a higher correlation with three out of the seven cardio-metabolic variables (TC, LDL-c and HDL-c levels), as well as with the LDL-c/HDL-c ratio than did BMI and WC. However, BMI and WC also showed a significant association with four out of the seven cardio-metabolic variables (systolic and diastolic BP, TC, LDL-c) in TS subjects with MetS. Similarly, WHtR and WC were found to better correlate with TC and LDL-c than did BMI in overweight/obese TS group (Table S2). In the crude models of regression analysis, BMI, WC, WHR and WHtR were significantly associated with TC and LDL-c in TS subjects. This continued to be so when these parameters were adjusted for age.
Correlations between bio-impedance and cardio-metabolic variables
The FFM/FM ratio correlated negatively with the Atherogenic Index of Plasma and with the LDL-c/HDL-c ratio (Table S5). In the age-adjusted model for TS subjects with MetS, where FFM/FM ratio was the dependent variable and BMI, WC, WHR and WHtR were the independent variables, WHtR had the highest R2 (=0.66). This model explained 0.816 of the variance for the FF/FM ratio.
Association of various anthropometric and metabolic variables using ROC curve analysis
In order to identify the best cut off value for the detection of MetS and Overweight/Obesity in TS patients, we performed ROC curve analysis and the Youden index analysis for BMI, WC, WHR and WHtR (Table 4). We then compared the AUC to determine their ability to appropriately detect MetS or overweight/obesity in TS subjects (Figures 2 and 3). The best cut-off point for BMI was 27.95 kg/m2, with a sensitivity and specificity for appropriately classifying TS subjects as MetS of 61.1% and 96.2%, respectively. A cut-off value of 83 cm for WC was found to have the highest-balanced sensitivity and specificity in detecting TS subjects with MetS (52.8% and 94.2%, respectively), while a WC of 81.5 cm was determined to be the best cut-off point for detecting overweight/obesity (with a sensitivity of 59.5% and a specificity of 95.7%). A WHtR of 0.54 and 0.52 correctly classified the largest number of TS subjects with MetS or overweight/obese individuals, with a sensitivity and specificity of 62.8% and 97.6%, and 90.5% and 57.0%, respectively.
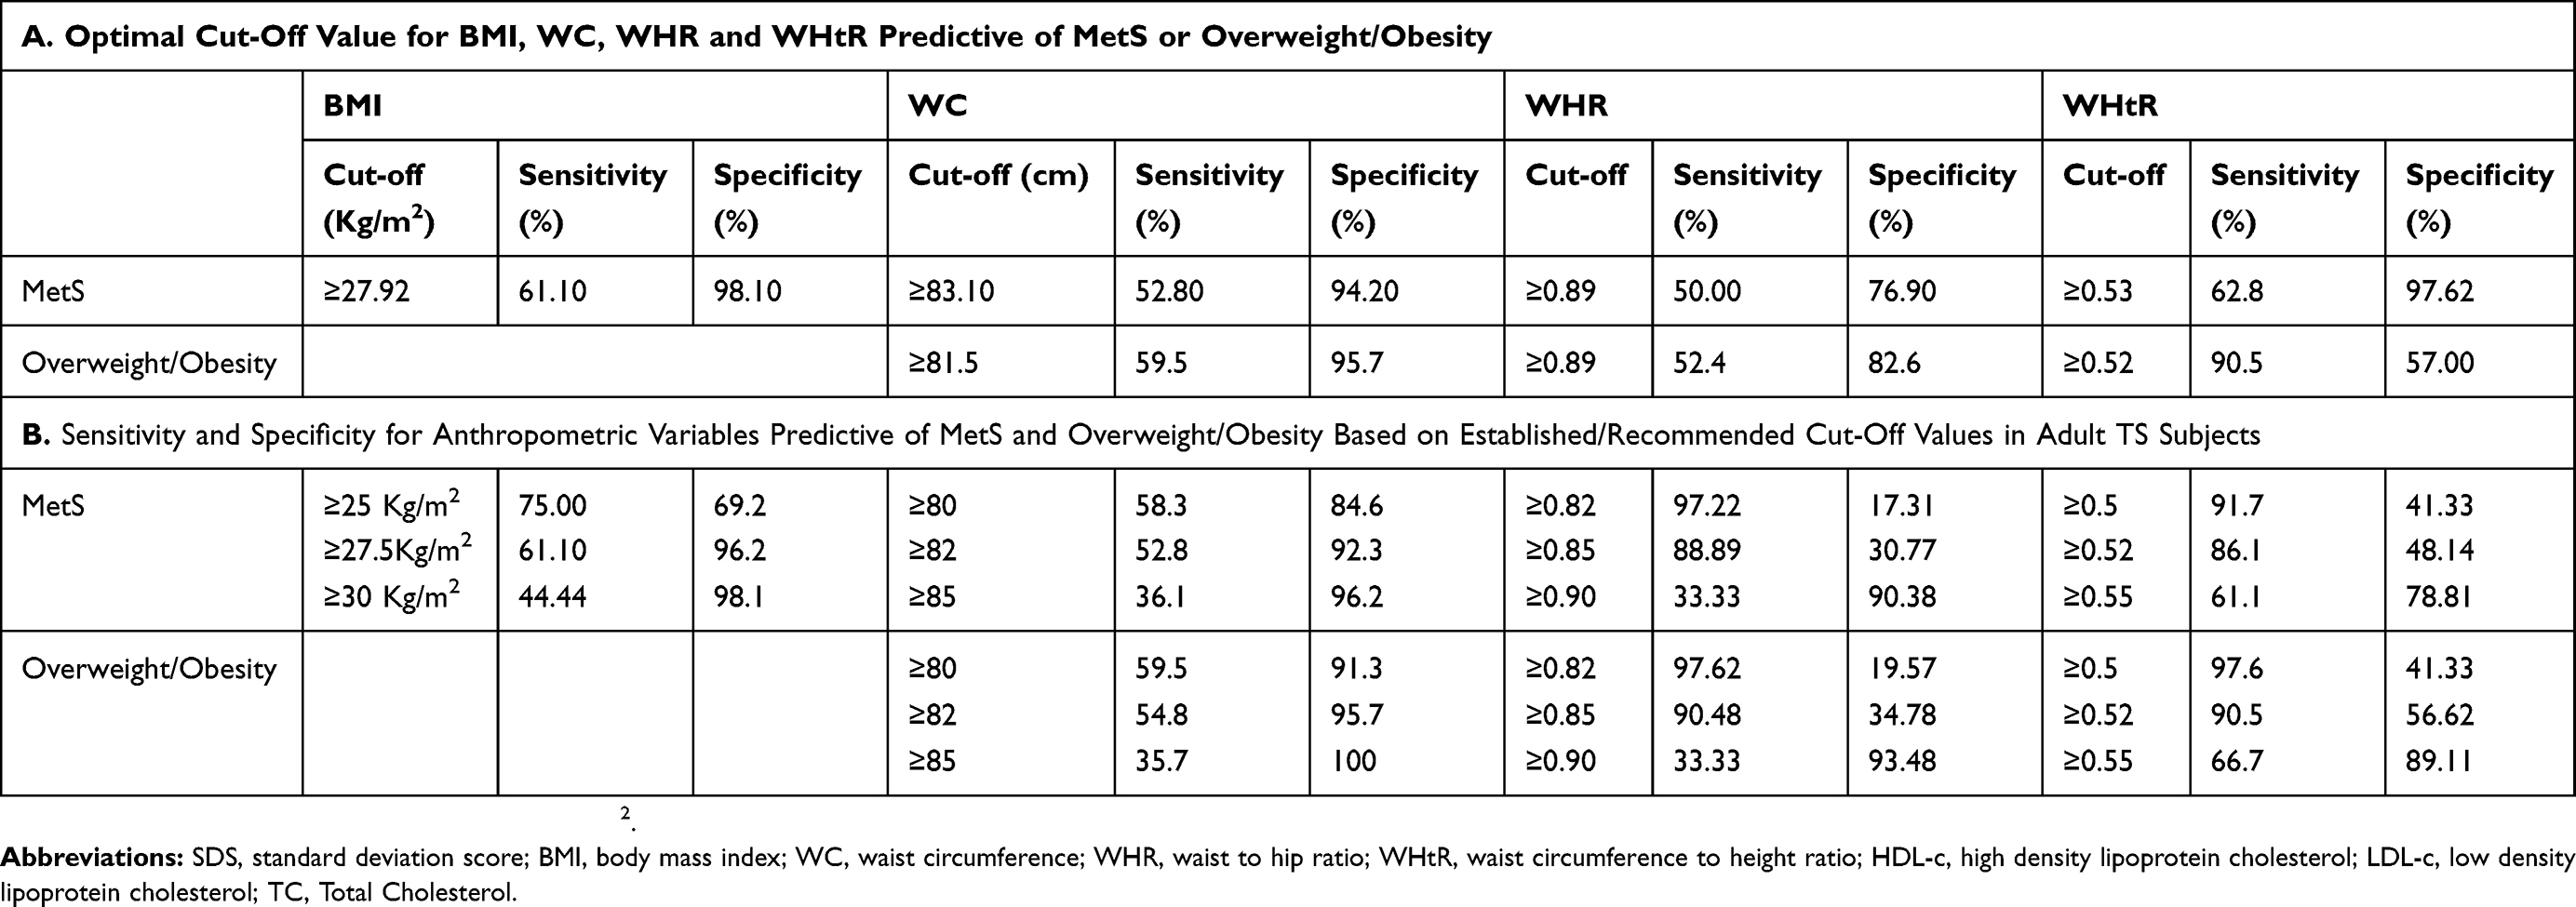 |
Table 4 Sensitivity, specificity and cut-off points for anthropometric variables predictive of MetS and overweight/obesity in adult TS subjects |
 |
Figure 2 Receiver operating characteristic (ROC) curve for prediction of Metabolic Syndrome (MetS) from waist-to-height ratio (WHtR), waist circumference, waist-to-hip ratio (WHR) and body mass index (BMI) in adult Turner syndrome subjects. |
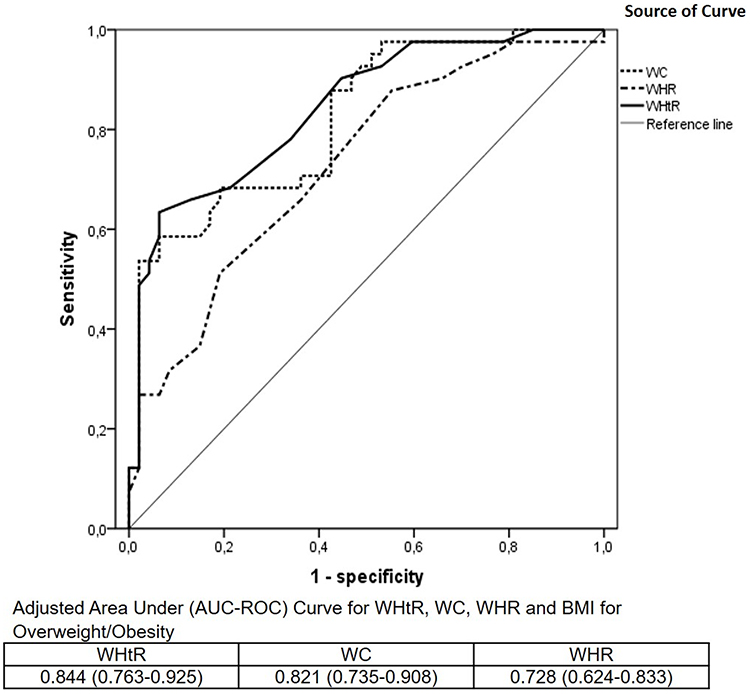 |
Figure 3 Receiver operating characteristic (ROC) curve for prediction of Overweight/Obesity from waist-to-height ratio (WHtR), waist circumference, waist-to-hip ratio (WHR) and body mass index (BMI) in adult Turner syndrome subjects. |
Proportion of TS subjects with the MetS and overweight/obesity identified based on recommended cut off values for BMI, WC and WHtR
The proportion of subjects who would have been identified based on established values for BMI (≥25.0 kg/m2) and WC (≥80 cm), and on the recommended cut-off value for WHtR (≥0.5) allowing for the identification of MetS and Overweight/Obesity in adult TS women are shown in Table 4. A WHtR of ≥0.5 proved to have a higher sensitivity than both BMI and WC distinguishing TS subjects with MetS. The highest specificity in detecting TS subjects with MetS was obtained with a WC cutoff point of ≥80 cm and with a BMI cut off value of ≥30 kg/m2. Therefore, for using a cut-off value of 80 cm for WC and the proposed WHtR of ≥0.5, the number of TS subjects correctly classified as MetS increased.
A WHtR (≥0.5) demonstrated better sensitivity than WC (≥80 cm), while WC had better specificity than WHtR (Table 4) in the scenario of overweight/obesity. The majority (81.8%) of TS individuals with a cut-off value for WHtR of ≥0.5 were overweight or obese. In addition, ROC curve analysis showed that WHtR had a higher discriminating power in the detection of overweight/obesity than WC in TS (Figure 3). The proportion of subjects who would have been identified with a WHtR of ≥0.5 was consistently higher than that for a WC of ≥80 cm, for all cardio-metabolic variables. In addition, WHtR had the largest AUC for MetS in individuals with TS. However, the differences in the AUC for the various anthropometric variables were often small, with overlapping 95% confidence intervals (Figures 2 and 3).
Twenty-six out of 88 subjects with TS were classified differently in terms of overweight/obesity when discriminated either by BMI or by WHtR. Of the 35 subjects with TS with MetS, 6 had a normal BMI but with a WHtR ≥0.5. In addition, of the 43 TS subjects with overweight/obesity (≥25<30 kg/m2), 19 had a WC <80 cm, while all but one had a WHtR>0.5.
Discussion
Cardiometabolic risk factors in Turner syndrome
We analyzed several anthropometric, bio-impedance and cardio-metabolic variables in TS subjects. While these parameters have been previously assessed in other studies, the currrent analysis was performed in a well-defined population of TS women (≥20 years old) and the results were compared to that of a sex-, age- and BMI-matched reference group. In concordance with previous studies,3,4,22,23 our TS subjects not only presented with altered anthropometry, but also with altered body composition.
In the present study, the height of TS subjects was on average 10 cm shorter than that of the reference group and 20 cm shorter that the values of an ethnic-specific female population.24 Consequently, they had an increased weight when compared to age- and BMI-matched reference subjects, resulting in an unfavorable body composition, with increased overall (BMI) and central (WC, WHR and WHtR) adiposity anthropometric variables. However, we do not believe that the shorter average height of the study group explains the unfavorable body composition of our TS subjects, as bio-impedance analysis demonstrated that TS subjects had a higher FM and PFM and a lower FFM, PFFM, TBW, PTBW and FFM/FM ratio. In addition, we found significant correlations between central adiposity anthropometric variables (WC and WHtR) and PFM and FM and we detected a higher prevalence of MetS in our study group than in the reference group.
Our findings demonstrate that lipid metabolism is altered in TS subjects, with approximately 60% (51/88) displaying hypercholesterolemia (≥5,2 mmol/L; ≥200 mg/dL). Similarly, triglycerides and LDL-c levels were elevated in TS individuals, with a positive correlation between triglycerides, TC, LDL-c, TC/HDL-c ratio, AIP, LDL-c/HDL-c ratio, non-HDL-c/HDL-c ratio and age being detected. Our data, therefore, suggests that dyslipidemia is prevalent in TS women and that these changes may be dynamic with age. Similar findings have been reported in the literature in TS cohorts of different ethnic backgrounds.25–28 Thus, it has been suggested that hypercholesterolemia occurs in 50% of TS subjects over the age of 21 years,25 which is twice as much as that detected in the general population.18
Prevalence of MetS and overweight/obesity in TS subjects
The prevalence of MetS in our TS cohort was 39.7% including 30.6% with Overweight/Obesity and 9.1% with non-Overweight/Obesity. This prevalence was high in our study, even considering that MetS is quite prevalent in adult individuals without TS of the same geographic region utilizing the IDF criteria.29 A much lower prevalence of MetS (4.7%) was reported in a cohort of 85 Caucasian subjects with TS aged 8.1–46.6 years, using the IDF definition.15 The marked difference in the prevalence of MetS between our patients with TS and those studied by Calcaterra et al15 and also by Landin-Wilhelmsen et al,30 may be partially explained by the different age range, ethnic background and the health care received by the individuals studied. Also, it has been reported that ancestral genetic components (the proportion of Amerindian, European and African backgrounds) in admixed Latin-American populations, tend to influence an individual susceptibility to cardio-metabolic disorders.31 Conditions leading to cardio-metabolic disorders, such as obesity, T2DM, hypertension and dyslipidemia, have a different prevalence in European, African and Amerindian populations (http://www.who.int/nmh/publications/ncd-status-report-2014/en accessed February 5, 2019). Thus, the Amerindian ancestral component might act as a risk factor for impaired glucose metabolism, a European ancestry may condition dyslipidemia and an African ancestral component would confer a higher risk for elevated blood pressure in Latin-American TS cohorts. Lastly, the studies by Calcaterra et al and Landin-Wilhelmsen et al15,30 included patients with TS undergoing regular medical follow-up at an endocrine unit of a first world country. Most of our Ecuadorian patients did not receive any regular medical evaluation and, while most Venezuelan patients did undergo systematic evaluation at the university genetic clinic, the socio-economic crisis affecting the country severely limited their regular access to laboratory testing necessary for the diagnosis and subsequent treatment of metabolic diseases.
WHtR, WC and BMI as indicators of cardiometabolic risk
Using the established or recommended cut-off values for BMI, WC and WHR to define Overweight/Obesity, almost half of our TS patients fell into this category. Moreover, TS subjects with a BMI of ≥25 kg/m2 had an increased odds ratio of co-occurrence of MetS when compared to Non-MetS TS subjects with a BMI of <25 kg/m2 (odds ratio =7.15 [95% CI 2.69 to 18.99]). This contrasts with the findings by Calcaterra and colleagues, who reported that the frequency of MetS in their study did not differ between Overweight/Obese and non-Overweight/Obese TS individuals.15
There are many studies in the literature evaluating the predictive power of adiposity anthropometric variables for the detection of cardio-metabolic risk, T2DM and dyslipidemia in the general population. To the best of our knowledge, this is the first study to assess the utility of these variables in predicting the risk for MetS and Overweight/Obesity in adult patients with TS. While several studies have demonstrated the importance of diagnosing and treating MetS in TS subjects,2,13,28,32 the stratification of these patients for cardiovascular risk is currently based on biochemical alterations. Simple anthropometric variables may help clinicians distinguish high-risk TS individuals that should be subject to additional follow up and possibly medical intervention.
We should also consider the difficulty arising from defining MetS and Overweight/Obesity based on WC and BMI, respectively, in TS individuals. An inconsistency in the classification of obesity in TS girls defined by BMI and by the Weight-for-Height charts has been reported.6 In our study more than 30% of TS subjects were classified differently using a cut-off value of 0.53 for WHtR, instead of the established cut-off value for BMI (≥25 kg/m2) for the classification of Overweight/Obesity. In addition, individuals with TS who had been classified as normal according to their BMI, but who had a WHtR of >0.53, presented with a cardiometabolic risk approaching that of subjects with Overweight/obesity (≥25<30 kg/m2). Similarly, more patients were identified as MetS using a cut-off point of 0.53 for WHtR, than utilizing a cut-off point of 80 cm for WC in our study. The cardio-metabolic risk of subjects with TS might therefore be larger than what was previously believed using the BMI-WHO criteria.
BMI cannot discriminate between excess adipose tissue and muscle mass, as it is not an indicator of the anatomical distribution of adipose tissue. On the other hand, WHtR might serve as an accurate anthropometric variable of cardiometabolic risk, as it is a reliable indicator of central adiposity. Most TS subjects present with short stature and abnormal corporal proportions, so that both WC and BMI could miscalculate the prevalence of MetS and Overweight/Obesity in this population. In our study, height was inversely associated with TC and LDL-c levels, which suggests that WC needs to be adjusted for height in TS subjects. This same finding has been reported in normal middle-aged men in a coronary risk factor study in Sweden.33 Therefore, WHtR may be a more predictive anthropometric variable than classic body measures such as WC and BMI. In our study, WHtR consistently correlated the highest with the various bio-impedance (FM and PFM) and biochemical variables (TC, LDL-c and HDL-c levels and with the LDL-c/HDL-c ratio). WHtR was found to be the best indicator for estimating MetS and Overweight/Obesity, as it consistently had higher AUC values than BMI, WC and WHR in our TS cohort. Additionally, WHtR, had an independent association with MetS and with Overweight/Obesity risk, even after adjusting for BMI. However, the 95% confidence intervals of these AUCs and ORs tended to overlap for all anthropometric variables, as described by other authors in patients with different clinical backgrounds34,35 and it is difficult to evaluate the independence of WHtR in regard to BMI and WC, as these variables are highly collinear.
We would, therefore, suggest that in the estimation of cardio-metabolic risk in TS subjects due to Overweight/Obesity, WHtR should be added to BMI or to WC as adiposity indexes. A meta-analysis of 31 studies, which did not include TS individuals, evaluating the predictive power of adiposity anthropometric variables in adult individuals of both sexes and of different ethnic groups based on ROC curve analysis, concluded that WHtR was more effective in assessing cardiometabolic risk, than either BMI and WC.34 However, the optimal cut-off point for WHtR remains uncertain. In the present study, we found 0.54 to be the ideal cut-off value for TS subjects. In a study in hospital workers in Mexico, the optimal cut-off value for WHtR was found to be 0.53 for women.36 Other studies separately conducted in Ecuador and Venezuela,37,38 as well as a review assessing findings across fourteen countries,39 recommended a cut-off point of 0.50 for WHtR. This central adiposity variable is a simple, easily calculated and validated index, which is not affected by age or ethnicity and therefore does not require conversion to SDS or percentiles in order to discriminate among TS cohorts of different ages or ethnic backgrounds.
It has been suggested that the haploinsufficiency of genes localized on the p-arm of the X-chromosome may be influential in the etiopathogenesis of metabolic disorders in TS. Various authors have reported that monosomy 45,X and 45X/46Xi(Xq) are strongly associated with metabolic risk factors.28,41,42 However, our study did not reveal a significant association between anthropometric or cardio-metabolic variables and complete deletion of the p-arm of the X-chromosome, which is consistent with other studies.13,42 The relatively small number of cases in some studies may explain these discrepancies and further studies in larger, more statistically significant numbers of cases are warranted.
Limitations of this study
The present study has a number of limitations. Its cross-sectional design prevents us from determining a cause-effect relationship between anthropometric variables and cardiovascular risk. While the sample size was believed to be adequate for analysis as a whole, the number of Ecuadorian and Venezuelan subjects prevented analyses stratified by groups. For assessment of excess adipose tissue, cross-sectional data are sufficient, but larger prospective studies are needed to demonstrate the cause-effect relationship between anthropometric variables and cardiovascular risk in TS subjects. Additionally, we cannot determine the magnitude of any error introduced by using bio-impedance analysis. Our results demonstrate that bioimpedance variables offer no further benefit over classic central adiposity anthropometric variables to diagnosis MetS. Therefore, prospective studies incorporating dual energy X-ray absorptiometry (DXA) would be better for the evaluation of body composition and its relationship with MetS. Other variables known to influence the development of MetS and Overweight/Obesity such as dietary habits, smoking, physical activity and family history were not included in this study when adjusting for the multiple regression analysis. Subjects of our reference group were students and employees of a university and may therefore not be entirely representative of the adult Latin-American female. However, the reported prevalence of MetS and Overweight/Obesity in the general population from Ecuador and Venezuela are broadly comparable to ours. Another limitation of our study may be related to the variation in the anatomical measurement of WC in dressed subjects. We measured WC at the mid-point between the lowest rib and the iliac crest in subjects dressed in light clothing, which has been established to be highly reproducible and to correlate with total body and abdominal adiposity.22
Conclusion
In conclusion, this is the first comprehensive study to compare anthropometric variables as predictors of cardiovascular disease risk in adult subjects with TS. We propose that WHtR be used as an additional or alternative clinical screening tool for the detection of cardio-metabolic risk in this condition. A combination of WHtR with BMI or with WC may be clinically most useful in identifying adult TS subjects with overweight/obesity and MetS, respectively.
Ethics statement
The study protocol was reviewed and approved by the Ethics Committees for Research in Human Subjects of the two participating institutions. The ethical principles of the 1964 Declaration of Helsinki for medical research were adhered to throughout this research. The procedures and possible discomfort/risks were fully explained to all participating subjects before beginning the study. Each then voluntarily decided to take part in the study and approved their participation and signed an informed written consent form in front a witness. Subjects were provided with the option to withdraw their participation in the study at any time without consequence.
Acknowledgments
We are extremely grateful to all of the women with Turner syndrome who took part in this study. We acknowledge the contribution of the Ecuadorian Foundation in Support of Turner Syndrome. The authors would like to thank the Consejo de Desarrollo Científico, Humanístico y Tecnológico (CONDES) from University of Zulia, Maracaibo, Venezuela, who provided assistance with the program. This study was supported by the Academie de Recherche et D’Enseignement Superieur of Belgique (grant number 2016-157E); and the Training Research Commission, General Directorate of Research and Postgraduate,Central University of Ecuador (grant number cif3-cv-fcb-2).
Disclosure
The authors declare that they have nothing to disclose and there is no conflict of interest that could be perceived as prejudicing the impartiality of the research reported.
References
1. Álvarez-Nava F, Soto M, Sánchez MA, Fernández E, Lanes R. Molecular analysis in Turner syndrome. J Pediatr. 2003;142:336–340. doi:10.1067/mpd.2003.95
2. Gravholt CH, Andersen NH, Conway GS, et al. Clinical practice guidelines for the care of girls and women with Turner syndrome: proceedings from the 2016 cincinnati international turner syndrome meeting. Eur J Endocrinol. 2017;177:G1–G70. doi:10.1530/EJE-17-0430
3. Baldin AD, Armani MC, Morcillo AM, et al. Body proportions in a group of Brazilian patients with Turner syndrome. Arq Bras Endocrinol Metabol. 2005;49:529–535. doi:10.1590/S0004-27302005000400010
4. Gravholt CH, Hjerrild BE, Mosekilde L, et al. Body composition is distinctly altered in Turner syndrome: relations to glucose metabolism, circulating adipokines, and endothelial adhesion molecules. Eur J Endocrinol. 2006;155:583–592. doi:10.1530/eje.1.02267
5. Holl RW, Kunze D, Etzrodt H, et al. Turner syndrome: final height, glucose tolerance, bone density and psychosocial status in 25 adult patients. Eur J Pediatr. 1994;153:11. doi:10.1007/BF02000780
6. Isojima T, Yokoya S, Ito J, Horikawa R, Tanaka T. Inconsistent determination of overweight by two anthropometric indices in girls with Turner syndrome. Acta Paediatr. 2009;98:513–518. doi:10.1111/j.1651-2227.2008.01132.x
7. Mortensen KH, Andersen NH, Gravholt CH. Cardiovascular phenotype in Turner syndrome-integrating cardiology, genetics, and endocrinology. Endocr Rev. 2012;33:677–714. doi:10.1210/er.2011-1059
8. Álvarez-Nava F, Lanes R, Quintero JM, et al. Effect of the parental origin of the X-chromosome on the clinical features, associated complications, the two-year-response to growth hormone (rhGH) and the biochemical profile in patients with Turner syndrome. Int J Pediatr Endocrinol. 2013;2013:10. doi:10.1186/1687-9856-2013-10
9. Pirgon Ö, Atabek ME, Oran B, Güçlü R. Atherogenic Lipid Profile and Systolic Blood Pressure are Associated with Carotid Artery Intima-media Thickness in Children with Turner Syndrome. J Clin Res Pediatr Endocrinol. 2008;1:62–71. doi:10.4008/jcrpe.v1i2.9
10. Schoemaker MJ, Swerdlow AJ, Higgins CD, Wright AF, Jacobs PA. Mortality in women with Turner syndrome in great Britain: A National Cohort Study. J Clin Endocrinol Metabol. 2008;93:4735–4742. doi:10.1210/jc.2008-1049
11. Stochholm K, Juul S, Juel K, Naeraa RW, Højbjerg Gravholt C. Prevalence, incidence, diagnostic delay, and mortality in Turner syndrome. J Clin Endocrinol Metabol. 2006;91:3897–3902. doi:10.1210/jc.2006-0558
12. Mavinkurve M, O’Gorman CS. Cardiometabolic and vascular risks in young and adolescent girls with Turner syndrome. BBA Clin. 2015;3:304–309. doi:10.1016/j.bbacli.2015.04.005
13. Lebenthal Y, Levy S, Sofrin-Drucker E, et al. The natural history of metabolic comorbidities in turner syndrome from childhood to early adulthood: comparison between 45,X monosomy and other karyotypes. Front Endocrinol (Lausanne). 2018;9:27. doi:10.3389/fendo.2018.00027
14. O’Gorman CS, Syme C, Lang J, Bradley TJ, Wells GD, Hamilton JK. An evaluation of early cardiometabolic risk factors in children and adolescents with Turner syndrome. Clin Endocrinol (Oxford). 2013;78:907–913. doi:10.1111/cen.12079
15. Calcaterra V, Brambilla P, Maffè GC, et al. Metabolic syndrome in Turner syndrome and relation between body composition and clinical, genetic, and ultrasonographic characteristics. Metab Syndr Relat Disord. 2014;12:159–164. doi:10.1089/met.2013.0075
16. Grundy SM, Brewer HB
17. Márquez-Sandoval F, Macedo-Ojeda G, Viramontes-Hörner D, et al. The prevalence of metabolic syndrome in Latin America: a systematic review. Public Health Nutr. 2011;14:1702–1713. doi:10.1017/S1368980010003320
18. Elsheikh M, Dunger DB, Conway GS, Wass JAH. Turner’s syndrome in adulthood. Endocr Rev. 2002;23:120–140. doi:10.1210/edrv.23.1.0457
19. Ogle GD, Allen JR, Humphries IR, et al. Body composition assessment by dual energy X-ray absorptiometry in subjects aged 4 ± 26 y. Am J Clin Nutr. 1995;61:746–753. doi:10.1093/ajcn/61.4.746
20. Heyward V. ASEP methods recommendation: body composition assessment. J Exerc Physiol. 2001;4:1–12.
21. Alberti KGMMG, Zimmet P, Shaw J. Metabolic syndrome - a new world-wide definition. A consensus statement from the international diabetes federation. Diabet Med. 2006;23:469–480. doi:10.1111/j.1464-5491.2006.01858.x
22. Park E. Body shape in Turner’s syndrome. Hum Biol. 1977;49:215–223.
23. Varrela J, Vinkka H, Alvesalo L. The phenotype of 45,X females: an anthropometric quantification. Ann Hum Biol. 1984;11:53–66.
24. López-Blanco M, Macías-Tomei C, Izaguirre-Espinoza I, et al. Evaluation of the maturation. In editors, López-Blanco M, Landaeta-Jiménez M. Growth and Development Manual.
25. Ostberg JE, Thomas EL, Hamilton G, et al. Excess visceral and hepatic adipose tissue in Turner syndrome determined by magnetic resonance imaging: Estrogen deficiency associated with hepatic adipose content. J Clin Endocrinol Metabol. 2005;90:2631–2635. doi:10.1210/jc.2004-1939
26. de Armani MC, Baldin AD, Lemos-Marini SH, Baptista MT, Maciel-Guerra AT, Guerra-Junior G. Evaluation of insulin resistance and lipid profile in Turner syndrome. Arq Bras Endocrinol Metabol. 2005;49:278–285. doi:/S0004-27302005000200015.
27. Garden S, Diver MJ, Fraser WD. Undiagnosed morbidity in adult women with Turner’s syndrome. Clin Endocrinol (Oxford). 1996;45:589–593. doi:10.1046/j.1365-2265.1996.00849.x
28. Van PL, Bakalov VK, Bondy CA. Monosomy for the X-chromosome is associated with an atherogenic lipid profile. J Clin Endocrinol Metabol. 2006;91:2867–2870. doi:10.1210/jc.2006-0503
29. Florez H, Silva E, Fernández V, et al. Prevalence and risk factors associated with the metabolic syndrome and dyslipidemia in White, Black Amerindian and Mixed Hispanics in Zulia State, Venezuela. Diabetes Res Clini Pract. 2005;69:63–77. doi:10.1016/j.diabres.2004.11.018
30. Landin-Wilhelmsen K, Bryman I, Cardiac Malformations WL, Hypertension B. Not metabolic risk factors, are common in turner syndrome. J Clin Endocrinol Metabol. 2001;86:4166–4170. doi:10.1210/jcem.86.9.7818
31. Muñoz AM, Velásquez CM, Bedoya G. Cardio-metabolic parameters are associated with genetic admixture estimates in a pediatric population from Colombia. BMC Genet. 2016;17:93. doi:10.1186/s12863-016-0402-5
32. Henriksson KM, Lindblad U, Ågren B, Nilsson-Ehle P, Råstam L. Associations between body height, body composition and cholesterol levels in middle aged men. The coronary risk factor study in southern Sweden (CRISS). Eur J Epidemiol. 2001;17:521–526.
33. Nyamdorj R, Qiao Q, Söderberg S, et al. Comparison of body mass index with waist circumference, waist-to-hip ratio, and waist-to-stature ratio as a predictor of hypertension incidence in Mauritius. J Hypertens. 2008;26:866–870. doi:10.1097/HJH.0b013e3282f624b7
34. Vazquez G, Duval S, Jacobs DR
35. Ashwell S, Gibson M. Waist to height ratio is a simple and effective obesity screening tool for cardiovascular risk factors: analysis of data from the British National Diet and Nutrition Survey of adults aged 19–64 years. Obes Facts. 2009;2:97–103. doi:10.1159/000203363
36. Berber A, Gómez-Santos R, Fanghänel G, Sánchez-Reyes L. Anthropometric indexes in the prediction of type 2 diabetes mellitus, hypertension and dyslipidaemia in a Mexican population. Int J Obes Relat Metabol Disord. 2001;25:1794–1799. doi:10.1038/sj.ijo.0801827
37. Aguirre PF, Coca A, Aguirre MF, et al. Waist-to-height ratio and sedentary lifestyle as predictors of metabolic syndrome in children in Ecuador. Hipertens Riesgo Vasc. 2017:
38. Bermúdez V, Salazar J, Rojas J, et al. Diabetes and impaired fasting glucose prediction using anthropometric indices in adults from Maracaibo City, Venezuela. J Community Health. 2016;41:1223–1233. doi:10.1007/s10900-016-0209-3
39. Wang J. Waist circumference: a simple, inexpensive, and reliable tool that should be included as part of physical examinations in the doctor’s office. Am J Clinical Nutr. 2003;78:902–903. doi:10.1093/ajcn/78.5.902
40. Cameron-Pimblett A, La Rosa C, King TFJ, et al. The Turner syndrome life course project: karyotype-phenotype analyses across the lifespan. Clin Endocrinol (Oxford). 2017;87:532–538. doi:10.1111/cen.13394
41. Bakalov VK, Cheng C, Zhou J, Bondy CA. X-chromosome gene dosage and the risk of diabetes in Turner syndrome. J Clin Endocrinol Metabol. 2009;94:3289–3296. doi:10.1210/jc.2009-0384
42. Irzyniec TJ, Jeż W. The influence of hormonal replacement and growth hormone treatment on the lipids in Turner syndrome. Gynecol Endocrinol. 2014;30:250–253. doi:10.3109/09513590.2013.872236
 © 2019 The Author(s). This work is published and licensed by Dove Medical Press Limited. The full terms of this license are available at https://www.dovepress.com/terms.php and incorporate the Creative Commons Attribution - Non Commercial (unported, v3.0) License.
By accessing the work you hereby accept the Terms. Non-commercial uses of the work are permitted without any further permission from Dove Medical Press Limited, provided the work is properly attributed. For permission for commercial use of this work, please see paragraphs 4.2 and 5 of our Terms.
© 2019 The Author(s). This work is published and licensed by Dove Medical Press Limited. The full terms of this license are available at https://www.dovepress.com/terms.php and incorporate the Creative Commons Attribution - Non Commercial (unported, v3.0) License.
By accessing the work you hereby accept the Terms. Non-commercial uses of the work are permitted without any further permission from Dove Medical Press Limited, provided the work is properly attributed. For permission for commercial use of this work, please see paragraphs 4.2 and 5 of our Terms.