")
Back to Journals » Integrated Blood Pressure Control » Volume 13
Anthropometric Indexes for Predicting High Blood Pressure in Vietnamese Adults: A Cross-Sectional Study
Authors Nguyen Minh Q , Nguyen Vo MH
Received 14 September 2020
Accepted for publication 9 November 2020
Published 1 December 2020 Volume 2020:13 Pages 181—186
DOI https://doi.org/10.2147/IBPC.S281996
Checked for plagiarism Yes
Review by Single anonymous peer review
Peer reviewer comments 3
Editor who approved publication: Dr Konstantinos Tziomalos
Quan Nguyen Minh,1 Minh Hoang Nguyen Vo2
1Thu Duc District Hospital, Ho Chi Minh City, Vietnam; 2Office of Science Management and International Affairs, Thu Duc District Hospital, Ho Chi Minh City, Vietnam
Correspondence: Minh Hoang Nguyen Vo
Thu Duc District Hospital, Ho Chi Minh City, Vietnam
Tel +84389135014
Email [email protected]
Background: The rate of hypertension and obesity is increasing in Vietnamese society. This study aimed to focus on assessing the relationship between anthropometric indexes (body mass index (BMI), waist-to-height ratio (WHtR), waist-to-hip ratio (WHR)) and high blood pressure to determine which is the best predictor for high blood pressure among adults over 18 years in Vietnam.
Methods: A cross-sectional study of 1636 people was conducted. People who were over 18 years old, healthy or had hyperlipidemia and on the treatment were recruited. Patients with cancer, heart disease, diabetes, kidney disease, and hypertension were excluded. Information on demographics, smoking and drinking habits, weight, height, waist circumference, and blood pressure was collected. Areas under receiver operating characteristic curves (AUCs) were examined to determine the predictability of anthropometric indicators for high blood pressure in men and women. Logistic regression analysis, stratified by gender, was performed to examine the association between anthropometric indexes and high blood pressure.
Results: In this study, the percentage of people with high blood pressure was 10.51%. The AUC for the WHtR was significantly greater than for the BMI for both genders. Logistic regression demonstrated that only WHtR had a significant positive association with high blood pressure among women. The optimal WHtR cut-off value for predicting high blood pressure in men and women were 0.47 and 0.50, respectively.
Conclusion: Among the indicators analyzed in this study, WHtR was the best for the predicting of the presence of high blood pressure, in both men and women. However, WHtR could only explain the changes of high blood pressure in women.
Keywords: high blood pressure, waist–hip ratio, waist–height ratio, body mass index, high blood pressure prediction
Introduction
Hypertension and its consequences are known to be a major public health problem globally, causing 10.4 million deaths a year.1 The trend of high blood pressure has moved clearly from high-income countries to low-income countries,2 with the estimation of 349 million people with high blood pressure in high-income countries and 10.04 million in low-income countries.3 Persons would be diagnosed with hypertension when their systolic blood pressure is ≥ 140 mmHg and/or diastolic blood pressure is ≥ 90 mmHg.4
There is a lot of evidence that overweight is a predictor of hypertension,5 but the use of body mass index (BMI) to evaluate overweight and obesity creates a gap. However, the BMI indicator has its own limitations because it cannot be used for differentiating the body properties, such as lean mass and fat mass.6 Scientists increasingly believe that anthropometric indexes are the major factors in determining a person’s risk to have diseases like heart disease or cancer. Physiologists from Leeds Beckett University, UK have proposed an indicator to replace BMI. They confirmed the waist–height ratio (WHtR) as the best indicator of abdomen fat mass and body fat. Thus, it can replace BMI as a preliminary medical diagnostic tool.7
A systematic review showed that WHtR was a more accurate predictor of adult cardiovascular disease and diabetes than BMI and waist circumference (WC).8 However, the controversy still remains about the best anthropometric indicator for predicting high blood pressure in adults. Moreover, the scientific evidences related to predicting high blood pressure by anthropometric indicators were still limited, especially among the Vietnamese race. Therefore, this study focused on assessing the relationship between anthropometric indexes (BMI, WHtR, waist-to-hip ratio (WHR)) and high blood pressure, to determine which is the best predictor for high blood pressure among adults over 18 years in Vietnam.
Methods
Study Design
The cross-sectional study was conducted in three wards in Ho Chi Minh City. The study population was adults who were over 18 years old and lived in these wards from April to December 2019. Based on their medical information, those with history of the disease or had been diagnosed with diseases such as cancer, heart disease, diabetes, kidney disease, and hypertension were excluded from the study. People who were healthy or had hyperlipidemia and were taking the drug but not suffering from the mentioned chronic diseases above were included in the study. Multi-stage sampling was conducted by selecting wards, selecting neighborhoods and selecting participants, with a total of 2880 people from each ward. However, only 2203 people agreed to participate in the study, and based on the exclusion criteria 1636 people were recruited in this study, finally.
Measurements
The participants were interviewed at their homes, using structured questionnaires for collecting demographics and smoking and drinking habits information. Current smokers or drinkers (who drank alcohol regularly or occasionally over the past month) are defined as smokers and drinkers, respectively. Anthropometric indicators and blood pressure were measured by trained investigators.
Anthropometric Indicators
The height of participants was measured by a mechanical height rod SH-2M. All subjects were asked to (i) take off their socks and shoes, to ensure their feet were bare when measuring their height; (ii) remove all head coverings; (iii) keep hair flat and lean against the wall, legs together, and stand as straight as possible with head, shoulders, back, and heels all touching the wall and chin and eyes forward.9 Weight was measured by Tanita HD 380 with increments of 0.1 kg. Waist circumference (WC) was measured using a 150 cm BMI body mass index retractable tape measure placed on a horizontal plane level with the iliact crest when viewed from the front, and had an accuracy of 0.1 cm.10
Overweight and obesity were defined as BMI ≥ 25 kg/m2.11 People were at risk when their WHtR ≥ 0.5 for both men and women,8 WC ≥ 90 cm in men and ≥ 80 cm in women,12,13 waist-to-hip ratio (WHR) ≥ 0.9 in men and ≥ 0.85 in women.14
Blood Pressure
Participants were asked not to use tobacco or tea/coffee for at least 30 minutes and rested for at least 10 minutes in a sitting position before measuring. Systolic blood pressure (SBP) and diastolic blood pressure (DBP) were measured using the Omron HBP-1300 automatic blood pressure monitor. Appropriate cuff size was selected for each participant, and blood pressure was recorded three times in each participant’s right arm for about 30 seconds. The mean blood pressure after 3 measurements was recorded, and systolic blood pressure ≥ 140 mmHg and/or diastolic pressure ≥ 90 mmHg was defined as high blood pressure.4
Statistical Analysis
SPSS 20.0 software was used for statistical analysis. Descriptive statistics such as mean and percentage were used to describe the data. The distribution of continuous variables was tested for skewness.15 When comparing variables stratified by gender, t-test and chi-square test were used for the normal distribution continuous variables and categorical variables, respectively.
Receiver operating characteristic curves (ROC) were planned to examine and compare the capacity of the obesity indicators to predict hypertension. The area under the ROC curve (AUC) was used to determine the ability of a particular indicator to predict hypertension. AUC of 1 reflected a perfect predictive power, and an AUC of 0.5 indicated that the predictive power is not valid. The AUCs were compared by the DeLong method.16 An optimal cut-off for the ROC curve of the respective indicator was determined to maximize sensitivity and specificity and was estimated by the highest Youden index. Logistic regression was performed to examine the association between hypertension and obesity, which was determined by BMI, WC, WHtR, and WHR, for males and females separately. Age, smoking, drinking, and ethnicity status were considered to be equal variables in the adjusted models. The statistical significance was set at p<0.05.
Results
The final sample size of this study was 1636 participants (41.26% male and 58.74% female) with an average age of 44.07 ± 13.49. The proportion of participants who smoked and drank alcohol/beer were 17.8% and 25.6%, respectively. Mean height was 1.60 ± 0.07m, mean weight was 57.38 ± 9.20kg, mean BMI was 22.46 ± 2.92kg/m2. Mean measurements of waist and hip circumference were 77.23 ± 10.07cm and 89.88 ± 8.35cm, respectively. Mean WHtR and WHR were 0.48 ± 0.06 and 0.86 ± 0.09, respectively. The percentage of people with high blood pressure in this study was 10.51%.
The distribution of genders between study sites was not different, indicating that the data collection process between study sites was random. However, the mean age of men was significantly different from that of women. There were different rates of drinking and smoking between men and women. The mean values of weight, height, hip circumference, BMI, WC, WHR, systolic blood pressure, and diastolic blood pressure were different between men and women. The at-risk WC among women was different from that of men, with similar results for WHR. There was a significant gender difference in the proportion of people with high blood pressure, with 16.44% in men and 6.35% in women, respectively (Table 1).
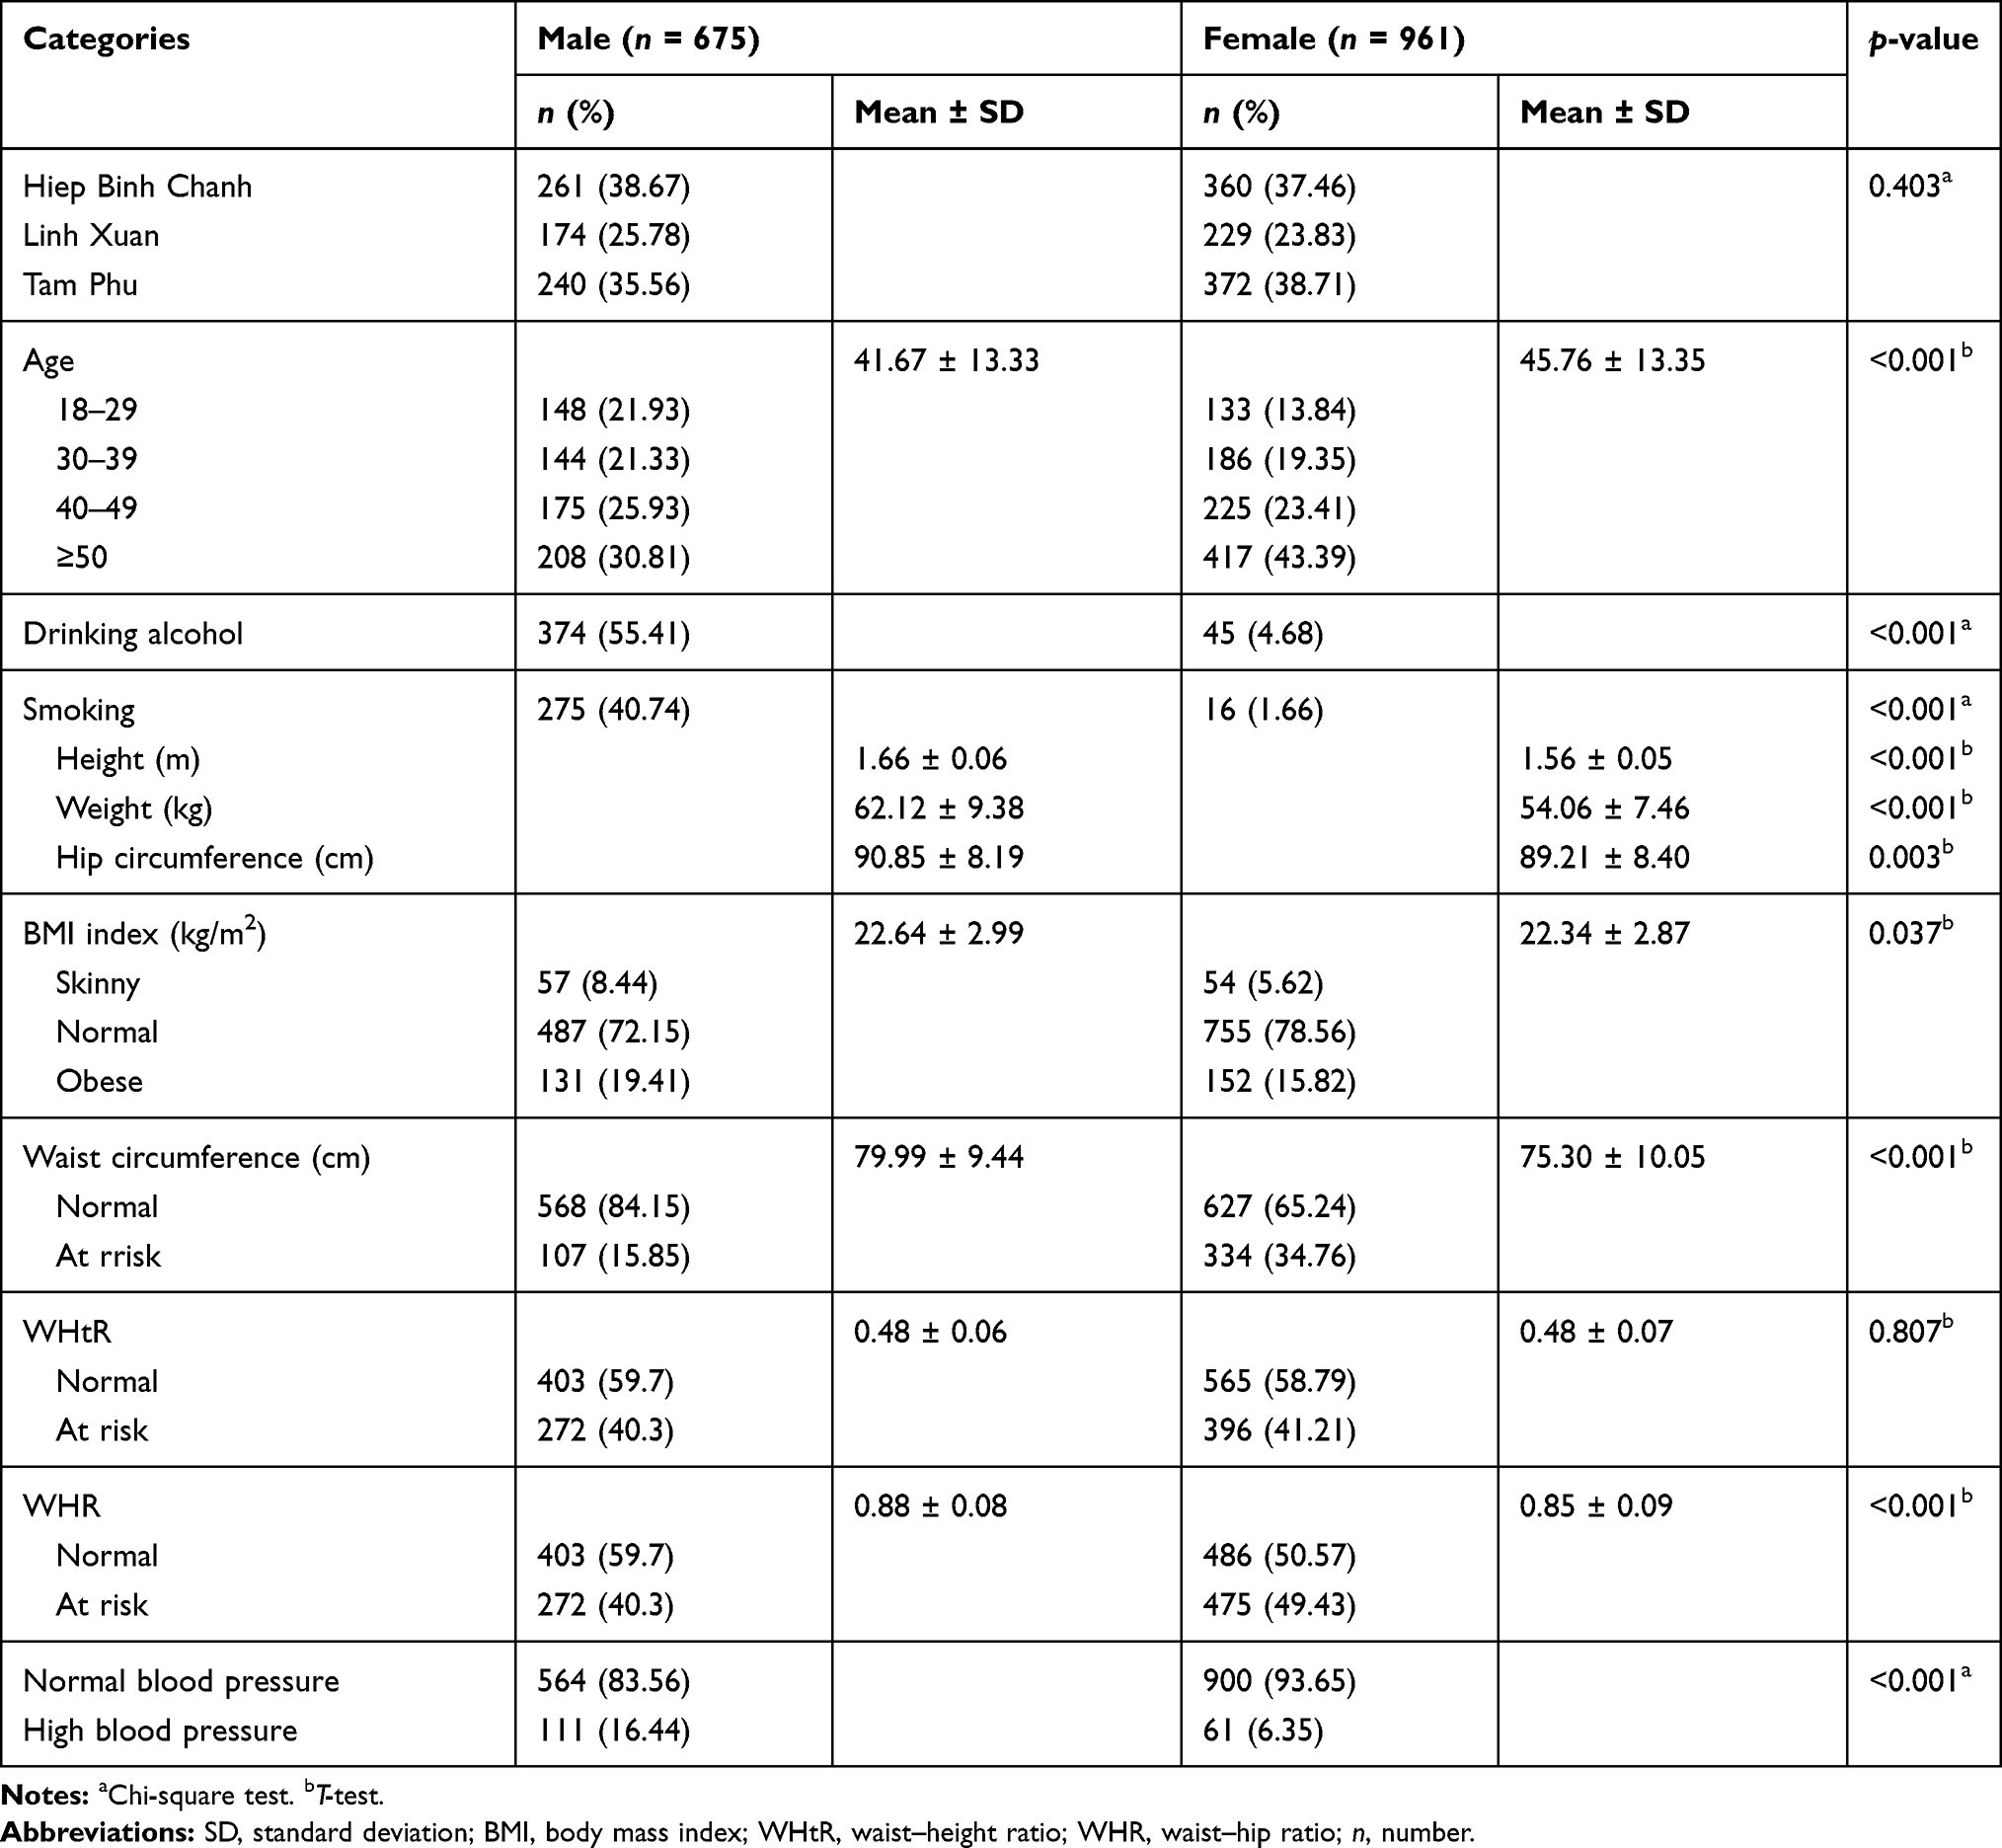 |
Table 1 Sample Characterization According to Gender |
The capacity of the anthropometric indicators to predict high blood pressure was indicated as the area under the curve (AUC) (Table 2). The AUC values of the anthropometric indicators ranged from 0.54 to 0.63 for men and 0.63 to 0.75 for women. Among the anthropometric indicators, WHtR had the highest AUC value for both genders, followed by the WHR and BMI. AUC value of WHtR was greater than BMI, suggesting that WHtR was likely to be a better predictor of high blood pressure for men and women.
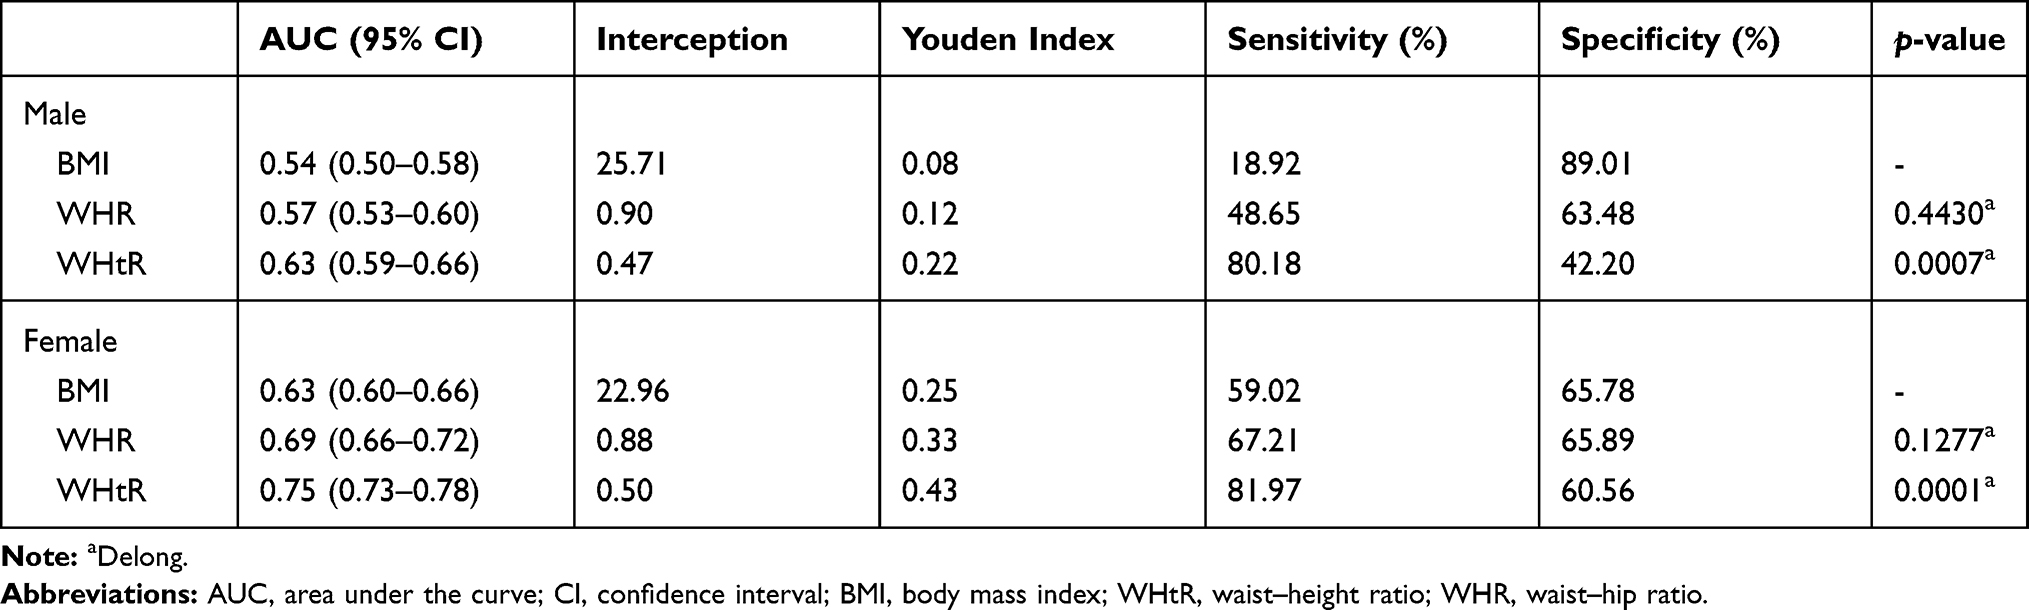 |
Table 2 Area Under the Curve of Demographics Index for Predicting in High Blood Pressure |
The multivariate analysis between the anthropometric indicators and high blood pressure showed that the anthropometric indicators of men were insufficient to explain the differences in high blood pressure while, in women, only WHtR was sufficient to account for variability of high blood pressure (Table 3).
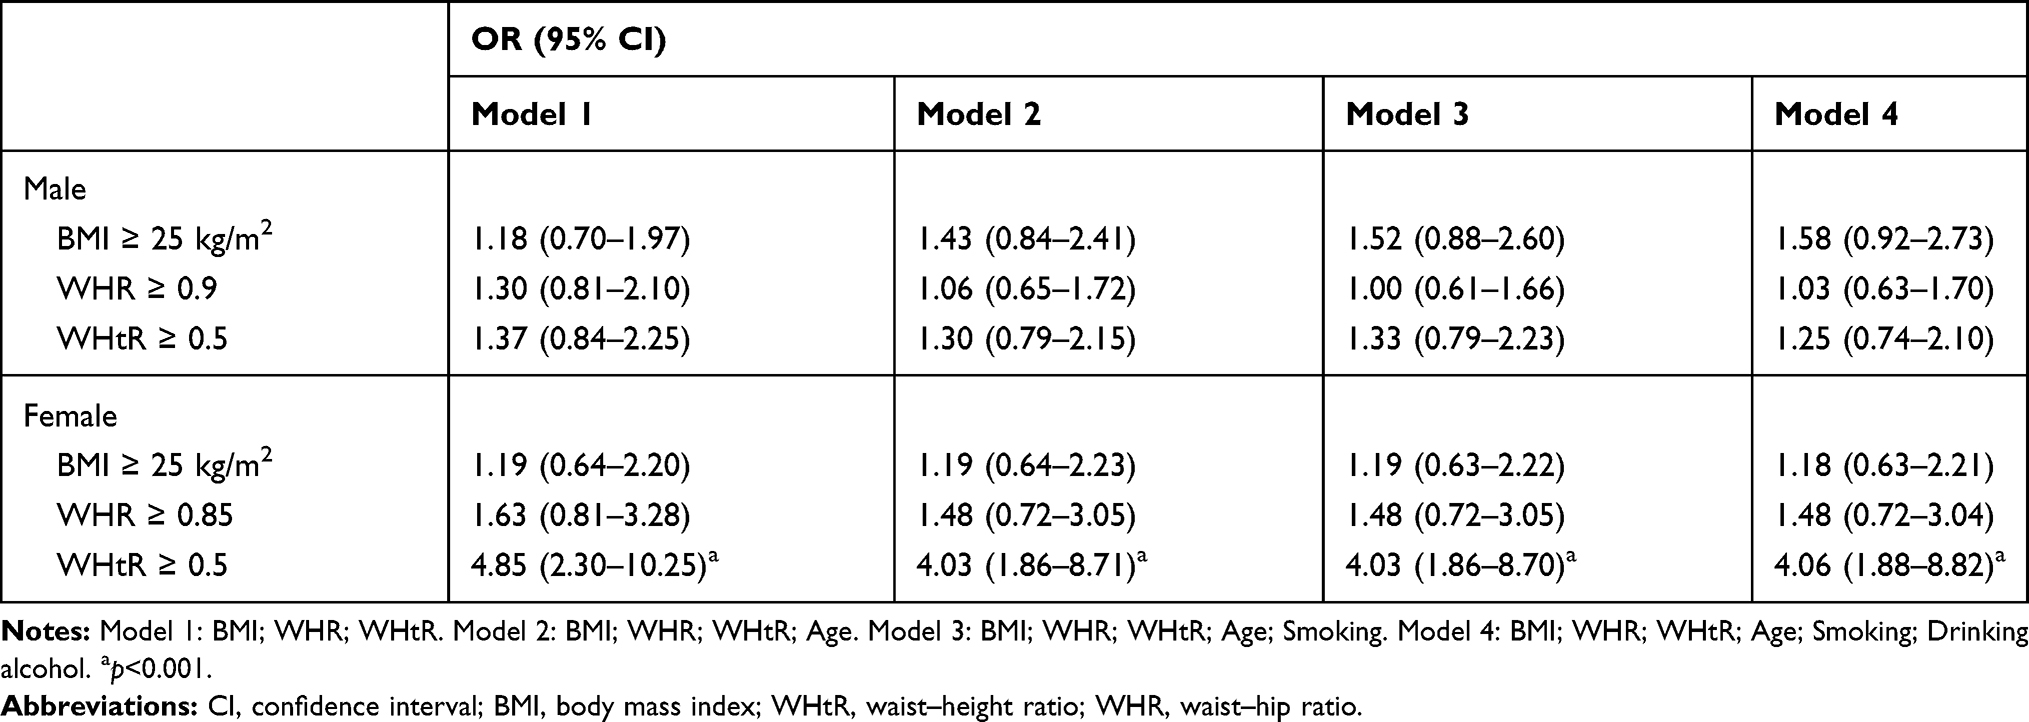 |
Table 3 Relationship Between the High Blood Pressure and Anthropometric Indexes in Variable Logistical Analysis |
Discussion
In this study, BMI and WHR were not likely to predict the high blood pressure; only WHtR could be reliable in predicting high blood pressure. This suggests that high blood pressure is related to the distribution of body fat rather than total body fat. WHtR seems to be more valuable than BMI and WHR in predicting high blood pressure in men and women, based on the estimation of AUC and unadjusted OR. Similarly, in multivariate analysis, WHtR seems to be the best parameter for predicting the presence of high blood pressure. This finding was pointed out in a meta-analysis study by Savva et al, which showed that WHtR was a superior indicator compared to BMI in detecting some cardiovascular metabolic risk factors in Asians and Europeans.17 A similar conclusion was reached by Choi et al who suggested that WHtR could be a biomarker that had a better prediction rate for hypertension than BMI and might play a key role in future diagnosis of hypertension in Korean adults.18
Early detection of high blood pressure is very important for the screening and prevention of hypertension in adults; however, since blood pressure is not checked regularly in most adults, it is difficult to keep track of their status. Many studies have been carried out with a desire to find the capacity to predict hypertension from anthropometric indicators. Recently, various scientists have demonstrated that WHtR is an important predictor of blood pressure and hypertension, recent studies by Browning and Ashwell and co-workers showing that WHtR was more able to predict cardiovascular disease among the age groups, gender, and ethnicity than BMI.8,19
Although WC was shown to be the best predictor of hypertension in other studies,20–22 it was not included in the multivariate analysis in our study because of its high similarity to weight and BMI.23 Especially, WC did not take into account height difference, as some studies showed that people with same WC but different height had different risk of cardiovascular metabolism,24 thus, the use of WC to predict adult blood pressure is unstable.
Recently, the recommended WHtR cut-off for the prediction of diseases such as diabetes, heart disease, hypertension, and metabolic syndrome is 0.5.8 In this study, there was a difference in WHtR levels between men and women (male: 0.47; female: 0.50); however, AUC of WHtR was still higher than that of BMI, as shown in Table 2.
Another finding in our study was that WHtR interpreted the significance of high blood pressure in women, but not in men. This might suggest that the cut-off point of 0.5 of WHtR for both men and women in this study was not really suitable. In Table 2, the cut-off of WHtR for men was 0.47 and for women it was 0.50, so further studies are needed to examine the appropriate WHtR cut-off for each gender group.
There were some limitations of this study. First, the onset of disease in participants was not determined, because this was only a cross-sectional study. Second, the study was limited to urban areas and the southern region, so it did not represent the total population of the country.
Conclusion
Our findings indicate that WHtR is a strong predictor of high blood pressure in Vietnamese adult populations. In addition, WHtR is shown as a better screening tool than BMI. Vietnamese adults need to adopt lifestyle changes to reduce waist circumference by a half, compared to height, in order to reduce the risk of hypertension. Future studies in other large, diverse populations are needed to demonstrate WHtR’s capacity to predict hypertension.
Abbreviations
AUC, area under the curve; BMI, body mass index; CI, confidence interval; DBP, diastolic blood pressure; n, number; OR, odds ratio; ROC, receiver operating characteristic; SBP, systolic blood pressure; SD, standard deviation; WC, waist circumference; WHR, waist-to-hip ratio; WHtR, waist-to-height ratio.
Ethics Approval and Consent to Participate
The research protocol had been approved by the Hospital Ethics Council of Thu Duc District. All participants agreed to participate in the study by signing a written informed consent. Our study complied with the Declaration of Helsinki.
Acknowledgments
The authors thank all members of the data collection team and all participants in this study.
Author Contributions
All authors made a significant contribution to the work reported, whether that is in the conception, study design, execution, acquisition of data, analysis and interpretation, or in all these areas; took part in drafting, revising, or critically reviewing the article; gave final approval of the version to be published; have agreed on the journal to which the article has been submitted; and agree to be accountable for all aspects of the work.
Disclosure
The authors declare that there is no conflict of interest.
References
1. Bisanzio D, Shokraneh F, Collaborators GRF. Global, regional, and national comparative risk assessment of 84 behavioural, environmental and occupational, and metabolic risks or clusters of risks for 195 countries and territories, 1990–2017: a systematic analysis for the Global Burden of Disease Study. 2018.
2. Bo S, Bruno G, Vineis P, Gruden G. Worldwide trends in blood pressure from 1975 to 2015: a pooled analysis of 1479 population-based measurement studies with 19· 1 million participants. 2017.
3. Mills KT, Bundy JD, Kelly TN, et al. Global disparities of hypertension prevalence and control: a systematic analysis of population-based studies from 90 countries. Circulation. 2016;134(6):441–450. doi:10.1161/CIRCULATIONAHA.115.018912
4. Chalmers J, MacMahon S, Mancia G, et al. 1999 World Health Organization-international society of hypertension guidelines for the management of hypertension. Guidelines sub-committee of the World Health Organization. J Clin Exp Hypertens. 1999;21(5–6):1009–1060.
5. Okosun IS, Liao Y, Rotimi CN, Choi S, Cooper RS. Predictive values of waist circumference for dyslipidemia, type 2 diabetes and hypertension in overweight White, Black, and Hispanic American adults. J Clin Epidemiol. 2000;53(4):401–408. doi:10.1016/S0895-4356(99)00217-6
6. Jackson AS, Stanforth PR, Gagnon J, et al. The effect of sex, age and race on estimating percentage body fat from body mass index: the Heritage Family Study. Int J Obes. 2002;26(6):789–796. doi:10.1038/sj.ijo.0802006
7. Swainson MG, Batterham AM, Tsakirides C, Rutherford ZH, Hind K, Tauler P. Prediction of whole-body fat percentage and visceral adipose tissue mass from five anthropometric variables. PLoS One. 2017;12(5):e0177175. doi:10.1371/journal.pone.0177175
8. Browning LM, Hsieh SD, Ashwell M. A systematic review of waist-to-height ratio as a screening tool for the prediction of cardiovascular disease and diabetes: 0·5 could be a suitable global boundary value. Nutr Res Rev. 2010;23(2):247–269. doi:10.1017/S0954422410000144
9. Lifshitz F. Pediatric endocrinology: growth, adrenal, sexual, thyroid, calcium, and fluid balance disorders. CRC Press. 2006.
10. World Health Organization. Waist Circumference and Waist-Hip Ratio: Report of a WHO Expert Consultation. Geneva; December 8–11, 2008:2011.
11. World Health Organization. Obesity: Preventing and Managing the Global Epidemic. World Health Organization; 2000.
12. Alberti K, Eckel RH, Grundy SM, et al. Harmonizing the metabolic syndrome: a joint interim statement of the international diabetes federation task force on epidemiology and prevention; national heart, lung, and blood institute; American heart association; world heart federation; international atherosclerosis society; and international association for the study of obesity. Circulation. 2009;120(16):1640–1645.
13. Misra A, Vikram NK, Gupta R, Pandey RM, Wasir JS, Gupta VP. Waist circumference cutoff points and action levels for Asian Indians for identification of abdominal obesity. Int J Obes. 2006;30(1):106–111. doi:10.1038/sj.ijo.0803111
14. Jia W, Xiang K, Chen L, Lu J, Wu YJOR. Epidemiological study on obesity and its comorbidities in urban Chinese older than 20 years of age in Shanghai, China. Obes Rev. 2002;3(3):157–165.
15. Groeneveld RA, Meeden G. Measuring skewness and kurtosis. J R Stat Soc. 1984;33(4):391–399.
16. DeLong ER, DeLong DM, Clarke-Pearson DL. Comparing the areas under two or more correlated receiver operating characteristic curves: a nonparametric approach. Biometrics. 1988;44(3):837–845. doi:10.2307/2531595
17. Savva SC, Lamnisos D, Kafatos AG. Predicting cardiometabolic risk: waist-to-height ratio or BMI. A meta-analysis. Diabetes Metab Syndr Obes. 2013;6:403. doi:10.2147/DMSO.S34220
18. Choi JR, Koh SB, Choi E. Waist-to-height ratio index for predicting incidences of hypertension: the ARIRANG study. BMC Public Health. 2018;18(1):767. doi:10.1186/s12889-018-5662-8
19. Ashwell M, Gunn P, Gibson S. Waist-to-height ratio is a better screening tool than waist circumference and BMI for adult cardiometabolic risk factors: systematic review and meta-analysis. Obes Rev. 2012;13(3):275–286. doi:10.1111/j.1467-789X.2011.00952.x
20. Chei C-L, Iso H, Yamagishi K, et al. Body fat distribution and the risk of hypertension and diabetes among Japanese men and women. Hypertens Res. 2008;31(5):851–857. doi:10.1291/hypres.31.851
21. Dobbelsteyn CJ, Joffres MR, MacLean DR, Flowerdew G. The Canadian Heart Health Surveys Research G. A comparative evaluation of waist circumference, waist-to-hip ratio and body mass index as indicators of cardiovascular risk factors. The Canadian Heart Health Surveys. Int J Obes. 2001;25(5):652–661.
22. Huang KC, Lin WY, Lee LT, et al. Four anthropometric indices and cardiovascular risk factors in Taiwan. Int J Obes. 2002;26(8):1060–1068. doi:10.1038/sj.ijo.0802047
23. Chung W, Park CG, Ryu O-H, Wong V. Association of a new measure of obesity with hypertension and health-related quality of life. PLoS One. 2016;11(5):e0155399. doi:10.1371/journal.pone.0155399
24. Son YJ, Kim J, Park HJ, et al. Association of waist-height ratio with diabetes risk: a 4-year Longitudinal Retrospective Study. Endocrinol Metab. 2016;31(1):127–133. doi:10.3803/EnM.2016.31.1.127
 © 2020 The Author(s). This work is published and licensed by Dove Medical Press Limited. The full terms of this license are available at https://www.dovepress.com/terms.php and incorporate the Creative Commons Attribution - Non Commercial (unported, v3.0) License.
By accessing the work you hereby accept the Terms. Non-commercial uses of the work are permitted without any further permission from Dove Medical Press Limited, provided the work is properly attributed. For permission for commercial use of this work, please see paragraphs 4.2 and 5 of our Terms.
© 2020 The Author(s). This work is published and licensed by Dove Medical Press Limited. The full terms of this license are available at https://www.dovepress.com/terms.php and incorporate the Creative Commons Attribution - Non Commercial (unported, v3.0) License.
By accessing the work you hereby accept the Terms. Non-commercial uses of the work are permitted without any further permission from Dove Medical Press Limited, provided the work is properly attributed. For permission for commercial use of this work, please see paragraphs 4.2 and 5 of our Terms.