")
Back to Journals » International Journal of Nanomedicine » Volume 11
Annihilation of Leishmania by daylight responsive ZnO nanoparticles: a temporal relationship of reactive oxygen species-induced lipid and protein oxidation
Authors Nadhman A, Khan MI, Nazir S, Khan M, Shahnaz G, Raza A , Shams D, Yasinzai M
Received 28 January 2016
Accepted for publication 12 March 2016
Published 31 May 2016 Volume 2016:11 Pages 2451—2461
DOI https://doi.org/10.2147/IJN.S105195
Checked for plagiarism Yes
Review by Single anonymous peer review
Peer reviewer comments 3
Editor who approved publication: Dr Thomas Webster
Akhtar Nadhman,1–3 Malik Ihsanullah Khan,1,2 Samina Nazir,4 Momin Khan,1,5 Gul Shahnaz,6 Abida Raza,2 Dilawar Farhan Shams,7 Masoom Yasinzai1,3
1Department of Biotechnology, Faculty of Biological Sciences, Quaid-i-Azam University, 2Nuclear Medicine Oncology and Radiotherapy Institute, 3Centre for Interdisciplinary Research in Basic Sciences (CIRBS), International Islamic University, 4Nanosciences and Catalysis Division, National Centre for Physics, Quaid-i-Azam University Campus, Islamabad, 5Department of Microbiology, Institute of Basic Medical Sciences, Khyber Medical University, Peshawar, 6Department of Pharmacy, Faculty of Biological Sciences, Quaid-i-Azam University, Islamabad, 7Department of Environmental Sciences, Abdul Wali Khan University Mardan, Mardan, Pakistan
Abstract: Lipid and protein oxidation are well-known manifestations of free radical activity and oxidative stress. The current study investigated extermination of Leishmania tropica promastigotes induced by lipid and protein oxidation with reactive oxygen species produced by PEGylated metal-based nanoparticles. The synthesized photodynamic therapy-based doped and nondoped zinc oxide nanoparticles were activated in daylight that produced reactive oxygen species in the immediate environment. Lipid and protein oxidation did not occur in dark. The major lipid peroxidation derivatives comprised of conjugated dienes, lipid hydroperoxides, and malondialdehyde whereas water, ethane, methanol, and ethanol were found as the end products. Proteins were oxidized to carbonyls, hydroperoxides, and thiol degrading products. Interestingly, lipid hydroperoxides were produced by more than twofold of the protein hydroperoxides, indicating higher degradation of lipids compared to proteins. The in vitro evidence represented a significant contribution of the involvement of both lipid and protein oxidation in the annihilated antipromastigote effect of nanoparticles.
Keywords: lipid peroxidation, protein oxidation, Leishmania tropica, zinc oxide (ZnO), nanoparticles, reactive oxygen species (ROS), photodynamic therapy (PDT), doping
Introduction
Reactive oxygen species (ROS) are capable of causing alteration in macromolecules, such as lipids, proteins, and nucleic acids, which is often termed as oxidative stress. These oxygen derived free radicals are highly unstable, short-lived, and reactive, and seriously affect prokaryotic or eukaryotic cell integrity, health, and viability thus leading to cell death.1,2 The oxidative stress induces lipid peroxidation and protein oxidation that damage the rigidity of cell membrane by affecting fluidity and permeability, inflicting changes in the ion transport, and inhibiting the metabolic processes.3
Lipid concentration in cellular membranes is 30%–80% by mass. The leftover contains proteins (20%–60%) and carbohydrates (0%–10%).3 Several species, for example, hydroxyl, alkoxyl, peroxyl, hydroperoxyl, and singlet oxygen, are involved in abstraction of the first hydrogen atom from the lipid moiety.4 As a result, different derivatives are formed, for example, conjugated dienes and hydroperoxides. Hydroperoxides are highly unstable and are further converted to malondialdehydes (MDAs), hydroxynonenals (HNEs), and hydroxyhexenals in the presence of reduced metal.5 Proteins, attacked by ROS, are normally oxidized to carbonyls on the chiral carbon or the amino acid side chains,6 and also to other products, for example, hydroperoxide and thiol degradation products.7
Leishmania is a protozoan parasite that causes a vector-borne disease called leishmaniasis. Sandfly transmits the parasites between mammalian hosts.8 It occurs in different clinical manifestations, that is, cutaneous, mucocutaneous, visceral, and disseminated as well as post-Kala Azar dermal leishmaniasis. Leishmaniasis is still one of the major infectious diseases worldwide with a serious risk to 350 million people in 98 countries and ~2 million new cases reported every year.9 Leishmania tropica is mainly responsible for cutaneous leishmaniasis and the parasite is capable of producing single or multiple ulcers at the biting place.10 Photodynamic therapy (PDT) used for the treatment of cancer and infectious diseases has emerged as a noninvasive medical technology.11,12 In PDT, photosensitizers are used to eliminate diseased cells/pathogens. These photosensitizers are activated by nonthermal light to produce cytotoxic ROS.13 PDT can be used for specific treatment of lesions that are exposed to light.14
The purpose of this study was to investigate the annihilation of L. tropica promastigotes with PEGylated-doped and -nondoped ZnO.15,16 ZnO was selected for its nontoxicity, lower cost, high crystallinity, and unique phototoxic effect upon irradiation. Further, the forbidden gaps in ZnO were filled up by the introduction of silver and copper that induced the visible-light absorption by narrowing down the conduction band.17 The study was mainly focused on the lipid and protein oxidation caused by the ROS generated by PDT-based ZnO nanoparticles, and the quantitative differences among lipid and protein oxidation products. Lipid peroxidation starts from the first moment of ROS attack and generally involve three steps: initiation, propagation, and termination.18 Owing to the time dependence of the processes, lipid peroxidation was assessed in a time-dependent manner. Moreover, since the protein oxidation products are stable for a long time,7 only the final products were considered in the current study.
Materials and methods
Materials/equipment
Medium 199 was purchased from GIBCO® (Thermo Fisher Scientific., Waltham, MA, USA); fetal bovine serum from PAA Laboratories GmbH, Cölbe, Germany; streptomycin from Amresco (Cleveland, OH, USA); HEPES from Carl Roth GmbH + Co. KG, Karlsruhe, Germany; NaHCO3 from Merck & Co., Inc., Whitehouse Station, NJ, USA; anhydrous D-glucose, CaCl2·2H2O, MgCl2·6H2O, KCl, NaCl, DMSO, TRIS, chloroform, cylcohexane, and toluene from Scharlau, Barcelona; 2,7-dichlorodihydroflurescein diacetate from Invitrogen (USA) methanol, trichloroacetic acid, thiobarbituric acid, 2,4-dinitrophenylhydrazine (DNPH), guanidine hydrochloride, bovine serum albumin (essentially fatty acid-free), 5,5′-dithiobis-2-nitrobenzoic acid (DTNB), and penicillin G from Sigma-Aldrich Co. (St Louis, MO, USA); and petroleum ether and diethyl ether from Riedel-de Haen, Sigma-Aldrich Co. (St Louis, MO, USA). The equipments used were centrifuge (Eppendorf 5424, Hamburg, Germany), microscope (Micros, Carinthia, Austria), incubator (Memmert, Schwabach, Germany), Fourier transform infrared (FTIR) attenuated total reflectance spectrometer from TENSOR 27™ Bruker (Milan, Italy), and gas chromatograph from Shimadzu GCMS-QP2010 Ultra (Japan). Our institute ethics committee/institutional review board does not require approvals for these kinds of studies.
Nanoparticles
In the current study, one pure ZnO (non-doped nanoparticle [NDNP]) and four doped-ZnO nanoparticles were synthesized with varying concentration of dopants, that is, 1%, 5%, and 9% silver (DNP1–DNP3) and 1% copper (DNP4).15 The synthesis was started by dissolving both zinc acetate and silver nitrate (different concentrations) in ethanol (solution A) and in a second reaction, zinc acetate and copper acetate (1%) in ethanol (solution B). The final concentrations obtained were 50 mM each. Afterward, 5% triton X-100 was dissolved in ethanol (solution C). Both solutions A and C were mixed and titrated against 100 mM NaOH. Similarly, solutions B and C were mixed and titrated against 100 mM NaOH. The obtained materials were subjected to argon atmosphere at 30 sccm in a tube furnace (4°C/min) maintaining the temperature at 100°C for 4 hours. The synthesized nanoparticles were capped with PEG-400. The morphology of the current nanoparticles was elucidated by scanning electron microscopy, carried out on JOEL SEM model SM6460 after gold coating. Characterization was carried out by X-ray diffraction by a diffractometer (Shimadzo 6000) using radiation of copper-Kα´, λ=1.54 A, at 40 kV and operating current of 30 mA. The polydispersity index and zeta potential were assessed by Microtrac, Nanotrac Wave II, USA system (North Wales, PA, USA).
Cell culture
L. tropica KWH23 promastigotes were incubated at 24°C in Medium 199 containing 25 mM HEPES, 10% fetal bovine serum, 100 mg/mL streptomycin, and 100 U/mL penicillin antibiotics. Cells were taken at a concentration of 2×10⁷ cells/mL in all experiments.
Time dependent antileishmanial experiments
Leishmania promastigotes were incubated with 10 μg/mL doped nanoparticles (DNPs) and NDNP in Eppendorf tubes with a final adjusted volume of 1 mL. For control, Leishmania cells were taken in Eppendorf tubes without any nanoparticles and exposed to sunlight for 15 minutes. The nanoparticle treated Leishmania cells were divided into two groups; the first group was exposed to direct sunlight (168±0.8 W/m2 of sun intensity) for 15 minutes19 while the second was kept in complete dark. Afterward, they were incubated at 24°C in full dark conditions for 3 hours. The viability was checked after each hour by motility and trypan blue assays. The experiments were performed in the months of September, October, February, and March with external temperatures of 23°C–25°C. During these experiments, the external temperature was frequently monitored and no experiments were performed during cloud covers. The Eppendorf tubes were kept in direct sunlight in all the experiments at noon time when the sunlight was perpendicular and ideal for maximum exposure. The same protocol was repeated for all the experiments.
ROS detection
Intracellular ROS levels were detected in treated and untreated cells. DNP treated Leishmania promastigotes were harvested, resuspended in Hank’s buffer salt solution, and cell number was counted in a Neubauer chamber. The promastigotes were then incubated with 2,7-dichlorodihydroflurescein diacetate (20 mM) for 20 minutes at 37°C in complete dark. The increase in fluorescence caused by the binding was checked on Leica Fluorescent Microscope with Canon camera, using 485 and 530 nm filters for excitation and emission wavelengths. Positive control was obtained by addition of 1 mM of H2O2 for 20 minutes.
Leishmania lipid and protein extraction
Leishmania cells were treated as mentioned earlier. Lipids were extracted by centrifuging (at 6,000 rpm) both the treated and untreated (control) L. tropica cells and washing the pellet with Hanks’s buffer salt solution. Lipids were extracted by a modified method of Devasagayam et al4 in a chloroform:methanol (2:1 v/v) solution at 2,000 rpm for 15 minutes. Supernatant along with proteins were used in protein experiments. This procedure was followed for all the experiments.
FTIR of lipid peroxidation products
Samples were dissolved in 1 mL chloroform and analyzed on FTIR. The infrared spectrums of both the control and treated samples were recorded with bench-top TENSOR 27™ FTIR spectrometer (Bruker Optik GmbH, Ettlingen, Germany) equipped with universal PIKE-MIRacle™ single reflectance attenuated total reflectance accessory (PIKE Technologies, Madison WI, USA). The FTIR spectra were recorded at room temperature (25°C) yielding an infrared spectrum over the range of 4,000–600 cm−1 with a speed of ten scans per spectrum. All data were initially corrected for background spectrum and base line. The transmittance (%) mode was used for spectral measurements.
Quantification of lipid peroxidation products
Conjugated dienes
Extracted lipids were dried, samples were dissolved in 1 mL cyclohexane, and absorbance was measured at 233 nm on a spectrophotometer (Standard 1 optical density =37.5 nM). Cyclohexane was used as a blank. Since dienes are sensitive to oxygen, the experiments were carried out in deoxygenated conditions, that is, by nitrogen purging.
Lipid hydroperoxides
Lipid hydroperoxides were estimated by ferrous oxidation-xylenol orange (FOX) assay. FOX solution was prepared by mixing one part of FeSO4 (25 mM) with two parts of deionized water and two parts of Xylenol orange (10 mM). FOX was added in a 1:19 ratio to the sample and incubated in the dark for 30 minutes. Afterward, the optical density was read at 560 nm. The levels of hydroperoxides were calculated from H2O2 standard curve and molar absorbing coefficient of 4.3×10⁴ M−1.
MDA quantification
MDAs were quantified by thiobarbituric acid reactive substances assay. To the centrifuged pellet, 0.1 mL Hanks’s buffer salt solution, 0.1 mL FeSO4 (1 mM), and 0.1 mL ascorbic acid (1.5 mM) were added and the final volume was adjusted to 1 mL by adding 600 μL distilled water. Trichloroacetic acid (10%) and thiobarbituric acid (0.357%) were added (1:2) and incubated in boiling water for 15 minutes. Optical density was noted at 532 nm after centrifugation at 3,000 rpm for 10 minutes. The above solution without sample was used as a control.
GC–MS for identification and quantification of secondary oxidation compounds
Lipids dissolved in chloroform were introduced to Shimadzu gas chromatography unit (GCMS-QP2010 Ultra) equipped with an on-column injector coupled to a mass spectrometer via a high-temperature interface. The separation was achieved using a 30 m×0.25 mm DB-5 ms capillary column having 0.25 μm thickness. Helium was used as a carrier gas at a purge flow of 3 mL/min with a linear velocity of 40 m/s and column flow of 1.24 mL/min. The gas pressure was maintained at ~64.3 kPa, and the injection and interface temperatures were set to 220°C and 250°C, respectively. The column oven temperature was programmed at 35°C/10 minutes and further temperature was set to 250°C. The injection mode was split. Mass spectra were recorded in the total ion current monitoring mode. The operating conditions for MS were ion source temperature at 200°C, energy at 0.6 kV, and scan range from m/z 10 to 600 with a period of 15 seconds.
Quantification of Leishmania proteins
Protein hydroperoxides
Proteins were purified to homogeneity and hydroperoxides were determined with the same method used for lipid hydroperoxides as mentioned earlier.
Protein thiols
Thiol quantification was started by dissolving 0.5 mM of DTNB 0.1 M in phosphate buffer. In centrifuge tubes, 50 μL of protein solution was dispensed and 1 mL of DTNB solution was added. To the control group, 1 mL of 0.1 M of phosphate buffer was added and then incubated in the dark for 30 minutes at room temperature. The absorbance was measured at 412 nm (extinction coefficient of 13,600 M−1 cm−1) on UV-vis spectrophotometer. DTNB in deionized water was used as a blank. Thiols were determined by: absorbance change = treated (protein + DTNB) − control (protein + phosphate buffer) − blank (DTNB in water). The values were multiplied with a factor of 21 to give thiol concentration in moles per liter as in the original solution.
Protein carbonyls
Carbonyl quantification was started by diluting protein samples to a concentration of 1 mg/mL. The samples were divided into two groups with a sample size of 250 μL in 1.5 mL centrifuge tubes. To the first group, 250 μL of 10 mM DNPH (dissolved in 2.5 M HCl) was added. To the second, 250 μL of 2.5M HCl was added and both groups were incubated in dark for 15 minutes at room temperature by a simple vortex for every 5 minutes. Trichloroacetic acid was also added (125 μL) to each tube. The samples were then incubated at −20°C for 15 minutes and centrifuged at 4°C for 15 minutes at 10,000 rpm. The protein pellet was treated with 1% streptomycin sulfate for the removal of any nucleic acid contaminants.20 Afterward, the protein pellet was washed with ethanol/ethyl acetate (1/1 mixture), redissolved in 1 mL of 6 M guanidine–HCl, and the absorbance was measured at 370 nm on UV-vis spectrophotometer. Total protein concentration was determined from a standard curve of bovine serum albumin (1 mg/mL) in 6 M guanidine–HCl, and the absorbance was measured at 280 nm. Carbonyl concentration was determined using the extinction coefficient of DNPH at 370 nm (22,000 per mole per cm), and the values were expressed as nM carbonyl per mg protein.
Statistical analysis
All the experiments were performed in triplicates and repeated three times. For statistical analysis, SPSS v 21 (IBM Corporation, Armonk, NY, USA) and Graphpad Prism 5 (GraphPad Software, Inc., CA, USA) were used. Data were presented as mean with standard deviation. Two-way analysis of variance (ANOVA) was used to identify significant effects and *P<0.05 and **P<0.01 were considered as statistically significant and highly significant. The relationship between different parameters was assessed using Pearson’s correlation coefficient (r).
Results and discussion
Nanoparticles
The nanoparticles used in the current study were capped with PEG-400 molecules to stabilize the surface and avoid the undesirable interactions of the OH group of ZnO with the biological environment and also to increase the delivery of these nanoparticles to Leishmania cells.15,21,22 The scanning electron microscopy images of the current nanoparticles revealed the morphology (Figure 1) with the size distribution ranging from 20 to 60 nm. The polydispersity index of all the nanoparticles was in the range of 0.24–0.3, while the zeta potential was in the range of −22 to −25 mV. Figure 2 signifies a clear pattern of the main peaks and it was observed that the peak intensity increased with the addition of dopant concentration (silver and copper). Hence, the dopant ions were understood to have occupied the Zn without changing the crystal structure. It was evident that orientation behavior of ZnO was strongly promoted by doping.
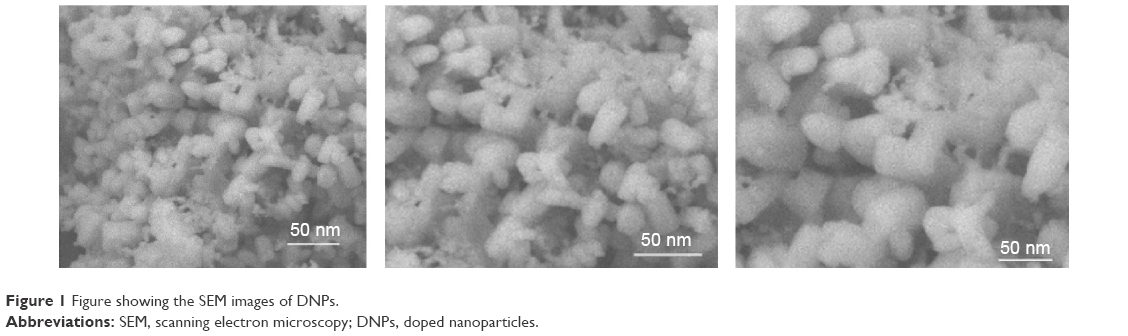 | Figure 1 Figure showing the SEM images of DNPs. |
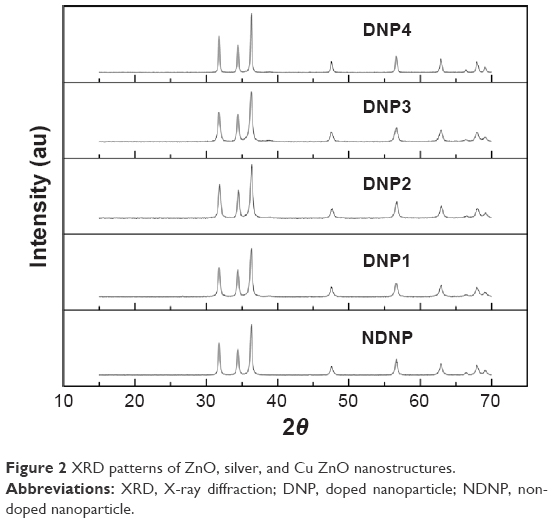 | Figure 2 XRD patterns of ZnO, silver, and Cu ZnO nanostructures. |
ROS detection
Fluorescent microscopy is an excellent method for the detection of fluorescent molecules.23 In the current study, the ROS production by DNPs was confirmed by using 2,7-dichlorodihydroflurescein diacetate dye, which was hydrolyzed by cellular esterase to 2,7-dichlorodihydroflurescein that occurs in the lipophilic compartment.24 2,7-Dichlorodihydroflurescein is basically nonfluorescent but its fluorescence progresses when oxidized to 2,7-dichlorofluorescein by ROS, such as singlet oxygen, hydroxyl radicals, and other ROS.23,25 The ROS produced by DNPs reacted with the 2,7-dichlorodihydroflurescein, oxidized it, and released the 2,7-dichlorofluorescein, which is a fluorescent molecule detected at 522 nm (Figure 3).
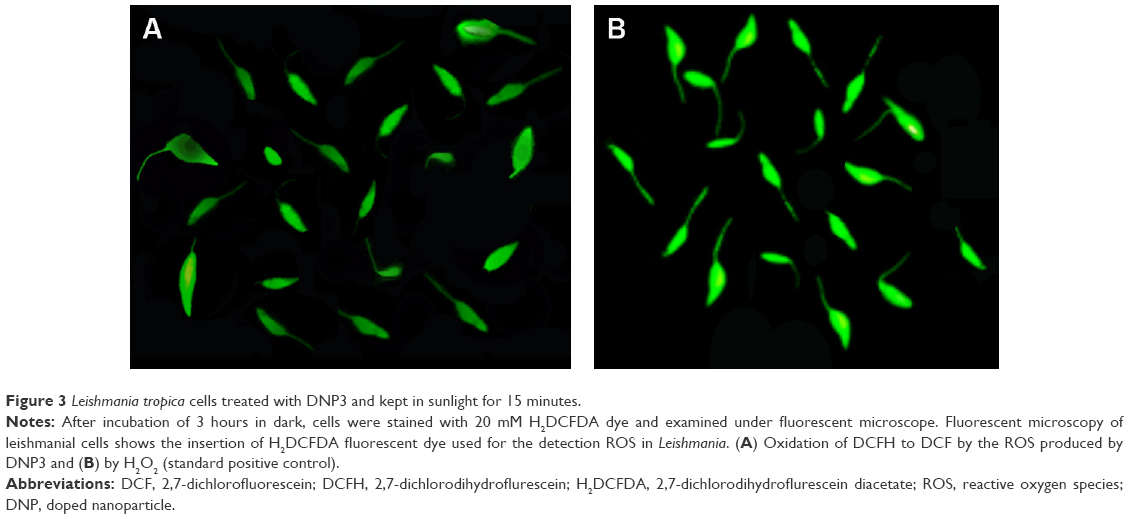 | Figure 3 Leishmania tropica cells treated with DNP3 and kept in sunlight for 15 minutes. |
Antileishmanial experiments
ROS are highly reactive moieties and can severely affect the wellness of the physiologically active cell by reacting with the cellular moieties. In the current study, the time-dependent antipromastigote activity of PDT-based ZnO nanoparticles was assessed. Using nanoparticles at 10 μg/mL concentration, cell death started from the first hour, after 15 minutes exposure to direct sunlight (Figure 4). Previously, we monitored the activity in a dose-dependent manner using the same set of conditions, demonstrating the activity in lower micrograms level (~0.01 μg/mL) after 24 hours.15 Interestingly, in these experiments, we found 100% leishmanicidal activity at 10 μg/mL after 3 hours; that is why this concentration was used in the current study. Moreover, there was no leishmanicidal activity in dark conditions and also in the control group (without nanoparticles). The PDT-based nanoparticles produced ROS that caused lipid peroxidation18,26 and also gave rise to protein oxidation products in sunlight,27 leading to the death of Leishmania cells.
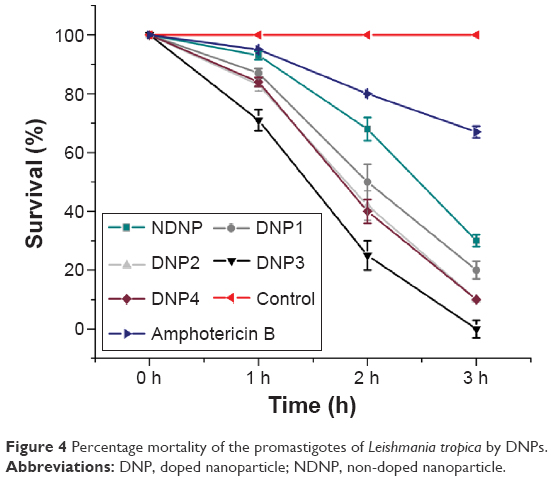 | Figure 4 Percentage mortality of the promastigotes of Leishmania tropica by DNPs. |
FTIR of lipid peroxidation products
FTIR is an easygoing, immediate, nonexpensive, and nondestructive technology and is very helpful to study the pathway of lipid degradation via oxidative stress.28 FTIR spectrometry was performed for the qualitative analysis of the formed lipid peroxidation products. In Table 1, comparison of treated and untreated samples showed a large variation affirming the formation of lipid peroxidation. A look into the entire data reveals evidence of lipid peroxidation and also provides information about the derivatives produced during lipid peroxidation. In the current study, FTIR spectra showed the appearance of the band at 929 cm−1 and disappearance at 751 cm−1. It was evident that the dienes (C=C) changed their arrangement that was lacking in normal lipids. The observed bands at 1,019 cm−1 (range of 1,000–1,140 cm−1) in control and also 1,043 and 1,023 cm−1 could be the C–O stretching vibration of ketones normally present in lipids. Similarly, bands between 1,100 and 1,350 cm−1 might belong to =C–O stretching of the carboxyl group of lipid, which were present in both control at 1,311 cm−1 and treated samples at 1,308, 1,309, and 1,310 cm−1, respectively. However, there were other band ranges (1,331–1,334 cm−1) that were not present in control. It showed the presence of carboxyl groups, which experienced a change and were converted to lipid peroxidation. Also, there were some C=C found at 1,517, 1,518, 1,519, and 1,546 cm−1, which were modified forms of normal lipid dienes. The disappearance of band at 1,660 cm−1 in control and formation of new bands in treated samples at 1,517–1,546 cm−1 confirmed the formation of modified dienes. Aldehydes and ketones produced as secondary products were also the degraded products formed during lipid peroxidation in the current study.28 Compared to the control, the bands found at 1,700 cm−1 were the best evidence of C=O stretching of aldehydes and ketones. The bands observed at a range of 2,500–3,400 cm−1 could be the belongings of acids COOH stretching vibration of carboxylic acid of lipids. These were present both in the control and treated samples at 2,994 and 2,995 cm−1, respectively. However, there were two bands at 3,026 and 3,027 cm−1 position, which could be acids COOH stretching vibration. It might be the modified forms of carboxylic acids, which were under the process of conversion into aldehyde or ketones. The alcohols were the final products of lipid peroxidation.4 It was also found that –OH stretching vibration at 3,505 cm−1 could be alcohols. Conclusively, FTIR has shown a clear picture of lipid peroxidation.
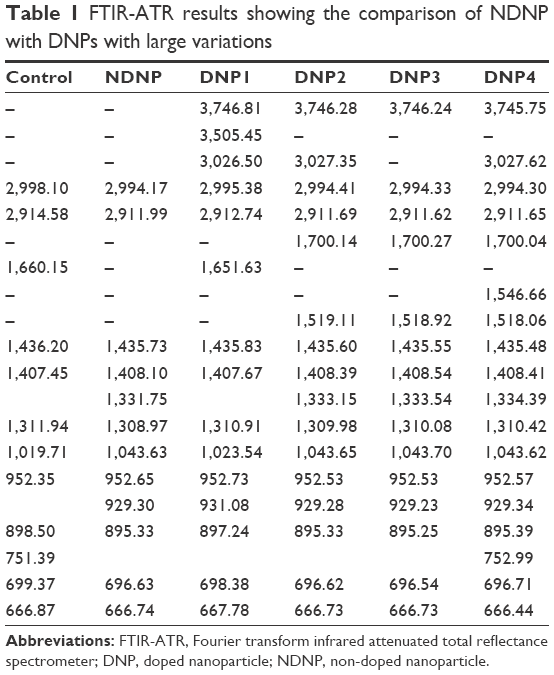 | Table 1 FTIR-ATR results showing the comparison of NDNP with DNPs with large variations |
Conjugated dienes
The quantification of lipid peroxidation was started by primarily formed conjugated dienes, which was the result of the attack of any radical species on methylene group near the carbon double bond. The resultant carbon radical was unstable and to stabilize itself by molecular rearrangement produced conjugated dienes.4 The experiments were performed in a time-dependent manner. Initially, the cells were treated for 3 hours and each hour, lipids were isolated using chloroform:methanol (2:1) solution, a standard protocol found best for the extraction of lipids.29 The DNPs produced more of the conjugated dienes as compared to nondoped ZnO (Figure 5).
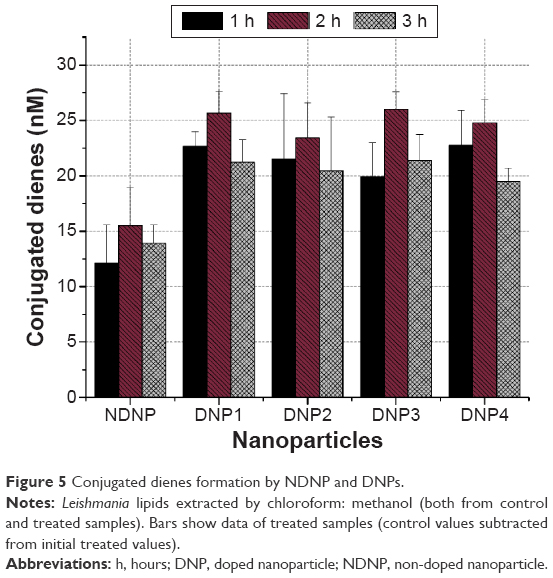 | Figure 5 Conjugated dienes formation by NDNP and DNPs. |
To compare the amount of dienes formed during each hour and the different nanoparticles, a two-way ANOVA was performed, which showed that the effect of time and nanoparticle type on the production of conjugated dienes was significant (P<0.05). The pair-wise comparison revealed that the difference mainly exists due to the higher dienes formation in the second hour (P<0.05). Meanwhile, the effect with nanoparticle type was present due to a significant difference in NDNP and the four DNPs to produce dienes (P<0.05). In 3-hour span, conjugated dienes by the NDNP were significantly lower compared to those by DNPs (P<0.05) as confirmed by the pair-wise comparison, portraying the positive effect of dopant in the ZnO lattice. ZnO is normally activated by UV light to produce ROS;30 thus, NDNP was mildly activated by sunlight as sunlight contains 5% UV portion, not enough to fully activate the NDNP. In the case of DNPs, the ROS formation started due to the excitation of these nanoparticles by the visible portion of sunlight because of the addition of dopant, that is, silver and copper.
Lipid hydroperoxides
Upon production of ROS, the reaction started as the carbon-centered radical was stabilized by the molecular rearrangement to form a conjugated diene. However, the next coming carbon-centered radical reacted with oxygen to give a peroxyl radical to stabilize itself. Peroxyl radicals have the ability to abstract a hydrogen atom from the next fatty acid side chain, thus giving rise to the lipid hydroperoxides.31 FOX assay was used to quantify the hydroperoxide concentration. In FOX, the hydroperoxides have the ability to oxidize Fe2+ to Fe3+ and begin the formation of a complex between ferric ions and xylenol orange.32 The results were consistent with no effect of the nature of the dopant and time (Figure 6). Hydroperoxide pattern by the nanoparticles was mostly similar to dienes except in the third hour.
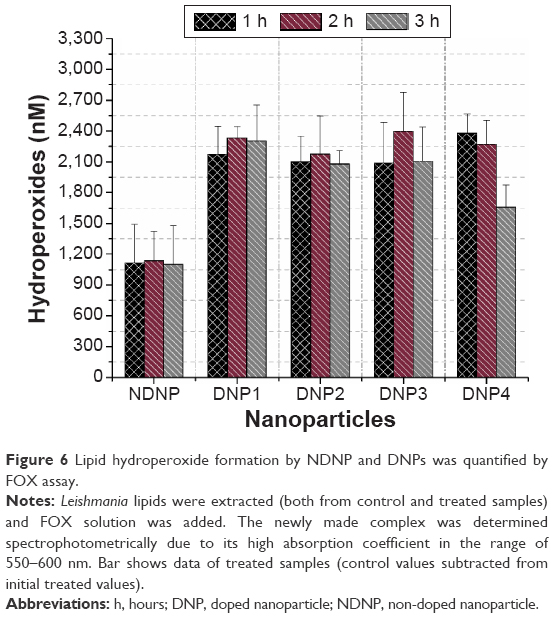 | Figure 6 Lipid hydroperoxide formation by NDNP and DNPs was quantified by FOX assay. |
Like dienes, a two-way ANOVA and pair-wise comparison of hydroperoxides for each hour and nanoparticles were performed. It showed that the effect of time and nanoparticle type on the production of hydroperoxides was significant (P<0.05) and also the difference mainly existed due to higher hydroperoxide formation in the second hour (P<0.05). Moreover, similar to dienes, hydroperoxides by the NDNP were significantly lower compared to DNPs (P<0.05) as confirmed by the pair-wise comparison in the 3-hour span.
MDA quantification
Lipid peroxides are usually degraded into secondary products, so the quantification of peroxides does not give the real measurement of oxidative stress.28 Thiobarbituric acid reactive substances assay was used to detect and quantify any MDAs formed.33,34 It is a common method to measure oxidative change in lipids due to free radicals.35 It was found that there was a continuous increase in the MDA formation in each hour (Figure 7).
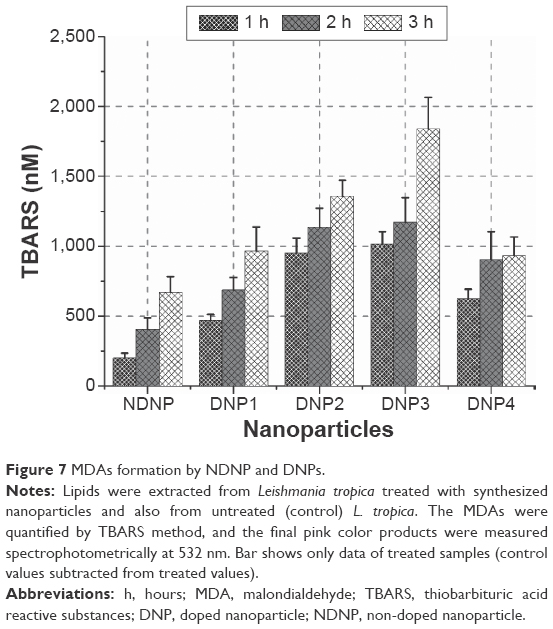 | Figure 7 MDAs formation by NDNP and DNPs. |
Two-way ANOVA showed a highly significant formation of MDA upon comparison with nanoparticle type and time (P<0.01). The pair-wise comparison revealed that the difference mainly existed due to higher MDA formation in the third hour (P<0.01). The MDA production was found indirectly dependent on dienes (P<0.01) and directly on the hydroperoxides (P<0.01) with the exception only in the third hour against hydroperoxides (P>0.05). Although, the effect with nanoparticle type was present due to a significant difference in NDNP and the four DNPs to produce MDA (P<0.05). In the 3-hour span, MDA production by the NDNP was significantly lower compared to DNPs (P<0.05) as confirmed by the pair-wise comparison.
The MDAs were not the end products of the lipid peroxidation because of the inordinate amount of ROS. These hydroperoxides undergo further degradation and are normally converted to HNEs, ethanol, methanol, or gases such as ethane and to end products of CO2 and H2O.36 For the detection and quantification of end products, especially HNEs, gas chromatography mass spectrometry (GC–MS) was performed. It was found that the conversion of lipids to the final products was very fast and thus no HNEs were detected in the current study. The general order of end product was water > methane > methanol > ethanol as confirmed by GC–MS (Table 2).
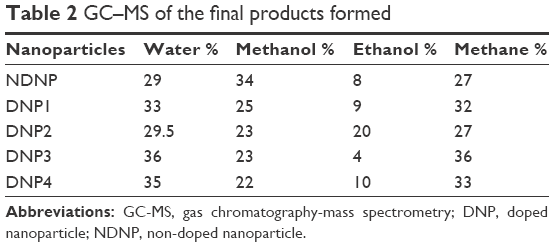 | Table 2 GC–MS of the final products formed |
Lipid versus protein hydroperoxides
In the current study, oxidative damages caused by ROS were more responsible for lipid peroxidation rather than protein oxidation37 because of the production of more lipid hydroperoxides. Although proteins are the first target of ROS27 and fragmentation of polypeptide chains, modification of amino acids to hydroxyl derivatives is a possible outcome of the ROS-mediated oxidative burst.38 But, in the current case, lipids were the major target of the ROS and this might be the result of the thick lipophosphoglycan layer. Also, the major portion of Leishmania lipids are phospholipids (70%) that are susceptible to ROS.39 Currently, the DNPs were responsible for more hydroperoxides while NDNP was capable of inducing equal amount of both lipid and protein hydroperoxides moieties. Figure 8 represents the third hour results of both the protein and lipid hydroperoxides. The lipids hydroperoxides were produced at a concentration of more than twofold upon comparison with the protein hydroperoxides.
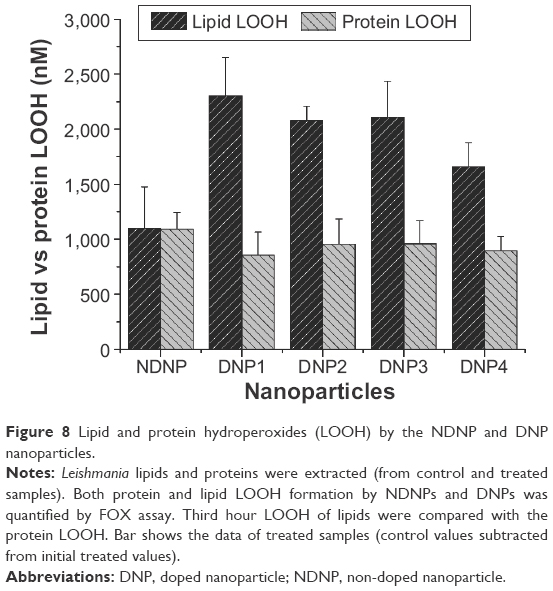 | Figure 8 Lipid and protein hydroperoxides (LOOH) by the NDNP and DNP nanoparticles. |
Protein thiols
Protein oxidation products are generally formed by the oxidation of different amino acids. The thiol of cysteine is one such target that can be oxidized by the ROS,40 and lipid peroxidation products can also give rise to thiol oxidized products.41 In the present study, it was found that nanoparticles with no or low concentration of dopants were causing more oxidation of the protein thiols compared to those with higher dopant concentration, that is, DNP2 and DNP3. DNP4 was responsible for the highest quantity of thiol oxidation products (102 nM) while DNP2 and DNP3 were producing <40 nM (Figure 9).
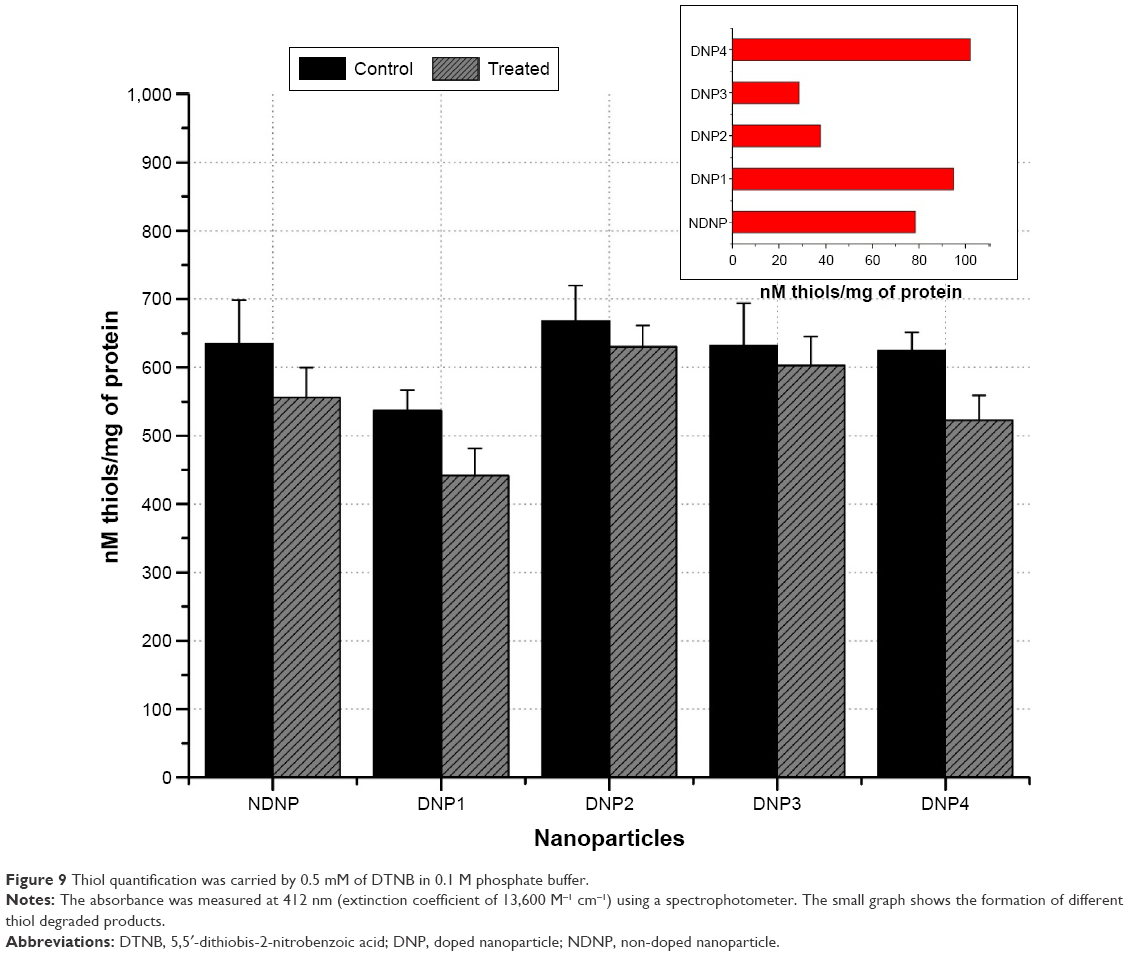 | Figure 9 Thiol quantification was carried by 0.5 mM of DTNB in 0.1 M phosphate buffer. |
Protein carbonyls
Protein carbonyls are relatively difficult to induce compared to methionine and cysteine derivatives and, thus, these might be reflective of more severe cases of oxidative stress.37 ROS are capable of damaging proteins in a specific manner by oxidation of backbone or damaging the side chains of lysine, arginine, histidine, proline, glutamic acid, and threonine.42 These carbonyls are stable for long durations and can be detected by DNPH, which is involved in the derivatization of carbonyl group to give DNPH products that can be easily detected at 370 nm.20 The current study reveals that the NDNP was producing 1.25 nM of carbonyl, which was lower compared to the DNPs (Figure 10). The silver-doped ZnO was producing higher quantities of carbonyls, that is, 2.08, 2.77, and 3.22 nM by DNP1, DNP2, and DNP3 upon comparison with both the NDNP and copper doped DNP4 (P<0.01). The exception was found among DNP1 and DNP4 in which the DNP4 was eliciting more carbonyls and this was because of the higher ROS generation by DNP4 than DNP1.16
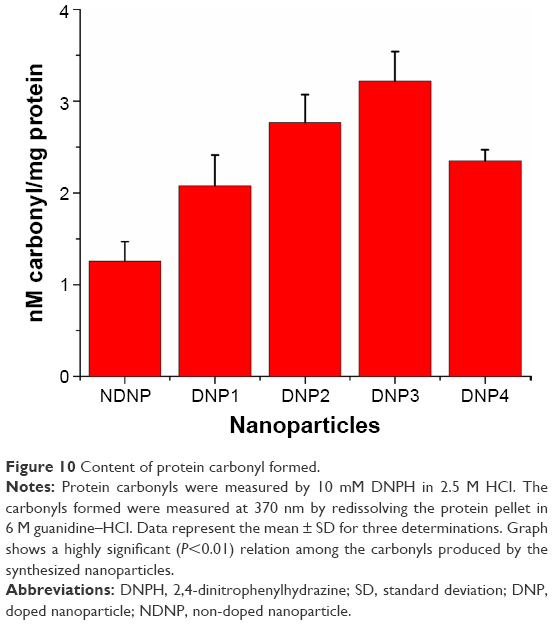 | Figure 10 Content of protein carbonyl formed. |
Conclusion
Previously, it was found that ZnO nanoparticles causes membrane permeability. It can be concluded that lipid peroxidation affects the biophysical properties especially of membranes that change the phase properties, affecting membrane fluidity and thus compromising the barrier capability of membrane, making it fragile and leaky. The elevated level of carbonyl is also a sign of protein dysfunction, which also preceded the cytoskeleton instability. This led to the possibility of membrane permeability ultimately leading to Leishmania cell death.
In a few cases, it was found that there was no statistical difference among the doped nanoparticles especially in case of dienes and lipid peroxides but it can be elucidated that there is a clear difference with the nondoped nanoparticle thus representing more potency of doping of nanoparticles in antileishmaniasis. It is suggested that research should not be restricted to ZnO nanoparticles, and other metal nanoparticles should also be studied.
Acknowledgments
The authors thankfully acknowledge Dr Zabta Khan Shinwari (Molecular Systematics and Ethnobotany Lab, Quaid-i-Azam University, Islamabad) for providing some of the lab facilities. The authors are thankful to Mohammad Ghasemi Rad and Tariq Khan for proofreading the manuscript. The L. tropica KWH23 was gifted by Professor Akram Shah, University of Peshawar, Pakistan. The strain was acquired in 2010 during Dr Nazma’s PhD at the London School of Hygiene and Tropical Medicine, UK. The authors are thankful to both Drs Akram Shah and Nazma.
Disclosure
The authors report no conflicts of interest in this work.
References
Palmieri B, Sblendorio V. Oxidative stress tests: overview on reliability and use. Eur Rev Med Pharmacol Sci. 2007;11(6):308–342. | ||
Simon HU, Haj-Yehia A, Levi-Schaffer F. Role of reactive oxygen species (ROS) in apoptosis induction. Apoptosis. 2000;5(5):415–418. | ||
Catala A. Lipid peroxidation of membrane phospholipids generates hydroxy-alkenals and oxidized phospholipids active in physiological and/or pathological conditions. Chem Phys Lipids. 2009;157(1):1–11. | ||
Devasagayam T, Boloor K, Ramasarma T. Methods for estimating lipid peroxidation: an analysis of merits and demerits. Indian J Biochem Biophys. 2003;40(5):300–308. | ||
Yadav UC, Ramana KV. Regulation of NF-B-induced inflammatory signaling by lipid peroxidation-derived aldehydes. Oxid Med Cell Longev. 2013;2013:690545. | ||
Berlett BS, Stadtman ER. Protein oxidation in aging, disease, and oxidative stress. J Biol Chem. 1997;272(33):20313–20316. | ||
Hawkins CL, Morgan PE, Davies MJ. Quantification of protein modification by oxidants. Free Radic Biol Med. 2009;46(8):965–988. | ||
Gradoni L. Epidemiological surveillance of leishmaniasis in the European Union: operational and research challenges. Euro Surveill. 2013;18(30). | ||
Sosa N, Capitan Z, Nieto J, et al. Randomized, double-blinded, phase 2 trial of WR 279,396 (paromomycin and gentamicin) for cutaneous leishmaniasis in Panama. Am J Trop Med Hyg. 2013;89(3):557. | ||
Molyneux D, Killick-Kendrick R, Peters W. Morphology, ultrastructure and life cycles. In: Peters W, Killick-Kendrick R, editors. The Leishmaniases in Biology and Medicine. Volume I. Biology and epidemiology. London: Academic Press; 1987:121–176. | ||
Wang C, Tao H, Cheng L, Liu Z. Near-infrared light induced in vivo photodynamic therapy of cancer based on upconversion nanoparticles. Biomaterials. 2011;32(26):6145–6154. | ||
Demidova T, Hamblin M. Photodynamic therapy targeted to pathogens. Int J Immunopathol Pharmacol. 2004;17(3):245. | ||
Dutta S, Ongarora BG, Li H, Maria da Graca HV, Kolli BK, Chang KP. Intracellular targeting specificity of novel phthalocyanines assessed in a host-parasite model for developing potential photodynamic medicine. PLoS One. 2011;6(6):e20786. | ||
Juarranz A, Jaen P, Sanz-Rodríguez F, Cuevas J, Gonzalez S. Photodynamic therapy of cancer. Basic principles and applications. Clin Transl Oncol. 2008;10(3):148–154. | ||
Nadhman A, Nazir S, Khan MI, et al. PEGylated silver doped zinc oxide nanoparticles as novel photosensitizers for photodynamic therapy against Leishmania. Free Radic Biol Med. 2014;77:230–238. | ||
Nadhman A, Nazir S, Khan MI, et al. Visible-light-responsive ZnCuO nanoparticles: benign photodynamic killers of infectious protozoans. Int J Nanomedicine. 2015;10:6891–6903. | ||
Yu H, Irie H, Hashimoto K. Conduction band energy level control of titanium dioxide: toward an efficient visible-light-sensitive photocatalyst. J Am Chem Soc. 2010;132(20):6898–6899. | ||
Catala A. An overview of lipid peroxidation with emphasis in outer segments of photoreceptors and the chemiluminescence assay. Int J Biochem Cell Biol. 2006;38(9):1482–1495. | ||
Fu Q. Radiation (Solar). Vol 5. Amsterdam [u.a.]: Academic Press; 2003. | ||
Levine RL, Williams JA, Stadtman ER, Shacter E. Carbonyl assays for determination of oxidatively modified proteins. Methods Enzymol. 1994;233:346–357. | ||
Veronese FM, Pasut G. PEGylation, successful approach to drug delivery. Drug Discov Today. 2005;10(21):1451–1458. | ||
Fishburn CS. The pharmacology of PEGylation: balancing PD with PK to generate novel therapeutics. J Pharm Sci. 2008;97(10):4167–4183. | ||
Halliwell B, Gutteridge JM. Free Radicals in Biology and Medicine. Vol 135. Oxford: Oxford University Press; 1999. | ||
Drummen GP, Makkinje M, Verkleij AJ, Op den Kamp JA, Post JA. Attenuation of lipid peroxidation by antioxidants in rat-1 fibroblasts: comparison of the lipid peroxidation reporter molecules cis-parinaric acid and C11-BODIPY 581/591 in a biological setting. Biochim Biophys Acta. 2004;1636(2):136–150. | ||
Huarac JCB, Tomar M, Singh S, Perales-Perez O, Rivera L, Pena S. Multifunctional Fe3O4/ZnO core-shell nanoparticles for photodynamic therapy. NSTI-Nanotech. Vol 2010. Danville, CA:NSTI:405–408. | ||
Lee SE, Park YS. Role of lipid peroxidation-derived α, β-unsaturated aldehydes in vascular dysfunction. Oxid Med Cell Longev. 2013;2013:629028. | ||
Davies MJ. Singlet oxygen-mediated damage to proteins and its consequences. Biochem Biophys Res Commun. 2003;305(3):761–770. | ||
Barriuso B, Astiasaran I, Ansorena D. A review of analytical methods measuring lipid oxidation status in foods: a challenging task. Eur Food Res Technol. 2013;236(1):1–15. | ||
Arjuna A, Somal P. Effect of extraction methods on lipid and fatty acid composition by mortierella Ramanniana. IJSR. 2013;3(3):1–3. | ||
Arooj S, Nazir S, Nadhman A, et al. Novel ZnO: Ag nanocomposites induce significant oxidative stress in human fibroblast malignant melanoma (Ht144) cells. Beilstein J Nanotechnol. 2015;6(1):570–582. | ||
Södergren E. Lipid Peroxidation In Vivo: Evaluation and Application of Methods for Measurement. Uppsala: Acta Universitatis Upsaliensis; 2000. | ||
Meisner P, Gebicki JL. Determination of hydroperoxides in aqueous solutions containing surfactants by the ferrous oxidation-xylenol orange method. Acta Biochim Pol. 2009;56(3):523–527. | ||
Moselhy HF, Reid RG, Yousef S, Boyle SP. A specific, accurate, and sensitive measure of total plasma malondialdehyde by HPLC. J Lipid Res. 2013;54(3):852–858. | ||
Papastergiadis A, Mubiru E, Van Langenhove H, De Meulenaer B. Malondialdehyde measurement in oxidized foods: evaluation of the spectrophotometric thiobarbituric acid reactive substances (TBARS) test in various foods. J Agric Food Chem. 2012;60(38):9589–9594. | ||
Sabuncuoglu S, Orhan H. Interference of metals and medications with the detection of lipid peroxidation in humans by photometric TBARS assay. Curr Anal Chem. 2013;9(3):457–462. | ||
Ayala A, Munoz MF, Arguelles S. Lipid peroxidation: production, metabolism, and signaling mechanisms of malondialdehyde and 4-hydroxy-2-nonenal. Oxid Med Cell Longev. 2014;2014:1–31. | ||
Dalle-Donne I, Rossi R, Giustarini D, Milzani A, Colombo R. Protein carbonyl groups as biomarkers of oxidative stress. Clin Chim Acta. 2003;329(1):23–38. | ||
Fagan JM, Sleczka BG, Sohar I. Quantitation of oxidative damage to tissue proteins. Int J Biochem Cell Biol. 1999;31(7):751–757. | ||
Glew R, Saha A, Das S, Remaley A. Biochemistry of the Leishmania species. Microbiol Rev. 1988;52(4):412. | ||
Wright SK, Viola RE. Evaluation of methods for the quantitation of cysteines in proteins. Anal Biochem. 1998;265(1):8–14. | ||
Rudolph TK, Freeman BA. Transduction of redox signaling by electrophile-protein reactions. Sci Signal. 2009;2(90):7. | ||
Dalle-Donne I, Giustarini D, Colombo R, Rossi R, Milzani A. Protein carbonylation in human diseases. Trends Mol Med. 2003;9(4):169–176. |
 © 2016 The Author(s). This work is published and licensed by Dove Medical Press Limited. The full terms of this license are available at https://www.dovepress.com/terms.php and incorporate the Creative Commons Attribution - Non Commercial (unported, v3.0) License.
By accessing the work you hereby accept the Terms. Non-commercial uses of the work are permitted without any further permission from Dove Medical Press Limited, provided the work is properly attributed. For permission for commercial use of this work, please see paragraphs 4.2 and 5 of our Terms.
© 2016 The Author(s). This work is published and licensed by Dove Medical Press Limited. The full terms of this license are available at https://www.dovepress.com/terms.php and incorporate the Creative Commons Attribution - Non Commercial (unported, v3.0) License.
By accessing the work you hereby accept the Terms. Non-commercial uses of the work are permitted without any further permission from Dove Medical Press Limited, provided the work is properly attributed. For permission for commercial use of this work, please see paragraphs 4.2 and 5 of our Terms.