")
Back to Journals » Veterinary Medicine: Research and Reports » Volume 7
Animal health syndromic surveillance: a systematic literature review of the progress in the last 5 years (2011–2016)
Received 16 June 2016
Accepted for publication 13 October 2016
Published 15 November 2016 Volume 2016:7 Pages 157—170
DOI https://doi.org/10.2147/VMRR.S90182
Checked for plagiarism Yes
Review by Single anonymous peer review
Peer reviewer comments 3
Editor who approved publication: Professor Young Lyoo
Fernanda C Dórea,1 Flavie Vial2
1Department of Disease Control and Epidemiology, National Veterinary Institute (SVA), Uppsala, 2Epi-Connect, Skogås, Sweden
Abstract: This review presents the current initiatives and potential for development in the field of animal health surveillance (AHSyS), 5 years on from its advent to the front of the veterinary public health scene. A systematic review approach was used to document the ongoing AHSyS initiatives (active systems and those in pilot phase) and recent methodological developments. Clinical data from practitioners and laboratory data remain the main data sources for AHSyS. However, although not currently integrated into prospectively running initiatives, production data, mortality data, abattoir data, and new media sources (such as Internet searches) have been the objective of an increasing number of publications seeking to develop and validate new AHSyS indicators. Some limitations inherent to AHSyS such as reporting sustainability and the lack of classification standards continue to hinder the development of automated syndromic analysis and interpretation. In an era of ubiquitous electronic collection of animal health data, surveillance experts are increasingly interested in running multivariate systems (which concurrently monitor several data streams) as they are inferentially more accurate than univariate systems. Thus, Bayesian methodologies, which are much more apt to discover the interplay among multiple syndromic data sources, are foreseen to play a big part in the future of AHSyS. It has become clear that early detection of outbreaks may not be the principal expected benefit of AHSyS. As more systems will enter an active prospective phase, following the intensive development stage of the last 5 years, the study envisions AHSyS, in particular for livestock, to significantly contribute to future international-, national-, and local-level animal health intelligence, going beyond the detection and monitoring of disease events by contributing solid situation awareness of animal welfare and health at various stages along the food-producing chain, and an understanding of the risk management involving actors in this value chain.
Keywords: aberration detection, animal health intelligence, biosurveillance, cluster detection, outbreak signal, temporal monitoring
Introduction
In 2011, Dórea et al1 provided the first comprehensive review of animal health syndromic surveillance (AHSyS) initiatives, concluding that the field was incipient but fast growing. There followed a move toward inventorying the different ongoing research projects and setting up some best-practice guidelines for prospective implementation. The European Triple-S project subsequently produced an inventory of current and planned European AHSyS systems from 12 countries;2 and the first European guidelines on syndromic surveillance (SyS) in human and animal health.3 Finally, in 2015, Vial and Berezowski4 proposed a practical approach to AHSyS system development based on population health surveillance theory.
The Triple-S project also recently proposed a revised definition of SyS as “the real-time (or near real-time) collection, analysis, interpretation, and dissemination of health-related data to enable the early identification of the impact (or absence of impact) of potential human or veterinary public-health threats which require effective public health action.”3 This definition highlights the focus on the methodology and purpose of SyS, as opposed to the previous focus on the type of data used from previous terminologies.1
In this systematic review, the definition proposed by the Triple-S project was adopted, and the initiatives and methodologies making use of animal health data for SyS in their different stages of development were documented. By reviewing the methods used in these initiatives, this study aimed to present the current state of the art in the AHSyS field, as well as highlight the challenges yet to be overcome and the future directions envisioned.
Search methods and results
Keyword searches were constructed to look for papers that contained (in the title, keywords, or abstract), any of the following expressions: “syndromic surveillance” OR “early warning” OR “outbreak detection” OR “aberration detection” OR “anomaly detection” OR “early detection” OR “cluster detection.” The searches were placed in PubMed and Scopus on February 19, and manual search was performed in the Proceedings of the Annual Meetings of the Society for Veterinary Epidemiology and Preventive Medicine (2011–2015), the International Conferences on Animal Health Surveillance (2011 and 2014), the International Symposia on Veterinary Epidemiology and Economics (2012 and 2015), and the Annual Meetings of the International Society for Disease Surveillance (ISDS 2011–2015). Figure 1 illustrates the reviewing process.
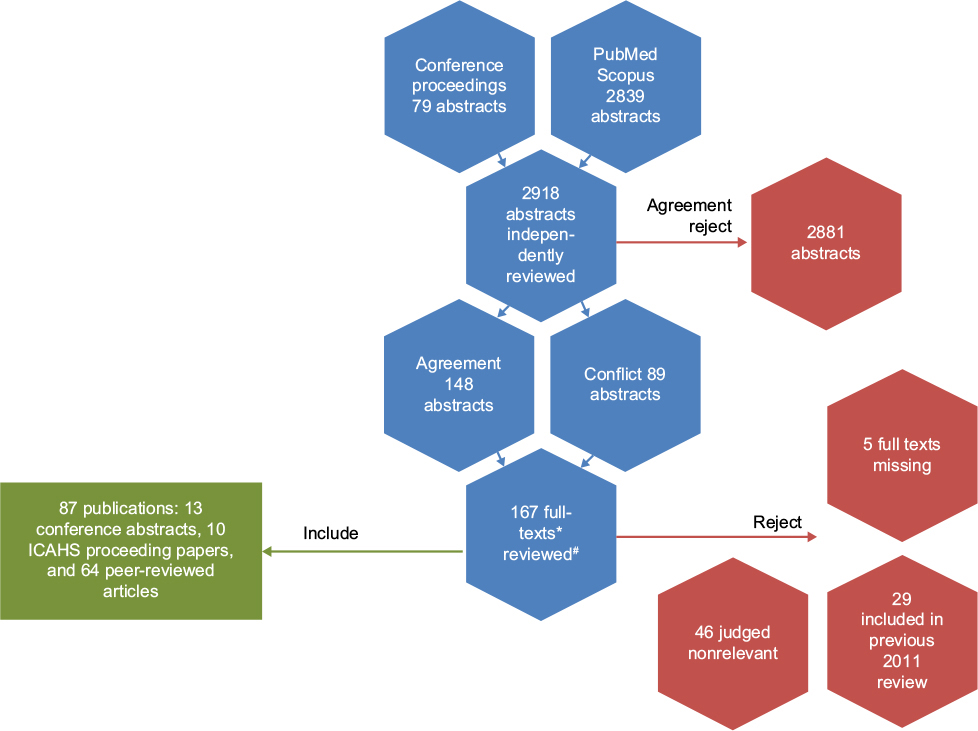 | Figure 1 Illustration of the reviewing process for this systematic review Notes: *Abstracts taken from conference proceedings which referred to works later published as full peer-reviewed articles were excluded. #Full texts were split between authors. Abbreviation: ICAHS, International Conferences on Animal Health Surveillance. |
Overview of AHSyS initiatives and methodological developments
Table 1 presents a summary of published ongoing AHSyS initiatives, and Table 2 presents the peer-reviewed publications investigating the potential of different data sources or of statistical methods for outbreak detection for future implementation in AHSyS. This review presents and discusses the initiatives first grouped by data types: production data, clinical data, laboratory data, mortality data, abattoir data, and media sources. Then, the statistical methods and issues related to validation, evaluation, and follow-up of alarms were reviewed.
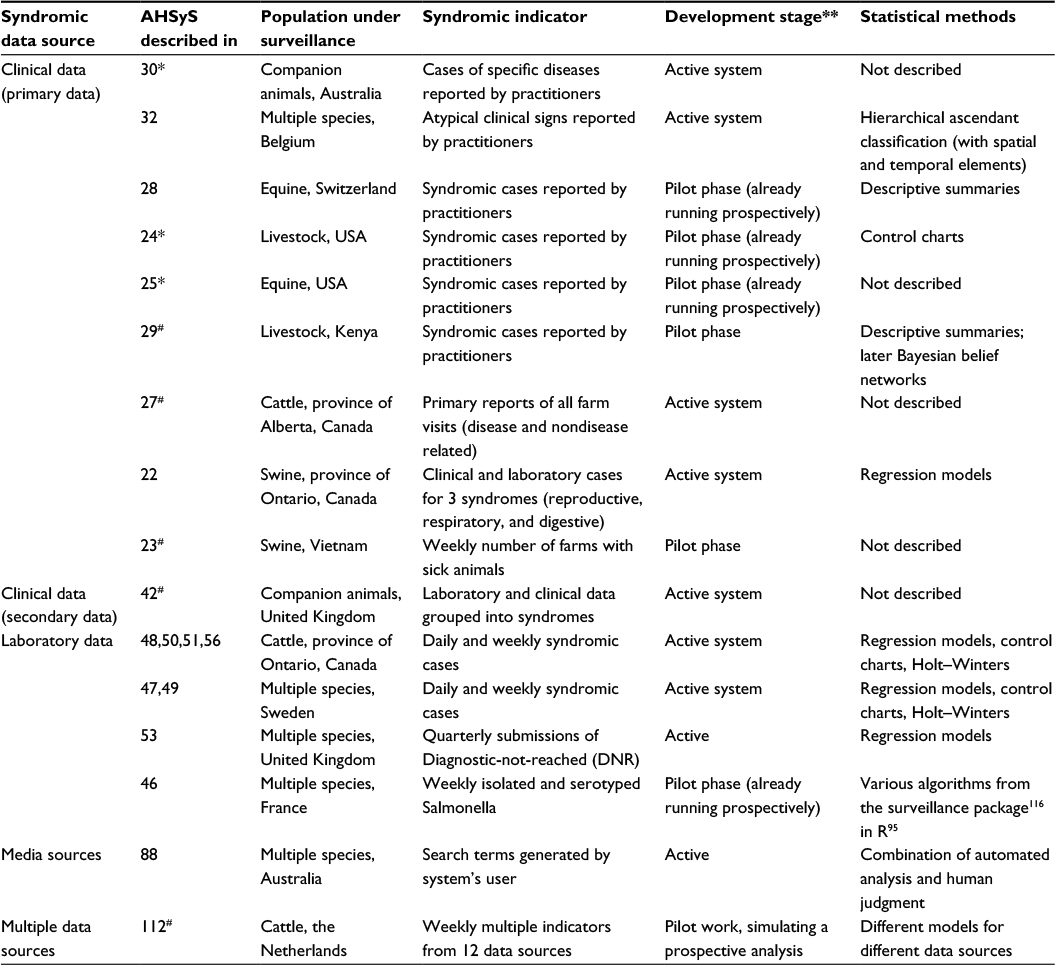 | Table 1 Published ongoing AHSyS initiatives (active or pilot study) Notes: *Abstract. #ICAHS proceedings paper (3 pages, subjected to peer approval but not review). **Systems reported to be fully implemented and operational, that is, with continuous retrieval and analysis of data prospectively, were labeled as “active systems.” Those in which data were analyzed retrospectively, and prospective data retrieval and analysis is still being tested, were labeled as in “pilot phase.” Abbreviations: AHSyS, animal health syndromic surveillance; ICAHS, International Conferences on Animal Health Surveillance. |
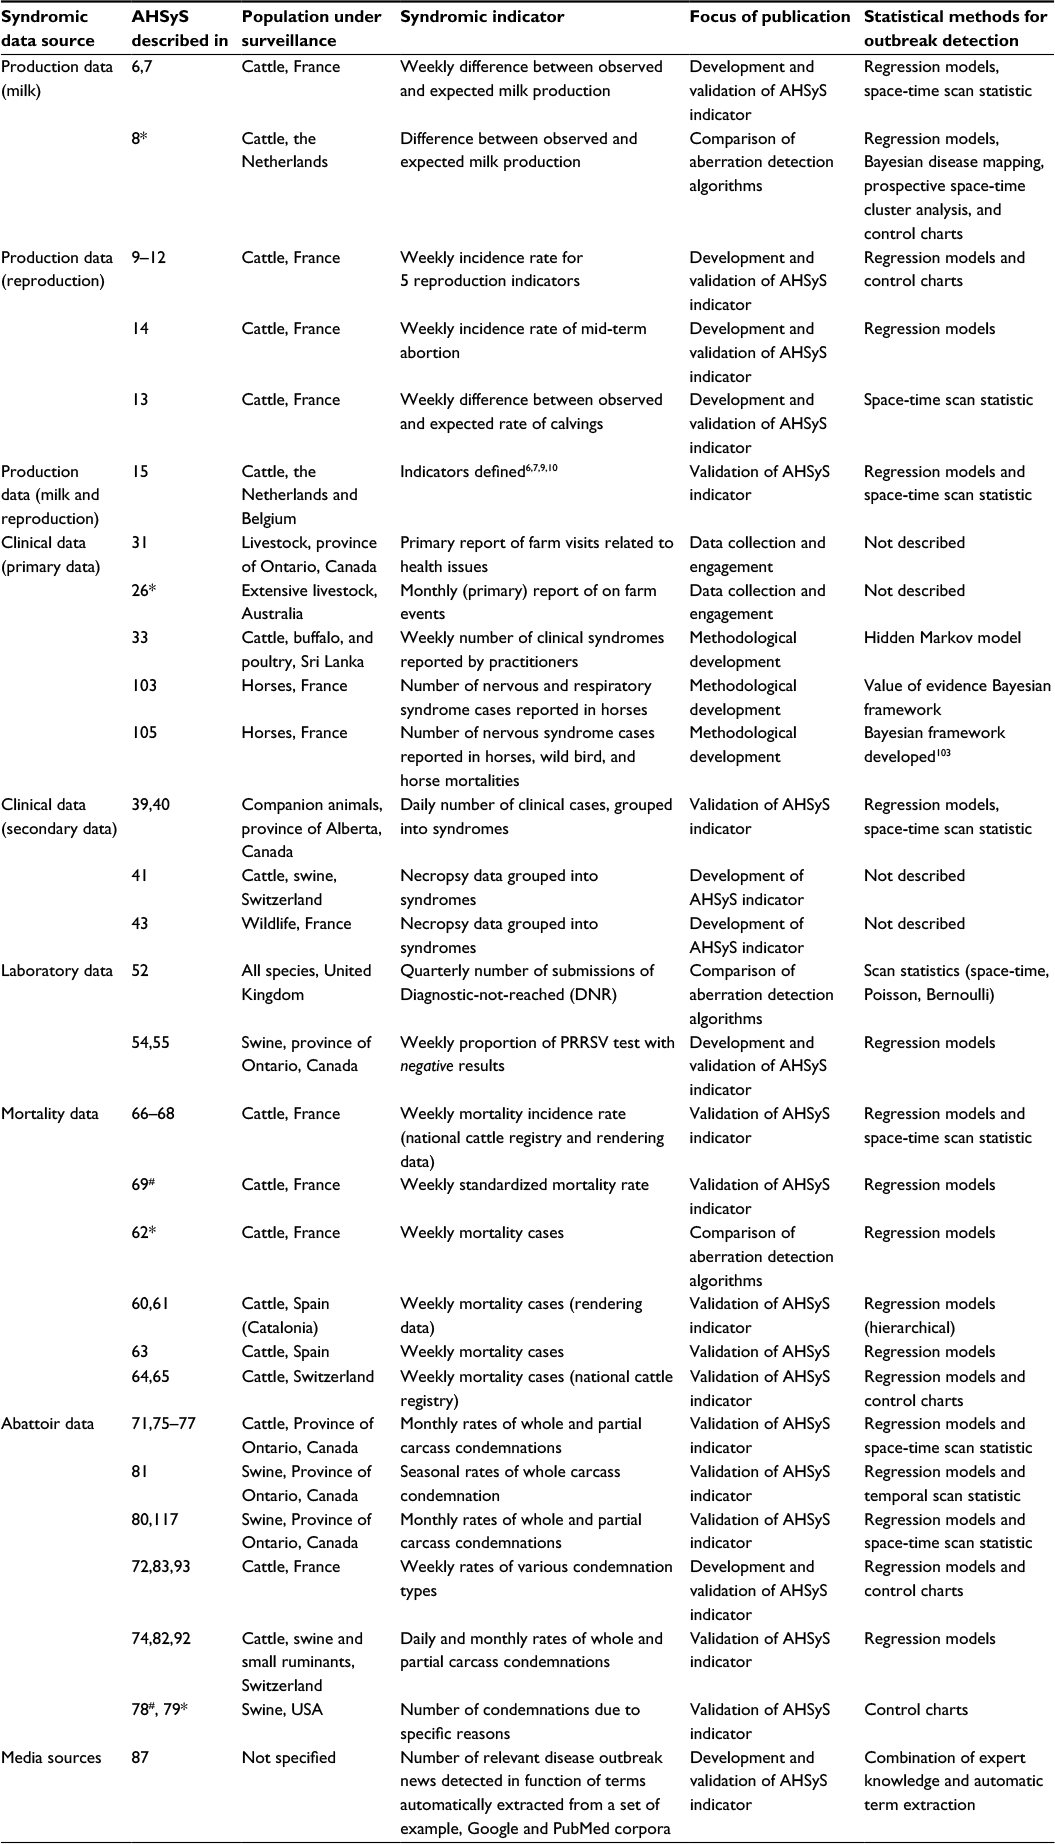 | Table 2 Peer-reviewed publications investigating the potential of different data sources or of statistical methods for outbreak detection for use in AHSyS Notes: *Abstract. #ICAHS proceedings paper (3 pages, subjected to peer approval but not review). Abbreviations: AHSyS, animal health syndromic surveillance; ICAHS, International Conferences on Animal Health Surveillance; PRRSV, porcine reproductive and respiratory syndrome virus. |
Syndromic data sources
Gates et al5 provided an extensive review of the characteristics of data sources and the drivers for their selection in biosurveillance. This study discusses the specific AHSyS methodological issues associated with each data source.
Production data
With the use of electronic records reaching farms, data generated on-farm, and recorded individually for each animal regarding different aspects of productivity and well-being (hereby generalized as “production data”), have emerged as the most widely evaluated data source for AHSyS.6–15 These data offer high population coverage and the shortest time lag between a health event and its potential detection. Since such records are generated continuously, and not triggered by specific health events (e.g., unlike laboratory test requests), the main methodological challenge becomes the definition of the events to monitor.
Madouasse et al evaluated the performance of a continuous indicator, the weekly difference between observed and expected milk production, initially using simulated outbreaks6 and later real outbreak data from the 2007 France epidemic of bluetongue virus (BTV).7 Syndromic indicators were derived from reproductive data by Marceau et al9,10 “3 week return-to-service,” “delayed return-to-service,” “very late return-to-service,” “premature calving,” and “short gestation” (we refer to Marceau et al10 for definitions). All indicators, but the “3 weeks return to service,” were associated with temporal clusters (statistically significant increase in the number of events, compared to the modeled expectation) during the BTV spread in France in 2007, with the “short gestation” indicator showing the highest number of alarms. A similar approach was used by Bronner et al14 to validate the indicator “mid-term abortion incidence rate” (refer Bronner et al14 for definition). After concluding that there is under-reporting of abortions,16 Bronner et al13 proposed monitoring the number of calvings in beef cattle, under the assumption that an increase in abortions would result in a decrease in the expected number of calvings.
Unlike AHSyS, precision livestock farming17 tools may not necessarily focus on the early detection of health events and may instead be applied to the monitoring of animal welfare18 or farm processes (e.g., feeding). However, many studies have sought to extract health-related information from a wide range of data and are worth highlighting. For example, the flock movement patterns of live chickens may allow detection of Campylobacter-positive flocks earlier than conventional on-farm microbiological methods.19 Biosensors and accelerometers embedded in pigs’ ear tag can detect African swine fever infection onset as an increase in body temperature and decrease in movement before the observation of clinical signs and the positive qualitative polymerase chain reaction detection of the virus.20 While on dairy farms, the detection of shifts in milk yield recorded by milking robots may be indicative of clinical mastitis.21
Clinical data
Primary generation of data (i.e., direct reporting of specific health events) was the most common mode of operation of clinical-based AHSyS systems22–32 (9 from the 10 implemented systems listed in Table 1). Sustainability remains a common struggle reported by AHSyS systems relying on generating primary data,28,29 with different forms of incentives for participation being proposed, from direct reimbursements per report submitted,27 to credit in diagnostic laboratories.31 The development of AHSyS during the golden age of mobile electronic devices saw the creation of reporting systems based on mobile applications, both in developed24,25,28 and developing countries.29,33 Electronic systems based on mobile applications can potentially offer a platform to integrate AHSyS reporting to the clinicians’ routine activities, providing software that can for instance facilitate their management of clients and billing,28 or even help them to decide on a diagnosis based on the clinical signs observed and disease prevalence in the area.29 Struchen et al28 provided a thorough investigation of the reasons for low participation in such systems, reporting problems such as the need to address user-friendliness and security during data collection and transfer, resistance from the animal owners, and the lack of understanding by veterinarians of the system’s importance or utility.
Systems based on the primary notification of events are similar to traditional event-based surveillance34,35 and seem to suffer from similar problems. Bronner et al16,36–38 provided an extensive discussion and evaluation of engagement issues associated with the clinical brucellosis surveillance system in France, based on the notification of abortions. Her series of papers did not intend to classify this event-based notification system as a type of SyS. However, her works fell into the keyword search of the present study, and were considered relevant for understanding the potential and shortcomings of systems for continuous, prospective surveillance, which are based on passive notification of cases.
AHSyS primarily emerged as a way to extract information from already existing data, which does not rely on an initiative to report.39–43 Such secondary generation of clinical data was most often encountered in small animal practices.39,40,42 In human medicine, text mining – the analysis of data contained in natural language text – is applied to clinical records in many public health surveillance systems.44 Such data are often unstructured and necessitate the development of text mining methods ranging from hand-written rule-based systems to fully automated methods using machine learning. The text mining of veterinary reports faces additional challenges such as the multiple species observed43 and a less controlled vocabulary.45 Many of the literature sources present only pilot trials of a system: for example, the text mining of medical records in 12 Canadian practices to identify clusters of enteric syndromes in pets39 or the text mining of veterinary postmortem reports in one Swiss animal pathology laboratory.41 While the former used rule-based classifiers, that is, a group of experts manually creates a large set of classification rules, the latter used a machine learning approach based on nature language processing to efficiently extract health information with minimal human intervention.
Laboratory data
Laboratory data have inherently poorer population coverage and timeliness than clinical data, but their long history of availability in an electronic and structured format that facilitates syndromic classification and their centralized nature make them a natural AHSyS data source.46–55 Dórea et al56 demonstrated how automated classification of laboratory records into syndromes can be performed using tokenization (identification of keywords) of the information from the laboratory test requests and materials submitted. Other systems took a different approach to event identification. Rather than monitoring the number of test requests, they were based on the assumption that the introduction of novel diseases will result in an increase in the number of samples that are not positive for the test requested by the veterinarian54,55 or that do not reach a diagnosis for any disease after reasonable testing.53,57 O’Sullivan et al54,55 demonstrated a positive association between the volume of submissions of porcine reproductive and respiratory syndrome virus tests and the occurrence of a porcine circovirus-associated disease (PCVAD) outbreak,54 as well as an increase in the proportion of negative tests,55 confirming that such data sources can also contribute to the knowledge of new and existing disease patterns in the population.
This review highlights two papers that were not considered to represent AHSyS initiatives, but which presented important assessments of the coverage and representativeness of a laboratory-based surveillance system58 and the behavior that leads to sample submission.59
Mortality data
Mortality data recorded in national cattle registries or by rendering plants have been tackled by many initiatives.60–70 Their potential for early detection of health hazards, however, remains unclear, as these data lack timeliness and specificity. Despite the unproven value of mortality data for early detection, the availability of large-scale data sets on cattle mortality in the European Union (since Regulation EC No. 1760/2000 made the computerized identification and registration of bovines mandatory), seems to have created the opportunity for extensive methodological research. No references were found using mortality in species other than cattle, but important methodological innovations were put forward by authors using mortality data, such as the use of rates (rather than counts),69 a unique application of scan statistic,68 and the use of hierarchical time series.60
Abattoir data
The overall rate of whole carcass condemnation can be monitored as the main syndromic event of interest.71–74 In other studies, the recorded reasons for partial carcass condemnations (PCCs) were used to define syndromes. Alton et al75–77 monitored specific PCC reasons, selecting two of the most frequently reported. Weber et al,78,79 Thomas-Bachili et al,80 and Amezcua et al81 evaluated the effect of specific known outbreaks in the study population on the rate of PCC and selected reasons for condemnation that could be related to the disease of interest. Vial and Martin74,82 evaluated multiple declared reasons for condemnation and concluded that lack of standardization can hinder the definition of syndromes. Rather than establishing syndromes a priori, Dupuy et al83 proposed the use of multiple factor analysis in combination with clustering methods using both health-related data and demographic data, in order to create a typology of condemnations. The method allowed handling of the complex data structure and can have the advantage of uncovering hidden patterns in the studied population.
Abattoir data are by nature distributed. Events are recorded in many different slaughterhouses, usually providing good coverage of the territory of interest, but presenting unique challenges such as the lack of standardization,74,82 and a loss in timeliness to transfer and gather all relevant data.84 Alton et al77 proposed a sentinel system, reducing the number of slaughterhouses that would be monitored and allowing efforts to be made to optimize data recording and transfer. A selection of abattoirs open all weeks of the year was shown to capture the overall seasonal and temporal trends of the full data set. Approaches need to be investigated individually in each country, as the patterns of animal movement for slaughter seem to vary considerably.71,74
Media sources
The use of unstructured textual data, such as media sources, has become more popular in AHSyS.85–88 A review of media sources used in AHSyS and of web-based surveillance systems for human, animal, and plant diseases can be found in Walker89 and Madoff and Li,90 respectively. Some web-based surveillance systems such as ProMED-mail have been active for >20 years. They enable the rapid identification and dissemination of human or animal disease outbreak information. Global animal-specific web-based systems, such as FAO EMPRES-i85 or IBIS,86 have been established only more recently. The latter does not solely rely on Internet crawl data to populate its outbreaks map but combines it with more formal data sources such as field mission reports. Many other systems are in early stages of development. Arsveska et al87 combined expert knowledge and automatic term extraction from unstructured Google and PubMed results to refine the wording of Internet search queries for the acquisition of disease outbreak news for African swine fever. The authors argue that search-term surveillance may represent a relatively inexpensive way to complement more traditional surveillance systems. An approach solely relying on search terms would be one step ahead, in terms of system automation, from systems that rely on experts reading and tagging potentially relevant publications. The latter approach88 retains human judgment as an integral part of the data analysis process to provide nuanced interpretation of the information collected by search engines on outbreaks in aquatic animals.
Outbreak detection by statistical methodologies
The statistical monitoring of syndromic data follows a well-defined set of steps: 1) retrospective evaluation of the data to identify any temporal/spatial patterns and/or external covariates that need to be accounted for; 2) model/remove these explainable patterns from the data (preprocessing); 3) monitor preprocessed data prospectively in order to detect unexpected clusters of events (possible outbreak signals) in time or space-time.
Step 1 requires data to be free from outbreak signals. It is generally impossible to determine with certainty that historical data are completely free of outbreak signals or determine their exact magnitude to retrospectively correct the data. Creating an outbreak-free baseline from historical data has therefore relied on acquiring data for years without any known major outbreak and applying statistical methods to remove or reduce the effect of outliers, under the assumption that after removing these extreme observations and any excessive noise, the historical data can be used as a true representation of the expected behavior of the time-series in the absence of outbreaks. The publications reviewed used one of the two common methods: 1) fitting models to the entire period of data available, and substituting values above a certain confidence interval (generally 95%) by the cutoff value of that interval; or 2) weighting observations by the inverse of their residuals, effectively reducing the contribution to the model of observations which largely deviate from the expected values as proposed by Farrington et al.91
The choice of regression models (step 2) to deal with temporal covariates effects (e.g., seasons and day-of-week) depends on the type of data (e.g., Poisson or negative binomial models for count data versus linear regression models for continuous data). The specific analysis of each data stream is needed to identify further model specifications. Vial et al92 for instance reported the need to use zero-inflated models to deal with over-dispersion. Other authors also using abattoir data71,93 reported the need to use hierarchical models in order to account for clustering of animals into specific abattoirs. Nontemporal covariates such as the structure of the animal population and impacting economic factors also need to be carefully evaluated. O’Sullivan et al54 reported the influence of price of animals and feed on the rate of submission of laboratory tests. Authors using cattle mortality data60,63,64,69 highlighted differences in the data streams between production sectors and age categories. It is recommended that readers review the specific references listed in Tables 1 and 2 while developing SyS from similar data sources.
The temporal monitoring of event counts, step 3, based on the assumption of a stable denominator, has been the norm in AHSyS. However, the assumption of a stable denominator does not hold for abattoir data, as the total number of animals slaughtered is highly variable and subjected to many external factors (e.g., commodity sales price) not related to diseases. The need to monitor abattoir condemnation data as proportions has thus always been clear. Perrin et al66,67 introduced an approach for mortality based on the use of movement data to calculate the population at risk and monitor mortality as a rate rather than counts. Negative laboratory results can also be monitored as proportions,53–55,57 while rates were used by Marceau et al10,94 and Bronner et al14 for their reproduction indicators.
Outbreak signal detection, when purely temporal, was in general based on the confidence intervals of the regression models constructed during the retrospective steps or subjecting model residuals to monitoring using control charts. The issues driving algorithm selection, discussed earlier, are the most important to consider. The actual implementation of the algorithms will not be reviewed here, as readers can refer directly to the publications listed in Tables 1 and 2. Two main ready-to-use tools are highlighted for the implementation of strictly temporal analysis, and those resources also provide further reference material and tutorials. Both are available as free packages in the R statistical programming language:95 the vetsyn package96 and the surveillance package.97 The novelty of the former lies in that it offers a framework for data management, analysis, visualization, and alarm generation under one umbrella, thereby streamlining the steps necessary to go from data to alarms.
Spatial monitoring has been almost exclusively applied using scan statistics from the free software Satscan.98 Readers are again referred to Tables 1 and 2, where all references using scan statistics are identified.
Even when spatial monitoring is not explicitly applied, the spatial component needs to be considered. Monitoring of multiple, parallel time-series was a common approach used to deal with the availability of data over large spatial scales, with counts being grouped for specific regions. This may not be ideal as the administrative borders may have little relevance to the way disease and risks are distributed, and because the number of time-series may become exceedingly large. Alba et al60 addressed this problem using hierarchical time series statistics, which account for the hierarchical spatial structure while grouping observations into different geographical scales. A unique combination of temporal and spatial monitoring was proposed by Perrin et al.68 The authors divided the French mainland into 1125 regular hexagons of 25 km diameters. Mortality was monitored individually in each hexagon, and every week the number of hexagons presenting excessive mortality was compared to the expectation of a Poisson regression model calibrated with historical data. They then applied spatial scan statistics to detect any clusters of hexagons with high mortality.
Validation and evaluation
Although the choice of modeling method depends mainly on the type of data being used, the choice of algorithms for outbreak signal detection depends mostly on the type of outbreak signal expected/targeted. Data from the BTV outbreaks in Europe were used to evaluate syndromic analysis of production indicators7 and reproduction indicators.10,13,14,35,94,99 All studies concluded that syndromic analysis of the data at the time of outbreak emergence would not have resulted in more timely detection of the outbreak than in the current system. The studies did however confirm the correlation between the outbreak occurrence and observed changes in the syndromic indicator, validating the occurrence of an outbreak signal.
Real outbreak data were also used to validate laboratory54,55 and slaughter data73,100,101 based on the outbreak of PCVADs in Canada, to demonstrate the association between condemnation rates and local occurrence of erysipelas and tuberculosis in swine in the USA,78,79 and to validate an indicator based on total mortality against a heat wave occurrence in France.69
Data on real outbreaks can give important insights into the characteristics of the outbreak signal that can be expected in different syndromic indicators and remain the ideal way to validate an indicator. The choice of adequate outbreak signal detection algorithms to monitor such a syndromic indicator, and their parameterization, may however require a systematic evaluation based on target performance parameters, such as sensitivity and specificity, for which one outbreak represents simply one observation. Authors have used simulations to provide a significant amount of data for algorithm selection in two main ways: simulating disease occurrence, in order to evaluate the type and magnitude of outbreak signals that would be generated;6,62,68 or simulating many different shapes, magnitudes, and durations of outbreak signals in order to maximize system performance against a broad range of possible scenarios.51,65,72,92 No outbreak signal detection algorithm has shown superior in all scenarios, and these evaluations have generally recommended the application of multiple algorithms in parallel. Dórea et al51 proposed a scoring system to combine multiple detection algorithms, each parameterized for multiple detection thresholds.
Follow-up of alarms and other system outputs
Some much-needed attention has been paid to the reporting of algorithm output from AHSyS. In their vetsyn R package, Dórea et al96 offer a function to produce customizable summary table and time-series plot for each syndrome. Moreover, another function can be used to automatically send an email to a specified user when an alarm was generated at the last time point. Muellner et al102 also explored freely available data visualization tools (Google Maps and Charts) to develop a web application for reporting the activities of AHSyS in Switzerland. Both the authors emphasize the need for tools that are general enough to allow entry-level usage and to meet the needs of a large number of users, while being flexible enough to allow more experienced user the ability to tailor their use of the tools to cater for more complex surveillance scenarios. The latter is becoming more and more relevant with the advent of new syndromic data types on the AHSyS scene.
An increase in the number of studies adopting the Bayesian framework to combine prior beliefs about the probability of an outbreak with the evidence for an ongoing outbreak based on observed syndromic counts has been observed. A new concept, the value of evidence for SyS (introduced by Andersson et al103), specifies, in the form of a likelihood ratio, how strong the evidence for/against an ongoing outbreak hypothesis is. The value of evidence is calculated based on the predicted distributions of reported cases under the null (no ongoing outbreak) and under the alternative hypothesis. The interest in Bayesian-based SyS methods that produce quantitative outputs (as opposed to the binary output “outbreak/no outbreak” of traditional frequentist methods), which are more easily interpretable by decision makers constitute an interesting development of the field. Anderson et al103 also argue that the adoption of a Bayesian approach to solving outbreak detection problems offers seamless integration of data from SyS with other sources of information. The latter may be output from predictive modeling, disease introduction risk assessments, or expected utility of action. This integration was illustrated by Fischer et al104 in which predicted probabilities of release and spread were combined with syndromic data in a Bayesian framework, to produce a joint risk score for the early detection of vector-borne diseases. In another study, Faverjon et al105 combined information on disease seasonality with evidence from reported cases of nervous syndrome in horses, and wild bird mortality to improve the detection of West Nile Virus incursions. Robertson et al33 also noted the potential utility of (Bayesian) hidden Markov models as surveillance tools for novel populations for which little historical baselines are available.
Conclusion and future directions
The AHSyS field has come a long way since 2011, but some limitations already identified in the first review of the discipline by Dórea et al1 still hinder the development of automated syndromic analysis and interpretation. The lack of syndromic classification standards renders the outputs from systems using different sources of animal health data not comparable and not integrable.106 Solving this problem is not trivial given the wide range of the specificity of the syndromic data commonly used (e.g., from low-specificity milk production indicators to higher-specificity laboratory test requests) and given the different data vocabularies used between data recording institutions (even within one country). More national veterinary services are building new IT systems to access animal health data more easily and relate data from various databases to each other (e.g., the Danish Veterinary and Food Administrations’ veterinary data warehouse).107,108 In this context, the creation of translation tools to classify animal health data would be a fundamental step toward generating outputs that can be compared and shared while protecting data privacy. Dórea et al109 propose the use of a AHSyS ontology to formalize the expert knowledge used in syndromic classification, by storing concepts and relationships as machine-interpretable definitions. The system they are currently developing will facilitate the development of smart systems for data use which do not rely on standard coding practices at source.
In an era of ubiquitous electronic collection of animal health data, surveillance experts are interested in developing and running multivariate surveillance systems (which concurrently monitor several data streams) as they have a greater probability of detecting disease events than univariate systems.110 This is because no single data source captures data from all the individuals involved in the outbreak. Since there is often different information contained in observations from different data sources, AHSyS systems should be multivariate by nature, that is, simultaneously evaluating various combinations of multiple data sets.111 Few publications in this review attempted to combine data from several sources, demonstrating the need for further methodological development. Some documented attempts to develop multivariate systems were based on the parallel implementation of multiple univariate aberration detection methods.112 Univariate aberration detection algorithms have the advantage of ease of application and interpretation: they employ hypothesis testing to provide systematic alert protocols. However, univariate methods are less sensitive to changes in disease incidence and suffer from a higher rate of false alerts, causing users to ignore alerts. Bayesian methodologies, such as the ones developed by various researchers,12,33,103,104 are much more apt to discover the interplay among multiple syndromic data sources. They seem to become increasingly more common in online monitoring systems and are expected to play a big part in the future of AHSyS in which ever more integrative information systems are put in place for disease surveillance across domains (One Health).113
Finally, the AHSyS publications from the last 5 years have highlighted that early detection may not be the principal expected benefit of AHSyS. As discussed by Veldhius et al,99 systems providing real-time monitoring of nonspecific animal health data can be used alongside more traditional surveillance systems to provide additional quantitative information for decision making and support the intelligent distribution of (other) surveillance efforts. For example, Brouwer et al114 validated the use of multiple sources of routinely collected data in order to develop a weighting score system, the Continuous Cattle Health Monitor, which can be used to systematically (quarterly in this study) detect herds with poor cattle health and direct surveillance efforts. As more AHSyS will enter an active prospective phase, following the intensive development stage of the last 5 years, this study envisions AHSyS to significantly contribute to international-, national-, and local-level animal health intelligence. Animal health intelligence is defined as the combination of disease intelligence, welfare intelligence, and food-producing industry intelligence (applicable to livestock). Disease intelligence, according to the Food and Agriculture Organization of the United Nations, includes “all the activities related to the identification of potential hazards that may represent a risk to animal health. It is pivotal in supporting veterinary services and other stakeholders, and performed through a multidisciplinary approach by: collecting and integrating expertise and knowledge to support disease analysis, prevention, early warning, and early response.”115 The use of new technologies allows veterinary authorities to track disease events on a real-time basis by combining various sources of information (e.g., molecular, geographical) into regional and global surveillance systems.
We are becoming more and more disease intelligent. However, animal health intelligence must go beyond the detection and monitoring of disease events. Situational awareness of health problems, as well as animal welfare, needs to be sought at various stages along the food-producing chain. Monitoring of hazards also needs to be accompanied by an understanding of the risk management, involving actors in this value chain. AHSyS has reached the maturity to start moving away from outbreak detection as its sole raison d’être and look at ways through which decision theory can be integrated into the analysis and interpretation of outputs. The discipline of AHSyS has a real potential in the next 5 years to significantly contribute to animal health intelligence and provide guidance and direction to stakeholders in support of their decisions.
Acknowledgment
The authors thank their affiliated institutions for the support to undertake this work.
Disclosure
The authors have no affiliations with or involvement in any organization or entity with any financial or nonfinancial interest in the subject matter discussed in this manuscript, other than being active researchers in the field of AHSyS. The authors report no other conflicts of interest in this work.
References
Dórea FC, Sanchez J, Revie CW. Veterinary syndromic surveillance: current initiatives and potential for development. Prev Vet Med. 2011;101(1):1–17. | ||
Dupuy C, Bronner A, Watson E, et al. Inventory of veterinary syndromic surveillance initiatives in Europe (Triple-S project): current situation and perspectives. Prev Vet Med. 2013;111(3):220–229. | ||
Hulth A. First European guidelines on syndromic surveillance in human and animal health published. Euro Surveill. 2014;19(41):pii:20927. | ||
Vial F, Berezowski J. A practical approach to designing syndromic surveillance systems for livestock and poultry. Prev Vet Med. 2015;120(1):27–38. | ||
Gates MC, Holmstrom LK, Biggers KE, Beckham TR. Integrating novel data streams to support biosurveillance in commercial livestock production systems in developed countries: challenges and opportunities. Front Public Health. 2015;3:74. | ||
Madouasse A, Marceau A, Lehébel A, et al. Evaluation of a continuous indicator for syndromic surveillance through simulation. Application to vector borne disease emergence detection in cattle using milk yield. PLoS One. 2013;8(9):e73726. | ||
Madouasse A, Marceau A, Lehébel A, et al. Use of monthly collected milk yields for the detection of the emergence of the 2007 French BTV epizootic. Prev Vet Med. 2014;113(4):484–491. | ||
Swart W, Veldhuis A, Brouwer-Middelesch H, Schaik G van. The comparison of three statistical methods to assess the potential of syndromic surveillance for early detection of emerging vector-borne diseases in cattle. Presented at the 14th ISVEE Symposium (Symposium of the International Society for Veterinary Epidemiology and Economics), 3–7 November, Yucatan, Mexico; 2015. | ||
Marceau A, Madouasse A, Lehébel A, van Schaik G, Veldhuis A, Van der Stede Y, Fourichon C. Can routinely recorded reproductive events be used as indicators of disease emergence in dairy cattle? An evaluation of 5 indicators during the emergence of bluetongue virus in France in 2007 and 2008. J Dairy Sci. 2014;97(10):6135–6150. | ||
Marceau A, Madouasse A, Lehebel A, Lesuffleur T, Van der Stede Y, Van Schaik G, Fourichon C. Syndromic surveillance in dairy cattle: development of indicators and methods based on reproduction data for early detection of emerging diseases. Presented at the Annual meeting of the European Society for Veterinary Epidemiology and Preventive Medicine (SVEPM), 20–22 March, Madrid, Spain; 2013. | ||
Nusinovici S, Madouasse A, Fourichon C. Quantification of the increase in the frequency of early calving associated with late exposure to bluetongue virus serotype 8 in dairy cows: implications for syndromic surveillance. Vet Res. 2016;47(1):18. | ||
Fourichon C, Nusinovici S, Madouasse A. Viral infection triggers calving: perspectives for surveillance of emerging diseases. Presented at the 14th ISVEE Symposium (Symposium of the International Society for Veterinary Epidemiology and Economics), 3–7 November, Yucatan, Mexico; 2015. | ||
Bronner A, Morignat E, Fournié G, Vergne T, Vinard J-L, Gay E, Calavas D. Syndromic surveillance of abortions in beef cattle based on the prospective analysis of spatio-temporal variations of calvings. Sci Rep. 2015;5:18285. | ||
Bronner A, Morignat E, Hénaux V, Madouasse A, Gay E, Calavas D. Devising an indicator to detect mid-term abortions in dairy cattle: a first step towards syndromic surveillance of abortive diseases. PLoS One. 2015;10(3):e0119012. | ||
Veldhuis A, Brouwer-Middelesch H, Marceau A, et al. Improving early detection of emerging vector-borne diseases in cattle using routinely collected production data. Presented at the Second International Conference on Animal Health Surveillance (ICAHS), May 7–9, Havana, Cuba; 2014. | ||
Bronner A, Hénaux V, Fortané N, Hendrikx P, Calavas D. Why do farmers and veterinarians not report all bovine abortions, as requested by the clinical brucellosis surveillance system in France? BMC Vet Res. 2014;10:93. | ||
Berckmans D. Precision livestock farming technologies for welfare management in intensive livestock systems. Rev Sci Tech. 2014;33(1):189–196. | ||
Kelly PC, More SJ, Blake M, Hanlon AJ. Identification of key performance indicators for on-farm animal welfare incidents: possible tools for early warning and prevention. Ir Vet J. 2011;64:13. | ||
Colles FM, Cain RJ, Nickson T, et al. Monitoring chicken flock behaviour provides early warning of infection by human pathogen Campylobacter. Proc Biol Sci. 2016;283(1822):pii:20152323. | ||
Martínez-Avilés M, Fernández-Carrión E, López García-Baones JM, Sánchez-Vizcaíno JM. Early detection of infection in pigs through an online monitoring system. Transbound Emerg Dis. Epub 2015. | ||
Huybrechts T, Mertens K, De Baerdemaeker J, De Ketelaere B, Saeys W. Early warnings from automatic milk yield monitoring with online synergistic control. J Dairy Sci. 2014;97(6):3371–3381. | ||
Amezcua R, Pearl DL, Friendship RM. Comparison of disease trends in the Ontario swine population using active practitioner-based surveillance and passive laboratory-based surveillance (2007–2009). Can Vet J. 2013;54(8):775–783. | ||
Baudon E, Tung D, Nga P, et al. Syndromic surveillance in resource scarce countries: application to the detection of influenza and other swine respiratory diseases in Northern Vietnam. Presented at the Second International Conference on Animal Health Surveillance (ICAHS), May 7–9, Havana, Cuba; 2014. | ||
Holmstrom L, Biggers K, Riddle A, Mur L, Wall J, Beckham T. The enhanced passive surveillance system: a solution supporting data collection, integration and analysis for disease surveillance. Presented at the 14th ISVEE Symposium (Symposium of the International Society for Veterinary Epidemiology and Economics), 3–7 November, Yucatan, Mexico; 2015. | ||
Mur L, Holmstrom L, Riddle A, Biggers K, Beckham T. Evaluation of an innovative biosurveillance system as an informative tool for conducting syndromic surveillance of equine health based on a pilot study in Colorado, USA. Presented at the 14th ISVEE Symposium (Symposium of the International Society for Veterinary Epidemiology and Economics), 3–7 November, Yucatan, Mexico; 2015. | ||
Pfeiffer CN, Campbell AJD, Firestone SM, Stevenson MA, Larsen JWA. Assessing engagement of sentinel farmers in syndromic surveillance reporting. Presented at the 14th ISVEE Symposium (Symposium of the International Society for Veterinary Epidemiology and Economics), 3–7 November, Yucatan, Mexico; 2015. | ||
Pollock C, Otto S, Patel J, et al. The Alberta Veterinary Surveillance Network – Veterinary Practice Surveillance (VPS) System for Cattle: Cattle Health in Alberta, Canada. Presented at the Second International Conference on Animal Health Surveillance (ICAHS), May 7–9, Havana, Cuba; 2014. | ||
Struchen R, Hadorn D, Wohlfender F, Balmer S, Süptitz S, Zinsstag J, Vial F. Experiences with a voluntary surveillance system for early detection of equine diseases in Switzerland. Epidemiol Infect. 2016;144(9):1830–1836. | ||
Walker JG, Ogola E, Knobel D. Mobile phone-based syndromic surveillance of livestock diseases in Kenya. Presented at the First International Conference on Animal Health Surveillance (ICAHS), May 17–20, Lyon, France; 2011. | ||
Ward MP, Kelman M. Disease surveillance in dogs and cats: a practitioner-based system. Presented at the 13th ISVEE Symposium (Symposium of the International Society for Veterinary Epidemiology and Economics), 20–24 August, Maastricht, the Netherlands; 2012. | ||
Zurbrigg KJ, den Borre NM. Factors associated with good compliance and long-term sustainability in a practitioner-based livestock disease surveillance system. Can Vet J. 2013;54(3):243–248. | ||
Behaeghel I, Veldhuis A, Ren L, et al. Evaluation of a hierarchical ascendant clustering process implemented in a veterinary syndromic surveillance system. Prev Vet Med. 2015;120(2):141–151. | ||
Robertson C, Sawford K, Gunawardana WSN, Nelson TA, Nathoo F, Stephen C. A hidden Markov model for analysis of frontline veterinary data for emerging zoonotic disease surveillance. PLoS One. 2011;6(9):e24833. | ||
Hoinville LJ, Alban L, Drewe JA, et al. Proposed terms and concepts for describing and evaluating animal-health surveillance systems. Prev Vet Med. 2013;112(1–2):1–12. | ||
Brouwer H, Bartels CJM, Wuijckhuise L Van, Schaik G Van. Syndromic surveillance on blood samples of aborting cows for early detection of (emerging) infectious diseases using different statistical methods. Presented at the Annual meeting of the European Society for Veterinary Epidemiology and Preventive Medicine (SVEPM), 28–30 March, Glasgow, Scottland; 2012. | ||
Bronner A, Morignat E, Calavas D. Respective influence of veterinarians and local institutional stakeholders on the event-driven surveillance system for bovine brucellosis in France. BMC Vet Res. 2015;11:179. | ||
Bronner A, Morignat E, Touratier A, Gache K, Sala C, Calavas D. Was the French clinical surveillance system of bovine brucellosis influenced by the occurrence and surveillance of other abortive diseases? Prev Vet Med. 2015;118(4):498–503. | ||
Bronner A, Gay E, Fortané N, et al. Quantitative and qualitative assessment of the bovine abortion surveillance system in France. Prev Vet Med. 2015;120(1):62–69. | ||
Anholt RM, Berezowski J, Jamal I, Ribble C, Stephen C. Mining free-text medical records for companion animal enteric syndrome surveillance. Prev Vet Med. 2014;113(4):417–422. | ||
Anholt RM, Berezowski J, Robertson C, Stephen C. Spatial-temporal clustering of companion animal enteric syndrome: detection and investigation through the use of electronic medical records from participating private practices. Epidemiol Infect. 2015;143(12):2547–2558. | ||
Furrer L, Küker S, Berezowski J, et al. Constructing a syndromic terminology resource for veterinary text mining. Proceedings of the 11th International Conference on Terminology and Artificial Intelligence, 4–6 November, Granada, Spain; 2015:61–70. | ||
Tierney A. SAVSNET – The Small Animal Veterinary Surveillance Network: The “Who What Where When & Why” of the UK vet-visiting companion animal population. Presented at the First International Conference on Animal Health Surveillance (ICAHS), May 17–20, Lyon, France; 2011. | ||
Warns-Petit E, Morignat E, Artois M, Calavas D. Unsupervised clustering of wildlife necropsy data for syndromic surveillance. BMC Vet Res. 2010;6:56. | ||
Birkhead GS, Klompas M, Shah NR. Uses of electronic health records for public health surveillance to advance public health. Annu Rev Public Health. 2015;36(1):345–359. | ||
Santamaria SL, Zimmerman KL. Uses of informatics to solve real world problems in veterinary medicine. J Vet Med Educ. 2011;38(2):103–109. | ||
Danan C, Baroukh T, Moury F, Jourdan-Da Silva N, Brisabois A, Le Strat Y. Automated early warning system for the surveillance of Salmonella isolated in the agro-food chain in France. Epidemiol Infect. 2011;139(5):736–741. | ||
Dórea FC, Lindberg A, McEwen BJ, Revie CW, Sanchez J. Syndromic surveillance using laboratory test requests: a practical guide informed by experience with two systems. Prev Vet Med. 2014;116(3):313–324. | ||
Dórea FC, Muckle, AC, Kelton, D, et al. Syndromic surveillance based on laboratory test requests in the province of Ontario, Canada. Presented at the 13th ISVEE Symposium (Symposium of the International Society for Veterinary Epidemiology and Economics), 20–24 August, Maastricht, the Netherlands; 2012. | ||
Dórea FC, Lindberg A, Elvander M. Veterinary syndromic surveillance in practice: costs and benefits for governmental organizations. Infect Ecol Epidemiol. 2015;5:29973. | ||
Dórea FC, McEwen BJ, McNab WB, Revie CW, Sanchez J. Syndromic surveillance using veterinary laboratory data: data pre-processing and algorithm performance evaluation. J R Soc Interface. 2013;10(83):20130114. | ||
Dórea FC, McEwen BJ, McNab WB, Sanchez J, Revie CW. Syndromic surveillance using veterinary laboratory data: algorithm combination and customization of alerts. PLoS One. 2013;8(12):e82183. | ||
Hyder K, Vidal-Diez A, Lawes J, et al. Use of spatiotemporal analysis of laboratory submission data to identify potential outbreaks of new or emerging diseases in cattle in Great Britain. BMC Vet Res. 2011;7:14. | ||
Kosmider RD, Kelly L, Simons RL, Brouwer A, David G. Detecting new and emerging diseases on livestock farms using an early detection system. Epidemiol Infect. 2011;139(10):1476–1485. | ||
O’Sullivan T, Friendship R, Pearl DL, McEwen B, Ker A, Dewey C. The association between submission counts to a veterinary diagnostic laboratory and the economic and disease challenges of the Ontario swine industry from 1998 to 2009. Prev Vet Med. 2012;106(3–4):275–283. | ||
O’Sullivan TL, Friendship RM, Pearl DL, McEwen B, Dewey CE. Identifying an outbreak of a novel swine disease using test requests for porcine reproductive and respiratory syndrome as a syndromic surveillance tool. BMC Vet Res. 2012;8:192. | ||
Dórea FC, Muckle CA, Kelton D, et al. Exploratory analysis of methods for automated classification of laboratory test orders into syndromic groups in veterinary medicine. PLoS One. 2013;8(3):e57334. | ||
Hyder K, Vidal-Diez A, Lawes J, et al. Use of spatiotemporal analysis of laboratory submission data to identify potential outbreaks of new or emerging diseases in cattle in Great Britain. BMC Vet Res. 2011;7:14. | ||
Ely ER, Nicholson RE, Snow LC, et al. Evaluation of methods for measuring coverage and representativeness of an early-warning disease surveillance system. Vet Rec. 2012;171(17):423. | ||
Gilbert WH, Häsler BN, Rushton J. Influences of farmer and veterinarian behaviour on emerging disease surveillance in England and Wales. Epidemiol Infect. 2013;142(1):1–15. | ||
Alba A, Dórea F, Arinero L, Sanchez J, Cordón R, Revie C. Exploring the surveillance potential of mortality data: nine years of bovine fallen stock data collected in Catalonia (Spain). Presented at the Second International Conference on Animal Health Surveillance (ICAHS), May 7–9, Havana, Cuba; 2014. | ||
Alba-Casals A, Fernández-Fontelo A, Revie CW, et al. Development of new strategies to model bovine fallen stock data from large and small subpopulations for syndromic surveillance use. Epidemiol Sante Anim. 2015;67:67–76. | ||
Hénaux V, Perrin J-B, Durand B, et al. Use of cattle mortality data for syndromic surveillance: simulation-based assessment of the performances of an anomaly detection algorithm. Presented at the 14th ISVEE Symposium (Symposium of the International Society for Veterinary Epidemiology and Economics), 3–7 November, Yucatan, Mexico; 2015. | ||
Torres G, Ciaravino V, Ascaso S, Flores V, Romero L, Simón F. Syndromic surveillance system based on near real-time cattle mortality monitoring. Prev Vet Med. 2015;119(3):216–221. | ||
Struchen R, Reist M, Zinsstag J, Vial F. Investigating the potential of reported cattle mortality data in Switzerland for syndromic surveillance. Prev Vet Med. 2015;121(1):1–7. | ||
Struchen R, Zinsstag J, Vial F. Evaluating the ability of aberration-detection temporal algorithms to detect simulated disease outbreaks in routinely collected cattle mortality data. Presented at the 14th ISVEE Symposium (Symposium of the International Society for Veterinary Epidemiology and Economics), 3–7 November, Yucatan, Mexico; 2015. | ||
Perrin JB, Ducrot C, Vinard JL, Morignat E, Calavas D, Hendrikx P. Assessment of the utility of routinely collected cattle census and disposal data for syndromic surveillance. Prev Vet Med. 2012;105(3):244–252. | ||
Perrin JB, Ducrot C, Vinard JL, et al. Using the National Cattle Register to estimate the excess mortality during an epidemic: application to an outbreak of Bluetongue serotype 8. Epidemics. 2010;2(4):207–214. | ||
Perrin JB, Durand B, Gay E, et al. Simulation-based evaluation of the performances of an algorithm for detecting abnormal disease-related features in cattle mortality records. PLoS One. 2015;10(11):e0141273. | ||
Morignat E, Perrin JB, Gay E, Vinard JL, Calavas D, Hénaux V. The impact of heat wave on cattle mortality in France: an example of syndromic surveillance. Presented at the Second International Conference on Animal Health Surveillance (ICAHS), May 7–9, Havana, Cuba; 2014. | ||
Bronner A, Dupuy C, Perrin JB, et al. How to design and implement a syndromic surveillance system in animal health? Guidelines by the Triple-S project. Presented at the Second International Conference on Animal Health Surveillance (ICAHS), May 7–9, Havana, Cuba; 2014. | ||
Alton GD, Pearl DL, Bateman KG, McNab WB, Berke O. Factors associated with whole carcass condemnation rates in provincially-inspected abattoirs in Ontario 2001–2007: implications for food animal syndromic surveillance. BMC Vet Res. 2010;6:42. | ||
Dupuy C, Morignat E, Dorea F, Ducrot C, Calavas D, Gay E. Pilot simulation study using meat inspection data for syndromic surveillance: use of whole carcass condemnation of adult cattle to assess the performance of several algorithms for outbreak detection. Epidemiol Infect. 2015:143:2559–2569. | ||
Thomas-Bachli AL, Pearl DL, Friendship RM, Berke O. Exploring relationships between whole carcass condemnation abattoir data, non-disease factors and disease outbreaks in swine herds in Ontario (2001–2007). BMC Res Notes. 2014;7:185. | ||
Vial F, Reist M. Comparison of whole carcass condemnation and partial carcass condemnation data for integration in a national syndromic surveillance system: the Swiss experience. Meat Sci. 2015;101:48–55. | ||
Alton GD, Pearl DL, Bateman KG, McNab WB, Berke O. Suitability of bovine portion condemnations at provincially-inspected abattoirs in Ontario Canada for food animal syndromic surveillance. BMC Vet Res. 2012;8:88. | ||
Alton GD, Pearl DL, Bateman KG, McNab B, Berke O. Comparison of covariate adjustment methods using space-time scan statistics for food animal syndromic surveillance. BMC Vet Res. 2013;9:231. | ||
Alton GD, Pearl DL, Bateman KG, McNab WB, Berke O. Suitability of sentinel abattoirs for syndromic surveillance using provincially inspected bovine abattoir condemnation data. BMC Vet Res. 2015;11:37. | ||
Weber W. Development of an animal health monitoring system based on abattoir condemnation data. Presented at the First International Conference on Animal Health Surveillance (ICAHS), May 17–20, Lyon, France; 2011. | ||
Weber WD, Scott AE. Abattoir condemn data used to identify regional swine TB event. Presented at the 13th ISVEE Symposium (Symposium of the International Society for Veterinary Epidemiology and Economics), 20–24 August, Maastricht, the Netherlands; 2012. | ||
Thomas-Bachli AL, Pearl DL, Friendship R, Berke O. Suitability and limitations of portion-specific abattoir data as part of an early warning system for emerging diseases of swine in Ontario. BMC Vet Res. 2012;8:3. | ||
Amezcua R, Pearl DL, Martinez A, Friendship RM. Patterns of condemnation rates in swine from a federally inspected abattoir in relation to disease outbreak information in Ontario (2005–2007). Can Vet J. 2011;52(1):35–42. | ||
Vial F, Reist M. Evaluation of Swiss slaughterhouse data for integration in a syndromic surveillance system. BMC Vet Res. 2014;10:33. | ||
Dupuy C, Morignat E, Maugey X, et al. Defining syndromes using cattle meat inspection data for syndromic surveillance purposes: a statistical approach with the 2005--2010 data from ten French slaughterhouses. BMC Vet Res. 2013;9(1):88. | ||
Vial F, Berezowski J. A practical approach for operationalizing a national syndromic surveillance system for livestock and poultry. Presented at the Second International Conference on Animal Health Surveillance (ICAHS), May 7–9, Havana, Cuba; 2014. | ||
Pinto J, Lockhart C, Larfaoui F. FAO EMPRES-i: a tool for early warning of animal diseases. Presented at the 13th ISVEE Symposium (Symposium of the International Society for Veterinary Epidemiology and Economics), 20–24 August, Maastricht, the Netherlands; 2012. | ||
International Biosecurity Intelligence System. Available from: http://biointel.org. Accessed June 2, 2016. | ||
Arsevska E, Roche M, Lancelot R, Hendrikx P, Dufour B. Exploiting textual source information for epidemiosurveillance. Commun Comput Inf Sci. 2014;478:359–361. | ||
Lyon A, Grossel G, Burgman M, Nunn M, Mooney A, Moss S. Online aquatic animal health surveillance and intelligence. Presented at the Second International Conference on Animal Health Surveillance (ICAHS), May 7–9, Havana, Cuba; 2014. | ||
Walker JG. New media methods for syndromic surveillance and disease modelling. CAB Rev Perspect Agric Vet Sci Nutr Nat Resour. 2013;8:1–13. | ||
Madoff LC, Li A. Web-based surveillance systems for human, animal, and plant diseases. Microbiol Spectr. 2014;2(1):OH-0015–2012. | ||
Farrington CP, Andrews NJ, Beale AD, Catchpole MA. A statistical algorithm for the early detection of outbreaks of infectious disease. J R Stat Soc A. 1996;159:547–563. | ||
Vial F, Thommen S, Held L. A simulation study on the statistical monitoring of condemnation rates from slaughterhouses for syndromic surveillance: an evaluation based on Swiss data. Epidemiol Infect. 2015;143(16):3423–3433. | ||
Dupuy C, Demont P, Ducrot C, Calavas D, Gay E. Factors associated with offal, partial and whole carcass condemnation in ten French cattle slaughterhouses. Meat Sci. 2014;97(2):262–269. | ||
Marceau A, Madouasse A, Lehébel A, et al. Can routinely recorded reproductive events be used as indicators of disease emergence in dairy cattle? An evaluation of 5 indicators during the emergence of bluetongue virus in France in 2007 and 2008. J Dairy Sci. 2014;(10):6135–6150. | ||
The R Core development team. R: a language and environment for statistical computing; 2016. Available from: https://www.r-project.org. Accessed August 1, 2016. | ||
Dórea FC, Widgren S, Lindberg A. Vetsyn: An R package for veterinary syndromic surveillance. Prev Vet Med. 2015;(1):21–32. | ||
Höhle M, Paul M, Held L. Statistical approaches to the monitoring and surveillance of infectious diseases for veterinary public health. Prev Vet Med. 2009;91(1):2–10. | ||
Kulldorff BM. SaTScan User Guide. V9.4; 2015:1–113. | ||
Veldhuis A, Brouwer-Middelesch H, Marceau A, et al. Application of syndromic surveillance on routinely collected cattle reproduction and milk production data for the early detection of outbreaks of Bluetongue and Schmallenberg viruses. Prev Vet Med. 2016;124:15–24. | ||
del Rocio Amezcua M, Pearl DL, Friendship RM, McNab WB. Evaluation of a veterinary-based syndromic surveillance system implemented for swine. Can J Vet Res. 2010;74(4):241–251. | ||
Thomas-Bachli AL, Pearl DL, Friendship RM, Berke O. Suitability and limitations of portion-specific abattoir data as part of an early warning system for emerging diseases of swine in Ontario. BMC Vet Res. 2012;8:3. | ||
Muellner UJ, Vial F, Wohlfender F, Hadorn D, Reist M, Muellner P. Timely reporting and interactive visualization of animal health and slaughterhouse surveillance data in Switzerland. Front Vet Sci. 2015;2:47. | ||
Andersson MG, Faverjon C, Vial F, Legrand L, Leblond Agnès ED, Gubbins S. Using Bayes’ rule to define the value of evidence from syndromic surveillance. PLoS One. 2014;9(11):e111335–e111335. | ||
Fischer EAJ, Andersson MG, Faverjon C, et al. The joint risk score for vector-borne diseases used for early detection. Presented at the 14th ISVEE Symposium (Symposium of the International Society for Veterinary Epidemiology and Economics), 3–7 November, Yucatan, Mexico; 2015. | ||
Faverjon C, Anderson GM, Tapprest J, et al. Multivariate syndromic surveillance to detect West Nile Virus outbreaks. Presented at the 14th ISVEE Symposium (Symposium of the International Society for Veterinary Epidemiology and Economics), 3–7 November, Yucatan, Mexico; 2015. | ||
Dórea FC, Dupuy C, Vial F, Revie CW, Lindberg A. Standardized Syndromic Classification of Animal Health Data (SSynCAHD). Presented at the Second International Conference on Animal Health Surveillance (ICAHS), May 7–9, Havana, Cuba; 2014. | ||
Nielsen AC. Data warehouse for assessing animal health, welfare, risk management and -communication. Acta Vet Scand. 2011;53(Suppl 1):S3. | ||
Nielsen J, Uttenthal A. What does African swine fever look like in Danish pigs? Dansk Vet. 2013;96:20–23. | ||
Dórea FC, Vial F, Dupuy C, Lindberg A, Revie C. Challenges and opportunities when using ontologies in animal health syndromic surveillance. Presented at the 14th ISVEE Symposium (Symposium of the International Society for Veterinary Epidemiology and Economics), 3–7 November, Yucatan, Mexico; 2015. | ||
Rolka H, Burkom H, Cooper GF, Kulldorff M, Madigan D, Wong W. Issues in applied statistics for public health bioterrorism surveillance using multiple data streams: research needs. Stat Med. 2007;26(8):1834–1856. | ||
Yahav I, Shmueli G. Algorithm combination for improved performance in biosurveillance systems. In: Zeng D, Gotham I, Komatsu K, et al., editors. Intelligence and Security Informatics: BioSurveillance. Springer-Verlag Berlin Heidelberg; 2007:91–102. | ||
Uijl IEM den, Deterink A, Wever P, Kock P, Schaik G van. Early warning of endemic animal health problems. Presented at the Second International Conference on Animal Health Surveillance (ICAHS), May 7–9, Havana, Cuba; 2014. | ||
Wendt A, Kreienbrock L, Campe A. Systematic review on the existence of integrative information systems for zoonotic disease surveillance. Presented at the 13th ISVEE Symposium (Symposium of the International Society for Veterinary Epidemiology and Economics), 20–24 August, Maastricht, the Netherlands; 2012. | ||
Brouwer H, Stegeman JA, Straatsma JW, Hooijer GA, van Schaik G. The validity of a monitoring system based on routinely collected dairy cattle health data relative to a standardized herd check. Prev Vet Med. 2015;122(1–2):76–82. | ||
Food and Agriculture Organization of the United Nations. Animal Disease Intelligence; 2010. Available from: http://www.fao.org/docrep/012/ak729e/ak729e00.pdf. Accessed on August 1, 2016. | ||
Höhle M, Meyer S, Paul M. Surveillance: temporal and spatio-temporal modeling and monitoring of epidemic phenomena. R package version 1.9–1; 2015. | ||
Thomas-Bachli A, Pearl D, Parmley EJ, Berke O, Barker I. Using spatial scan statistics applied to survival time data to investigate the utility of dead corvid and mosquito surveillance programs in Ontario, 2002 - 2008. Presented at the 14th ISVEE Symposium (Symposium of the International Society for Veterinary Epidemiology and Economics), 3–7 November, Yucatan, Mexico; 2015. |
 © 2016 The Author(s). This work is published and licensed by Dove Medical Press Limited. The full terms of this license are available at https://www.dovepress.com/terms.php and incorporate the Creative Commons Attribution - Non Commercial (unported, v3.0) License.
By accessing the work you hereby accept the Terms. Non-commercial uses of the work are permitted without any further permission from Dove Medical Press Limited, provided the work is properly attributed. For permission for commercial use of this work, please see paragraphs 4.2 and 5 of our Terms.
© 2016 The Author(s). This work is published and licensed by Dove Medical Press Limited. The full terms of this license are available at https://www.dovepress.com/terms.php and incorporate the Creative Commons Attribution - Non Commercial (unported, v3.0) License.
By accessing the work you hereby accept the Terms. Non-commercial uses of the work are permitted without any further permission from Dove Medical Press Limited, provided the work is properly attributed. For permission for commercial use of this work, please see paragraphs 4.2 and 5 of our Terms.