")
Back to Journals » Diabetes, Metabolic Syndrome and Obesity » Volume 14
ANGPTL8/Betatrophin Improves Glucose Tolerance in Older Mice and Metabolomic Analysis Reveals Its Role in Insulin Resistance in HepG2 Cells
Authors Xu F , Wang N, Li G, Tian D, Shi X
Received 22 July 2021
Accepted for publication 23 September 2021
Published 11 October 2021 Volume 2021:14 Pages 4209—4221
DOI https://doi.org/10.2147/DMSO.S330700
Checked for plagiarism Yes
Review by Single anonymous peer review
Peer reviewer comments 2
Editor who approved publication: Professor Ming-Hui Zou
Fangfang Xu,1 Nan Wang,2 Gangqiang Li,2 Dandan Tian,3 Xiaoyang Shi4
1Clinical Medical Research Center, Department of Research and Discipline Development, Henan Provincial People’s Hospital, Zhengzhou University People’s Hospital, Henan University People’s Hospital, School of Clinical Medicine, Henan University, Zhengzhou, Henan, 450003, People’s Republic of China; 2Biotechnology Research Institute, Chinese Academy of Agricultural Sciences, Beijing, 100081, People’s Republic of China; 3Department of Hypertension, Henan Provincial People’s Hospital, Zhengzhou University People’s Hospital, Zhengzhou, Henan, 450003, People’s Republic of China; 4Department of Endocrinology, Henan Provincial People’s Hospital, Zhengzhou University People’s Hospital, Zhengzhou, Henan, 450003, People’s Republic of China
Correspondence: Fangfang Xu
Clinical Medical Research Center, Department of Research and Discipline Development, Henan Provincial People’s Hospital, Zhengzhou University People’s Hospital, Henan University People’s Hospital, School of Clinical Medicine, Henan University, Zhengzhou, Henan, 450003, People’s Republic of China
Tel +86-371 87160613
Email [email protected]
Background: Insulin resistance is a determining factor in the pathophysiology of type 2 diabetes mellitus (T2DM). Angiopoietin-like protein 8 (ANGPTL8, also known as betatrophin), associated with glucose homeostasis and lipid metabolism, has attracted attention. But its mechanism in glucose metabolism remains unclear. This study aimed to explore the effect of ANGPTL8/betatrophin on glucose tolerance in Kunming (KM) mice of different ages and metabolic profiles in insulin-resistant HepG2 cells. Our study may provide a new perspective of ANGPTL8/betatrophin in insulin resistance from the metabolic changes.
Methods: Oral glucose tolerance test was performed in KM mice of different ages. Insulin concentration was measured by using a quantitative enzyme-linked immunosorbent assay (ELISA). ANGPTL8/betatrophin knockouts in HepG2 cells were established with clustered regularly interspaced short palindromic repeats (CRISPR)/CRISPR-associated (Cas) protein 9 (CRISPR/Cas9) system. Cell counting kit-8 (CCK-8) assay was used to determine cell viability after gene knockout. The effect of ANGPTL8/betatrophin on the metabolomic changes was evaluated in high insulin-induced insulin-resistant HepG2 cells by an ultra-performance liquid chromatography-tandem mass spectrometry (UPLC-MS/MS) method.
Results: ANGPTL8/betatrophin improved glucose tolerance in older mice not by altering the concentration of insulin. Cell growth was affected in ANGPTL8/betatrophin knockout HepG2. Based on UPLC-MS/MS, compared with wild type insulin-resistant HepG2 cells, we identified 83 differential metabolites in ANGPTL8/betatrophin knockout HepG2 cells after high insulin induction. Among the 14 differential up-regulated metabolites, D-mannose had the highest fold change. In insulin-resistant HepG2 cells, ANGPTL8/betatrophin knockout exerted an effect on the amino acid metabolism, carbohydrate metabolism, metabolism of cofactors and vitamins, lipid metabolism, nucleotide metabolism, and genetic information processing pathway.
Conclusion: This study identified the effect of ANGPTL8/betatrophin on glucose tolerance in mice of different ages and metabolic profiles in insulin-resistant HepG2 cells. These findings may contribute to a new understanding of its role in glucose metabolism in the context of insulin resistance.
Keywords: ANGPTL8/betatrophin, glucose tolerance, CRISPR/Cas9 technology, insulin resistance, metabolomics, inflammation
Introduction
Insulin resistance is a major risk factor for metabolic syndrome (MetS), including type 2 diabetes mellitus (T2DM).1 T2DM is characterized by insulin resistance in the liver.2 Insulin resistance is an abnormal physiological state that occurs when cells are unable to use insulin effectively, leading to T2DM, a major health burden worldwide.3 Hence, there is an urgent need to identify novel molecules involved in protection the liver cells against insulin resistance and regulation of glucose metabolism. Angiopoietin-like protein 8 (ANGPTL8), also known as betatrophin, a liver-derived hormone which has been implicated in the regulation of lipid and glucose metabolism,4–7 attracts attention.
ANGPTL8/betatrophin belongs to the angiopoietin-like protein (ANGPTL) family which plays a key role not only in lipid and glucose metabolism but also in chronic inflammation.6,8 Chronic low-grade inflammation is also recognized as a common feature in T2DM subjects.9 Circulating inflammatory markers are increased in T2DM,10,11 in insulin resistance,12 and related conditions such as obesity,13 MetS,14,15 diabetic nephropathy,11 and frailty associated with or caused by diabetes.16 Surprisingly, circulating levels of ANGPTL8/betatrophin are also increased in T2DM patients and associated with insulin resistance.17,18 ANGPTL8/betatrophin expression can be induced by insulin/insulin resistance.19,20 Recent studies have reported the role of ANGPTL8/betatrophin in nuclear factor-kappaB (NF-kappaB) mediated inflammation.21–23 Thus the newly identified atypical member of ANGPTL family, ANGPTL8/betatrophin, may also be an inflammatory marker in insulin resistance and related diseases, which contributes to a better understanding of the role of ANGPTL8/betatrophin in T2DM. But the mechanism of ANGPTL8/betatrophin in regulating glucose metabolism remains unclear. ANGPTL8/betatrophin does not control beta cell proliferation in mice.24,25 In the current study, our results showed that ANGPTL8/betatrophin improved glucose tolerance in older mice not by altering the concentration of insulin. Moreover, recent studies have reported that ANGPTL8/betatrophin could alleviate insulin resistance via regulating the insulin-mediated Akt signaling pathway.26,27 These findings suggest a new way to reveal the role of ANGPTL8/betatrophin in glucose metabolism in the context of insulin resistance. However, the metabolic changes affected by ANGPTL8/betatrophin in the presence of insulin resistance is unknown,19 the elucidation of which will provide new evidence of its role in insulin resistance.
In this study, the key metabolites and metabolic pathways affected by ANGPTL8/betatrophin in insulin-resistant HepG2 cells were investigated by ultra-performance liquid chromatography-tandem mass spectrometry (UPLC-MS/MS) analysis. Our study may provide a new insight for understanding the role of ANGPTL8/betatrophin in insulin resistance.
Materials and Methods
Cell Culture
HepG2 cells were purchased from the Chinese Academy of Sciences Cell Bank (Catalog number: SCSP-510) and maintained in RPMI-1640 medium supplemented with 10% fetal bovine serum (CellMax, China), 100 U/mL penicillin and 100 μg/mL streptomycin (Sangon Biotech, China) at 37°C in a 5% CO2 incubator.
Expression and Purification Analysis of the Recombinant ANGPTL8/Betatrophin
The method was described in details as indicated in our previous research.28
Experimental Animals
Kunming (KM) mice at specific pathogen free (SPF) level, mouse food and bedding were purchased from Charles River Technology (Beijing, China). All animal experiments were conducted following the National Institute of Health Publication (1996) Guide for the Care and Use of Laboratory Animals and the China Laboratory Animal-guideline for Ethical Review of Animal Welfare (GB/T 35892-2018), and all procedures conform to the ethical principles and guidelines for ethical review of experimental animal welfare of the Chinese Academy of Agriculture Sciences (CAAS) Institutional Animal Ethical and Welfare Committee and received ethics approval from the CAAS Institutional Animal Ethical and Welfare Committee (No: BRISPF-2017-02). All mice were euthanized three months after experiments by CO2 asphyxiation.
CRISPR/Cas9-Mediated ANGPTL8/Betatrophin Gene Knockout in HepG2 Cells
Clustered regularly interspaced short palindromic repeats (CRISPR)/CRISPR-associated (Cas) protein 9 (CRISPR/Cas9) system was used to create ANGPTL8/betatrophin gene mutation. The sgRNA was designed to target exon 1 using the CRISPR/Cas9 design tool CRISPOR, an open-source program (http://crispor.tefor.net/).29 The sequence of the single-guide RNA (sgRNA) is as follows: TGGTCCTGTACACACCGTTG. The proto-spacer adjacent motif (PAM), AGG, is at the 3ʹ end of the sgRNA. The sgRNA sequence was synthesized as DNA oligonucleotides and cloned into the vector PX458 (Addgene plasmid # 48138) between BbsI restriction sites and named PX458-ANGPTL8/betatrophin. The insertion of sgRNA was evaluated via sequencing. The mutations were confirmed by T7 endonuclease 1 (T7E1) assay. The plasmid PX458-ANGPTL8/betatrophin were extracted in large quantities using a SanPrep Column Plasmid Mini-Preps Kit (Sangon Biotech, B518191) and transfected into the HepG2 cells when the confluence reached 80%. The transfection efficiency were confirmed by fluorescence imaging.
Cell Viability Assay
Cell viability of each sample was evaluated by Cell Counting Kit-8 (CCK-8, Dojindo Molecular Technologies, Inc., Tokyo, Japan) assay according to the manufacturer’s protocol. Briefly, HepG2 cells were plated into a 96 well plate at 2 × 10⁴ cells/mL. After incubation periods of 24, 48, 72, and 96 h at 37 °C and 5% CO2, cells in each well were added with 10 µL CCK-8 solution followed by color development for 1–4 h. The optical absorbance of the plate at 450 nm was measured using a multifunctional microplate reader SpectraMax M4 (Molecular Devices, LLC, San Jose, CA, USA). Cell viability was calculated using the formula as follows: (OD450KO HepG2-OD450blank/OD450WT HepG2-OD450blank) × 100%. KO: ANGPTL8/betatrophin gene knockout HepG2 cells, WT: wild type HepG2 cells.
In vitro Insulin-Resistant Model
Insulin-resistant HepG2 (HepG2/IR) cell model was established by high insulin. When the confluence reached 60–70%, both the wild type HepG2 cells and the ANGPTL8/betatrophin knockout HepG2 cells were washed with phosphate-buffered saline (PBS) and changed to serum-free RPMI-1640 containing 2% bovine serum albumin (BSA). Next, cells were incubated with RPMI-1640 containing 103 nmol/L insulin for 48 h.19
Untargeted Metabolomic Analysis
After treatment with insulin, both the wild type and ANGPTL8/betatrophin knockout HepG2 cells (1 × 10⁷) were collected and analyzed by UPLC-MS/MS at BioNovoGene Co., Ltd. (Suzhou, China). Chromatographic separation was performed on an ACQUITY H-Class UPLC system equipped with an ACQUITY UPLC® HSS T3 column (2.1 × 150 mm, 1.8 μm, Waters, Milford, MA, USA). The data acquisitions from the randomized samples were performed in one batch to eliminate system errors. The intracellular metabolites (endometabolome) were identified based on their retention time, mass spectra, and exact molecular weight. The XCMS software with optimized settings was used for processing and analyzing the original LC-MS/MS data. The metabolite annotation was performed with the Compound Discoverer software and referenced to the online database mzCloud, the Human Metabolome Database (HMDB), the METLIN metabolite database, the MassBank database, and the Lipid Metabolites and Pathways Strategy (LIPID MAPS). The differential metabolites between two classes of samples were screened by a threshold of variable importance in the projection (VIP) selection method (VIP ≥ 1) and validated by Student’s t-test analysis (p ≤ 0.05). Principal component analysis (PCA) and partial least squares discriminant analysis (PLS-DA) in Simca-P software were used for pattern recognition. Data were normalized, transformed and conducted hierarchical clustering in R language to generate the heat map. Metabolite correlations were assessed by Pearson Correlation Coefficient analysis and constructed using Cytoscape software. To analyze metabolic pathways related to differential metabolites, metabolite enrichment analysis and pathway analysis were performed using the KEGG database and MetaboAnalyst 4.0 software. The Analysis of Variance (ANOVA) test was used to determine the significance of differences, and p ≤ 0.05 was considered to be statistically significant.
Oral Glucose Tolerance Test (OGTT)
After overnight fasting, KM mice were randomly divided into two groups, a control group and a test group (n = 6). Either equivalent volume of physiological saline or 0.1mg/mL recombinant betatrophin dissolved in physiological saline were injected (i.p.) into the control and test groups of mice, respectively, 30 min prior to oral administration of 2 g glucose/kg body weight. Blood was collected from the tail vein at various time points for glucose detection using a glucose monitoring system (Sinocare Inc., Changsha, China). Enzyme-linked immunosorbent assay (ELISA) analysis was simultaneously employed to measure the concentration of insulin using an Ultra Sensitive Mouse Insulin ELISA Kit (MS100) (EZassay Biotechnology Ltd, Changsha, China).
Measurement of Triglyceride
KM mice were randomly divided into two groups (n = 6). Mice in one group were injected intraperitoneally (i.p.) with 0.1 mg/mL recombinant ANGPTL8/betatrophin and in the other group were given the equivalent volume of physiological saline. Blood plasma samples from the tail vein were collected at various time points after the injection. Triglyceride (TG) concentrations in the plasma obtained from the mice of different ages were analyzed using a Triglyceride Quantification Assay Kit (Applygen Technologies Inc., Beijing, China) according to the manufacturer’s instructions.
Patient and Public Involvement
No patient involved.
Statistical Analysis
All data in this study were analyzed in Microsoft Office Excel and presented as means ± SD (n = 3 or n = 6). A Student’s t-test was used to identify significant differences (p < 0.05) between groups using SPSS v.19.0 software (SPSS Inc., Chicago, IL, USA).
Results
Increased TG Concentration in ANGPTL8/Betatrophin Administration Mice
The effect of ANGPTL8/betatrophin on TG metabolism was evaluated in KM mice. As shown in Figure S1A, results demonstrated that 30 min after injection (i.p.) of recombinant ANGPTL8/betatrophin into 8-week-old mice, the concentration of plasma TG increased from 1.28 ± 0.04 mmol/L to 1.53 ± 0.05 mmol/L. In contrast, TG levels in 8-week-old mice treated with physiological saline were unchanged over the 30 min time period (1.28 ± 0.05 mmol/L to 1.27 ± 0.04 mmol/L). When recombinant ANGPTL8/betatrophin was injected (i.p.) into 36-week-old mice, the concentration of TG in plasma increased from 1.28 ± 0.01 mmol/L to 1.81 ± 0.05 mmol/L after 10 min, then began to decrease 30 min later (Figure S1B). The TG levels in mice administrated with ANGPTL8/betatrophin at 10, 30, and 60 min were still higher than that in physiological saline-treated mice (Figure S1B). Consistently, studies have shown that ANGPTL8/betatrophin play a role in TG metabolism, the inhibition of which may represent a therapeutic strategy for hypertriglyceridemia.24,30 Our results also verified the biological activity of recombinant ANGPTL8/betatrophin.
Enhanced Glucose Tolerance in Older KM Mice Administrated with Recombinant ANGPTL8/Betatrophin
OGTT in KM mice were performed to evaluate the effect of ANGPTL8/betatrophin on glucose homeostasis. Results of OGTT test indicated that no significant difference in blood glucose levels was found in 8- and 12-week-old mice (Figure 1A and B). In contrast, blood glucose tolerance in 15-, 24-, 36-, and 48-week-old mice treated with recombinant ANGPTL8/betatrophin was enhanced, relative to the same-aged mice treated with physiological saline (Figure 1C–F). Serum insulin concentrations 30 min after glucose gavage to 12-, 24-, and 48-week-old mice were also measured. The results demonstrated that insulin concentrations increased in both physiological saline-treated and recombinant ANGPTL8/betatrophin-treated mice (Figure 1G). Further analysis demonstrated that the insulin levels were not significantly different between the two groups. These results suggest that ANGPTL8/betatrophin may exert a positive effect on insulin signaling pathway. It has been reported that ANGPTL8/betatrophin alleviates insulin resistance via the Akt-GSK3β/FoxO1 pathway in HepG2 cells.26 Here we examined the effects of inactivating ANGPTL8/betatrophin on insulin resistance in HepG2 cells using metabolomics.
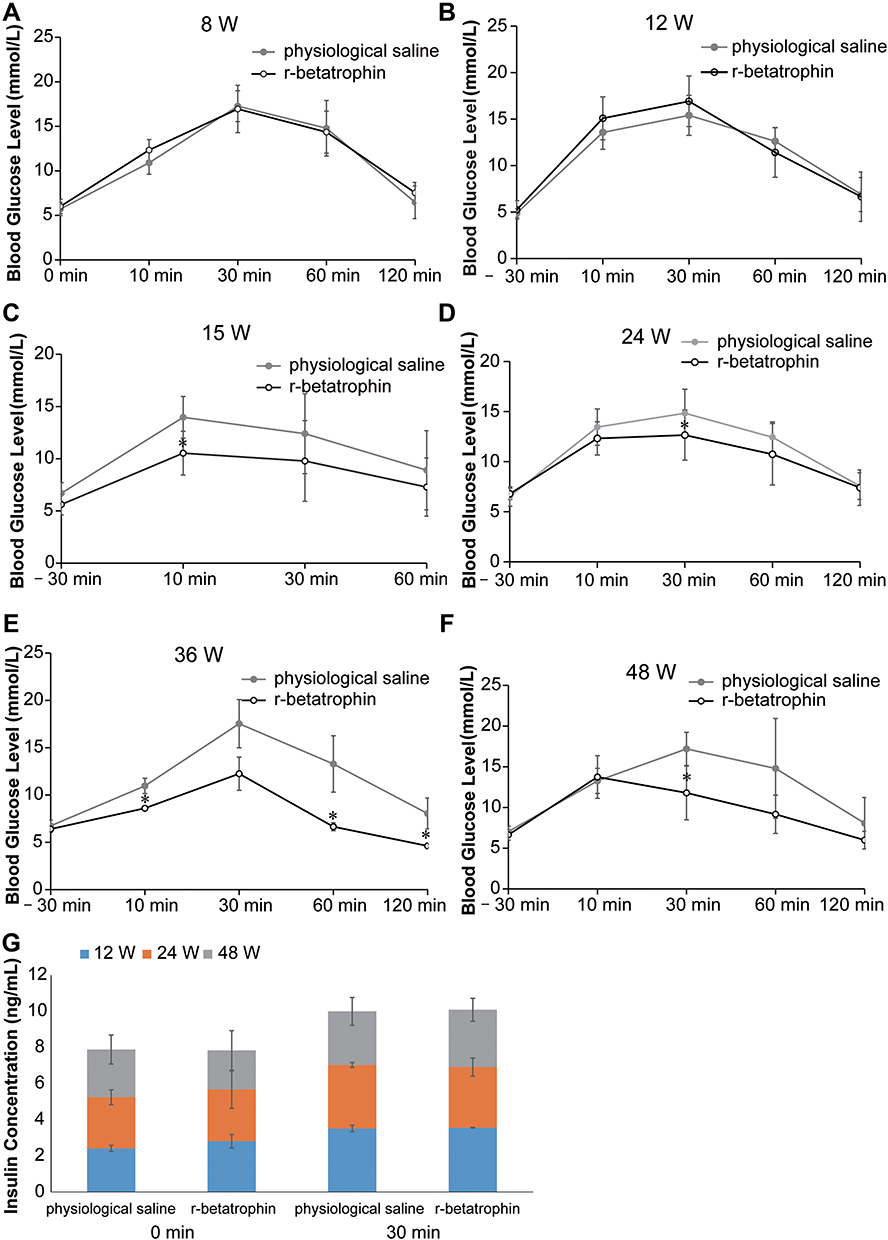 |
Figure 1 Oral glucose tolerance test in KM mice treated with recombinant ANGPTL8/betatrophin. Oral glucose tolerance test in 8- (A), 12- (B), 15- (C), 24- (D), 36- (E), 48- (F) week-old KM mice (n = 6), and ELISA analysis of insulin concentration 30 min after glucose gavage in 12-, 24-, and 48-week-old mice (G). The experiment was repeated three times. Data represent the mean ± SD. *Indicates a significant difference at p < 0.05. Abbreviation: r-betatrophin, recombinant ANGPTL8/betatrophin. |
Establishment of ANGPTL8/Betatrophin Gene Knockout HepG2 Cells
To understand how ANGPTL8/betatrophin affected insulin signaling pathway, CRISPR/Cas9 gene-editing technology was used to knock out the ANGPTL8/betatrophin gene in HepG2 cells to obtain knockout cell line. ANGPTL8/betatrophin is enriched in human liver and hepatocellular carcinoma cell line HepG2, as shown in the Human Protein Atlas database (https://www.proteinatlas.org/ENSG00000130173-ANGPTL8/tissue). Considering cell specificity, HepG2 was selected to construct the knockout model. The target site of CRISPR was shown in Figure 2A. The plasmid PX458-ANGPTL8/betatrophin was transfected into HepG2 cells for 48 h. The transfection efficiency was approximately 40%, evaluated by fluorescence microscopy (Figure 2B). The efficiency of CRISPR-induced ANGPTL8/betatrophin mutation was determined by T7E1 assay. The result showed that the mutation rate at the loci was 26% (Figure 2C). The subsequent sequence analysis showed AA deletion and CG insertion contributed to the mutation (Figure 2D).
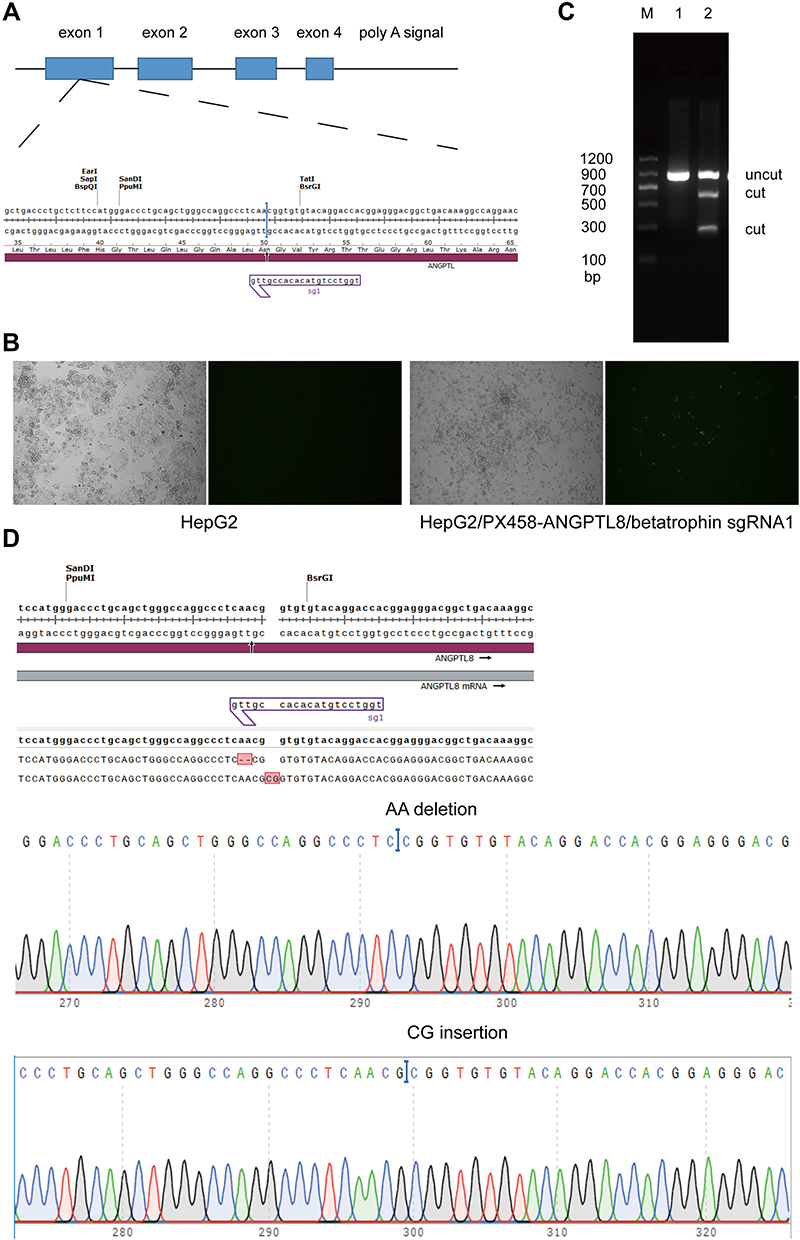 |
Figure 2 The ANGPTL8/betatrophin gene was knocked out in HepG2 cells using CRISPR/Cas9. (A) Schematic representation of the ANGPTL8/betatrophin gene and the target sites of CRISPR. (B) The transfection efficiency was evaluated by fluorescence microscopy. The plasmid PX458-ANGPTL8/betatrophin was transfected into HepG2 cells for 48 h. (C) T7E1 analysis of the efficiency of CRISPR-induced ANGPTL8/betatrophin mutation after two rounds of targeting. (D) Sequencing of the target region in one of the selected ANGPTL8/betatrophin knockout cell clones. M, DNA Marker C (100–1200 bp); 1, in the absence of T7E1 enzyme; 2, in the presence of T7E1 enzyme. |
Cell Viability Analysis
Before metabolomic analysis, the effect of ANGPTL8/betatrophin knock out on the viability of HepG2 cells were detected via CCK-8 analysis after 24, 48, 72 and 96 h of cultivation. The result showed that the cell viability of ANGPTL8/betatrophin gene knockout HepG2 cells was significantly decreased at 96 h compared with the wild type cells (Figure 3). Based on this, the insulin resistance model was constructed in HepG2 cells within 72 h. Cells in both groups were harvested after incubation with insulin for 48 h. The wet weight of ANGPTL8/betatrophin gene knockout HepG2 cells was almost half of that in the wild type HepG2 cells.
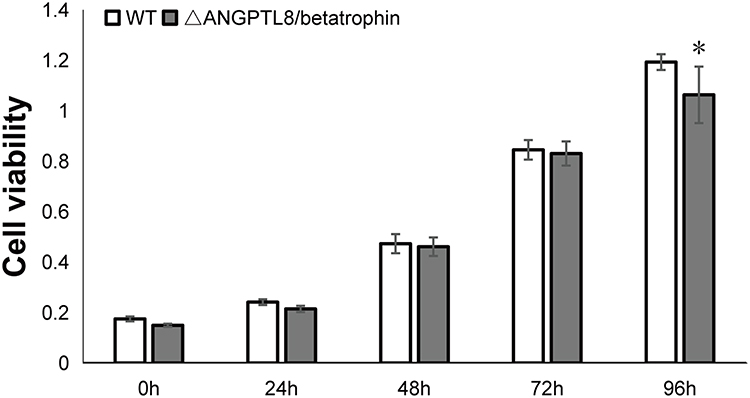 |
Figure 3 Cell viability of wild type HepG2 cells and HepG2 cells with ANGPTL8/betatrophin gene knockout. The symbol *Indicates p < 0.05. Abbreviations: WT, wild type HepG2 cells; ΔANGPTL8/betatrophin, ANGPTL8/betatrophin gene knockout HepG2 cells. |
Multivariate Statistical Analysis of Metabolite Profiles in HepG2/IR Cells
The metabolomic data were analyzed by PCA score plot (Figure S2A). In the partial least squares-discriminant analysis (PLS-DA) model of metabolite profiles in positive ion mode and negative ion mode, the R2Y and Q2 values were 1 and 0.977 (Figure S2B), and 0.998 and 0.972 (Figure S2C), respectively. The score plots indicated a clear separation between the two groups. These results demonstrated that the model was not over-fitted, thus demonstrating the reliability of the platform.
The Effect of ANGPTL8/Betatrophin Knockout on Metabolites in HepG2/IR Cells
Metabolites with differential levels in ANGPTL8/betatrophin knockout HepG2/IR cells, compared with wild type HepG2/IR cells, were screened by analyzing the variable importance in the project (VIP), p values and one-way ANOVA p value. And p values ≤ 0.05, VIP ≥ 1, and one-way ANOVA p value ≤ 0.05 were considered significant differential metabolites. We identified 83 metabolites with significant changes, of which 14 were up-regulated and 69 were down-regulated (Table S1). The correlation between metabolites (p < 0.05) was analyzed using the Pearson correlation coefficient. There were 2335 positive correlations and 906 negative correlations among the 3241 differential metabolite relationships excluding the same metabolites in the HepG2 sample (Figure S3). Metabolite correlations reveal synergy changes between metabolites.
In order to find the potential targets for ANGPTL8/betatrophin, differentially expressed metabolites were investigated after ANGPTL8/betatrophin knockout in HepG2 cells. The heat map analysis of differential metabolites showed that 14 metabolites were up-regulated and 69 metabolites were down-regulated compared with control samples (Figure 4). Consistently, Box-and-whisker plots also showed 14 metabolites were up-regulated (Figure S4) and 69 were down-regulated (Figure S5). 14 up-regulated metabolites: D-Mannose, Thiamine, L-Fucose, L-Lysine, alpha-Ketoisovaleric acid, Gluconic acid, 2-Deoxy-scyllo-inosose, Glutaric acid, N6-Acetyl-L-lysine, alpha-D-Ribose 1-phosphate, Nicotinate D-ribonucleoside, Pyrrole-2-carboxylic acid, Sphinganine, trans-Cinnamate, were shown in Table 1. Highest fold change was observed with D-Mannose (fold change = 9757.75, p < 0.05).
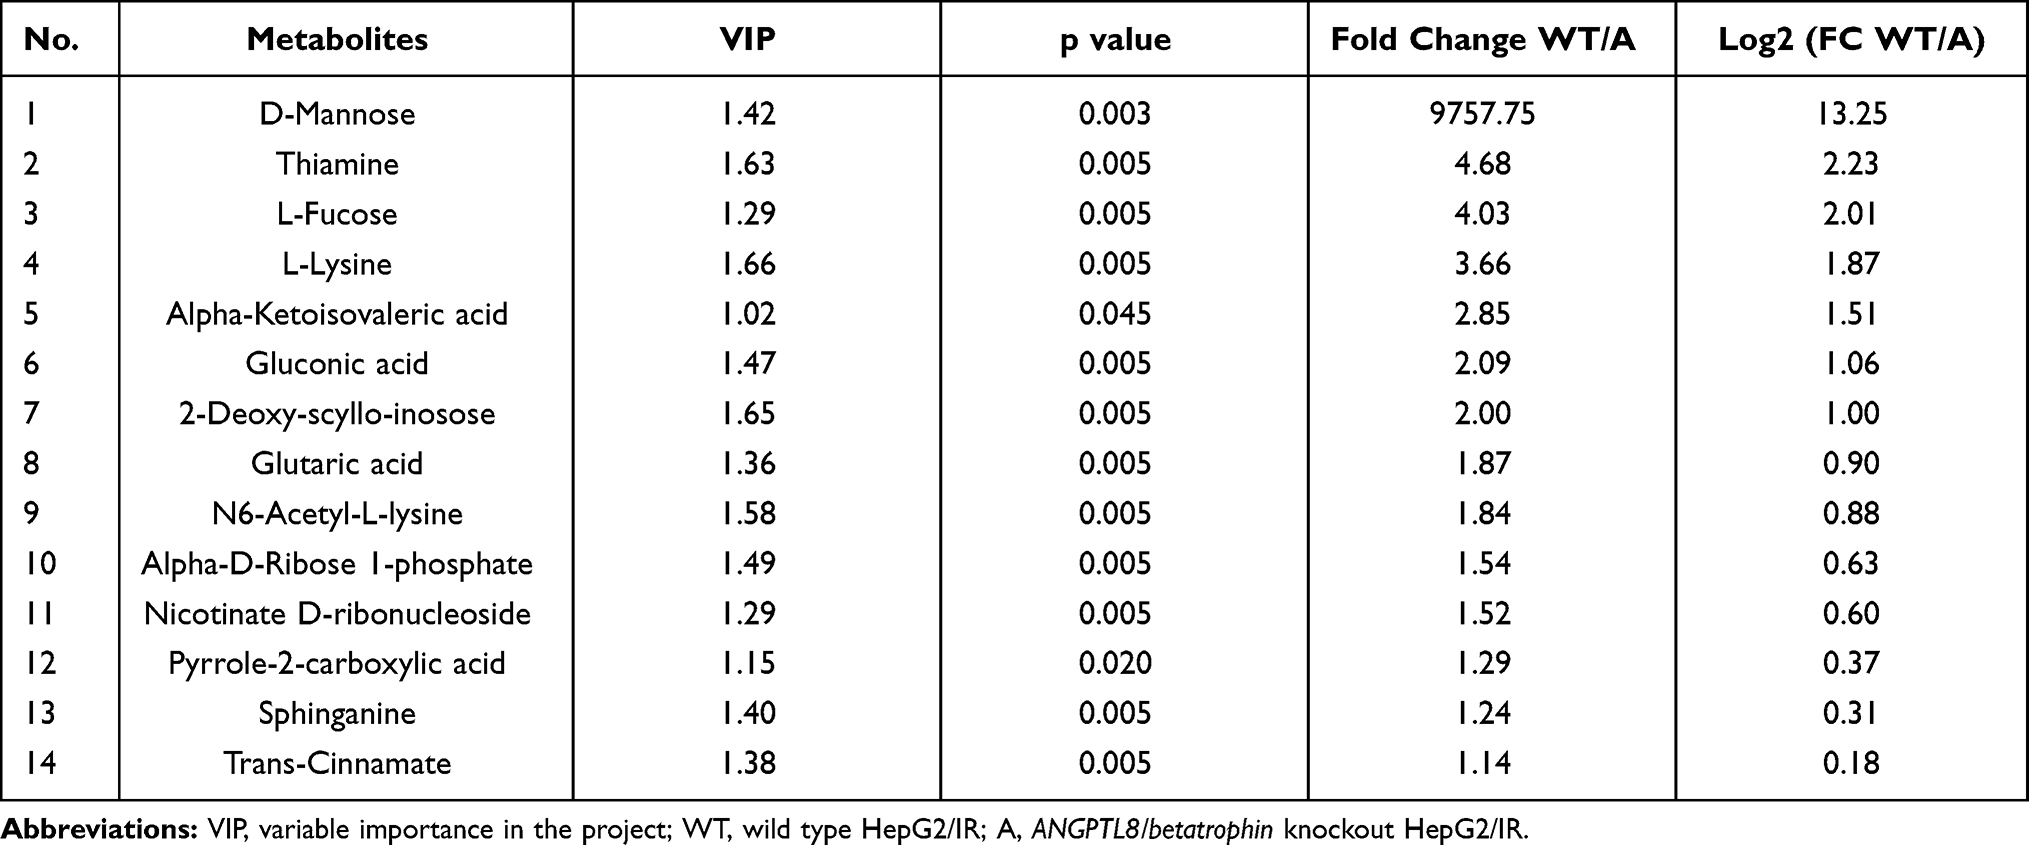 |
Table 1 Summary of Up-Regulated Metabolites in Response to ANGPTL8/Betatrophin Gene Knockout in HepG2/IR Cells |
 |
Figure 4 Heat map analysis of differential metabolites in HepG2/IR cells. 2 indicated that the metabolites were up-regulated, 0 not regulated and −2 down-regulated. Each experiment was performed six times. Abbreviations: WT, wild type HepG2/IR; A, ANGPTL8/betatrophin knockout HepG2/IR. |
The Effect of ANGPTL8/Betatrophin on the Metabolic Pathways in HepG2/IR Cells
Multivariate analysis on the differential metabolites was performed to study the effect of ANGPTL8/betatrophin on the metabolic pathways in HepG2/IR cells. 44 metabolic pathways were analyzed (Table S2). The results showed that 17 metabolic pathways (the pathway impact ˃ 0.1), pyrimidine metabolism (0.36), lysine degradation (0.31), alanine, aspartate and glutamate metabolism (0.26), pantothenate and CoA biosynthesis (0.25), phenylalanine metabolism (0.23), cysteine and methionine metabolism (0.20), tryptophan metabolism (0.19), vitamin B6 metabolism (0.18), retinol metabolism (0.18), citrate cycle (TCA cycle) (0.16), riboflavin metabolism (0.15), sphingolipid metabolism (0.14), thiamine metabolism (0.12), valine, leucine and isoleucine biosynthesis (0.12), aminoacyl-tRNA biosynthesis (0.11), arginine and proline metabolism (0.10), and lysine biosynthesis (0.10) were prominently affected (Figure 5, Table 2). The class summary of the differential metabolic pathways demonstrated that amino acid metabolism, cofactors and vitamins metabolism, nucleotide metabolism, carbohydrate metabolism and lipid metabolism pathways were significantly altered in ANGPTL8/betatrophin knockout HepG2/IR cells.
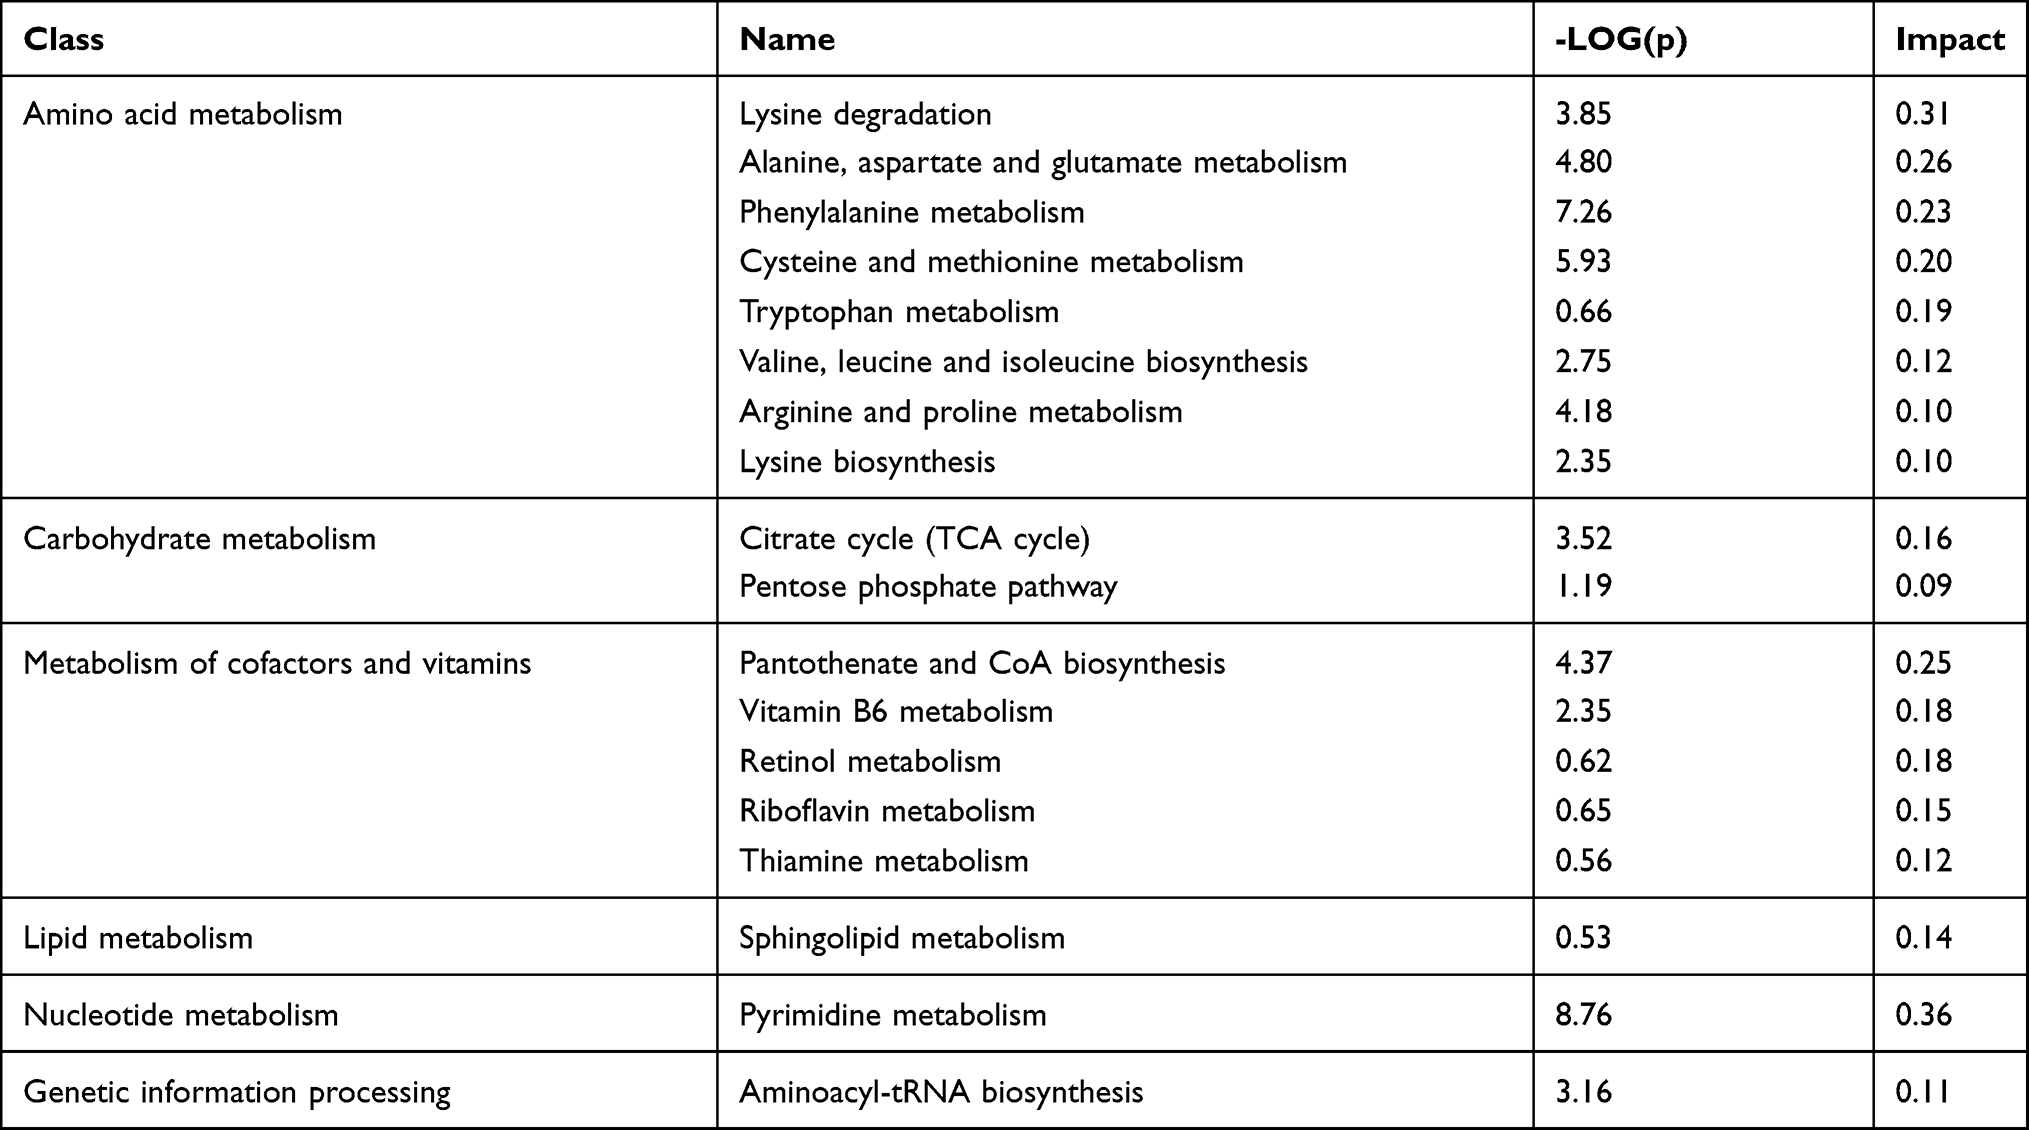 |
Table 2 Summary of Metabolic Pathways Significantly Affected by ANGPTL8/Betatrophin Knockout in HepG2/IR Cells |
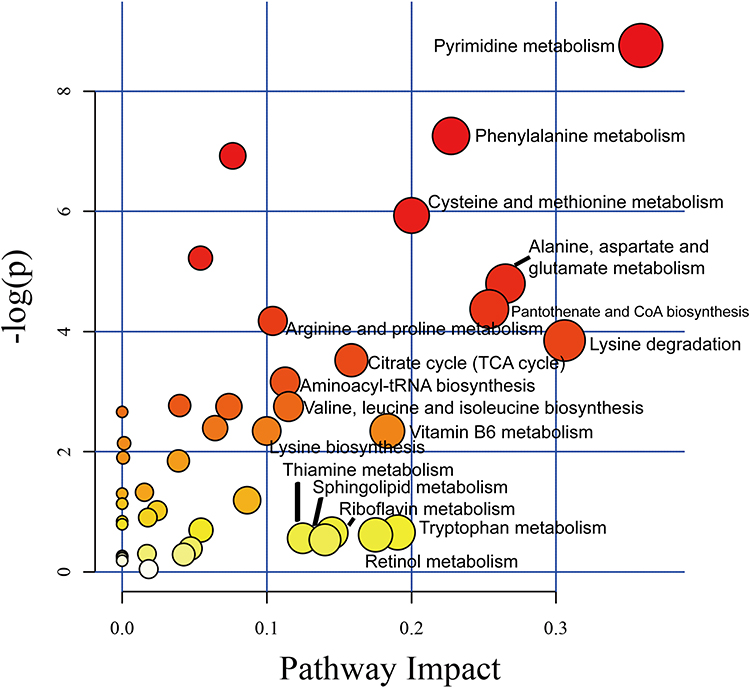 |
Figure 5 The impact factor map of metabolic pathways in response to ANGPTL8/betatrophin knockout in HepG2/IR cells. The metabolic pathways labeled with the name were the most obvious metabolic pathways affected by ANGPTL8/betatrophin knockout in HepG2/IR cells. |
Discussion
Diabetes has become an increasing public health burden as the International Diabetes Federation Diabetes Atlas (9th edition) has reported that the global diabetes prevalence in 2019 was 463 million people aged 20–79 years, rising to 578 million by 2030 and 700 million by 2045.31 Diabetes is the result of having inadequate supply of functional insulin-producing beta cells and initiated by the onset of insulin resistance.32
Several insulin sensitizing hormones, such as adiponectin,33 visfatin,34,35 omentin,36 which play important roles in insulin resistance and/or T2DM are well studied.37 A novel liver-derived hormone ANGPTL8/betatrophin, associated with insulin resistance and lipid metabolism,4 has attracted great attention. It was reported that ANGPTL8/betatrophin does not control pancreatic beta cell expansion.24,25 Recent studies have reported that induced by insulin resistance, ANGPTL8/betatrophin enhanced insulin-stimulated pathway in HepG2 cells.19,20,26,27 In the present study, we observed that recombinant ANGPTL8/betatrophin enhanced the oral glucose tolerance in older mice not by increasing the insulin level (Figure 1). These findings suggest that ANGPTL8/betatrophin may also be an insulin sensitizing hormone and regulate glucose metabolism by potentiating the insulin-induced signaling pathway.
To date no studies have shown the effect of ANGPTL8/betatrophin on the cell metabolome in the presence of insulin resistance. In this study, insulin-resistant HepG2 cells with or without ANGPTL8/betatrophin knockout were incubated and then collected for monitoring the metabolic changes. Combined with the UPLC-MS/MS method and multivariate data analysis, the metabolic pathway changes of insulin-resistant HepG2 cells affected by ANGPTL8/betatrophin knockout can be inferred. Our study could provide a new perspective of ANGPTL8/betatrophin in the development of insulin resistance from the metabolic changes.
ANGPTL8/betatrophin is predominantly expressed in the liver, thus the gene was knocked out using the CRISPR/Cas9 technology in the human hepatocellular carcinoma HepG2 cell line in the present study. As one of the robust and effective gene manipulation tool, CRISPR/Cas9 has been widely applied in various organisms. ANGPTL8/betatrophin knockouts have been established using transcription activator-like effector nucleases (TALENs).26 In this study, ANGPTL8/betatrophin knockout HepG2 cells were successfully established (Figure 2). Moreover, cell viability seemed to be unexpectedly affected by ANGPTL8/betatrophin depletion with the increase of incubation time (Figure 3), possibly due to the intracellular metabolic changes, which should be investigated further. Based on this, the in vitro IR model was established by incubating the cells with insulin for 48 h.
Then the intracellular metabolites levels were screened with the untargeted metabolomics by UPLC-MS/MS. The metabolic profiling showed that a number of metabolites varied and the most of them were markedly lower (Table S1) in ANGPTL8/betatrophin knockout HepG2/IR cells compared to that in the wild type HepG2/IR cells. Only 14 metabolites, D-mannose, thiamine, L-fucose, L-lysine, alpha-ketoisovaleric acid, gluconic acid, 2-deoxy-scyllo-inosose, glutaric acid, N6-acetyl-L-lysine, alpha-D-ribose 1-phosphate, nicotinate D-ribonucleoside, pyrrole-2-carboxylic acid, sphinganine, and trans-cinnamate, were up-regulated (Table 1). The highest fold change was observed with D-Mannose.
Mannose is a glucose-associated metabolite mainly released by the liver. Studies have shown that plasma mannose levels were positively associated with insulin resistance and negatively associated with insulin sensitivity,38,39 thus predicting insulin resistance.40 Recently, it has been reported that mannose is an insulin-regulated metabolite reflecting whole-body insulin sensitivity.41 In the present study, intracellular mannose level was significantly higher in ANGPTL8/betatrophin knockout HepG2/IR cells, compared to that in the wild type HepG2/IR cells (p = 0.003), suggesting the more severe insulin resistance in HepG2/IR cells with ANGPTL8/betatrophin knockout. Consistently, it has been reported that insulin upregulates ANGPTL8/betatrophin expression via PI3K/Akt pathway,19 and ANGPTL8/betatrophin alleviates insulin resistance via the Akt-GSK3β/FoxO1 pathway in HepG2 cells.26 ANGPTL8/betatrophin may also be an insulin-regulated biomarker to predict the development of insulin resistance.
Thiamine, also known as vitamin B1, is an essential cofactor in intracellular glucose metabolism. Thiamine deficiency is commonly reported in patients with diabetes, so diabetes might be considered a thiamine-deficient state.42 High-dose thiamine supplementation may improve glucose tolerance in patients with hyperglycemia.43 It has also been reported that thiamine supplementation effectively reduces glucose concentration in type 2 diabetic patients.44 These findings suggest that thiamine has beneficial effects on glucose metabolism. In our study, the intracellular concentration of thiamin was significantly increased in ANGPTL8/betatrophin knockout HepG2/IR cells compared with the wild type HepG2/IR cells (p = 0.005). It suggested that in insulin resistance state, ANGPTL8/betatrophin knockout may elicit this compensatory increase in thiamin in order to regulate glucose metabolism. The relationship between ANGPTL8/betatrophin and thiamin in hyperglycemic individuals needs to be studied.
It has been reported that in a rat model of type II diabetes induced by high-fat diet and streptozotocin injection, the levels of D-gluconic acid and glutaric acid were significantly higher in urine samples from 4–6 weeks than that in urine samples from 1–3 weeks.45 It indicates that D-gluconic acid and glutaric acid may predict hyperglycemia and insulin resistance. Consistently in our study, the levels of D-gluconic acid and glutaric acid were significantly higher in ANGPTL8/betatrophin knockout HepG2/IR cells than that in wild type HepG2/IR cells (p = 0.005), suggesting ANGPTL8/betatrophin knockout may aggravate insulin resistance.
Sphinganine is the precursor of ceramide. One study has reported that therapeutic intervention using a ceramide de novo synthesis inhibitor lowered the level of ceramide, its precursor, sphinganine, and its derivatives, sphingosine and sphingosine-1-phosphate, thus improving glucose homeostasis in type 1 diabetic animals.46 The concentrations of sphingolipids, namely, ceramide and sphinganine were reduced in insulin-resistant primary rat hepatocytes, resulting to the amelioration of hepatic insulin resistance.47 In the present study, the sphinganine level was significantly higher in ANGPTL8/betatrophin knockout HepG2/IR cells than that in wild type HepG2/IR cells (p = 0.005), suggesting ANGPTL8/betatrophin knockout may contribute to the development of insulin resistance.
It is worth noting that the association of L-Fucose, L-Lysine, alpha-Ketoisovaleric acid, 2-Deoxy-scyllo-inosose, N6-Acetyl-L-lysine, alpha-D-Ribose 1-phosphate, Nicotinate D-ribonucleoside, Pyrrole-2-carboxylic acid and trans-Cinnamate with insulin resistance remained unknown.
In terms of the limitations of this study, first, animal studies present significant drawbacks with inherited species-specific differences,48 so the effect of ANGPTL8/betatrophin on glucose metabolism should be studied in other mouse models, for example, C57BL/6 mouse. Moreover, long-term usage of recombinant ANGPTL8/betatrophin in insulin-resistant or diabetic mouse models should also be explored to study its potential therapeutic effect. Second, in this study, the metabolomics analysis platform was used to assess the effect of ANGPTL8/betatrophin on the metabolism of a human liver carcinoma cell line HepG2 in the presence of insulin resistance. Metabolite profiles were determined and some of them were selected to study the potential correlations between ANGPTL8/betatrophin and insulin resistance. More research needs to be performed on the mechanism of ANGPTL8/betatrophin in these metabolic changes. These findings may provide new evidence and a better understanding of its role in glucose metabolism.
Conclusion
In conclusion, ANGPTL8/betatrophin may play an important role in glucose metabolism in the context of insulin resistance. Our study may provide a new perspective of ANGPTL8/betatrophin in insulin resistance from the metabolic changes. However, further research needs to be performed on the mechanism of ANGPTL8/betatrophin in these metabolic changes.
Funding
This study was supported by both doctoral and postdoctoral start-up fund from Henan Provincial People’s Hospital (ZC20170012 and ZC20180007), and was funded in part by the Joint Construction Project of Henan Health Commission (LHGJ20190590).
Disclosure
The authors declare that they have no competing interests.
References
1. Guo S. Insulin signaling, resistance, and the metabolic syndrome: insights from mouse models into disease mechanisms. J Endocrinol. 2014;220:T1–T23. doi:10.1530/JOE-13-0584
2. Guzman-Flores JM, Flores-Perez EC, Hernandez-Ortiz M, et al. Protein expression profile of twenty-week-old diabetic db/db and non-diabetic mice livers: a proteomic and bioinformatic analysis. Biomolecules. 2018;8:35.
3. Loh M, Zhou L, Ng HK, Chambers JC. Epigenetic disturbances in obesity and diabetes: epidemiological and functional insights. Mol Metab. 2019;27S:S33–S41.
4. Abu-Farha M, Abubaker J, Tuomilehto J. ANGPTL8 (betatrophin) role in diabetes and metabolic diseases. Diabetes Metab Res Rev. 2017;33:e2919.
5. Zhang Y, Li R, Meng Y, et al. Irisin stimulates browning of white adipocytes through mitogen-activated protein kinase p38 MAP kinase and ERK MAP kinase signaling. Diabetes. 2014;63:514–525. doi:10.2337/db13-1106
6. Endo M. The roles of ANGPTL families in cancer progression. J UOEH. 2019;41:317–325. doi:10.7888/juoeh.41.317
7. Zhang Y, Li S, Donelan W, et al. Angiopoietin-like protein 8 (betatrophin) is a stress-response protein that down-regulates expression of adipocyte triglyceride lipase. Biochim Biophys Acta. 2016;1861:130–137. doi:10.1016/j.bbalip.2015.11.003
8. Santulli G. Angiopoietin-like proteins: a comprehensive look. Front Endocrinol (Lausanne). 2014;5:4. doi:10.3389/fendo.2014.00004
9. Calle MC, Fernandez ML. Inflammation and type 2 diabetes. Diabetes Metab. 2012;38:183–191. doi:10.1016/j.diabet.2011.11.006
10. Hu FB, Meigs JB, Li TY, Rifai N, Manson JE. Inflammatory markers and risk of developing type 2 diabetes in women. Diabetes. 2004;53:693–700. doi:10.2337/diabetes.53.3.693
11. Fornoni A, Ijaz A, Tejada T, Lenz O. Role of inflammation in diabetic nephropathy. Curr Diabetes Rev. 2008;4:10–17. doi:10.2174/157339908783502361
12. Abbatecola AM, Ferrucci L, Grella R, et al. Diverse effect of inflammatory markers on insulin resistance and insulin-resistance syndrome in the elderly. J Am Geriatr Soc. 2004;52:399–404. doi:10.1111/j.1532-5415.2004.52112.x
13. Escobar-Morreale HF, Villuendas G, Botella-Carretero JI, Sancho J, San MJ. Obesity, and not insulin resistance, is the major determinant of serum inflammatory cardiovascular risk markers in pre-menopausal women. Diabetologia. 2003;46:625–633. doi:10.1007/s00125-003-1090-z
14. Martins CC, Bagatini MD, Simoes J, et al. Increased oxidative stress and inflammatory markers contrasting with the activation of the cholinergic anti-inflammatory pathway in patients with metabolic syndrome. Clin Biochem. 2021;89:63–69. doi:10.1016/j.clinbiochem.2020.12.007
15. Black HR, Davis B, Barzilay J, et al. Metabolic and clinical outcomes in nondiabetic individuals with the metabolic syndrome assigned to chlorthalidone, amlodipine, or lisinopril as initial treatment for hypertension: a report from the Antihypertensive and Lipid-Lowering Treatment to Prevent Heart Attack Trial (ALLHAT). Diabetes Care. 2008;31:353–360.
16. Abbatecola AM, Olivieri F, Corsonello A, et al. Frailty and safety: the example of diabetes. Drug Saf. 2012;35(Suppl 1):63–71. doi:10.1007/BF03319104
17. Hu H, Sun W, Yu S, et al. Increased circulating levels of betatrophin in newly diagnosed type 2 diabetic patients. Diabetes Care. 2014;37:2718–2722. doi:10.2337/dc14-0602
18. Chen X, Lu P, He W, et al. Circulating betatrophin levels are increased in patients with type 2 diabetes and associated with insulin resistance. J Clin Endocrinol Metab. 2015;100:E96–E100. doi:10.1210/jc.2014-2300
19. Lu P, Chen X, Zhang Z, et al. Insulin upregulates betatrophin expression via PI3K/Akt pathway. Sci Rep. 2017;7:5594. doi:10.1038/s41598-017-06052-y
20. Yi P, Park JS, Melton DA. Betatrophin: a hormone that controls pancreatic beta cell proliferation. Cell. 2013;153:747–758. doi:10.1016/j.cell.2013.04.008
21. Abu-Farha M, Ghosh A, Al-Khairi I, et al. The multi-faces of Angptl8 in health and disease: novel functions beyond lipoprotein lipase modulation. Prog Lipid Res. 2020;80:101067. doi:10.1016/j.plipres.2020.101067
22. Zhang Y, Guo X, Yan W, et al. ANGPTL8 negatively regulates NF-kappaB activation by facilitating selective autophagic degradation of IKKgamma. Nat Commun. 2017;8:2164. doi:10.1038/s41467-017-02355-w
23. Yang J, Song QY, Niu SX, et al. Emerging roles of angiopoietin-like proteins in inflammation: mechanisms and potential as pharmacological targets. J Cell Physiol. 2021. doi:10.1002/jcp.30534
24. Gusarova V, Alexa CA, Na E, et al. ANGPTL8/betatrophin does not control pancreatic beta cell expansion. Cell. 2014;159:691–696. doi:10.1016/j.cell.2014.09.027
25. Cox AR, Lam CJ, Bonnyman CW, et al. Angiopoietin-like protein 8 (ANGPTL8)/betatrophin overexpression does not increase beta cell proliferation in mice. Diabetologia. 2015;58:1523–1531. doi:10.1007/s00125-015-3590-z
26. Rong GX, Li WX, Chen Y, et al. ANGPTL8/betatrophin alleviates insulin resistance via the Akt-GSK3beta or Akt-FoxO1 pathway in HepG2 cells. Exp Cell Res. 2016;345:158–167. doi:10.1016/j.yexcr.2015.09.012
27. Zhang Z, Wu H, Dai L, et al. ANGPTL8 enhances insulin sensitivity by directly activating insulin-mediated AKT phosphorylation. Gene. 2020;749:144707. doi:10.1016/j.gene.2020.144707
28. Xu F, Chen Y, Wang N, Sun K. Bacteria-derived recombinant human ANGPTL8/Betatrophin significantly increases the level of triglyceride. Protein J. 2019;38:472–478. doi:10.1007/s10930-019-09825-8
29. Concordet JP, Haeussler M. CRISPOR: intuitive guide selection for CRISPR/Cas9 genome editing experiments and screens. Nucleic Acids Res. 2018;46:W242–W245. doi:10.1093/nar/gky354
30. Wang Y, Quagliarini F, Gusarova V, et al. Mice lacking ANGPTL8 (Betatrophin) manifest disrupted triglyceride metabolism without impaired glucose homeostasis. Proc Natl Acad Sci U S A. 2013;110:16109–16114. doi:10.1073/pnas.1315292110
31. Saeedi P, Petersohn I, Salpea P, et al. Global and regional diabetes prevalence estimates for 2019 and projections for 2030 and 2045: results from the International Diabetes Federation Diabetes Atlas, 9(th) edition. Diabetes Res Clin Pract. 2019;157:107843. doi:10.1016/j.diabres.2019.107843
32. Aguayo-Mazzucato C, Bonner-Weir S. Pancreatic beta cell regeneration as a possible therapy for diabetes. Cell Metab. 2018;27:57–67. doi:10.1016/j.cmet.2017.08.007
33. Kadowaki T, Yamauchi T, Kubota N, et al. Adiponectin and adiponectin receptors in insulin resistance, diabetes, and the metabolic syndrome. J Clin Invest. 2006;116:1784–1792. doi:10.1172/JCI29126
34. Esteghamati A, Alamdari A, Zandieh A, et al. Serum visfatin is associated with type 2 diabetes mellitus independent of insulin resistance and obesity. Diabetes Res Clin Pract. 2011;91:154–158. doi:10.1016/j.diabres.2010.11.003
35. Gouranton E, Romier B, Marcotorchino J, et al. Visfatin is involved in TNFalpha-mediated insulin resistance via an NAD(+)/Sirt1/PTP1B pathway in 3T3-L1 adipocytes. Adipocyte. 2014;3:180–189. doi:10.4161/adip.28729
36. Aktas G, Alcelik A, Ozlu T, et al. Association between omentin levels and insulin resistance in pregnancy. Exp Clin Endocrinol Diabetes. 2014;122:163–166. doi:10.1055/s-0034-1370917
37. Nway NC, Sitticharoon C, Chatree S, Maikaew P. Correlations between the expression of the insulin sensitizing hormones, adiponectin, visfatin, and omentin, and the appetite regulatory hormone, neuropeptide Y and its receptors in subcutaneous and visceral adipose tissues. Obes Res Clin Pract. 2016;10:256–263. doi:10.1016/j.orcp.2015.05.007
38. Lee S, Zhang C, Kilicarslan M, et al. Integrated network analysis reveals an association between plasma mannose levels and insulin resistance. Cell Metab. 2016;24:172–184. doi:10.1016/j.cmet.2016.05.026
39. Amano E, Funakoshi S, Yoshimura K, et al. Fasting plasma mannose levels are associated with insulin sensitivity independent of BMI in Japanese individuals with diabetes. Diabetol Metab Syndr. 2018;10:88. doi:10.1186/s13098-018-0391-9
40. Holmes D. Biomarkers: mannose levels predict insulin resistance. Nat Rev Endocrinol. 2016;12:496. doi:10.1038/nrendo.2016.119
41. Ferrannini E, Bokarewa M, Brembeck P, et al. Mannose is an insulin-regulated metabolite reflecting whole-body insulin sensitivity in man. Metabolism. 2020;102:153974. doi:10.1016/j.metabol.2019.153974
42. Beltramo E, Berrone E, Tarallo S, Porta M. Effects of thiamine and benfotiamine on intracellular glucose metabolism and relevance in the prevention of diabetic complications. Acta Diabetol. 2008;45:131–141. doi:10.1007/s00592-008-0042-y
43. Alaei SF, Soares MJ, Zhao Y, Sherriff J. High-dose thiamine supplementation improves glucose tolerance in hyperglycemic individuals: a randomized, double-blind cross-over trial. Eur J Nutr. 2013;52:1821–1824. doi:10.1007/s00394-013-0534-6
44. Karkabounas S, Papadopoulos N, Anastasiadou C, et al. Effects of alpha-lipoic acid, carnosine, and thiamine supplementation in obese patients with Type 2 diabetes mellitus: a randomized, double-blind study. J Med Food. 2018;21:1197–1203. doi:10.1089/jmf.2018.0007
45. Zhao H, Li Z, Tian G, et al. Effects of traditional Chinese medicine on rats with Type II diabetes induced by high-fat diet and streptozotocin: a urine metabonomic study. Afr Health Sci. 2013;13:673–681.
46. Kurek K, Garbowska M, Ziembicka DM, et al. Myriocin treatment affects lipid metabolism in skeletal muscles of rats with streptozotocin-induced type 1 diabetes. Adv Med Sci. 2017;62:65–73. doi:10.1016/j.advms.2016.04.003
47. Zywno H, Bzdega W, Kolakowski A, et al. The influence of coumestrol on sphingolipid signaling pathway and insulin resistance development in primary rat hepatocytes. Biomolecules. 2021;11:268.
48. Wang H, Brown PC, Chow E, et al. 3D cell culture models: drug pharmacokinetics, safety assessment, and regulatory consideration. Clin Transl Sci. 2021. doi:10.1111/cts.13066
 © 2021 The Author(s). This work is published and licensed by Dove Medical Press Limited. The full terms of this license are available at https://www.dovepress.com/terms.php and incorporate the Creative Commons Attribution - Non Commercial (unported, v3.0) License.
By accessing the work you hereby accept the Terms. Non-commercial uses of the work are permitted without any further permission from Dove Medical Press Limited, provided the work is properly attributed. For permission for commercial use of this work, please see paragraphs 4.2 and 5 of our Terms.
© 2021 The Author(s). This work is published and licensed by Dove Medical Press Limited. The full terms of this license are available at https://www.dovepress.com/terms.php and incorporate the Creative Commons Attribution - Non Commercial (unported, v3.0) License.
By accessing the work you hereby accept the Terms. Non-commercial uses of the work are permitted without any further permission from Dove Medical Press Limited, provided the work is properly attributed. For permission for commercial use of this work, please see paragraphs 4.2 and 5 of our Terms.