")
Back to Journals » Diabetes, Metabolic Syndrome and Obesity » Volume 8
Angiotensin receptor blocker telmisartan suppresses renal gluconeogenesis during starvation
Authors Tojo A, Hatakeyama S, Kinugasa S, Nangaku M
Received 5 December 2014
Accepted for publication 30 December 2014
Published 13 February 2015 Volume 2015:8 Pages 103—113
DOI https://doi.org/10.2147/DMSO.S78771
Checked for plagiarism Yes
Review by Single anonymous peer review
Peer reviewer comments 3
Editor who approved publication: Professor Ming-Hui Zou
Akihiro Tojo, Saaya Hatakeyama, Satoshi Kinugasa, Masaomi Nangaku
Division of Nephrology and Endocrinology, The University of Tokyo, Tokyo, Japan
Abstract: The kidney plays an important role in gluconeogenesis during starvation. To clarify the anti-diabetic action of angiotensin receptor blockers, we examined the effects of telmisartan on the sodium-glucose co-transporters (SGLT) and the pathways of renal gluconeogenesis in streptozotocin-induced diabetes mellitus (DM) rats. At 4 weeks, the DM rats treated with/without telmisartan for 2 weeks and normal control rats were used for the study after a 24-hour fast. SGLT2 expressed on the brush border membrane of the proximal convoluted tubules increased in the DM rats, but decreased in the rats treated with telmisartan. The expression of restriction enzymes of gluconeogenesis, glucose-6-phosphatase, and phosphoenolpyruvate carboxykinase increased in the proximal tubules in the DM rats, whereas these enzymes decreased in the kidneys of the rats treated with telmisartan. The elevated cytoplasmic glucose-6-phosphate and glucose levels in the kidney of DM rats significantly decreased in those treated with telmisartan, whereas those levels in the liver did not show significant change. Meanwhile, the high plasma glucose levels in the DM rats during the intravenous insulin tolerance tests were ameliorated by telmisartan. The increased fasting plasma glucose levels after 24 hours of starvation in the DM rats thus returned to the control levels by telmisartan treatment. In conclusion, the increased renal SGLT2 expression, elevated renal gluconeogenesis enzymes and extent of insulin-resistance in the DM rats were ameliorated by telmisartan therapy, thus resulting in decreased plasma glucose levels after 24 hours of fasting.
Keywords: SGLT2, renal gluconeogenesis, diabetes, angiotensin II
Introduction
The kidney plays a role in glucose homeostasis by promoting gluconeogenesis in addition to glomerular glucose filtration, tubular glucose reabsorption, and glucose consumption. Glucose derived from the diet is reabsorbed in the intestines via the sodium-glucose co-transporter (SGLT) 1, and then, approximately 90% of the glucose filtered via the glomeruli is reabsorbed by SGLT2 in the apical membrane of the S1 and S2 segment of the proximal tubules, while the remaining 10% is reabsorbed in the S3 segment via SGLT1.1,2 The expression of SGLT2 has been reported to be regulated by TGF-β, IL-6, TNF-α, protein kinase A, and protein kinase C3–5 and the messenger ribonucleic acid levels of SGLT2 have been shown to be increased in obese Zücker rats.6 However, it has not yet been clearly elucidated whether the SGLT expression is influenced by angiotensin II receptor blockade.
The kidney releases approximately 20% of the total systemic glucose, according to the results of an isotope-labeled glucose study.7 The extent of glycogen storage and glycogenolysis in the kidney is negligible, and most of the glucose released from the kidneys is regulated by the balance between gluconeogenesis, tubular glucose reabsorption and renal glucose consumption. The kidneys use glucose at a rate of 100 μmol/min (26 g/day) in the post-absorptive state in humans.7,8 Under normal conditions, 80%–90% of gluconeogenesis takes place in the liver, while the kidney is responsible for 10%–20% of this process. In contrast, under conditions of starvation the glucose supplied by the liver via glycogenolysis remains available for 12–18 hours and the proportion of gluconeogenesis carried out by the kidneys is increased to 40%–50%.9,10 Lactate is a major precursor of the products of renal gluconeogenesis, accounting for 50% of the renal gluconeogenesis observed in the post-absorptive state in humans, while glutamine, glycerol, and alanine account for 20%, 6%, and 2%, respectively.9,11,12 A recent study utilizing microdissected human proximal tubules demonstrated that glutamate and lactate have the same capacity as substrates of gluconeogenesis in the S1 segment, while lactate functions as the major substrate in the S2 and S3 segments.13 Renal gluconeogenesis is regulated by the levels of insulin and catecholamines as well as the effects of acidosis and starvation, whereas glucagon has a greater effect on hepatic gluconeogenesis.14–16 Notably, the mechanisms underlying gluconeogenesis regulation by the renin-angiotensin system have not yet been thoroughly elucidated.
In patients with type 2 diabetes mellitus, the amount of glucose released from the kidneys is increased by 300%, compared to 30% in the liver, which results in an equal contribution to net glucose production between the liver and kidneys.17 Renal glucose uptake is also increased in type 2 diabetes mellitus,17and the inhibition of SGLT2 subsequently lowered the plasma glucose levels to a significant degree.18 It has also been reported that angiotensin receptor blockers (ARBs) inhibit the onset of diabetes,19 although the mechanism underlying this process has not yet been clarified. Therefore, in order to elucidate the anti-diabetic mechanisms of ARB, we investigated the effects of ARBs on the SGLT expression and renal gluconeogenesis in diabetic rats.
Methods
Animal experiments
Female Sprague Dawley rats weighing 180–200 g (Charles River Laboratories, Shizuoka, Japan) were fed with free access to tap water and a standard rat diet. Diabetes was induced via a single tail vein injection of streptozotocin (STZ; 60 mg/kg body weight; Sigma-Aldrich Co, St Louis, MO, USA) (diabetic rats, n=14) diluted in citrate buffer, pH 4.5; the control rats (n=7) were injected with an equal volume of citrate buffer. Two weeks after STZ injection, we started experiments when the plasma glucose level was more than 200 mg/dL at 9 am under fed conditions with glucosuria of 4+. Seven of the DM rats were treated with telmisartan (3 mg/kg/day in drinking water, Boehringer Ingelheim, Ingelheim, Germany), as described previously.20 Two weeks later, 24-hour urine and blood samples were collected on the first day with free access to water and food and the second day without food for 24 hours. The blood pressure was measured with an abdominal catheter using a transducer under anesthesia with pentobarbital (50 mg/kg body weight). After measuring the blood pressure, the right kidney and the liver were removed under euthanasia with pentobarbital and immediately frozen and used for Western blotting, while the left kidney and a slice of the liver were immersed in periodate-lysine-paraformaldehyde solution and embedded in wax for the immunohistochemical studies. All procedures were conducted in accordance with the Guidelines for Animal Experimentation of the Faculty of Medicine, The University of Tokyo and approved by the Medical Experimental Animal Ethics Committee of the University of Tokyo (P10-079).
Intravenous insulin tolerance tests
Intravenous insulin tolerance tests (ITTs) were performed to assess the degree of insulin resistance. Glucose (0.7 g/kg body weight) and rapid insulin (0.175 unit/kg body weight) were injected through a jugular vein catheter, and blood samples were obtained on order to measure the glucose levels at 0, 2, 4, 6, 8, 10, 20, and 30 minutes after glucose-insulin injection. The extent of insulin resistance was evaluated according to the K index of ITT using the formula below.21

Western blotting
As described in detail previously,20,22 the whole kidneys were homogenized with a tissue homogenizer in a 5-fold volume of 20 mmol/L Tris buffer with proteinase inhibitors, followed by centrifugation at 4°C and 5,000 g for 15 minutes. The supernatants were centrifuged at 48,000 g for 60 minutes at 4°C to separate membrane fractions from cytosolic fractions. Then samples were diluted in the same volume of sodium dodecyl sulfate buffer, and samples containing 50 μg of protein were resolved on a 4%–20% gradient gel (Daiichi Pure Chemicals, Tokyo, Japan) and electroblotted to polyvinylidene fluoride membranes. The membranes were subsequently incubated with 5% non-fat dried milk in Tris-buffered saline containing 0.1% Tween 20 (TBST) followed by overnight incubation with rabbit polyclonal antibodies for SGLT2 (Abcam, Tokyo, Japan), glucose-6-phosphatase (G6Pase) (Abcam), or phosphoenolpyruvate carboxykinase (PEPCK) (Abcam) at 1:500 dilution. Then, the membranes were incubated with a horseradish peroxidase (HRP)-conjugated secondary antibody against rabbit immunoglobulin G (IgG; Dako Denmark A/S, Glostrup, Denmark) at 1:1,000 dilution, and the bands were detected by diaminobenzidine (DAB, 8 mmol/L) with 0.01% H2O2 and 3 mmol/L of NiCl2. As loading control, the membranes were incubated with anti-beta actin antibody (Abcam), and processed as mentioned above. The density of the bands was analyzed using the National Institutes of Health Image software program (version 1.63).
Immunohistochemistry
Tissue specimens embedded in wax were processed for immunohistochemistry, as previously described.23 Sections (2 μm in thickness) were dewaxed and incubated with citrate buffer (pH 6) at 100°C for 20 minutes in order to retrieve the antigens and then sections were incubated with 3% H2O2 and blocking serum followed by polyclonal antibodies against SGLT2 (Abcam), G6Pase (Abcam), or PEPCK (Abcam) at 1:200 dilution. The sections were subsequently incubated with an HRP-conjugated secondary antibody against rabbit IgG (Dako Denmark A/S) at 1:50 dilution, and HRP labeling was detected using DAB reaction. The sections were then counterstained with periodic acid-Schiff staining before being examined under a light microscope. Two sections from each animal were stained at the same time with concurrent processing, and evaluated using the unlabeled blind procedure.
Pre-embedding immune electron microscopy
Kidney sections of 50 μm in thickness were cut with a vibratome and processed for the pre-embedding electron microscopic immunoperoxidase procedure, as previously described.24,25 Briefly, the sections were incubated with polyclonal antibodies against SGLT2 (Abcam) at 1:100 dilution, and then, incubated with an HRP-conjugated secondary antibody against rabbit IgG (Dako Denmark A/S) in 1:50 dilution, followed by DAB reaction. The sections were embedded in epoxy resin, and ultrathin sections were observed on a transmission electron microscope (H-7000; Hitachi Ltd, Tokyo, Japan).
Measurement of the glucose, HbA1c, insulin, glucose-6-phosphate, glycogen, and protein levels
The glucose levels in the blood, urine, and renal cytoplasm were measured using the Glutest Pro R device (Arkray Factory, Shiga, Japan). In addition, the glycated hemoglobin (HbA1c) level was measured using the DCA 2000 plus system (Bayer Medical, Tokyo, Japan). The glucose-6-phosphate level in the renal cytoplasm was measured according to the instructions for the Glucose-6-Phospate assay kit (Abcam), and glycogen level in the liver cytoplasm was measured according to the instructions for the glycogen assay kit (BioVision, Milpitas, CA, USA). Meanwhile, the plasma insulin level was measured using a rat insulin assay kit (Morinaga, Yokohama, Japan), and the protein concentration was determined according to a Bio-Rad protein assay (Bio-Rad Laboratories Inc., Hercules, CA, USA).
Statistical analysis
The data are expressed as the means ± standard error. An analysis of variance (ANOVA) with the Bonferroni post hoc test was used for statistical comparisons with a normal distribution. A P-value of <0.05 was defined as indicating statistical significance.
Results
Physiological data and fasting plasma glucose levels
The STZ-induced diabetic rats showed a significant reduction in body weight and increase in both proteinuria and creatinine clearance, while telmisartan treatment significantly reduced the proteinuria and systolic blood pressure (Table 1). In addition, the increased fasting plasma glucose levels observed after 24 hours of starvation in the diabetic rats were significantly reduced by telmisartan treatment, whereas the casual plasma glucose levels measured at noon under free access to food did not show any differences between the untreated diabetic rats and the diabetic rats treated with telmisartan (Figure 1). Interestingly, telmisartan treatment resulted in a significant decrease in the level of urinary glucose excretion during the 24-hour starvation period as well as under the conditions of free access to food. In contrast, elevated HbA1c levels in diabetic rats were not reduced significantly by telmisartan treatment.
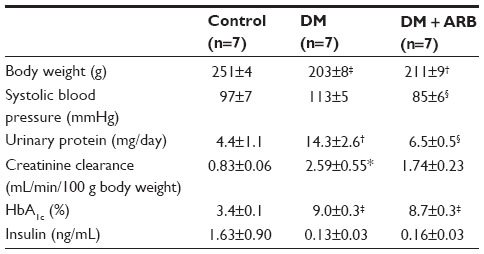 | Table 1 Physiological data |
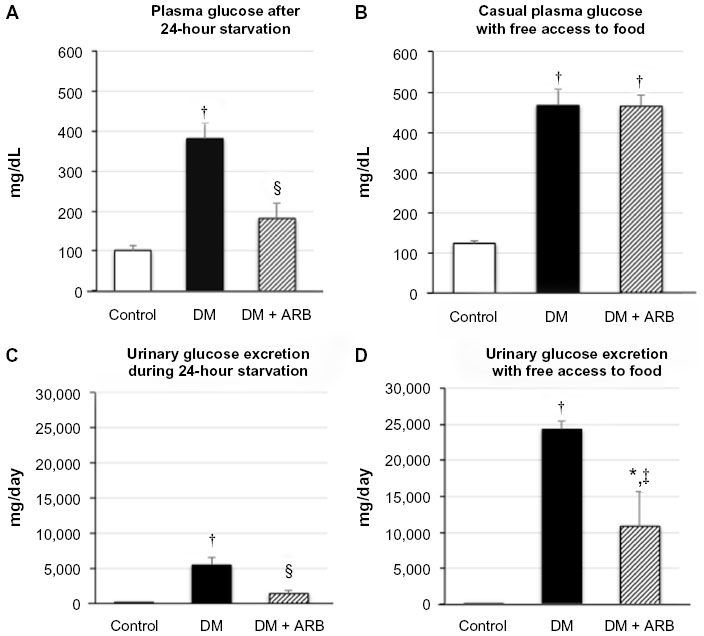 | Figure 1 Plasma glucose concentration (A and B) and urinary glucose excretion (C and D) following 24 hours of starvation (A and C) or under post-prandial conditions (B and D). |
SGLT2 expression in the kidneys
The SGLT2 expression in the kidneys was investigated in the diabetic rats using pre-embedding electron microscopy. It is possible to distinguish the nephron segments of S1 to S3 of proximal tubules with electron microscopy. Consequently, immunoreactivity for SGLT2 was detected strongly at the brush border membrane in the S1 segment of the proximal convoluted tubules, as identified by a thick brush border and cell body, and in the S2 segment, as recognized by a thinner brush border and prominent basal digitation. The S3 segment of the proximal straight tubules, which exhibited the thickest brush border and cuboidal cell bodies, was negative for immunoreactivity against SGLT2 (Figure 2, upper panel). Meanwhile, the SGLT2 expression in the proximal convoluted tubules was more significantly enhanced in the diabetic rats than in the control rats on immunostaining and Western blotting of the membrane fraction of the kidney homogenates (Figure 3). Immuno-electron microscopy revealed staining for SGLT2 at both the brush border membrane and in some apical vesicles in the diabetic rats (Figure 2, lower panel). Furthermore, ARB treatment suppressed the SGLT2 expression in the brush border membrane of the proximal convoluted tubules.
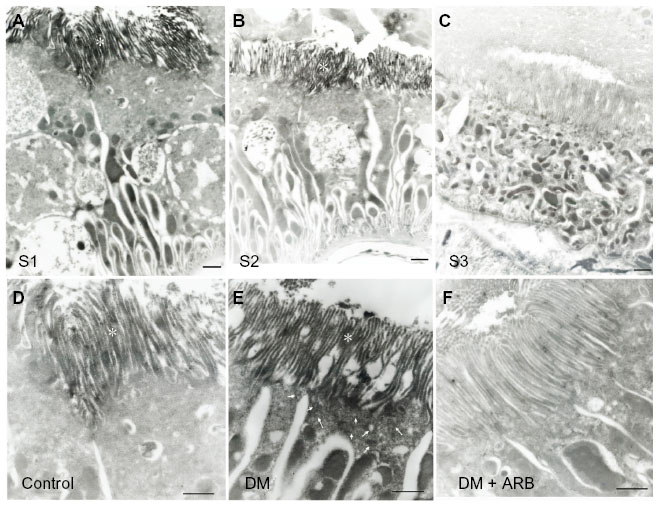 | Figure 2 Pre-embedding immuno-electron microscopy for SGLT2. |
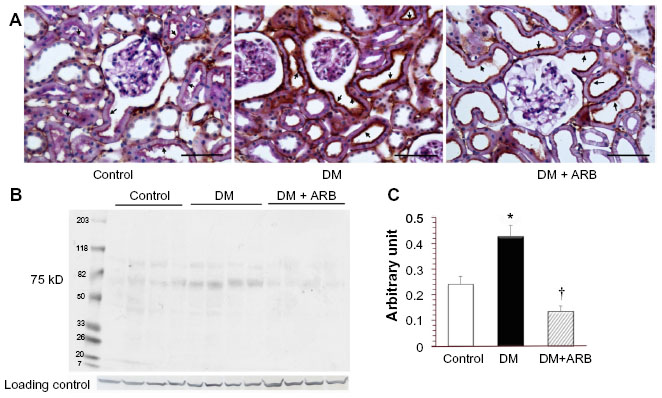 | Figure 3 Light microscopic immunostaining (A) and a Western blot analysis (B and C) for SGLT2. |
Renal gluconeogenesis
We investigated the expression levels of restriction enzymes for renal gluconeogenesis after 24 hours of starvation. Consequently, PEPCK was found to be expressed in both the proximal and distal tubules, with an increased expression in the diabetic rats according to immunostaining and a Western blot analysis. Meanwhile, treatment with telmisartan reduced the renal PEPCK expression (Figure 4). The other restriction enzyme for gluconeogenesis is G6Pase, which was faintly expressed in the control kidneys, whereas its expression was increased in the diabetic rats. Telmisartan treatment subsequently restored the G6Pase expression to the control level (Figure 4). Furthermore, the renal cytoplasmic glucose-6-phosphate and glucose concentrations were significantly higher in the diabetic rats than in the control rats, and telmisartan treatment reduced the renal cytoplasmic glucose levels to the control range (Figure 5).
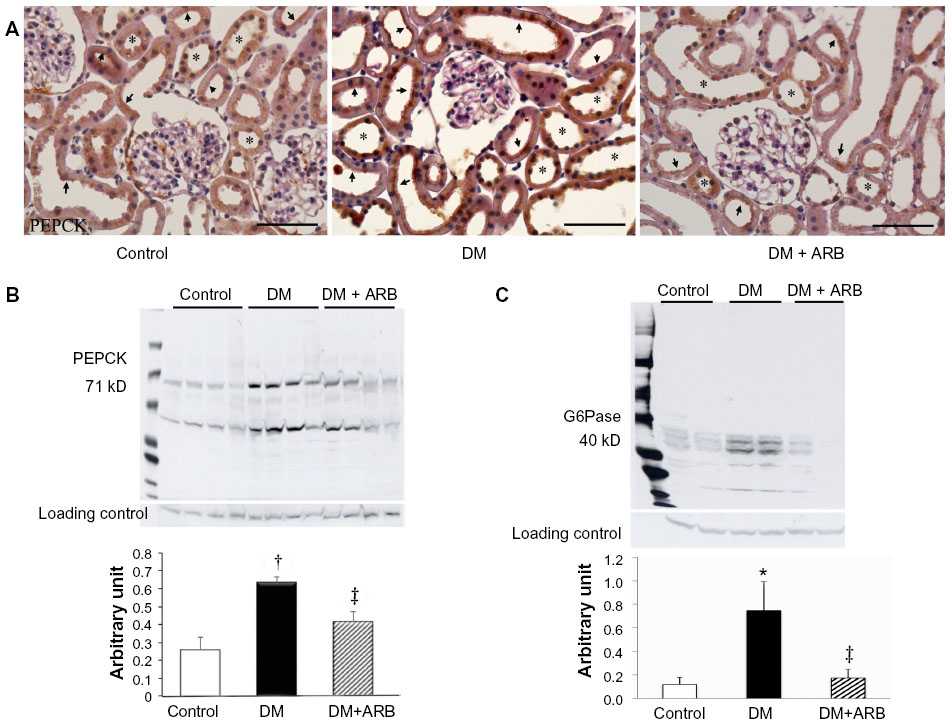 | Figure 4 Expression of renal gluconeogenesis restriction enzymes, phosphoenolpyruvate carboxykinase (PEPCK) and glucose-6-phosphatase (G6Pase). |
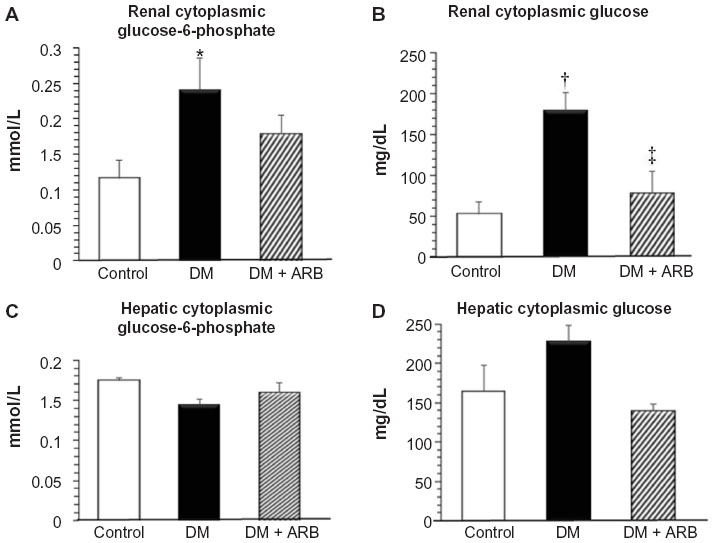 | Figure 5 Cytoplasmic glucose-6-phosphate (A and C) and glucose (B and D) levels in the kidney (A and B) and liver (C and D). |
Glycogen storage and gluconeogenesis in the liver
The hepatic PEPCK expression and the extent of glycogen storage in the liver was increased in the diabetic rats and subsequently reduced by telmisartan therapy (Figure 6). However, the hepatic glucose-6-phosphate and glucose levels did not differ significantly among the three groups after 24 hours of starvation (Figure 5).
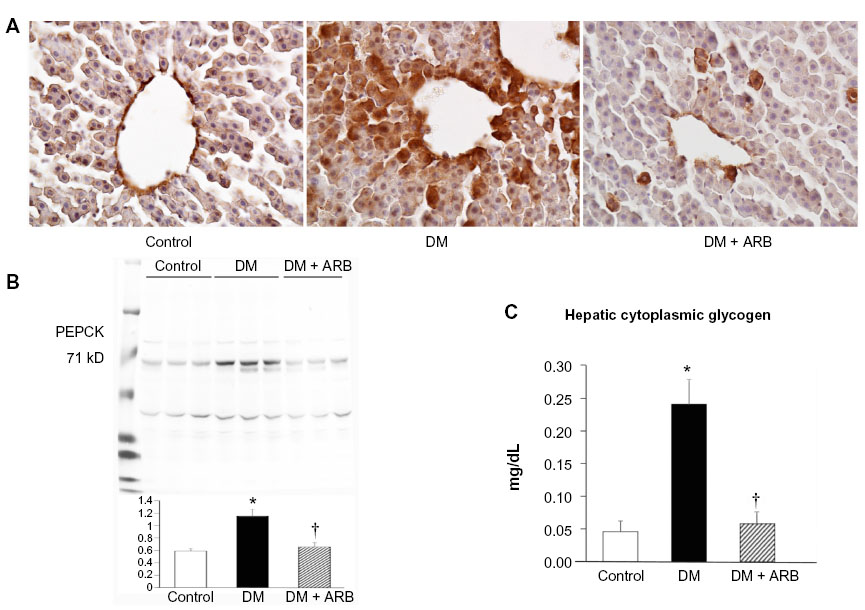 | Figure 6 Hepatic gluconeogenesis and glycogen storage. |
Insulin sensitivity
In order to evaluate the degree of insulin sensitivity, intravenous insulin-glucose injection tests were performed. The plasma glucose levels reached a peak at 2 minutes after insulin-glucose injection and returned to baseline after 30 minutes in the control rats, whereas they were continuously elevated in the diabetic rats (Figure 7). Telmisartan treatment ameliorated the poor insulin-sensitivity to almost control level. Furthermore, the KITT values, an index of insulin sensitivity, were significantly lower in the diabetic rats than in the control rats and were subsequently returned to the control level by telmisartan treatment (Figure 7).
 | Figure 7 Intravenous insulin tolerance test (ITT) (A) and the K index of ITT (B). |
Discussion
In this study, we demonstrated that renal gluconeogenesis and renal glucose reabsorption via SGLT2, hepatic gluconeogenesis and glycogen storage and insulin resistance were increased in the diabetic rats, and they were returned to normal level by treatment with telmisartan. The anti-diabetic effect of telmisartan became obvious after 24-hour starvation, and plasma glucose level in the diabetic rats was significantly lowered by the treatment with telmisartan associated with suppression of renal cytoplasmic glucose level via reduction of renal gluconeogenesis and SGLT2 expression.
We demonstrated that the proximal tubular expression of SGLT2 was increased in the diabetic rats. However, in cultured tubular cells, it has been reported that the SGLT2 activity is suppressed by high glucose levels26 and that the cellular glucose uptake is reduced by the effects of oxidative stress and protein kinase C (PKC).27 Similar to the results obtained in the current in vivo studies of an early-stage type 1 diabetes model, several studies have demonstrated an enhanced SGLT2 expression in the kidneys in both type 1 and type 2 diabetic animal models.6,28 Furthermore, proximal tubular cells obtained from human type 2 diabetes patients have been shown to exhibit an increased SGLT2 expression.29 In the present study, electron microscopic immunocytochemistry revealed staining with the SGLT2 antibody in some apical vesicles in the diabetic rats, thus suggesting the regulation of SGLT2 by membrane recycling.
In the current study, we were unable to detect any significant immunoreactivity for SGLT1 in the kidneys (data not shown). It has also been demonstrated that the SGLT1 messenger ribonucleic acid and protein levels are increased in STZ diabetic rats,30,31 and restored by insulin treatment.31 In this study, the expression of SGLT2 in the kidneys was suppressed by treatment with ARB telmisartan. In a previous in vitro study of the intestinal mucosa, angiotensin II suppressed the SGLT1 expression.32 On the other hand, the renal angiotensin II levels are increased under condition of diabetes,20 and angiotensin II suppresses the H+-ATPase activity,33 resulting in reduced membrane recycling of SGLT2 in the proximal tubules. Furthermore, angiotensin II has been reported to increase the SGLT2 expression in the kidneys in hypertensive rats, while ARB treatment suppresses the expression.34 In the present study, the ARB telmisartan reversed the increased SGLT2 expression levels in the kidneys and contributed to a reduction in the fasting plasma glucose levels.
Renal gluconeogenesis is responsible for 20%–25% of glucose production, while the proportion of liver gluconeogenesis is 75%–80% after overnight fasting under normal conditions.9,10 In the current study, the hepatic PEPCK expression and the extent of glycogen storage in the liver were significantly higher in the diabetic rats than in the control rats (Figure 6). However, hepatic cytoplasmic glucose-6-phosphate and glucose levels did not change significantly after 24-hour starvation. The hepatic glucose production has been reported to be increased in diabetic rats compared with control rats due to glycogenolysis, but not hepatic gluconeogenesis,35 and the hepatic glucose production due to glycogenolysis does not continue after 24 hours of starvation. In this study, the hepatic PEPCK expression was increased in diabetic rats, which may be explained by the decreased insulin levels observed in this model, as the hepatic PEPCK level is increased by glucagon and cortisol and suppressed by insulin. Renal gluconeogenesis has a more important role under fasting conditions, accounting for up to 40%–50% of systemic glucose production,9,10 whereas the rate of renal gluconeogenesis increases by approximately 300% in subjects with diabetes versus controls, using glutamate and lactate as substrates.9,10,17 In the present report, the levels of renal restriction enzymes for gluconeogenesis, including PEPCK and G6Pase, were significantly increased in the diabetic kidneys on both immunohistochemistry and Western blotting (Figure 4). The mechanisms underlying the inhibitory effects of telmisartan on enhanced gluconeogenesis in the diabetic kidney are not clear. However, as angiotensin II stimulates gluconeogenesis,36 an elevated renal angiotensin II expression may increase the rate of renal gluconeogenesis in the diabetic kidney, and thus, ARB treatment reduces the extent of renal gluconeogenesis and renal cytoplasmic glucose level. In contrast to hepatic gluconeogenesis regulated by glucagon and insulin, renal gluconeogenesis is regulated to a greater extent by the effects of acidosis and starvation.37,38 As angiotensin II suppresses the activity of H+-ATPase in the kidneys,33 the renal intracellular pH may become acidic in the diabetic rats, thereby resulting in enhanced renal PEPCK production, while ARB therapy may reduce the PEPCK expression by blocking the action of angiotensin II in regulating the intracellular pH. Recently, a pH regulatory unit was detected in the promoter region of PEPCK in the kidneys.38,39 Further research is therefore necessary to clarify the mechanisms underlying the effects of ARBs on renal gluconeogenesis.
It was interesting to note that the glucose-lowering effects of ARB therapy became apparent after 24 hours of starvation whereas the casual plasma glucose and HbA1c levels did not display any significant changes in this study. These findings are consistent with the clinical observation that ARB treatment does not appear to strongly reduce the glucose level. Renal gluconeogenesis plays an important role in maintaining the plasma glucose level under conditions of starvation; therefore, the inhibition of PEPCK and G6Pase by telmisartan actually reduced the fasting plasma glucose levels in the current study. In contrast, when the rats were given free access to food, the casual plasma glucose levels did not differ significantly between the untreated diabetic rats and the diabetic rats treated with telmisartan. Meanwhile, the rate of urinary glucose excretion was significantly reduced under feeding conditions in the diabetic rats treated with telmisartan. This finding may be explained by the improvement in insulin sensitivity induced by telmisartan. Telmisartan has a PPAR-γ agonist action that regulates carbohydrate and lipid metabolism and also exhibits anti-inflammatory and anti-oxidative effects, thereby ameliorating insulin sensitivity.40–42 In the present study, we observed a reduction in the degree of hepatic glycogen accumulation induced by telmisartan, which is consistent with the findings of a previous report in which telmisartan improved the extent of nonalcoholic steatohepatitis in rats.43 The various effects of telmisartan including the reduction of renal gluconeogenesis, suppression of the renal SGLT2 expression, inhibition of hepatic glycogen accumulation, and improvements in insulin sensitivity, may contribute to its ability to ameliorate glycemic control in diabetic rats.
Angiotensin II receptor blockade by valsartan also reduces the plasma glucose level by decreasing the hepatic PEPCK expression and increasing the muscular GLUT4 expression in STZ-induced diabetic rats.44 Therefore, the plasma glucose-lowering effects of ARBs are not specific to telmisartan. Further studies are thus required to clarify the molecular mechanisms underlying the effects of telmisartan on glycemic control.
In conclusion, the angiotensin receptor blocker telmisartan reduced renal cytoplasmic glucose level via suppression of SGLT2 expression and renal gluconeogenesis in the diabetic rats, thereby reducing the fasting plasma glucose levels under conditions of starvation, in which renal gluconeogenesis usually contributes to approximately half of normal glucose production.
Acknowledgment
This work was partly supported by a Grant-in-aid for scientific research from the Japan Science Promotion Foundation to AT (C-23591214).
Disclosure
AT received financial support to perform morphological research from Boehringer Ingelheim Japan. MN received lecture fees and research grants from Astellas and Boehringer Ingelheim Japan. All the other authors declare no conflicts of interests in this study.
References
Mather A, Pollock C. Glucose handling by the kidney. Kidney Int Suppl. 2011;120:S1–S6. | |
Wright EM, Loo DD, Hirayama BA. Biology of human sodium glucose transporters. Physiol Rev. 2011;91(2):733–794. | |
Maldonado-Cervantes MI, Galicia OG, Moreno-Jaime B, et al. Autocrine modulation of glucose transporter SGLT2 by IL-6 and TNF-alpha in LLC-PK(1) cells. J Physiol Biochem. 2012;68(3):411–420. | |
Beloto-Silva O, Machado UF, Oliveira-Souza M. Glucose-induced regulation of NHEs activity and SGLTs expression involves the PKA signaling pathway. J Membr Biol. 2011;239(3):157–165. | |
Ghezzi C, Wright EM. Regulation of the human Na+-dependent glucose cotransporter hSGLT2. Am J Physiol Cell Physiol. 2012;303(3):C348–C354. | |
Tabatabai NM, Sharma M, Blumenthal SS, Petering DH. Enhanced expressions of sodium-glucose cotransporters in the kidneys of diabetic Zucker rats. Diabetes Res Clin Pract. 2009;83(1):e27–e30. | |
Gerich JE, Meyer C, Woerle HJ, Stumvoll M. Renal gluconeogenesis: its importance in human glucose homeostasis. Diabetes Care. 2001;24(2):382–391. | |
Stumvoll M, Meyer C, Mitrakou A, Nadkarni V, Gerich JE. Renal glucose production and utilization: new aspects in humans. Diabetologia. 1997;40(7):749–757. | |
Meyer C, Stumvoll M, Dostou J, Welle S, Haymond M, Gerich J. Renal substrate exchange and gluconeogenesis in normal postabsorptive humans. Am J Physiol Endocrinol Metab. 2002;282(2):E428–E434. | |
Gerich JE. Role of the kidney in normal glucose homeostasis and in the hyperglycaemia of diabetes mellitus: therapeutic implications. Diabet Med. 2010;27(2):136–142. | |
Stumvoll M, Meyer C, Perriello G, Kreider M, Welle S, Gerich J. Human kidney and liver gluconeogenesis: evidence for organ substrate selectivity. Am J Physiol. 1998;274(5 Pt 1):E817–E826. | |
Meyer C, Woerle HJ, Dostou JM, Welle S, Gerich J. Abnormal renal, hepatic, and muscle glucose metabolism following glucose ingestion in type 2 diabetes. Am J Physiol Endocrinol Metab. 2004;287(6):E1049–E1056. | |
Conjard A, Martin M, Guitton J, Baverel G, Ferrier B. Gluconeogenesis from glutamine and lactate in the isolated human renal proximal tubule: longitudinal heterogeneity and lack of response to adrenaline. Biochem J. 2001;360(Pt 2):371–377. | |
Meyer C, Dostou JM, Gerich JE. Role of the human kidney in glucose counterregulation. Diabetes. 1999;48(5):943–948. | |
Cersosimo E, Garlick P, Ferretti J. Renal glucose production during insulin-induced hypoglycemia in humans. Diabetes. 1999;48(2):261–266. | |
Cersosimo E, Garlick P, Ferretti J. Renal substrate metabolism and gluconeogenesis during hypoglycemia in humans. Diabetes. 2000;49(7):1186–1193. | |
Meyer C, Stumvoll M, Nadkarni V, Dostou J, Mitrakou A, Gerich J. Abnormal renal and hepatic glucose metabolism in type 2 diabetes mellitus. J Clin Invest. 1998;102(3):619–624. | |
Komala MG, Panchapakesan U, Pollock C, Mather A. Sodium glucose cotransporter 2 and the diabetic kidney. Curr Opin Nephrol Hypertens. 2013;22(1):113–119. | |
Gillespie EL, White CM, Kardas M, Lindberg, M, Coleman CI. The impact of ACE inhibitors or angiotensin II type 1 receptor blockers on the development of new-onset type 2 diabetes. Diabetes Care. 2005;28(9):2261–2266. | |
Onozato ML, Tojo A, Leiper J, Fujita T, Palm F, Wilcox CS. Expression of NG, NG-dimethylarginine dimethylaminohydrolase and protein arginine N-methyltransferase isoforms in diabetic rat kidney: effects of angiotensin II receptor blockers. Diabetes. 2008;57(1):172–180. | |
Bonora E, Moghetti P, Zancanaro C, et al. Estimates of in vivo insulin action in man: comparison of insulin tolerance tests with euglycemic and hyperglycemic glucose clamp studies. J Clin Endocrinol Metab. 1989;68(2):374–378. | |
Onozato ML, Tojo A, Goto A, Fujita T, Wilcox CS. Oxidative stress and nitric oxide synthase in rat diabetic nephropathy: effects of ACEI and ARB. Kidney Int. 2002;61(1):186–194. | |
Tojo A, Onozato ML, Kitiyakara C, et al. Glomerular albumin filtration through podocyte cell body in puromycin aminonucleoside nephrotic rat. Med Mol Morphol. 2008;41(2):92–98. | |
Tojo A, Onozato ML, Fukuda S, Asaba K, Kimura, K, Fujita T. Nitric oxide generated by nNOS in the macula densa regulates the afferent arteriolar diameter in rat kidney. Med Electron Microsc. 2004;37(4):236–241. | |
Kinugasa S, Tojo A, Sakai T, et al. Selective albuminuria via podocyte albumin transport in puromycin nephrotic rats is attenuated by an inhibitor of NADPH oxidase. Kidney Int. 2011;80(12):1328–1338. | |
Han HJ, Lee YJ, Park SH, Lee JH, Taub M. High glucose-induced oxidative stress inhibits Na+/glucose cotransporter activity in renal proximal tubule cells. Am J Physiol Renal Physiol. 2005;288(5):F988–F996. | |
Han HJ, Choi HJ, Park SH. High glucose inhibits glucose uptake in renal proximal tubule cells by oxidative stress and protein kinase C. Kidney Int. 2000;57(3):918–926. | |
Osorio H, Bautista R, Rios A, et al. Effect of phlorizin on SGLT2 expression in the kidney of diabetic rats. J Nephrol. 2010;23(5):541–546. | |
Rahmoune H, Thompson PW, Ward JM, Smith CD, Hong G, Brown J. Glucose transporters in human renal proximal tubular cells isolated from the urine of patients with non-insulin-dependent diabetes. Diabetes. 2005;54(12):3427–3434. | |
Masumoto S, Akimoto Y, Oike H, Kobori M. Dietary phloridzin reduces blood glucose levels and reverses Sglt1 expression in the small intestine in streptozotocin-induced diabetic mice. J Agric Food Chem. 2009;57(11):4651–4656. | |
Cersosimo E, Molina PE, Abumrad NN. Renal lactate metabolism and gluconeogenesis during insulin-induced hypoglycemia. Diabetes. 1998;47(7):1101–1106. | |
Wong TP, Debnam ES, Leung PS. Diabetes mellitus and expression of the enterocyte renin-angiotensin system: implications for control of glucose transport across the brush border membrane. Am J Physiol Cell Physiol. 2009;297(3):C601–C610. | |
Tojo A, Tisher CC, Madsen KM. Angiotensin II regulates H+-ATPase activity in rat cortical collecting duct. Am J Physiol. 1994;267(6 Pt 2):F1045–F1051. | |
Bautista R, Manning R, Martinez F, et al. Angiotensin II-dependent increased expression of Na+-glucose cotransporter in hypertension. Am J Physiol Renal Physiol. 2004;286(1):F127–F133. | |
Jin ES, Park BH, Sherry AD, Malloy CR. Role of excess glycogenolysis in fasting hyperglycemia among pre-diabetic and diabetic Zucker (fa/fa) rats. Diabetes. 2007;56(3):777–785. | |
Guder WG. Stimulation of renal gluconeogenesis by angiotensin II. Biochim Biophys Acta. 1979;584(3):507–519. | |
Burch HB, Narins RG, Chu C, et al. Distribution along the rat nephron of three enzymes of gluconeogenesis in acidosis and starvation. Am J Physiol. 1978;235(3):F246–F253. | |
Curthoys NP, Gstraunthaler G. pH-responsive, gluconeogenic renal epithelial LLC-PK1-FBPase+cells: a versatile in vitro model to study renal proximal tubule metabolism and function. Am J Physiol Renal Physiol. 2014;307(1):F1–F11. | |
Yang J, Reshef L, Cassuto H, Aleman G, Hanson RW. Aspects of the control of phosphoenolpyruvate carboxykinase gene transcription. J Biol Chem. 2009;284(40):27031–27035. | |
Benson SC, Pershadsingh HA, Ho CI, et al. Identification of telmisartan as a unique angiotensin II receptor antagonist with selective PPARgamma-modulating activity. Hypertension. 2004;43(5):993–1002. | |
Schupp M, Clemenz M, Gineste R, et al. Molecular characterization of new selective peroxisome proliferator-activated receptor gamma modulators with angiotensin receptor blocking activity. Diabetes. 2005;54(12):3442–3452. | |
Cianchetti S, Del Fiorentino A, Colognato R, Di Stefano R, Franzoni F, Pedrinelli R. Anti-inflammatory and anti-oxidant properties of telmisartan in cultured human umbilical vein endothelial cells. Atherosclerosis. 2008;198(1):22–28. | |
Nakagami H, Kiomy Osako M, Nakagami F, et al. Prevention and regression of non-alcoholic steatohepatitis (NASH) in a rat model by metabosartan, telmisartan. Int J Mol Med. 2010;26(4):477–481. | |
Chan P, Liu IM, Tzeng TF, Yang TL, Cheng JT. Mechanism for blockade of angiotensin subtype 1 receptors to lower plasma glucose in streptozotocin-induced diabetic rats. Diabetes Obes Metab. 2007;9(1):39–49. |
 © 2015 The Author(s). This work is published and licensed by Dove Medical Press Limited. The full terms of this license are available at https://www.dovepress.com/terms.php and incorporate the Creative Commons Attribution - Non Commercial (unported, v3.0) License.
By accessing the work you hereby accept the Terms. Non-commercial uses of the work are permitted without any further permission from Dove Medical Press Limited, provided the work is properly attributed. For permission for commercial use of this work, please see paragraphs 4.2 and 5 of our Terms.
© 2015 The Author(s). This work is published and licensed by Dove Medical Press Limited. The full terms of this license are available at https://www.dovepress.com/terms.php and incorporate the Creative Commons Attribution - Non Commercial (unported, v3.0) License.
By accessing the work you hereby accept the Terms. Non-commercial uses of the work are permitted without any further permission from Dove Medical Press Limited, provided the work is properly attributed. For permission for commercial use of this work, please see paragraphs 4.2 and 5 of our Terms.