")
Back to Journals » International Journal of Nanomedicine » Volume 9 » Issue 1
Aneuploidogenic effects and DNA oxidation induced in vitro by differently sized gold nanoparticles
Authors Di Bucchianico S, Fabbrizi MR, Cirillo S, Uboldi C, Gilliland D, Valsami-Jones E, Migliore L
Received 27 November 2013
Accepted for publication 27 December 2013
Published 8 May 2014 Volume 2014:9(1) Pages 2191—2204
DOI https://doi.org/10.2147/IJN.S58397
Checked for plagiarism Yes
Review by Single anonymous peer review
Peer reviewer comments 3
Sebastiano Di Bucchianico,1 Maria Rita Fabbrizi,1 Silvia Cirillo,1 Chiara Uboldi,1 Douglas Gilliland,2 Eugenia Valsami-Jones,3,4 Lucia Migliore1
1Department of Translational Research and New Technologies in Medicine and Surgery, Medical Genetics Unit, University of Pisa, Pisa, Italy; 2European Commission-Joint Research Centre, Institute for Health and Consumer Protection, NanoBioSciences Unit, Ispra, Italy; 3School of Geography, Earth and Environmental Sciences, University of Birmingham, Edgbaston, Birmingham, UK; 4Earth Sciences, Natural History Museum, Cromwell Road, London, UK
Abstract: Gold nanoparticles (Au NPs) are used in many fields, including biomedical applications; however, no conclusive information on their potential cytotoxicity and genotoxicity mechanisms is available. For this reason, experiments in human primary lymphocytes and murine macrophages (Raw264.7) were performed exposing cells to spherical citrate-capped Au NPs with two different nominal diameters (5 nm and 15 nm). The proliferative activity, mitotic, apoptotic, and necrotic markers, as well as chromosomal damage were assessed by the cytokinesis-block micronucleus cytome assay. Fluorescence in situ hybridization with human and murine pancentromeric probes was applied to distinguish between clastogenic and aneuploidogenic effects. Our results indicate that 5 nm and 15 nm Au NPs are able to inhibit cell proliferation by apoptosis and to induce chromosomal damage, in particular chromosome mis-segregation. DNA strand breaks were detected by comet assay, and the modified protocol using endonuclease-III and formamidopyrimidine-DNA glycosylase restriction enzymes showed that pyrimidines and purines were oxidatively damaged by Au NPs. Moreover, we show a size-independent correlation between the cytotoxicity of Au NPs and their tested mass concentration or absolute number, and genotoxic effects which were more severe for Au NP 15 nm compared to Au NP 5 nm. Results indicate that apoptosis, aneuploidy, and DNA oxidation play a pivotal role in the cytotoxicity and genotoxicity exerted by Au NPs in our cell models.
Keywords: Au nanoparticles, cytotoxicity, aneuploidy, oxidative DNA damage, micronuclei, particle size
Introduction
Evidence has emerged for the important role of physicochemical properties in controlling the cellular uptake and toxicity of nanoparticles in a biological system. In vitro uptake of gold nanoparticles (Au NPs) depends on the particle physical dimensions, suggesting that size and shape can mediate particle–cell interactions, receptor recycling rates and exocytosis.1 Au NPs enter the cells via a clathrin-mediated endocytosis and are exocytosed by a size-dependent relationship.2 It is also known that 10–100 nm gold particles can enter or exit cells via wrapping, even in the absence of clathrin- or caveolin-coated vesicles.3 However, the toxicity of Au NPs, as well as of others such as silver NPs, might not correlate with the level of uptake but cell-type and the size can play a role.4,5 In fact, 20 nm citrated Au NPs resulted as more toxic than 14 nm ones in ovarian hamster’s cells but not in bronchial and kidney derived cell cultures.4 However, even if it is recognized that the cell type plays a role in the uptake of Au NPs, the size is not involved: differently sized Au NPs displayed a similar uptake in epithelial (A549 and NCIH441) and in endothelial (HDMEC and hCMEC) cells, but endothelial cells were shown to internalize a higher amount of Au NPs than epithelial ones.6,7 Despite these indications, it remains unclear how the physicochemical properties of NPs change when the exposure occurs in a biological system. In fact, it is known that different serum proteins form protein coronas, which significantly modulate NPs behavior.8 The cellular environment contains a variety of proteins rapidly adsorbing onto the surface of NPs and forming a protein corona which defines the NPs biological identity, altering size, aggregation state, surface chemistry, uptake and ion release.9 The alteration of these physicochemical properties can result in increasing or protecting from NPs toxicity. Since Au NPs are used in medical applications, such as photothermal therapy,10 and are often administered intravenously, the adsorption of blood proteins onto their surface is one of the most relevant and studied parameters. Blood is a complex human-derived proteome and contains other tissue subsets of proteins,11 which potentially interact with NPs changing their physicochemical characteristics and their biological identity. For example, NPs size and surface chemistry can mediate plasma and serum protein adsorption to Au NPs and their biological responses and/or uptake by macrophages.12,13 From the different proteins accumulation patterns, observed as a result of differently sized and surface-charged Au NPs administered intravenously to rats, Hirn et al concluded that the alterations of the Au NPs surface area, determined by the size of the particles, are the main mechanism determining Au NPs accumulation in various organs and tissues.14 Size-dependent tissue distribution of Au NPs was observed upon intravenous administration in mice and size-dependent alterations occurred in vivo in the hepatic tissue of exposed rats.15,16 In contrast, monodispersed Au NPs did not exert a higher acute effect compared to their agglomerates, when using pulmonary inflammation as a marker for toxicity after intratracheal instillation in rats.17 Furthermore, the model organism Drosophila melanogaster showed DNA fragmentation and significant concentration-dependent and size-independent modulation of expression levels of the genes involved in stress stimuli (hsp70 and hsp83), DNA damage (p53) and apoptosis pathway (Dark, Dronc, and Dredd) upon ingestion of Au NPs.18
To study the toxic mechanisms of Au NPs, we assessed the cytotoxic and genotoxic responses induced by Au NPs in human peripheral blood lymphocytes (PBL) and murine macrophages Raw264.7, by differentiating clastogenic and aneuploidogenic effects, DNA strand breaks and oxidative DNA damage. Cell viability was determined by methylthiazol tetrazolium (MTT) assay, and the proliferative activity, cytotoxicity, mitotic, apoptotic and necrotic markers, as well as the chromosomal damage induced by Au NPs, were assessed by the cytokinesis-block micronucleus cytome assay. To distinguish between clastogenic and aneuploidogenic effects, we performed the fluorescence in situ hybridization (FISH) with human and murine pancentromeric probes. Single cell DNA strand breaks were detected by comet assay, and the oxidative DNA damage induced by Au NPs was investigated applying the modified comet protocol with endonuclease-III (EndoIII) and formamidopyrimidine-DNA glycosylase (Fpg) enzymes. In addition, the data were further analyzed taking into account the mass concentrations and the theoretically calculated number of Au NPs used. To verify whether size is the factor that regulates the toxic responses of Au NPs, we also exposed Raw264.7 cells to Au NPs with different nominal diameters (5 nm and 15 nm) at increasing exposure times and increasing absolute numbers of Au NPs.
Material and methods
Au NPs synthesis and characterization
Au NPs of two different sizes (5 nm and 15 nm) were prepared and characterized at the Joint Research Centre of the European Commission (Ispra, Italy) as a suspension of 98.5 mg/L (total Au content) in citrate buffer, as previously reported.19,20 Particles were characterized by three different techniques, dynamic light scattering, centrifugal particle sedimentation (CPS), and scanning transmission electron microscopy (STEM), and the zeta potential was determined by Zetasizer ZS-Nano (Malvern Instruments, Worcestershire, UK). To assess if NPs aggregate, their size distribution in the as-synthesized state and following dispersion in complete culture medium (9.85 μg/mL) was measured using the DC24000UHR centrifuge (CPS Instruments, Oosterhout, the Netherlands). The size and shape of the Au NPs was also evaluated using STEM images obtained using a FEI Nova nanolab microscope (FEI, Eindhoven, the Netherlands). The inductively coupled plasma-mass spectrometry technique (ICP-MS, 7700 series, Agilent Technologies Inc., Santa Clara, CA, USA) was used to assess the presence of dissolved ions in the Au NPs suspensions after removal of all solid particulate material by ultrafiltration (10 kDa Amicon filters, 20 minutes, room temperature, 1,500× g).
Cell culture
We drew 4–6 mL of blood from two healthy volunteers by venipuncture in Li-heparin vials, according to standard procedure. The donors were chosen according to the following criteria: young age, nonsmokers, without pharmacological treatments for at least 3 weeks before donation and without any radiological examination performed within the previous 3 months. The PBL were cultured as previously described.21
Raw264.7 cells were purchased from the Istituto Zooprofilattico of Brescia (Italy). The cells were cultured in MEM (minimal essential medium) (CELBIO, Milan, Italy) supplemented with 10% fetal bovine serum (CELBIO), 1% penicillin/streptomycin (CELBIO), and 1% L-glutamine (CELBIO). The cell cultures were maintained in a humidified atmosphere (5% CO2) at 37°C.
Au NP exposure
After 24 hours of seeding, the cell cultures were treated either with different mass concentrations (0.1, 1, 10, and 100 μg/mL) or with increasing absolute numbers (1×10⁹, 1×10¹⁰, 1×10¹¹) of 5 nm and 15 nm Au NPs. The tested samples were prepared by diluting suitable aliquots of Au NPs stock solutions in complete culture medium. The number of Au NPs within each mass concentration dose and the tested number of Au NPs were determined by the following formula:

where, vNP = volume of a nanoparticle (r = nanoparticle radius; d = nanoparticle diameter), VNP = total volume of nanoparticles in the sample and MNP = mass of nanoparticles in the sample volume = Vsample · M · m (ρ= specific mass or density expressed as g/cm3; m= molar mass expressed as g/mol; M= molarity; Vsample = sample volume). For Au NPs nanoparticles: m=197 g/mol and ρ=19.3 g/cm3.
Cell viability
Cytotoxicity was assessed by MTT assay. Subconfluent Raw264.7 cells were grown in 96-well plates and exposed to Au NPs suspensions for 2 hours and 24 hours. PBL were treated at the same conditions of adherent Raw264.7 cells. PBL were collected in sterile tubes and resuspended in 0.5 mL complete MEM; erythrocyte lysis buffer (155 mM NH4Cl, 10 mM KHCO3, 1 mM Na2EDTA, pH 7.4; 3.5 mL/tube) was added, and after 90 seconds cells were collected by centrifuging (3,000 rpm, 5 minutes). PBL were washed in 3.5 mL of complete medium and then pelleted (3,000 rpm, 5 minutes). The pellet was resuspended in 3.5 mL complete MEM and 100 μL of the cell suspension was pipetted in each well of a 96-well plate. Hydrogen peroxide (10 μM H2O2) was used as positive control.
After 2 hours and 24 hours of exposure of Raw264.7 and PBL to Au NPs, 10 μL of a 5 mg/mL MTT solution was added to each well (nine wells for each condition). After 3 hours at 37°C, Raw264.7 medium was replaced by 100 μL of dimethyl sulfoxide (DMSO) and mixed thoroughly to dissolve the formazan crystals; to PBL in suspension, 100 μL of DMSO was added without discarding the medium. To limit potential interactions due to the presence of residual NPs that could interfere with the assay, blanks without cells were used to detect the absorption of Au NPs themselves. Absorbance was measured at 570 nm (630 nm background) and cell viability was determined as the percentage of the blanks subtracted to the corresponding percentage of the exposed cells.
Cytokinesis-block micronucleus cytome assay
The cytokinesis-block micronucleus cytome (CBMN Cyt) assay after whole blood treatments was performed according to the procedure described by Migliore et al,21 while the CBMN Cyt assay on Raw264.7 was performed according to Migliore et al.22 The exposure to Au NPs lasted for 48 hours. Mitomycin C (0.1 μg/mL; MMC, Kyowa Hakko Kogyo Co, Chiyoda, Tokyo, Japan) was used as positive control. As described by Fenech, 500 cells were scored to evaluate the percentage of mono-, bi- and multinucleated cells, and the cytokinesis block proliferation index (CBPI) was calculated as an index of cytotoxicity by comparing the distribution of mono-, bi-, and multinucleated cells in the treated and control cells.23 The CBPI indicates the average number of cell cycles per cell during the period of exposure to cytoB, and is used to calculate cell proliferation. The number of apoptotic, necrotic, and mitotic cells per 500 cells was also evaluated. The genotoxic potential of Au NPs was evaluated by scoring the binucleated/micronucleated cells frequency as number of 1,000 binucleated cells containing one or more micronuclei (MN). Finally, on these 1,000 binucleated cells other parameters such as nucleoplasmic bridges (NPB), a biomarker of DNA misrepair and/or telomere end-fusions, and nuclear buds (NBUD), a biomarker of elimination of amplified DNA and/or DNA repair complexes, were also scored.
For PBL, data were reported as mean of four independent experiments (from two donors) ± standard error of the mean (SEM); for Raw264.7 cells, results were plotted as mean of three independent experiments (two replicates each) ± SEM.
FISH
Cells to perform FISH were prepared and spotted onto CBMN Cyt slides as previously described.24 Samples exposed for 48 hours to 0.1 μg/mL, 1 μg/mL, and 10 μg/mL of Au NPs, and to positive (0.1 μg/mL MMC, clastogen) and negative controls, were classified as centromere positive or centromere negative based on the presence or on the absence of centromeres in MN. Data were reported as mean of four independent experiments (from two donors) ± SEM; for Raw264.7 cells, results were plotted as mean of three independent experiments (two replicates each) ± SEM.
Comet assay and oxidative DNA damage
DNA damage was measured using the alkaline comet assay as described by Di Bucchianico et al.24 The percentage of total DNA fluorescence in tail in a total of 100 randomly selected cells per sample (two replicates, each with 50 cells/slide) was used as a measure of the amount of primary DNA damage. Ten micromolar H2O2 was used as positive control. Three independent experiments were performed for both 2- and 24-hour treatments. Analysis was carried out by using a Comet Image Analysis System, version 5.5 (Kinetic Imaging, Nottingham, UK).
To determine the presence of oxidized pyrimidine and purine bases, EndoIII and Fpg were used as previously described.24 Three independent experiments were performed for both 2- and 24-hour treatments. To determine the number of enzyme-sensitive sites, the difference between the value of the percent DNA fluorescence in tail obtained after digestion with each enzyme and with the buffer only was calculated.
Results
Characterization of Au NPs
The characterization of Au NPs was previously reported by Coradeghini et al and is summarized in Table 1.20 UV-vis spectrophotometry of Au NPs showed different absorption peaks at 508 nm and 520 nm wavelengths, consistent with their different diameters. A good agreement was found between the results of electron microscopy and CPS measurements. The CPS analysis was also used to measure the size distribution of 5 nm and 15 nm Au NPs in culture medium. Results showed that >70% of the 5 nm and 15 nm Au NPs are monodispersed, even after being resuspended in complete MEM for 72 hours at 37°C. The concentration of ions released from the Au NPs suspension, measured by ICP-MS up to 72 hours in complete medium, was for both sizes of Au NPs below the limit of detection of the instrument (<1 ppb).
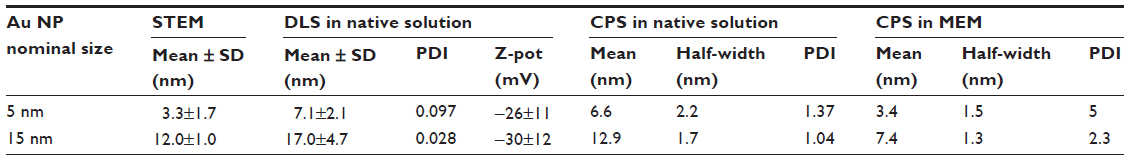 | Table 1 Au NP characterization |
Cell viability
Cell viability was evaluated in PBL and Raw264.7 by MTT assay, a standard in vitro test already optimized to study NP toxicity.25 In PBL, 100 μg/mL of 5 nm Au NPs showed more severe cytotoxicity after 2 hours of exposure (Figure 1), while 15 nm Au NPs exerted no signs of cytotoxicity. The 24-hour treatments showed a significant decrease in cell viability for both NPs, and in the presence of 15 nm Au NPs the effect was dose dependent.
In Raw264.7 cells (Figure 1), the cell viability decreased in a dose-dependent manner after 2 hours of exposure to 5 nm Au NPs, and the same was observed after 24 hours of exposure to both 5 nm and 15 nm Au NPs. Interestingly, at 2 hours of exposure, the smallest NPs showed higher cytotoxicity in both macrophages and lymphocytes.
 | Figure 1 Cell viability, evaluated by MTT assay, in PBL and Raw264.7 after 2 hours and 24 hours of exposure to 5 nm and 15 nm Au NPs. |
Cytotoxicity and cytostasis
PBL proliferation, measured as CBPI, decreased in a dose-dependent manner following exposure to Au NPs (Table 2); 5 nm Au NPs showed a more effective antiproliferative activity than 15 nm Au NPs, which in contrast was the most effective at the highest tested dose (100 μg/mL). In PBL, significant antimitotic and apoptotic activities were observed after exposure to both Au NPs, but the most severe apoptotic effect was seen after exposure to 10 μg/mL and 100 μg/mL 15 nm Au NPs. The necrotic index increased for both Au NPs in a dose-dependent manner; the exposure to 5 nm Au NPs showed higher necrotic effect than 15 nm Au NPs, but 15 nm Au NPs was the most effective at 100 μg/mL.
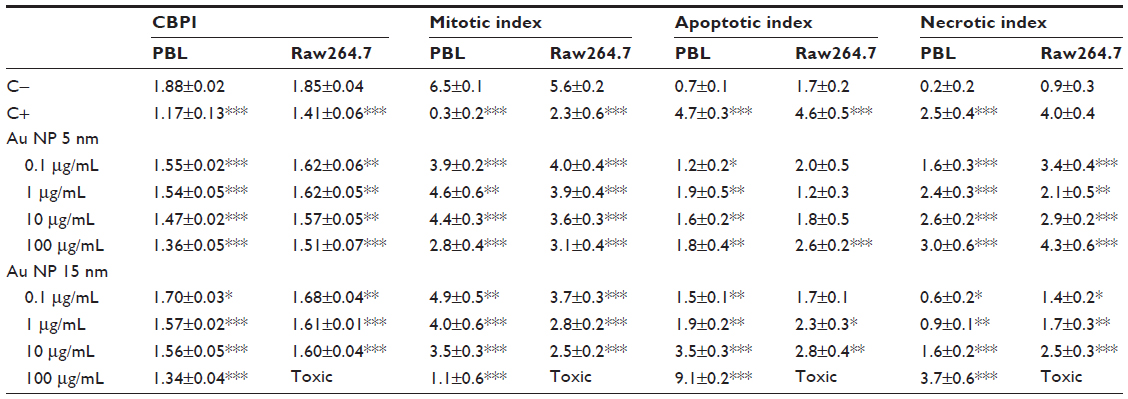 | Table 2 Cytostasis and cytotoxicity evaluated by CBMN Cyt assay |
In Raw264.7 cells, proliferation decreased after exposure to both Au NPs, and the effect was dose dependent in the presence of 5 nm Au NPs. The clearest low-dose effect was seen following exposure to 5 nm Au NPs. Although no significant dose-response was observed, the highest dose (100 μg/mL) of 15 nm Au NPs resulted in illegible slides because of the lack of morphologically undamaged cells (Table 2). Concentration-dependent decrease in the mitotic index was noticed, and the inhibition of cell division occurred more significantly in macrophages exposed to 15 nm Au NPs. The apoptotic index was significantly increased at the highest 5 nm and 15 nm Au NPs concentrations, and in a dose-dependent manner with 15 nm Au NPs. While 15 nm Au NPs induced a dose-dependent effect, 5 nm Au NPs increased the necrotic index at all tested concentrations.
Chromosomal damage
The results of MN, NPB, and NBUD frequencies are summarized in Table 3. The frequency of MN in PBL increased dose-dependently up to 3.8-fold and 6.9-fold after exposure to 5 nm and 15 nm Au NPs, respectively, while the number of MN increased up to 3.2-fold and 11.9-fold when Raw264.7 were treated with 5 nm and 15 nm Au NPs; 15 nm Au NPs showed a dose-dependent relationship in Raw264.7. In both cell types, a more severe MN induction was observed after treatment with 15 nm Au NPs. Chromosome rearrangements, detected as NPB formation, were more pronounced in PBL than in Raw264.7. Furthermore, in PBL following 5 nm Au NPs exposure and for both sets of Au NPs delivered to Raw264.7, the ratio NPB/MN showed that the lowest dose (0.1 μg/mL) exhibited higher chromosome breakage than 100 μg/mL. The frequencies of NBUD, biomarker of amplified DNA elimination, increased more in lymphocytes than in macrophages exposed to 5 nm Au NPs, while after exposure to 15 nm Au NPs the macrophages were more sensitive than lymphocytes.
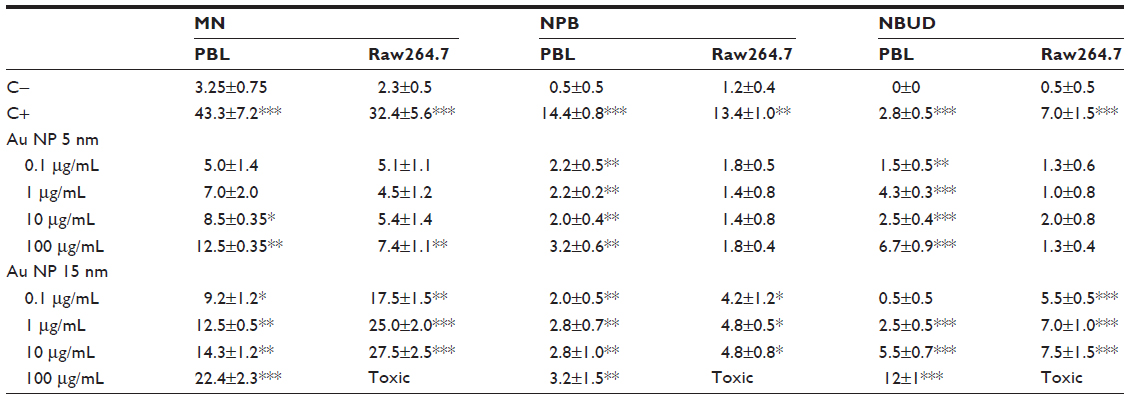 | Table 3 Genotoxicity evaluated by CBMN Cyt assay in PBL and Raw264.7 cells exposed to increasing mass concentrations of Au NPs |
Taken together, these data indicate that 15 nm Au NPs induced more significant chromosomal damage than 5 nm Au NPs.
FISH analysis
The exposure to Au NPs induced significant increase in centromere-positive MN formation in both cell types, indicating the induction of chromosome segregation anomalies rather than clastogenic effects (Figure 2). Both the Au NPs induced higher chromosome loss in PBL than in Raw264.7; however, in PBL the lowest dose of 5 nm Au NPs showed minor, but still significant, aneuploidogenic effects. Raw264.7 cells showed no significant aneuploidogenic events at the lowest 5 nm Au NPs dose, while 15 nm Au NPs induced linear dose-dependent effects.
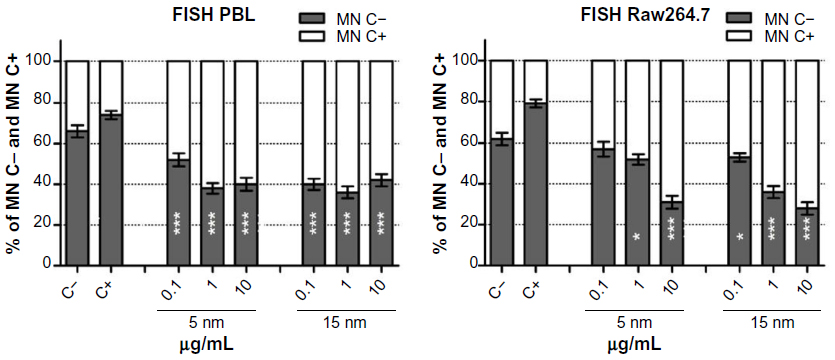 | Figure 2 FISH analysis in PBL and Raw264.7 after exposure to 5 nm and 15 nm Au NPs. |
DNA strand breaks
Figure 3 shows the data obtained evaluating the Au NPs-induced DNA damage by the comet assay. Significant increase in DNA migration was detected after 2 hours and 24 hours of exposure in both cell types, and the increase was dose dependent with the exception of PBL exposed for 24 hours to 5 nm Au NPs.
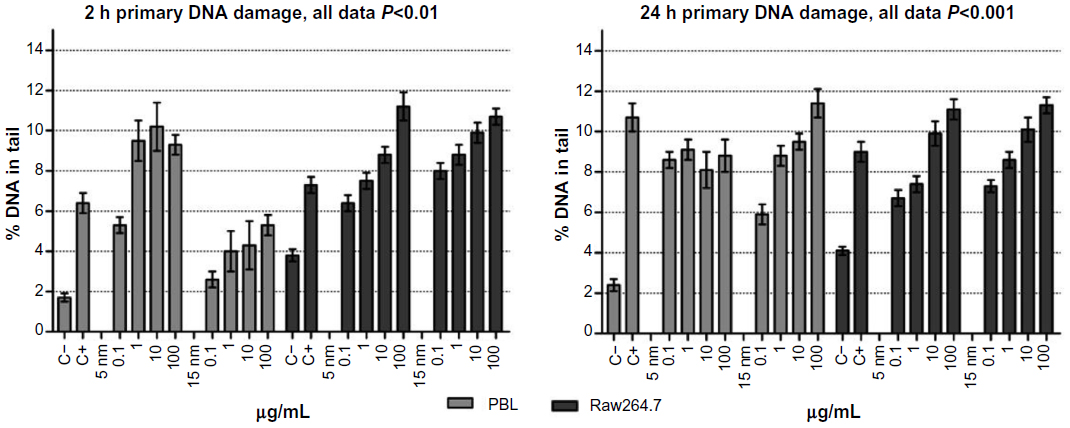 | Figure 3 Comet assay to evaluate primary DNA damage/breakage effects in PBL and Raw264.7. |
PBL were more sensitive to 5 nm and 15 nm Au NPs than Raw264.7: at 100 μg/mL, in fact, a 3.6-fold and 2.7-fold increase in DNA damage was observed following 24 hours of exposure to 5 nm Au NPs in PBL and Raw264.7, respectively. Accordingly, when exposed to 15 nm Au NPs for 24 hours, PBL were more sensitive than Raw264.7, presenting respectively up to 4.7-fold and 2.7-fold increases in DNA strand breaks. Interestingly, at 2 hours of exposure, PBL were more sensitive to 5 nm Au NPs than 15 nm Au NPs, while after 24 hours of exposure to the highest doses, the opposite was observed.
Oxidative DNA damage
By using the repair enzymes EndoIII and Fpg, the oxidative DNA damage was investigated at 2 hours and 24 hours exposure, and oxidized pyrimidines were detected in both cell systems by the presence of EndoIII sensitive DNA sites (Figure 4). Compared to PBL, at 2 hours of exposure Raw264.7 were particularly susceptible, showing a dose-dependent pyrimidines oxidation in the presence of 15 nm Au NPs; interestingly, the 5 nm Au NPs treatments were the less damaging to Raw264.7 and most harmful to PBL. After 24 hours of treatment, in both cell types the two Au NPs induced oxidized pyrimidines in a dose-dependent way; Raw264.7 were more sensitive than PBL (4.2-fold and 7.8-fold increases in Raw264.7 and 2.9-fold and 3.3-fold increases in PBL at the highest dose following 5 nm and 15 nm Au NPs, respectively).
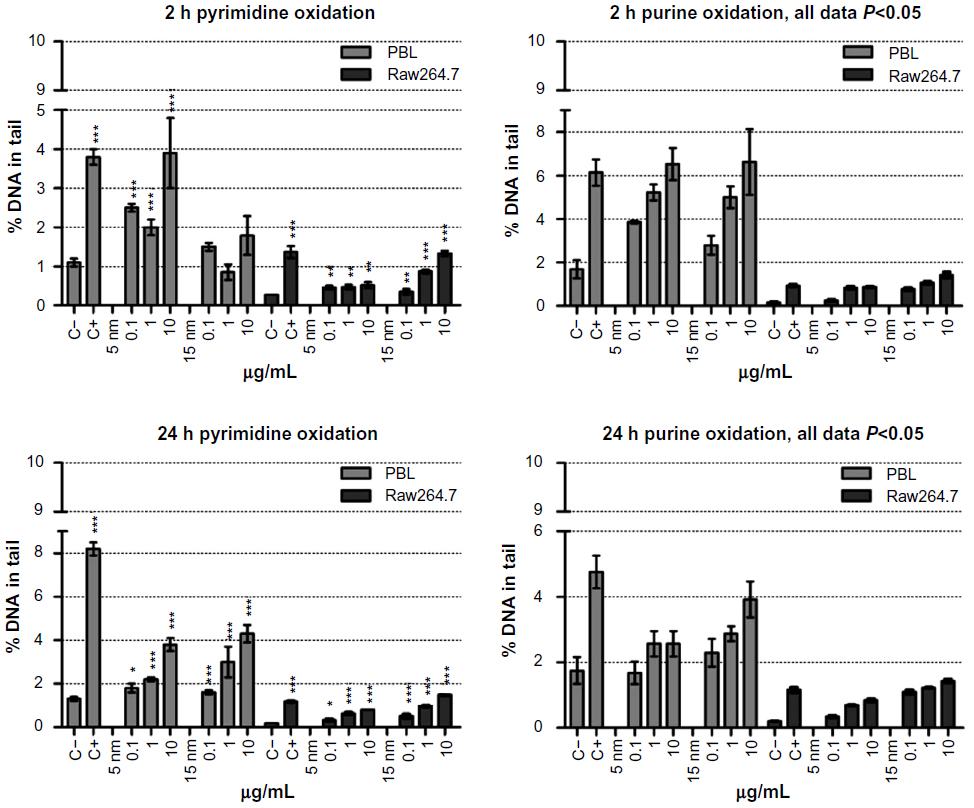 | Figure 4 Oxidative DNA damage evaluated using the enzyme-modified comet assay in PBL and Raw264.7. |
Raw264.7 were more sensitive in detecting oxidized purines by Fpg restriction enzyme: 5 nm Au NPs at 2 hours of exposure induced a 4.8-fold increase in Raw264.7 and 3.9 in PBL. Similarly, after 24 hours of exposure, in Raw264.7 the purines oxidation increased 4.1-fold, while in PBL the increase was up to 1.5-fold. At 2 hours of exposure to 15 nm Au NPs, purines oxidation was up to eight times higher in Raw264.7 and up to four times higher in PBL compared to negative control, while at 24 hours of exposure the oxidative damage was up to seven times higher in Raw264.7 and 2.3 times in PBL.
Comparison between mass concentrations and numbers of Au NPs
Data obtained by mass concentration exposure indicate that the particle size plays a role in determining cytotoxicity and genotoxicity. However, the same mass concentration of 5 nm and 15 nm Au NPs corresponds to different absolute particle numbers. Consequently, if mass concentrations are expressed as theoretically calculated numbers of Au NPs, MTT assay excludes a size-dependent effect on the cell viability (Figure S1). Following this approach, by MTT the same theoretical number of Au NPs showed cytotoxic effects on PBL and Raw264.7 independently of the dimension. To further evaluate the importance of size in determining cytotoxicity, CBPI was analyzed taking into account the number of Au NPs theoretically calculated from the given mass concentrations and showed size-independent antiproliferative effects (Figure S2A and B). In contrast, in both cell types the more severe MN induction was observed after the treatments with 15 nm Au NPs either considering the given mass concentrations (Table 3) or the theoretically calculated particle numbers (Figure S2C and D).
To verify these indications, exposures to Raw264.7 cells were carried out by controlling the effective number of Au NPs, ranging from 1×10⁹ to 1×10¹¹, that corresponds to different mass concentrations (Au NP 5 nm: from 0.00126 to 0.126 μg/mL; Au NP 15 nm: from 0.034 to 3.4 μg/mL). By MTT the size-independent effects exerted by absolute numbers of 5 nm and 15 nm Au NPs on the viability of Raw264.7 cells, both after 2 hours and 24 hours of exposure, were confirmed (Figure 5). CBMN Cyt showed that Au NPs decreased the proliferation of Raw264.7 cells without statistically significant size effect, while significant differences in genotoxicity and especially in MN induction were found (Table 4). In fact, MN frequencies after exposure to 15 nm Au NPs showed a dose-dependent relationship and differed significantly from 5 nm Au NPs. NPB and NBUD increased in a particle number-dependent way, but only the response obtained with the highest 15 nm Au NPs dose differed significantly from the negative control, and the effects of 15 nm Au NPs were more severe than the damage induced by 5 nm Au NPs.
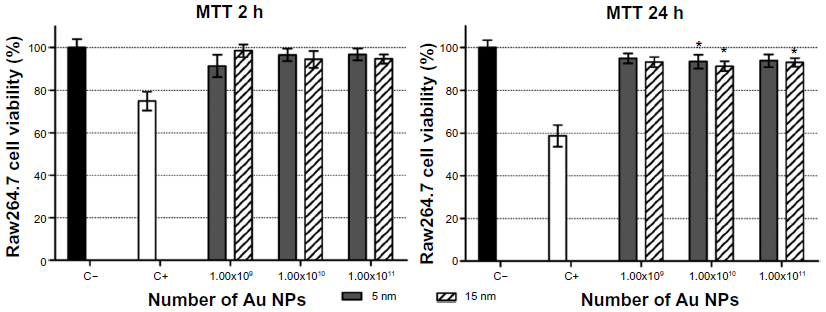 | Figure 5 Cell viability in Raw264.7 after 2 hours and 24 hours of exposure to absolute numbers of 5 nm and 15 nm Au NPs. |
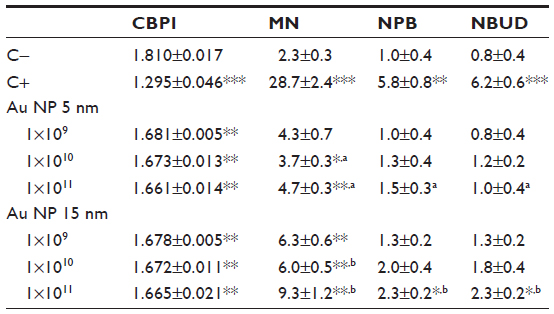 | Table 4 Proliferation and genotoxicity evaluated by CBMN Cyt assay in Raw264.7 cells exposed to an absolute number of Au NPs |
Discussion
Our results suggest that Au NPs of different size (5 nm and 15 nm) can induce inhibition of cell proliferation mediated by apoptosis, as well as chromosomal damage, aneuploidogenic events, DNA strand breaks, pyrimidines and purines oxidative lesions in human PBL and in a murine macrophage cell line. The chromosomal damage was more severe in Raw264.7 macrophages exposed to 15 nm Au NPs, and overall both Au NPs induced dose-dependent genotoxic effects. Aneuploidy was induced irrespective of the Au NPs size, and the lymphocytes showed a relatively higher percentage of chromosome mis-segregation than macrophages. PBL showed higher DNA strand breaks than Raw264.7, while the macrophages were more sensitive to pyrimidines and purines oxidation. Moreover, our data allowed a correlation between the cytotoxic mechanisms assessed with the tested mass concentration and the absolute number of Au NPs, showing a size-independent relationship. The size of Au NPs, on the other hand, played an important role in determining genotoxic effects in PBL and Raw264.7 cells.
Recent reports on the reactivity of Au NPs focused on their effects on biocompatibility, uptake, toxicity, and mutagenic effects.26–30 However, in general, there is a lack of conclusive information on the size as the key factor for Au NPs cytotoxicity and genotoxicity, and on the relationship between size, mass concentration and the absolute particle number.
The cytotoxicity of Au NPs on A549 and NCIH441 cell lines was described, suggesting that the presence of sodium citrate can affect the cell viability and proliferation rather than the size of the particles, which appears to have no effect on active Au NPs endocytosis.6 Accordingly, it was shown that not the size of the Au NPs, but the amount of citrate on the particle surface impaired the viability of the endothelial cells HDMEC and hCMEC, which, in addition, exhibited different uptake behavior for citrate-stabilized gold nanoparticles.7 In contrast, the uptake of Au NPs coated with nucleic acid and polyethyleneimine into mammalian cells demonstrated that changes in the nanoparticle size can lead to significant differences in the number of molecules delivered per cell.31 Furthermore, the uptake efficiency and the intracellular localization of Au NP-peptide conjugates was shown being directly dependent on the peptide itself, and the intracellular destination was shown to be further determined by Au NP size.32 Au NPs size-dependent bioaccumulation and (eco) toxicity has been demonstrated by metallothionein induction, increased activities of catalase, superoxide dismutase and glutathione S-transferase by three sizes of citrated-coated Au NPs (5, 15, 40 nm) in Scrobicularia plana, indicating the activation of response to oxidative stress.19
Results obtained exposing Balb/3T3 cells to the same citrate-stabilized 5 nm and 15 nm Au NPs here investigated revealed cytotoxic effects, measured by colony forming efficiency, for 5 nm Au NPs but not for 15 nm Au NPs.20 Coradeghini et al showed also that the changes in cytoskeleton structure of Balb/3T3 cells resulted in pronounced modification of the cell shape and reduction in the expression and degradation of the clathrin heavy chain, but without significant effects in the expression of caveolin.20 Citrate-stabilized Au NPs (20 nm) influenced cell cycle pathways in human embryonic lung fibroblasts, reducing the expression of critical checkpoint proteins and causing oxidative stress and alteration of genes associated with genomic stability and DNA repair.33 Citrate-stabilized Au NPs downregulated, in a size-dependent manner, cellular responses induced by interleukin 1-beta both in vitro in THP-1 human leukemia monocytic macrophages and in vivo in C57BL/6 male mice.34
Nevertheless, the size dependency of adverse effects in human blood is not linear.35 Studies with human blood cells showed that 30 nm Au NPs induced concentration-dependent effects on hemolysis, reactive oxygen species generation, and platelet aggregation.36 In addition, studies in mice showed that the bioaccumulation and toxicity of differently sized (5 nm, 10 nm, 30 nm, and 60 nm) PEG-coated Au NPs was not size dependent.37
In conclusion, both the literature and the results presented in this study demonstrate no clear correlation between the cytotoxicity of differently sized Au NPs and the equivalent spherical diameter. We found that at early time points (2 hours), the highest mass concentration of 5 nm Au NPs showed a more severe cytotoxicity both in PBL and Raw264.7 compared to the corresponding doses of 15 nm Au NPs. However, taking into account the theoretically calculated numbers of Au NPs corresponding to the different tested mass concentrations, it was not possible to conclude that 5 nm Au NPs induced higher cytotoxicity than 15 nm Au NPs. These indications were further confirmed by experiments carried out in Raw264.7 cells with a fixed absolute number of differently sized Au NPs.
In addition to size, other physicochemical properties of NPs, such as surface charge, are proposed to be critical determinants of their toxic potential.38,39 For instance, the evaluation of differently charged Au NPs (neutral, positively, and negatively charged) in a human keratinocyte cell line (HaCaT) showed that the cell morphology was disrupted in a dose-dependent way by all three NPs: the surface charge was the major determinant of the cellular processes, with the charged NPs inducing cell death through apoptosis and neutral Au NPs through necrosis.40 However, as highlighted in this paper, the cell type also plays an important role in activating apoptosis: PBL, in fact, showed higher apoptotic responses than Raw264.7 macrophages.
Interestingly, considering both the mass concentrations and the absolute number of Au NPs, from our study it is clear that the size of Au NPs plays an important role in determining genotoxic mechanisms, although in a nonlinear manner. Both cell systems were more sensitive to 15 nm Au NPs than to 5 nm Au NPs, as evaluated through the different biomarkers of chromosomal damage (MN, NPB, and NBUD). The evaluation of the genotoxic effects in Raw264.7 cells, based on the absolute numbers of Au NPs, confirmed nonlinear size-dependent chromosomal damage. However, this result cannot explain the time-dependent primary DNA damage, as the 5 nm Au NPs were the most harmful both in PBL and in Raw264.7 macrophages. In addition, the lowest dose of 5 nm Au NPs showed in both cell types minor aneuploidogenic effects compared to 15 nm Au NPs, and the more clastogenic behavior at low doses was consistent with the described NPB/MN ratio, which provides an important fingerprint for distinguishing the genotoxic mechanisms of different clastogenic and aneuploidogenic agents.41
To date, few genotoxicity studies have been performed with Au NPs. Although minor focal inflammatory changes occurred after a single instillation of 2 nm, 20 nm, and 200 nm Au NPs into the lung of male adult Wistar rats, genotoxicity was not observed as assessed by the erythrocyte micronucleus test and the comet assay.42 In addition, 2 nm, 20 nm, and 200 nm Au NPs failed to induce MN formation in human blood and did not damage DNA in the liver and lung of exposed adult male Wistar rats.43 The dosing, however, was limited by the stability of the gold suspensions, and Downs et al stated that the results would have looked different upon increasing the gold doses.43
Au NPs capped with sodium citrate or polyamidoamine dendrimers interacted with hepatocytes HepG2 and peripheral blood mononuclear cells, and exhibited in vitro cyto- and genotoxicity even at low concentrations.44 In zebrafish Danio rerio exposed to low doses of 12 nm and 50 nm Au NPs, size and exposure length modulated the genotoxicity and the expression of genes involved in DNA repair, apoptosis, and oxidative stress.45 Flow cytometry and real-time PCR analysis of apoptotic genes and ATP depletion measurements suggested that 17 nm Au NPs induced cell damage through extrinsic and intrinsic apoptotic pathways in human lung adenocarcinoma A549 cells.46
Au NPs (12 nm) were internalized by the endolysosomal pathway in Balb/3T3 fibroblasts after 10 days of exposure, and although they were not a severe cytotoxicant, Au NPs induced DNA damage.47 Moreover, the comet assay showed DNA damage in MRC-5 human lung fibroblasts treated with 20 nm Au NPs, and FISH analysis revealed that the majority of the chromosomal breaks were undetectable telomeres.48 Li et al explained this genomic instability with the differences in the oxidative stress-related proteins as well as with proteins associated to the cell cycle regulation and cytoskeleton and DNA repair.33 Similarly, our studies directly demonstrated that apoptosis, DNA oxidation, and aneuploidy could explain the genotoxicity observed in PBL and Raw264.7 cells. In addition to the alterations of the mitotic spindle, to the weakness of mitotic checkpoints and to cytoskeletal defects, a growing body of evidence suggests that aneuploidy can be also induced by epigenetic mechanisms.49,50 Chromatin condensation and reorganization, as well as global gene expression alterations, were observed in fibroblasts exposed to Au NPs, providing further insights into the molecular mechanisms underlying toxicity of Au NPs and their impact on epigenetic processes.51–53
Conclusion
We can conclude that differently sized Au NPs induced cytotoxicity and genotoxicity through different mechanisms of action. While Au NPs size did not play a pivotal role in determining cytotoxicity, the size was a fundamental factor in inducing genotoxicity. In fact, the most severe genotoxicity in PBL and Raw264.7 was observed following exposure to 15 nm Au NPs. These observations were confirmed, also taking into account the particle numbers as dose-metric, and these results might represent groundwork for further studies aimed at investigating the mechanistic interactions between Au NPs and DNA. Nevertheless, cytotoxic and genotoxic mechanisms, as well as the exposure time, could be ascribed to the different cell type-related reactivity. Au NPs induced cytotoxicity through apoptotic pathways, and the premutagenic DNA oxidation appears to be an important factor in inducing genotoxicity. Finally, to our knowledge, this study reports for the first time increased aneuploidy after Au NPs exposure in vitro in a human and in a murine cell model.
Acknowledgments
This study was funded by the European Commission’s Seventh Framework Programme (FP7/2007-2013) under grant agreement No CP-FP 214478-2 project name NanoReTox (http://www.nanoretox.eu) and FP7-280716 project name Sanowork (http://www.sanowork.eu).
Disclosure
The authors report no conflicts of interest in this work.
References
Chithrani BD, Ghazani AA, Chan WC. Determining the size and shape dependence of gold nanoparticle uptake into mammalian cells. Nano Lett. 2006;6(4):662–668. | |
Chithrani BD, Chan WC. Elucidating the mechanism of cellular uptake and removal of protein-coated gold nanoparticles of different sizes and shapes. Nano Lett. 2007;7(6):1542–1550. | |
Gao H, Shi W, Freund LB. Mechanics of receptor-mediated endocytosis. Proc Natl Acad Sci U S A. 2005;102(27):9469–9474. | |
Vetten MA, Tlotleng N, Tanner Rascher D, et al. Label-free in vitro toxicity and uptake assessment of citrate stabilised gold nanoparticles in three cell lines. Part Fibre Toxicol. 2013;10:50. | |
Greulich C, Diendorf J, Gessmann J, et al. Cell type-specific responses of peripheral blood mononuclear cells to silver nanoparticles. Acta Biomater. 2011;7(9):3505–3514. | |
Uboldi C, Bonacchi D, Lorenzi G, et al. Gold nanoparticles induce cytotoxicity in the alveolar type-II cell lines A549 and NCIH441. Part Fibre Toxicol. 2009;6:18. | |
Freese C, Uboldi C, Gibson MI, et al. Uptake and cytotoxicity of citrate-coated gold nanospheres: Comparative studies on human endothelial and epithelial cells. Part Fibre Toxicol. 2012;9:23. | |
Monteiro-Riviere NA, Samberg ME, Oldenburg SJ, Riviere JE. Protein binding modulates the cellular uptake of silver nanoparticles into human cells: implications for in vitro to in vivo extrapolations? Toxicol Lett. 2013;220(3):286–293. | |
Cedervall T, Lynch I, Lindman S, et al. Understanding the nanoparticle-protein corona using methods to quantify exchange rates and affinities of proteins for nanoparticles. Proc Natl Acad Sci U S A. 2007;104(7):2050–2055. | |
Dykman L, Khlebtsov N. Gold nanoparticles in biomedical applications: recent advances and perspectives. Chem Soc Rev. 2012;41(6):2256–2282. | |
Anderson NL, Anderson NG. The human plasma proteome: history, character, and diagnostic prospects. Mol Cell Proteomics. 2002;1(11):845–867. | |
Deng ZJ, Liang M, Toth I, Monteiro M, Minchin RF. Plasma protein binding of positively and negatively charged polymer-coated gold nanoparticles elicits different biological responses. Nanotoxicology. 2013;7(3):314–322. | |
Walkey CD, Olsen JB, Guo H, Emili A, Chan WC. Nanoparticle size and surface chemistry determine serum protein adsorption and macrophage uptake. J Am Chem Soc. 2012;134(4):2139–2147. | |
Hirn S, Semmler-Behnke M, Schleh C, et al. Particle size-dependent and surface charge-dependent biodistribution of gold nanoparticles after intravenous administration. Eur J Pharm Biopharm. 2011;77(3):407–416. | |
Sonavane G, Tomoda K, Makino K. Biodistribution of colloidal gold nanoparticles after intravenous administration: effect of particle size. Colloids Surf B Biointerfaces. 2008;66(2):274–280. | |
Abdelhalim MA, Jarrar BM. Gold nanoparticles induced cloudy swelling to hydropic degeneration, cytoplasmic hyaline vacuolation, polymorphism, binucleation, karyopyknosis, karyolysis, karyorrhexis and necrosis in the liver. Lipids Health Dis. 2011;10:166. | |
Gosens I, Post JA, de la Fonteyne LJ, et al. Impact of agglomeration state of nano- and submicron sized gold particles on pulmonary inflammation. Part Fibre Toxicol. 2010;7(1):37. | |
Vecchio G, Galeone A, Brunetti V, et al. Concentration-dependent, size-independent toxicity of citrate capped AuNPs in Drosophila melanogaster. PLoS One. 2012;7(1):e29980. | |
Pan JF, Buffet PE, Poirier L, et al. Size dependent bioaccumulation and ecotoxicity of gold nanoparticles in an endobenthic invertebrate: the Tellinid clam Scrobicularia plana. Environ Pollut. 2012;168:37–43. | |
Coradeghini R, Gioria S, García CP, et al. Size-dependent toxicity and cell interaction mechanisms of gold nanoparticles on mouse fibroblasts. Toxicol Lett. 2013;217(3):205–216. | |
Migliore L, Frenzilli G, Nesti C, Fortaner S, Sabbioni E. Cytogenetic and oxidative damage induced in human lymphocytes by platinum, rhodium and palladium compounds. Mutagenesis. 2002;17(5):411–417. | |
Migliore L, Saracino D, Bonelli A, et al. Carbon nanotubes induce oxidative DNA damage in RAW264.7 cells. Environ Mol Mutagen. 2010;51(4):294–303. | |
Fenech, M. Cytokinesis-block micronucleus cytome assay. Nat Protoc. 2007;2(5):1084–1104. | |
Di Bucchianico S, Fabbrizi MR, Misra SK, et al. Multiple cytotoxic and genotoxic effects induced in vitro by differently shaped copper oxide nanomaterials. Mutagenesis. 2013;28(3):287–299. | |
Kroll A, Pillukat MH, Hahn D, Schnekenburger J. Interference of engineered nanoparticles with in vitro toxicity assays. Arch Toxicol. 2012;86(7):1123–1136. | |
Patra HK, Banerjee S, Chaudhuri U, Lahiri P, Dasgupta AK. Cell selective response to gold nanoparticles. Nanomedicine. 2007;3(2):111–119. | |
Johnston HJ, Hutchison G, Christensen FM, Peters S, Hankin S, Stone V. A review of the in vivo and in vitro toxicity of silver and gold particulates: particle attributes and biological mechanisms responsible for the observed toxicity. Crit Rev Toxicol. 2010;40(4):328–346. | |
Sonavane G, Tomoda K, Makino K. Biodistribution of colloidal gold nanoparticles after intravenous administration: effect of particle size. Colloids Surf B Biointerfaces. 2008;66(2):274–280. | |
Vecchio G, Galeone A, Brunetti V, et al. Mutagenic effects of gold nanoparticles induce aberrant phenotypes in Drosophila melanogaster. Nanomedicine. 2012;8(1):1–7. | |
Smith MR, Boenzli MG, Hindagolla V, et al. Identification of gold nanoparticle-resistant mutants of Saccharomyces cerevisiae suggests a role for respiratory metabolism in mediating toxicity. Appl Environ Microbiol. 2013;79(2):728–733. | |
Elbakry A, Wurster EC, Zaky A, et al. Layer-by-layer coated gold nanoparticles: size-dependent delivery of DNA into cells. Small. 2012;8(24):3847–3856. | |
Oh E, Delehanty JB, Sapsford KE, et al. Cellular uptake and fate of PEGylated gold nanoparticles is dependent on both cell-penetration peptides and particle size. ACS Nano. 2011;5(8):6434–6448. | |
Li JJ, Zou L, Hartono D, Ong CN, Bay BH, Lanry Yung LY. Gold Nanoparticles Induce Oxidative Damage in Lung Fibroblasts In Vitro. Adv Mater. 2008;20(1):138–142. | |
Sumbayev VV, Yasinska IM, Garcia CP, et al. Gold nanoparticles downregulate interleukin-1β-induced pro-inflammatory responses. Small. 2013;9(3):472–477. | |
Mayer A, Vadon M, Rinner B, Novak A, Wintersteiger R, Fröhlich E. The role of nanoparticle size in hemocompatibility. Toxicology. 2009;258(2–3):139–147. | |
Love SA, Thompson JW, Haynes CL. Development of screening assays for nanoparticle toxicity assessment in human blood: preliminary studies with charged Au nanoparticles. Nanomedicine (Lond). 2012;7(9):1355–1364. | |
Zhang XD, Wu D, Shen X, et al. Size-dependent in vivo toxicity of PEG-coated gold nanoparticles. Int J Nanomedicine. 2011;6:2071–2081. | |
Nel A, Xia T, Mädler L, Li N. Toxic potential of materials at the nanolevel. Science. 2006;311(5761):622–627. | |
Papageorgiou I, Brown C, Schins R, et al. The effect of nano- and micron-sized particles of cobalt-chromium alloy on human fibroblasts in vitro. Biomaterials. 2007;28(19):2946–2958. | |
Schaeublin NM, Braydich-Stolle LK, Schrand AM, et al. Surface charge of gold nanoparticles mediates mechanism of toxicity. Nanoscale. 2011;3(2):410–420. | |
Thomas P, Umegaki K, Fenech M. Nucleoplasmic bridges are a sensitive measure of chromosome rearrangement in the cytokinesis-block micronucleus assay. Mutagenesis. 2003;18(2):187–194. | |
Schulz M, Ma-Hock L, Brill S, et al. Investigation on the genotoxicity of different sizes of gold nanoparticles administered to the lungs of rats. Mutat Res. 2012;745(1–2):51–57. | |
Downs TR, Crosby ME, Hu T, et al. Silica nanoparticles administered at the maximum tolerated dose induce genotoxic effects through an inflammatory reaction while gold nanoparticles do not. Mutat Res. 2012;745(1–2):38–50. | |
Paino IM, Marangoni VS, de Oliveira Rde C, Antunes LM, Zucolotto V. Cyto and genotoxicity of gold nanoparticles in human hepatocellular carcinoma and peripheral blood mononuclear cells. Toxicol Lett. 2012;215(2):119–125. | |
Geffroy B, Ladhar C, Cambier S, Treguer-Delapierre M, Brèthes D, Bourdineaud JP. Impact of dietary gold nanoparticles in zebrafish at very low contamination pressure: the role of size, concentration and exposure time. Nanotoxicology. 2012;6(2):144–160. | |
Choi SY, Jeong S, Jang SH, et al. In vitro toxicity of serum protein-adsorbed citrate-reduced gold nanoparticles in human lung adenocarcinoma cells. Toxicol In Vitro. 2012;26(2):229–237. | |
Di Guglielmo C, De Lapuente J, Porredon C, Ramos-López D, Sendra J, Borràs M. In vitro safety toxicology data for evaluation of gold nanoparticles-chronic cytotoxicity, genotoxicity and uptake. J Nanosci Nanotechnol. 2012;12(8):6185–6191. | |
Li JJ, Lo SL, Ng CT, et al. Genomic instability of gold nanoparticle treated human lung fibroblast cells. Biomaterials. 2011;32(23):5515–5523. | |
Herrera LA, Prada D, Andonegui MA, Dueñas-González A. The epigenetic origin of aneuploidy. Curr Genomics. 2008;9(1):43–50. | |
Inglot P, Lewinska A, Potocki L, et al. Cadmium-induced changes in genomic DNA-methylation status increase aneuploidy events in a pig Robertsonian translocation model. Mutat Res. 2012;747(2):182–189. | |
Yang Y, Qu Y, Lü X. Global gene expression analysis of the effects of gold nanoparticles on human dermal fibroblasts. J Biomed Nanotechnol. 2010;6(3):234–246. | |
Ng CT, Dheen ST, Yip WC, Ong CN, Bay BH, Lanry Yung LY. The induction of epigenetic regulation of PROS1 gene in lung fibroblasts by gold nanoparticles and implications for potential lung injury. Biomaterials. 2011;32(30):7609–7615. | |
Stoccoro A, Karlsson HL, Coppedè F, Migliore L. Epigenetic effects of nano-sized materials. Toxicology. 2013;313(1):3–14. |
Supplementary materials
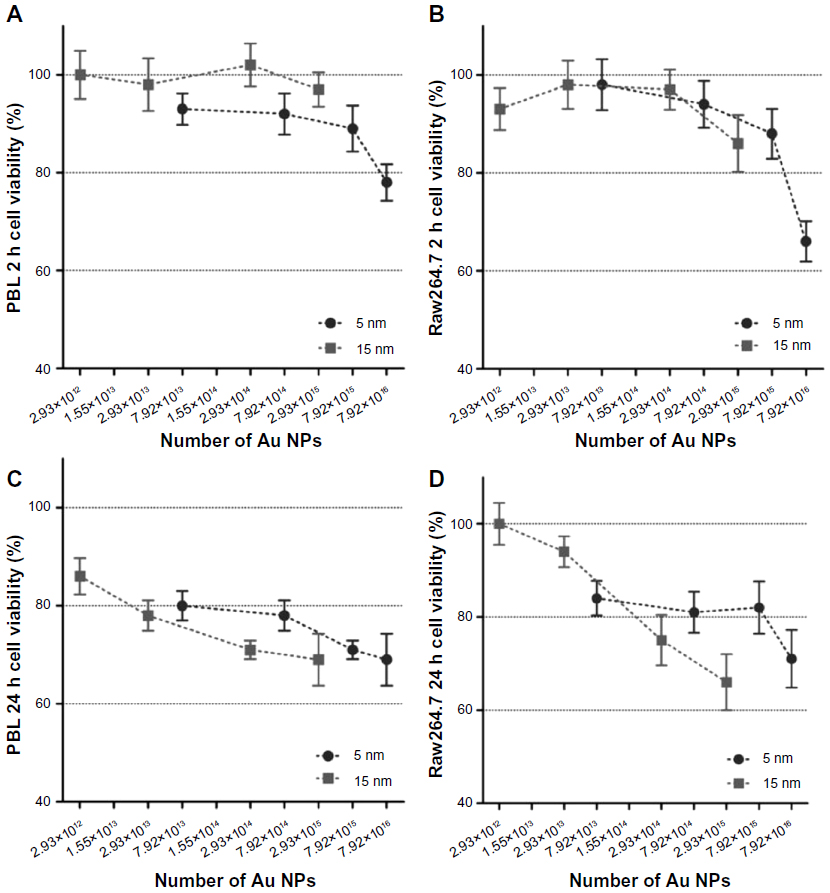 | Figure S1 Cell viability evaluated by MTT assay in function of the theoretically calculated number of 5 nm and 15 nm Au NPs. |
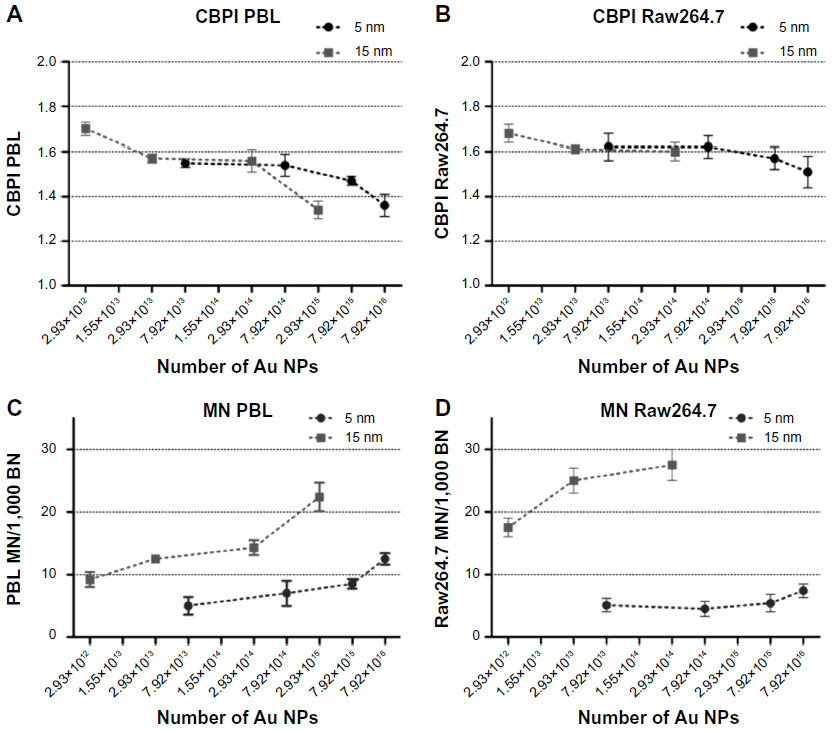 | Figure S2 CBPI and MN frequency evaluated by CBMN Cyt assay in function of the theoretically calculated number of 5 nm and 15 nm Au NPs. |
 © 2014 The Author(s). This work is published and licensed by Dove Medical Press Limited. The full terms of this license are available at https://www.dovepress.com/terms.php and incorporate the Creative Commons Attribution - Non Commercial (unported, v3.0) License.
By accessing the work you hereby accept the Terms. Non-commercial uses of the work are permitted without any further permission from Dove Medical Press Limited, provided the work is properly attributed. For permission for commercial use of this work, please see paragraphs 4.2 and 5 of our Terms.
© 2014 The Author(s). This work is published and licensed by Dove Medical Press Limited. The full terms of this license are available at https://www.dovepress.com/terms.php and incorporate the Creative Commons Attribution - Non Commercial (unported, v3.0) License.
By accessing the work you hereby accept the Terms. Non-commercial uses of the work are permitted without any further permission from Dove Medical Press Limited, provided the work is properly attributed. For permission for commercial use of this work, please see paragraphs 4.2 and 5 of our Terms.