")
Back to Journals » Pediatric Health, Medicine and Therapeutics » Volume 7
Anemia and undernutrition among children aged 6–23 months in two agroecological zones of rural Ethiopia
Authors Roba KT , O’Connor TP, Belachew T, O’Brien NM
Received 30 March 2016
Accepted for publication 5 August 2016
Published 31 October 2016 Volume 2016:7 Pages 131—140
DOI https://doi.org/10.2147/PHMT.S109574
Checked for plagiarism Yes
Review by Single anonymous peer review
Peer reviewer comments 2
Editor who approved publication: Professor Laurens Holmes, Jr
Kedir Teji Roba,1 Thomas P O’Connor,2 Tefera Belachew,3 Nora M O’Brien2
1School of Nursing and Midwifery, College of Health and Medical Science, Haramaya University, Harar, Ethiopia; 2School of Food and Nutritional Science, University College Cork, Cork, Ireland; 3Department of Population and Family Health, College of Public Health and Medical Sciences, Jimma University, Jimma, Ethiopia
Background: Child malnutrition during the first 1,000 days, commencing at conception, can have lifetime consequences. This study assesses the prevalence of anemia and undernutrition among children aged 6–23 months in midland and lowland agroecological zones of rural Ethiopia.
Methods: Cross-sectional data examining sociodemographic, anthropometry, hemoglobin levels, and meal frequency indicators were collected from 216 children aged 6–23 months and their mothers randomly selected from eight rural kebele (villages).
Results: Of 216 children, 53.7% were anemic, and 39.8%, 26.9%, and 11.6% were stunted, underweight, and wasted, respectively. The prevalence of anemia was higher in the lowland agroecological zone (59.5%) than the midland (47.6%). Among those children who were stunted, underweight, and wasted, 63.5%, 66.7%, and 68.0% were anemic, respectively. Child anemia was significantly associated with the child not achieving minimum meal frequency, sickness during the last 2 weeks before the survey, stunting and low body mass index, and with maternal hemoglobin and handwashing behavior. The prevalence of stunting was higher in the lowland agroecological zone (42.3%) than the midland (36.2%). The predictors of stunting were age and sex of the child, not achieving MMF, maternal body mass index, and age. As maternal height increases, the length for age of the children increases (P=0.003).
Conclusion: The overall prevalence of anemia and undernutrition among children aged 6–23 months in these study areas is very high. The prevalence was higher in the lowland agroecological zone. Health information strategies focusing on both maternal and children nutrition could be sensible approaches to minimize stunting and anemia.
Keywords: child anemia, child stunting, lowland, midland, agroecological zone, rural Ethiopia
Introduction
It has long been recognized that child malnutrition and anemia have both acute and long-term adverse effects on human development.1 The term “malnutrition” is used to refer to undernutrition in this paper.2 One of the most critical periods in the growth of the infant is between 6 and 23 months of age, and this is when malnutrition can have significant consequences. It is also reported that the incidence of stunting is at a peak in this age group, because children in this age group have great demands for nutrients, but there are limitations in the quantity and quality of available foods, particularly after exclusive breastfeeding.2,3 In addition, due to poor hygiene and sanitation, frequent episodes of diarrhea are major contributors to malnutrition.
It is estimated that approximately 19.4% of children aged under 5 years are underweight, and 29.9% of children are stunted in developing countries.4 More than 3.4 million children aged under 5 years are dying, and approximately 40% of children are stunted in sub-Saharan Africa alone.5 A study conducted in the Wag-Himra zone of northern Ethiopia indicated that 23.6% of children <2 years were stunted and 66.6% of children were anemic.6 Similarly, a study in the northern part of Ethiopia indicated that 33% of children aged 12–23 months were stunted.7 The prevalence of stunting among infants aged 6–8 months and children aged 9–23 months was 43% and 39%, respectively, in the southern part of Ethiopia.8 A study among school children in the northwest part of Ethiopia also indicated that 15.1%, 25.2%, and 8.9% of children were underweight, stunted, and wasted, respectively.9 Approximately, 25.6% of children aged 7–14 years were stunted, with 10.3% of them severely stunted, and 19% of them were underweight.10 In Ethiopia, it has been demonstrated that more than one-third of child deaths are associated with malnutrition.11 It is estimated that the annual costs related to child malnutrition is 55.5 billion Ethiopian birr, which is equivalent to 16.5% of gross domestic product.12 Ethiopian Demographic and Health Survey (EDHS) (2011) reported that 44%, 44%, 10%, and 29% of children under 5 years of age were anemic, stunted, wasted, and underweight, respectively.13
Thus, evidence indicates that malnutrition starts early in a child’s life in Ethiopia and becomes progressively worse during the first 2 years of age. It also appears that the rates of malnutrition in children vary across different regions of Ethiopia. A recent study indicated that there was significant variation in the nutritional status of lactating mothers between midland and lowland agroecological zones of rural Ethiopia.14 Therefore, given the present importance and high priority given to the health of children around the globe in general, and in Ethiopia in particular, this study attempts to build on the current limited database on malnutrition in young children and to 1) explore the levels of anemia and malnutrition among children aged 6–23 months; 2) determine agroecological variations in nutritional status and anemia; and 3) identify predictors of anemia and stunting in the children in midland and lowland agroecological zones of rural Ethiopia.
Materials and methods
This study was conducted in two study areas in Ethiopia: Eastern Oromia (Babile District) and South-Central Tigray (Enderta and Hintalo Wajirat Districts). Data were collected in two seasons: January to February 2014 (postharvest) and July to August 2014 (lean season). Babile District is 560 km away from Addis Ababa in the eastern part of Ethiopia and represents a lowland agroecological area. The major agricultural products consumed in this lowland agroecological zone are sorghum, maize, and oil seeds; whereas groundnuts and Khat (Catha edulis) are used as major cash crop in this area. The midland agroecological zones were represented by Hintalo Wajirat and Enderta Districts, which are 683 and 773 km away from Addis Ababa in the northern part of Ethiopia, respectively. Detailed study area and methods have been published earlier.14
This study involved a nutritional subsample drawn from a larger Agridiet household survey comprising of 800 households (400 household each from both agroecological zones) where the sample sizes were calculated by single population proportion. Biological mothers were randomly identified using a kebele (a small administrative unit in Ethiopia) health extension registration logbook based on proportion to population size in each kebele. All data were collected from apparently healthy children and their biological mothers at their home.
Dietary data
Dietary intake data were collected and computed based on tools developed by food and nutrition technical assistance.15,16 Twenty-four hours dietary data were collected from the mothers of the children about all types of food consumed. Each mother who participated in the study was asked to recall all the dishes she had eaten and given to her child in the household in the previous 24 hours. Data collected on infant dietary intake were used to calculate the infant dietary diversity score using a seven food group classification.16 The dietary data were collected randomly on weekend days or on weekdays, as these days do not have any special difference with respect to dietary intake in this study group. We took care of not to include Ethiopian fasting days or local feasts or celebrations in the recall.
Anthropometric measurements
Data for both mothers and children were collected and computed using World Health Organization (WHO)-recommended guidelines.17–19 Both the mothers and their children were weighed to the nearest 0.1 kg on electronic scales (SECA, Hamburg, Germany) with minimal (light weight) clothing and without shoes. The weight of the children was taken together with the mother, and the child’s weight was then obtained by subtracting the respective mother’s weight from the combined weight by two different recorders and compared and confirmed later by supervisors. All anthropometric data were collected by two separate enumerators, and if any variation existed between the two enumerators, then the first author was called to validate the measurements. Recumbent length was taken for the 6–23 months old children. Their length was measured to the nearest 0.1 cm using a portable device (SECA 2006 sliding board), consisting of a board with an upright wooden base and a movable headpiece, on a flat surface. The body mass index (BMI) of the mothers was computed by dividing weight by height/length in meters squared (weight/height2 [kg/m2]). The mid-upper arm circumferences (MUAC) of both mothers and their children were taken from the left arm and measured to the nearest millimeter.
Hemoglobin data
Hemoglobin levels of both mothers and children were tested by collecting a blood sample from the tip of the middle finger after cleaning with a disinfectant. A sample of the third drop was added to the cuvettes for measuring hemoglobin level after the first two drops were wiped. Hemoglobin values were read for all children immediately in the field by using a portable HemoCue analyser (HemoCue® Hb 301, Ängelholm, Sweden). The precision of this procedure for the assessment of hemoglobin in the field in a resource-poor setting has been established previously.20 The hemoglobin concentrations were adjusted for altitude using the WHO recommendation during analysis.21 The cutoff point for anemia was based on WHO (2001) recommendations for the mother: anemia is defined as hemoglobin <11 g/dL for children and <12 g/dL for mothers.
Data collectors and quality control
Data were collected by experienced nurses who were qualified to a diploma level or above. These nurses were recruited and trained intensively for 5 days on the methods of data collection and the context of each item included in the questionnaire. In addition, anthropometric data collectors were given special training and demonstrations about the procedures. For hemoglobin analysis, the blood sample was collected and tested by trained laboratory technologists who have a BSc degree or above. The data collection tool was prepared in English, translated to local languages, such as Tigrigna and Afan Oromo, by native speakers, and then translated back to English for validation and consistency check. Data were collected in the local language. Intensive training was given for data collectors, and the data collections were supervised by locally recruited supervisors and also by the principal investigator.
A pretest survey was conducted in another similar rural setting on 5% of the total sample size, and identified problems during the survey were corrected before the actual survey. Two separate measurements were taken for length/height, weight, and MUAC in every study participant by different data collectors separately. The principal investigator oversaw the data collection process. All randomly selected children were apparently healthy during data collection, and children with signs and symptoms of diarrhea, fever, or any acute illness were excluded from the study.
The dependent variables of this study were undernutrition and anemia status of the children, while sociodemographic/economic status, health status of mothers and their children, feeding style, hygiene and sanitation conditions of households, child illness, health-seeking behaviors and health services utilization, and infant and maternal dietary diversity were independent variables of this study.
Data processing and analysis
The data were entered into EpiData version 3.1 by separate data clerks and validated for consistency. Data were cleaned and edited after transfer to SPSS statistical packages (version 16.0; SPSS Inc., Chicago, IL, USA) for data analysis. Normality of the data was checked graphically and visually using different plots. Meal frequency as well as anthropometric and hemoglobin mean and standard deviation values was considered. The WHO Anthro 2005 software (World Health Organization Geneva, Switzerland) was used to calculate the Z-scores. Weight-for-age WAZ (underweight), weight-for-length WLZ (wasting), length-for-age LAZ (stunting), BMI for age Z-score (BAZ), and MUACZ, and cutoff points of negative two (−2) were used to define undernutrition.
Independent t-test was used to determine mean differences in nutritional status between midland and lowland agroecological zones. The Levine’s test of equality of variance was checked. When P-values of Levine’s test of equality of variance were >0.05 (not significant), equal variances were assumed, while equal variances were not assumed if P<0.05. Finally, mean difference between t-values and P-values was reported.
Multivariable linear regression model was used to determine predictors of LAZ after checking for the assumptions of normality, homoscedasticity, and linearity. Variables that had significance (P<0.05) were retained for the final multivariable model. Similarly, children’s hemoglobin failed to fulfill criteria of linearity and homoscedasticity before and after log transformation and was categorized into two groups, ie, anemic and nonanemic. Variables that did not have significant (P≥0.05) relationships in binary logistic regression were removed from the model. During both linear and binary logistic regression, biological plausibility of the variables was considered before including into models.
Ethical standards disclosure
This study procedure was approved by Research Ethics Review Committees of Haramaya University College of Health and Medical Sciences, Ethiopia, and University College Cork, Ireland. Subsequently, the final approval of the protocol was approved by the Ethiopian National Ministry of Science and Technology Ethical Review Committee. Caregivers of the children consented verbally, and this was formally recorded before commencing data collection. They were informed that they had the right to refuse or exit from the study at any time and that declining to participate in the study would not have any negative impacts for them. Mothers and children who were found to be anemic during assessment were given detailed information about the situation and referred to the nearest health institution.
Results
Sociodemographic and economic characteristics and anthropometric status
Among the 223 children aged between 6 and 23 months recruited, 216 (98.2%) were analyzed. Reasons for nonparticipation were fear of providing a blood sample for hemoglobin tests, one mother missing her appointment at the health center and another mother refusing to give a blood sample. In addition, one child was excluded from analysis during data cleaning because his age was <6 months.
The majority (68.5%) of the mothers were illiterate, 87.0% of the mothers were married, and 53.2% of the households used safe water, while approximately 45.0% of the households did not use toilet and 67.8% of the mothers gave birth at home. It was also found that approximately 41.7% of the mothers were wasted (BMI <18.5) (Table 1).
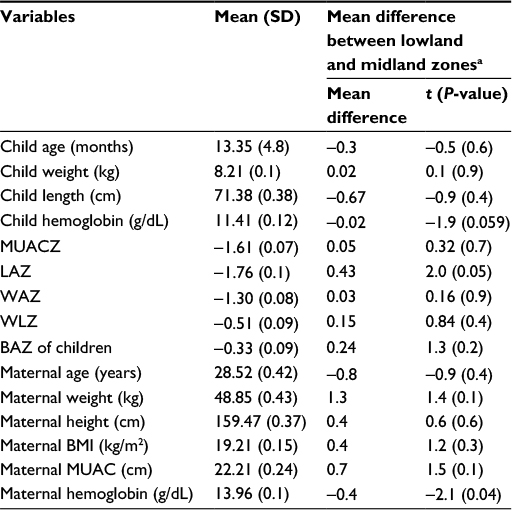 | Table 1 Descriptive measures of children and their mothers in rural Ethiopia (n=216, mother–child pairs) Notes: aLowland agroecological zone is represented by Babile District (Woreda), which is 560 km away from Addis Ababa in the eastern part of Ethiopia, while midland agroecological zone is represented by Hintalo Wajirat and Endreta Districts, which are 683 and 773 km away from Addis Ababa in the northern part of Ethiopia. Lowland and midland zones were compared by unpaired t-test, and P-values are shown. Abbreviations: MUACZ, mid-upper arm circumference-for-age Z-score; LAZ, length-for-age Z-score; WAZ, weight-for-age Z-score; WLZ, weight-for-length Z-score; BAZ, body mass index for age Z-score; SD, standard deviation. |
The mean and standard deviations of LAZ, WAZ, and WLZ for the children were −1.76 (0.1), −1.3 (0.08), and −0.5 (0.09), respectively, and the mean and standard deviation for hemoglobin was 11.4 (0.12) g/dL. The mean difference between lowland and midland agroecological zones for LAZ score was significant (P=0.05) (Table 1).
Prevalence of malnutrition
This study found that 11.6%, 26.9%, and 39.8% of children were wasted, underweight, and stunted, respectively (Table 2). The magnitude of malnutrition peaked at 12–17 months of age (Table 3).
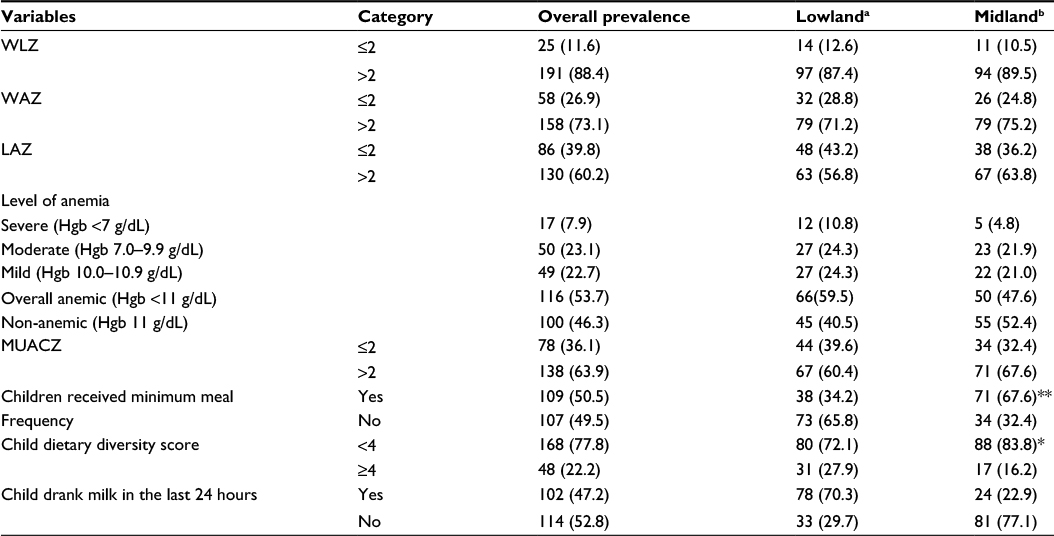 | Table 2 Prevalence of stunting and anemia among children aged 6–23 months by agroecological zones of rural Ethiopia (n=111, children in lowland; n=105 children in midland) Notes: Minimum meal frequency: proportion of breastfed and nonbreastfed children aged 6–23 months who received solid, semisolid, or soft foods the minimum number of times or more (minimum is defined as: two times for breastfed infants 6–8 months; three times for breastfed children 9–23 months; and four times for nonbreastfed children 6–23 months) in the previous day; aBabile District (Woreda), which is 560 km away from Addis Ababa in the eastern part of Ethiopia, is representative of a lowland agroecological zone; bHintalo Wajirat and Endreta Districts are 683 and 773 km away from Addis Ababa in the northern part of Ethiopia, respectively, and represent midland agroecological zones. The P-values for χ2 test, **P<0.001, *P<0.05. Abbreviations: WLZ, weight-for-length Z-score; WAZ, weight-for-age Z-score; LAZ, length-for-age Z-score; Hgb, hemoglobin; MUACZ, mid-upper arm circumference-for-age Z-score. |
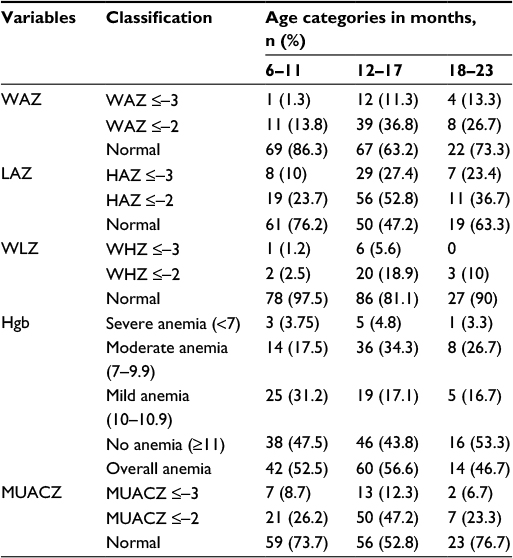 | Table 3 Prevalence of malnutrition and anemia among children aged 6–23 months by age categories in rural Ethiopia (n=216, children) Abbreviations: WAZ, weight-for-age Z-score; LAZ, length-for-age Z-score; WLZ, weight-for-length Z-score; Hgb, hemoglobin (g/dL); MUACZ, mid-upper arm circumference-for-age Z-score. |
Prevalence of anemia
Among the 216 children included for analysis, 116 (53.7%) had anemia, of whom 7.9%, 23.1%, and 22.7% had severe, moderate, and mild anemia, respectively (Table 2). The proportion of anemia was higher but not significant among male children (58.3%) compared to female (50.0%) (Table 4). The proportion of anemia was higher among lowland children (59.5%) compared to midland children (47.6%) even though this significance was lost after controlling for confounding (Table 2). With regard to the classification of anemia and malnutrition by age, the incidence of both anemia and stunting was higher among the 12–17 months age group (Table 3).
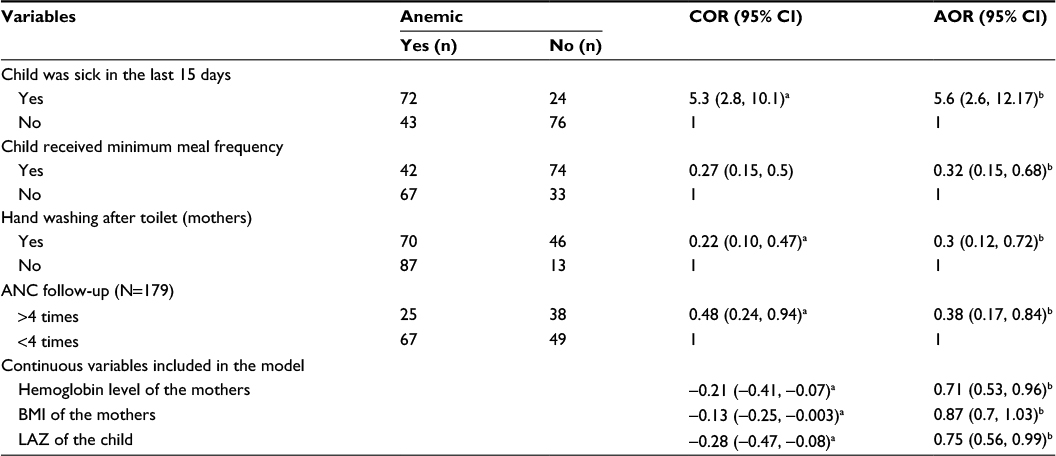 | Table 4 Predictors of anemia among children aged 6–23 months in two agroecological zones of rural Ethiopia (n=216, children) Notes: Minimum meal frequency, proportion of breastfed and nonbreastfed children aged 6–23 months who received solid, semisolid, or soft foods the minimum number of times or more (minimum is defined as: two times for breastfed infants 6–8 months; three times for breastfed children 9–23 months; and four times for nonbreastfed children 6–23 months) in the previous day; asignificant by bivariate analysis; bsignificant by multiple variable analysis after adjusting for confounding. Abbreviations: COR, crude odds ratio; AOR, adjusted odds ratio; ANC, antenatal care; BMI, body mass index; LAZ, length-for-age Z-score. |
Agroecological variations in the prevalence of malnutrition and anemia
Of the 53.7% anemic children, 59.6% were from lowland agroecological zone and 47.6% were from midland zone. The prevalence of all forms of anemia (severe, moderate, and mild anemia) was higher in lowland agroecological zone. Similarly, 39.8% of children in the study were stunted, with a stunting prevalence of 43.2% in the lowland agroecological zone and 36.2% in the midland. The wasting prevalence was also higher in the lowland agroecological zone (ie, 12.6% in lowland vs 10.5% in midland). The prevalence of being underweight was 28.8% for lowland children and 24.8% for children from the midland agroecological zone.
Predictors of stunting
Maternal and infant dietary diversity, minimum acceptable diet, presence of latrine in the house, child having taken a deworming tablet in the past 3 months, child falling sick within 15 days before the survey, and maternal and paternal education and occupation do not show association in the bivariate models and were removed from the models. Among variables included in final models, children who achieved minimum meal frequency (MMF), male sex, age of the child, and BMI, height, and age of the mothers were significantly related to LAZ of the children. Children who achieved MMF had a higher Z-score compared to those who did not consume adequate meals (P=0.043) (Table 5). The proportion of child stunting increased as the age of the child increased (β=−0.039, P=0.009), but female children had a lower rate of stunting than males (P<0.015). Similarly, as the height of the mother increased, the LAZ of the children also increased significantly (P=0.003). As the height and BMI of the mother increased, the length-for-age Z-score (LAZ) of children increased significantly (P<0.005). Those children born in the lowland area and those who had low hemoglobin level were at risk of stunting compared to children in midland area even though significance was lost after controlling for confounding.
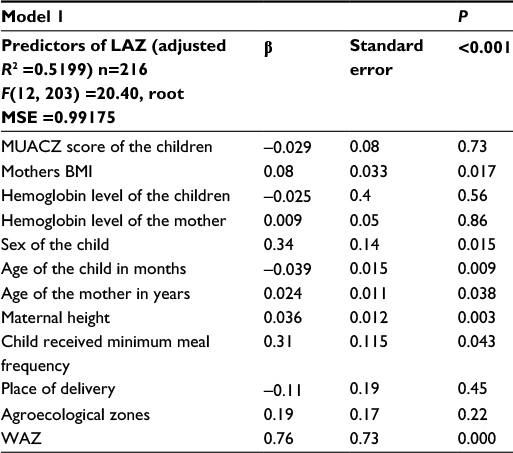 | Table 5 Predictors of length-for-age Z-score (stunting) among children aged 6–23 months in rural Ethiopia (n=216, children) Notes: Minimum meal frequency: proportion of breastfed and nonbreastfed children aged 6–23 months who received solid, semisolid, or soft foods the minimum number of times or more (minimum is defined as: two times for breastfed infants 6–8 months; three times for breastfed children 9–23 months; and four times for nonbreastfed children 6–23 months) in the previous day. Abbreviations: β, coefficient for the predictor value; LAZ, length-for-age Z-score; MUACZ, mid-upper arm circumference-for-age Z-score; BMI, body mass index; WAZ, weight-for-age Z-score; MSE, mean square error. |
Predictors of anemia
Child age, sex, source of drinking water for household, presence of latrine in the house, contraceptive utilization, mothers having received deworming tablets in the past 3 months, maternal and infant dietary diversity, minimum acceptable diet, child having taken deworming tablet in the past 3 months, and maternal and paternal education and occupation did not show association in the bivariate models and were removed from the models. Multiple variable analyses revealed that the predictors of child anemia were child illness in the last 2 weeks, child not having MMF, mothers not washing their hands after toilet, and mothers’ antenatal care (ANC) follow-up. It was found that children who achieved MMF per day were less likely to be anemic compared to those who do not achieve MMF (adjusted odds ratio [AOR] 0.32, 95% confidence interval [CI] =0.15, 0.68) (Table 4). Mothers who received four focused ANC visits were less likely to have children with anemia compared to those mothers who received less than four ANC visits (AOR 0.38, 95% CI 0.17, 0.84). Similarly, this study revealed that those children who were sick in the 15 days before the survey were more likely to be anemic compared to those who were healthy (AOR 5.6, 95% CI 2.6, 12.17). Among continuous variables included in the same model, maternal hemoglobin level, LAZ of child, and mother’s BMI were significantly associated with child anemia (Table 4). As the LAZ score of the child increased, the risk of the children being anemic decreased (AOR 0.75, 95% CI 0.56, 0.99). Likewise, the risk of the child being anemic decreased significantly as the hemoglobin level of the mothers increased (β=0.036, P=0.003) (Table 4).
Associations between anemia and malnutrition
This study indicated that among stunted, wasted, and underweight children, 63.5%, 68.0%, and 66.7% were anemic, respectively. The proportions of stunting, wasting, and being underweighted were relatively higher among anemic children compared to their counterparts without anemia. It was also found that anemia among this age group was significantly related with stunting and being underweight (Table 6).
 | Table 6 Association of stunting with anemia among children aged 6–23 months in rural Ethiopia Abbreviations: OR, odds ratio; CI, confidence interval. |
Discussion
This study revealed that 53.7% of children aged 6–23 months were anemic, with a prevalence of 59.5% in the lowland and 47.6% in the midland agroecological zone. Similarly, 39.8%, 26.9%, and 11.6% of children were stunted, underweighted, and wasted, respectively. The incidence of stunting, being underweight, and wasting were higher in lowland (43.2%, 28.8%, and 12.6%) than midland zones (36.2%, 26.9%, and 10.5%), respectively. The predictors of LAZ were maternal BMI and height, age, sex, and meal frequency of the child. The predictors of child anemia were child sickness, child meal frequency, LAZ, and maternal handwashing behavior after toilet, and maternal hemoglobin, BMI, and ANC.
This study found that anemia was prevalent among the study groups, with a higher rate in lowland agroecological rural Ethiopia. The prevalence in the lowland zone was very similar to the EDHS (60.9%).13 The findings of this study were lower than the prevalence reported in a study among the same age (6–23 months) in the Wag-Himra zone of northern Ethiopia (66.6% anemia),6 but similar to a study in Brazil (51%).20 The reasons for variation across agroecology need further investigations.
In this study, higher rates of anemia were found among children aged 12–17 months, followed by the 6–11 months age group. A study conducted in northern Ethiopia, Kilte Awulaelo Woreda reported that children aged 6–11 months were the most affected age group.22 Published data indicate a decreasing trend in anemia prevalence with age particularly in children >23 months.22–25 The risk of anemia is greatest in the first 2 years of age when growth velocity is highest.26 Higher rate of anemia in children <2 years of age is influenced by increased iron requirements in this age group due to rapid growth, inadequate intake of iron rich foods, and poor diet diversity.
Children from the lowland agroecological zone had a higher prevalence of anemia compared to the midland zone even though the difference was not significant after adjustments for confounding. We have previously reported a significant difference between the two agroecological zones in children’s MMF, with a higher rate of MMF in the midland agroecological zone.27 An undiversified diet (cereal-based monotonous diet) and low meal frequency have been known to contribute to micronutrient deficiency, including anemia.28,29 A higher percentage of children (70.3%) from the lowland agroecological zone drank milk in the last 24 hours compared to the midland zone (22.9%), which may be a contributing factor to anemia as milk reduces absorption of iron from food. However, factors associated with anemia among children are multidimensional and multifaceted. In addition to nutritional problems, these may be associated with cultural, socioeconomic, environmental, and biological factors. We have previously reported on the seasonal variations in nutritional status and anemia among the lactating mothers of these children in the same agroecological zones.14 The mothers from the lowland agroecological zone had higher prevalence of anemia. Details on diets plus other factors such as traditions, cultures, and lifestyles in these two agroecological zones have been provided in the earlier publication.14
This study showed that anemic children were 5.6 times as likely to have had recent infections (15 days preceding the interview). The presence of infections can result in loss of appetite and malabsorption of nutrients, which increases the risk for anemia. This finding is similar to that conducted in the northeast part of Ethiopia.6 Similarly, a study conducted in the northern part of Ethiopia showed that those children with diarrhea, acute febrile illness, or who were stunted were more likely to develop anemia than their counterparts. This higher rate of anemia may also be related to poor hygiene as the handwashing habit of the mother after toilet also had a significant association with child anemia.
This study showed that as maternal BMI and hemoglobin increased, the risk of the child being anemic decreased by 29%. This study provides strong evidence that there is an association between child anemia and maternal nutritional status. A similar finding was also reported by a study conducted in Brazil.20 According to another study conducted by Habte et al,30 childhood anemia showed an increasing trend as maternal anemia level increased. This may be associated with nutritional status of the mothers before pregnancy as most mothers in developing countries enter into pregnancy while they are malnourished.
The prevalence of stunting among children <5 years has significantly declined during the past two decades, but this is still significantly high in South Asia and sub-Saharan Africa than elsewhere.2 It was reported that approximately 165 million children were stunted globally in 2011.2 This revealed that the prevalence of stunting in this study was slightly greater than few other studies conducted in Ethiopia,6,10,31 and relatively lower than the EDHS.13 A higher percentage of children from the lowland agroecological zone were stunted compared to the midland agroecological zone. The close relationship between dietary diversity, micronutrient deficiencies, and stunting in developing countries has been well documented in previous studies.28,29,32,33 But no study, to our knowledge, has documented the association between stunting and agroecological zones. The variation in prevalence may be associated with feeding behaviors and sociodemographic characteristics of the children.
This study indicated that low LAZ score was positively related with anemia in the multivariable model. As the LAZ score of the child increased, the risk of the children being anemic decreased by 25%. The relationship between stunting and anemia has also been reported in several other studies.20,30,31,34–36 The causal relationships between stunting and anemia are uncertain. Low hemoglobin levels may have a negative impact on the linear growth. Additionally, it is possible that deficiencies of other micronutrients and stunting may synergistically increase the risk for anemia.
This study also indicated that male children were more stunted than female children. This finding has also been reported by other studies.37,38 Similarly, mothers with low BMI, short stature, and younger age are more likely to have stunted children. These relationships in our study strengthen the suggestions of intergenerational associations of malnutrition from mother to child reported in another study.37 In contrast to other studies,20,31 in our study, maternal contraceptive utilization, education status, and household characteristics such as access to and utilization of latrine and safe drinking water had no association with child malnutrition.
Strengths and limitations
The strengths of this study include its use of both linear and binary logistic regression models to assess children nutritional status with their mothers (infant–mother pairing) and focusing on limited age of the vulnerable population segments. We were able to measure the magnitude of malnutrition in this transition period from breastfeeding to complementary food. A further strength of this study is that anthropometric data were collected by two separate recorders and, if there were variations in data between the two recorders, the measurement was taken on the field by principal investigators for validation. Any error is likely to be random. Even though there was no evidence of variation in the hemoglobin level between the morning and the afternoon, the tests were conducted in the morning for all participants, and the HemoCue machines were checked every morning to control reading errors.
There are identified limitations in our study that might have affected our findings. Most of the risk factors were collected from verbal reports of the biological mothers as there were no other mechanisms of obtaining such information for the children, and so this may introduce social desirability and recall bias. However, great care was taken to minimize such bias by reducing the duration of the recall period and by including some double-checking in the questionnaire for validation of results. Therefore, bias in this study was unlikely to have affected the findings. In this study, the associations between dependent and independent variables did not necessarily imply temporal causal–effect relationships. Thus, any association should be interpreted with caution. Another limitation of this study was that the sample size of this study was small, and so this may have reduced the power to detect true differences.
Conclusion
In conclusion, this study revealed that anemia and malnutrition among children aged between 6 and 23 months are a major public health concern in rural Ethiopia. Our findings strongly suggest that stunted mothers have stunted offspring compared to their normal counterparts. Also, children born to anemic mothers are more likely to be anemic compared to children born to nonanemic mothers. Interventions focusing on improving nutritional status of the mother and children, attaining at least MMF for children at an early age, and hygienic conditions and antenatal care of the mothers should be targeted to reduce the impact of child malnutrition. Additionally, the prevalence of anemia and stunting was higher in lowland agroecological zones compared to midland counterparts. These data suggest the requirement for further agroecological-based studies in different parts of the country to determine appropriate interventions.
Acknowledgments
The authors thank Irish Aid for sponsoring this study through AGRIDIET project. They also acknowledge Haramaya University for supporting us regarding transport facilities during the data collection. Kedir Teji thanks Awol Seid for statistical analysis support. They also express our sincere gratitude to all participants of the study and to data collectors.
This work was supported by Irish Aid, Irish Department of Foreign Affairs and Trade and Higher Education Authority (HEA), Dublin (AGRIDIET: http://agridiet.ucc.ie/).
This paper entitled “Prevalence of stunting and anemia among children 6–23 months of age in two agro-ecological zones of rural Ethiopia” was initially presented as part of the first author’s PhD thesis at University College Cork, Ireland. https://cora.ucc.ie/handle/10468/2432.
Author contributions
KTR, NMOB, and TPOC conceived and designed the study, coordinated data collection and interpretation of data. KTR analyzed the data and drafted the manuscript. NMOB and TPOC helped in literature searches, provided critical review and comments on the manuscript, TB critically reviewed the final manuscript. All authors contributed toward data analysis, drafting and critically revising the paper and agree to be accountable for all aspects of the work. Finally, all authors approved the final version for publication.
Disclosure
The authors report no conflicts of interest in this work.
References
World Health Organization. Essential Nutrition Actions: Improving Maternal, Newborn, Infant and Young Child Health and Nutrition. Geneva, Switzerland: World Health Organization; 2013. | ||
Black RE, Victora CG, Walker SP, et al. Maternal and child undernutrition and overweight in low-income and middle-income countries. Lancet. 2013;382(9890):427–451. | ||
Victora CG, de Onis M, Hallal PC, Blössner M, Shrimpton R. Worldwide timing of growth faltering: revisiting implications for interventions. Pediatrics. 2010;125(3):e473–e480. | ||
Stevens GA, Finucane MM, Paciorek CJ, et al. Trends in mild, moderate, and severe stunting and underweight, and progress towards MDG 1 in 141 developing countries: a systematic analysis of population representative data. Lancet. 2012;380(9844):824–834. | ||
Bongaarts J. Food and Agriculture Organization of the United Nations: the state of food and agriculture: agricultural trade and poverty: can trade work for the poor? Popul Dev Rev. 2007;33(1):197–198. | ||
Woldie H, Kebede Y, Tariku A. Factors associated with anemia among children aged 6–23 months attending growth monitoring at Tsitsika Health Center, Wag-Himra Zone, Northeast Ethiopia. J Nutr Metab. 2015;2015:928632. | ||
Baye K, Guyot J-P, Icard-Verniere C, Mouquet-Rivier C. Nutrient intakes from complementary foods consumed by young children (aged 12–23 months) from North Wollo, northern Ethiopia: the need for agro-ecologically adapted interventions. Public Health Nutr. 2013;16(10):1741–1750. | ||
Tessema M, Belachew T, Ersino G. Feeding patterns and stunting during early childhood in rural communities of Sidama, South Ethiopia. Pan Afr Med J. 2013;14(1):75. | ||
Amare B, Ali J, Moges B, et al. Nutritional status, intestinal parasite infection and allergy among school children in northwest Ethiopia. BMC Pediatr. 2013;13:7. | ||
Wolde M, Berhan Y, Chala A. Determinants of underweight, stunting and wasting among schoolchildren. BMC Public Health. 2015;15:8. | ||
Debela BL, Shively G, Holden ST. Does Ethiopia’s productive safety net program improve child nutrition? Food Security. 2015;7(6):1273–1289. | ||
MOH. Ethiopian Ministry of Health. The Cost of Hunger in Ethiopia: Implications for the Growth and Transformation of Ethiopia; 2013. Available from: http://reliefweb.int/report/ethiopia/cost-hunger-ethiopia-implications-growth-and-transformation-Ethiopia. Accessed May 26, 2015. | ||
CSA. Central Statistical Agency [Ethiopia] and ICF International. Ethiopia Demographic and Health Survey 2011. Addis Ababa, Ethiopia: Central Statistical Agency and ICF International. 2012. | ||
Roba KT, O’Connor TP, Belachew T, O’Brien NM. Seasonal variation in nutritional status and anemia among lactating mothers in two agro-ecological zones of rural Ethiopia: a longitudinal study. Nutrition. 2015;31(10):1213–1218. | ||
Kennedy G, Ballard T, Dop MC. Guidelines for Measuring Household and Individual Dietary Diversity. Food and Agriculture Organization of the United Nations; 2011. | ||
Swindale A, Bilinsky P. Household Dietary Diversity Score (HDDS) for Measurement of Household Food Access: Indicator Guide. Washington, DC: Food and Nutrition Technical Assistance Project, Academy for Educational Development; 2006. | ||
World Health Organization. Physical status: the use and interpretation of anthropometry. WHO Tech Rep Ser. 1995;854(121):55. | ||
WHO Multicentre Growth Reference Study Group. WHO Child Growth Standards: Length/Height-FOR-Age, Weight-for-Age, Weight-for-Length, Weight-for-Height and Body Mass Index-for-Age. Geneva: WHO; 2006. | ||
WHO Multicentre Growth Reference Study Group. WHO Child Growth Standards: Growth Velocity Based on Weight, Length and Head Circumference: Methods and Development. Geneva: World Health Organization; 2009. | ||
Leite MS, Cardoso AM, Coimbra CE Jr, et al. Prevalence of anemia and associated factors among indigenous children in Brazil: results from the First National Survey of Indigenous People’s Health and Nutrition. Nutr J. 2013;12(1):69. | ||
WHO. Haemoglobin Concentrations for the Diagnosis of Anemia and Assessment of Severity. Vitamin and Mineral Nutrition Information System. Geneva: World Health Organization; 2011. | ||
Gebreegziabiher G, Etana B, Niggusie D. Determinants of anemia among children aged 6–59 months living in Kilte Awulaelo Woreda, northern Ethiopia. Anemia. 2014;2014:245870. | ||
Adish A, Esrey SA, Gyorkos TW, Johns T. Risk factors for iron deficiency anaemia in preschool children in northern Ethiopia. Public Health Nutr. 1999;2(3):243–252. | ||
Onyemaobi G, Onimawo I. Risk factors for iron deficiency anaemia in under-five children in Imo State, Nigeria. J Appl Sci Res. 2011;7(1):63–67. | ||
Leal LP, Batista Filho M, Lira PI, Figueiroa JN, Osório MM. Prevalence of anemia and associated factors in children aged 6–59 months in Pernambuco, Northeastern Brazil. Rev Saúde Pública. 2011;45(3):457–466. | ||
Kounnavong S, Sunahara T, Hashizume M, et al. Anemia and related factors in preschool children in the southern rural Lao People’s Democratic Republic. Trop Med Health. 2011;39(4):95–103. | ||
Roba KT, O’Connor TP, Belachew T, O’Brien NM. Infant and young child feeding (IYCF) practices among mothers of children aged 6–23 months in two agro-ecological zones of rural Ethiopia. Int J Nutr Food Sci. 2016;5(3):185–194. | ||
Gibson RS, Abebe Y, Hambidge KM, Arbide I, Teshome A, Stoecker BJ. Inadequate feeding practices and impaired growth among children from subsistence farming households in Sidama, Southern Ethiopia. Maternal & Child Nutrition. 2009;5(3):260–275. | ||
Moursi MM, Arimond M, Dewey KG, Trèche S, Ruel MT, Delpeuch F. Dietary diversity is a good predictor of the micronutrient density of the diet of 6-to 23-month-old children in Madagascar. J Nutr. 2008;138(12):2448–2453. | ||
Habte D, Asrat K, Magafu MG, et al. Maternal risk factors for childhood anaemia in Ethiopia. Afr J Reprod Health. 2013;17(3):110–118. | ||
Medhin G, Hanlon C, Dewey M, et al. Prevalence and predictors of undernutrition among infants aged six and twelve months in Butajira, Ethiopia: the P-MaMiE Birth Cohort. BMC Public Health. 2010;10:27. | ||
Lander R, Enkhjargal T, Batjargal J, et al. Poor dietary quality of complementary foods is associated with multiple micronutrient deficiencies during early childhood in Mongolia. Public Health Nutr. 2010;13(9):1304–1313. | ||
Rah JH, Akhter N, Semba RD, et al. Low dietary diversity is a predictor of child stunting in rural Bangladesh. Eur J Clin Nutr. 2010;64(12):1393–1398. | ||
Ayoya MA, Ngnie-Teta I, Séraphin MN, et al. Prevalence and risk factors of anemia among children 6-59 months old in Haiti. Anemia. 2013;2013. | ||
Ngnie-Teta I, Receveur O, Kuate-Defo B. Risk factors for moderate to severe anemia among children in Benin and Mali: insights from a multilevel analysis. Food Nutr Bull. 2007;28(1):76–89. | ||
Assis AM, Barreto ML, Gomes GS, et al. Childhood anemia prevalence and associated factors in Salvador, Bahia, Brazil. Cad Saúde Pública. 2004;20(6):1633–1641. | ||
Shamsir AS, Ahmed T, Roy SK, Alam N, Hossain I. Determinants of nutritional status of children aged less than 2 years in Rural Bangladesh. Indian Pediatr. 2012;2(49):821–824. | ||
Wamani H, Åstrøm A, Peterson S, Tumwine JK, Tylleskär T. Boys are more stunted than girls in sub-Saharan Africa: a meta-analysis of 16 demographic and health surveys. BMC Pediatr. 2007;7:1. |
 © 2016 The Author(s). This work is published and licensed by Dove Medical Press Limited. The full terms of this license are available at https://www.dovepress.com/terms.php and incorporate the Creative Commons Attribution - Non Commercial (unported, v3.0) License.
By accessing the work you hereby accept the Terms. Non-commercial uses of the work are permitted without any further permission from Dove Medical Press Limited, provided the work is properly attributed. For permission for commercial use of this work, please see paragraphs 4.2 and 5 of our Terms.
© 2016 The Author(s). This work is published and licensed by Dove Medical Press Limited. The full terms of this license are available at https://www.dovepress.com/terms.php and incorporate the Creative Commons Attribution - Non Commercial (unported, v3.0) License.
By accessing the work you hereby accept the Terms. Non-commercial uses of the work are permitted without any further permission from Dove Medical Press Limited, provided the work is properly attributed. For permission for commercial use of this work, please see paragraphs 4.2 and 5 of our Terms.