")
Back to Journals » Pharmacogenomics and Personalized Medicine » Volume 7
Analytical strategies for discovery and replication of genetic effects in pharmacogenomic studies
Authors Kohler J, Guennel T, Marshall S
Received 26 April 2014
Accepted for publication 24 May 2014
Published 13 August 2014 Volume 2014:7 Pages 217—225
DOI https://doi.org/10.2147/PGPM.S66841
Checked for plagiarism Yes
Review by Single anonymous peer review
Peer reviewer comments 3
Jared R Kohler, Tobias Guennel, Scott L Marshall
BioStat Solutions, Inc., Frederick, MD, USA
Abstract: In the past decade, the pharmaceutical industry and biomedical research sector have devoted considerable resources to pharmacogenomics (PGx) with the hope that understanding genetic variation in patients would deliver on the promise of personalized medicine. With the advent of new technologies and the improved collection of DNA samples, the roadblock to advancements in PGx discovery is no longer the lack of high-density genetic information captured on patient populations, but rather the development, adaptation, and tailoring of analytical strategies to effectively harness this wealth of information. The current analytical paradigm in PGx considers the single-nucleotide polymorphism (SNP) as the genomic feature of interest and performs single SNP association tests to discover PGx effects – ie, genetic effects impacting drug response. While it can be straightforward to process single SNP results and to consider how this information may be extended for use in downstream patient stratification, the rate of replication for single SNP associations has been low and the desired success of producing clinically and commercially viable biomarkers has not been realized. This may be due to the fact that single SNP association testing is suboptimal given the complexities of PGx discovery in the clinical trial setting, including: 1) relatively small sample sizes; 2) diverse clinical cohorts within and across trials due to genetic ancestry (potentially impacting the ability to replicate findings); and 3) the potential polygenic nature of a drug response. Subsequently, a shift in the current paradigm is proposed: to consider the gene as the genomic feature of interest in PGx discovery. The proof-of-concept study presented in this manuscript demonstrates that genomic region-based association testing has the potential to improve the power of detecting single SNP or complex PGx effects in the discovery stage (by leveraging the underlying genetic architecture and reducing the multiplicity burden), and it can also improve power in the replication stage.
Keywords: variance components, pharmacogenomics strategy, pharmacogenomics replication, pharmacogenomics discovery, personalized medicine
Introduction
In the past decade, the pharmaceutical industry and biomedical research sector have devoted considerable resources to pharmacogenomics (PGx) with the hope that understanding genetic variation in patients would deliver on the promise of personalized medicine.1 While technological breakthroughs have been realized in high-density single-nucleotide polymorphism (SNP) genotyping and DNA sequencing, with similar advancements made in the understanding of disease etiology, the discoveries resulting from the investigations of genetic variation and drug response have been limited. The roadblock to progress in PGx discovery is no longer in obtaining high-dimensional genetic data on patient populations, but rather in how to effectively translate the wealth of information available into value for clinical development programs. This subsequently requires advancements to be made in the analytics that inform PGx strategy.
In the context of patient stratification/selection being the ultimate goal, development of a clinically and commercially viable biomarker based on DNA sequence variation is a complex process that can be generally framed as a two-stage process: 1) identification of relevant genomic features (for example, genes, exons, and SNPs); and 2) translation of PGx discovery results into a patient subgroup. In this sense, downstream success in PGx-driven patient stratification/selection strategies ultimately hinges on the ability to identify the relevant genetic factors in the initial stage of PGx discovery. The focus of this manuscript is on the first stage, which also has applications in understanding the mode of action and drug target identification. It should be noted that the second stage is the focus of the field termed “subgroup identification” (for example, Li et al2 and Lipkovich et al3), and is the critical next step in translating findings from the discovery stage into clinical and commercial value in the form of a diagnostic tool (for example, a laboratory-developed test, a clinical laboratory test, or companion diagnostic).
Currently, most drugs enter Phase II/III clinical development with a hypothesis-generating PGx program due to a lack of prior empirical evidence on the drug–gene relationship with clinical response. This means that any analytical strategy for PGx discovery must be considerate to the unique stressors of translational research in the clinical trial setting: 1) the relatively small sample sizes; 2) the diverse clinical cohorts within and across trials due to genetic ancestry (potentially impacting the ability to replicate findings); 3) the potential polygenic nature of a drug response; and 4) the business implications of costs associated with both false positives and false negatives.4
Consider a hypothetical PGx study conducted on a placebo-controlled clinical trial with DNA samples assayed on an SNP genotyping platform in which the objective is to identify the genes/variants associated with treatment-specific efficacy. The common analytical approach used in this case is single SNP association testing (SSAT). Unfortunately, this analytical strategy has not delivered the desired value in terms of producing germline DNA-based classifiers with clinical utility for drug efficacy.1 Additionally, the rate of replication for single SNP associations is quite low (potentially due to the impact of linkage disequilibrium [LD] on association testing and the differences in allele frequency between populations).5
Given this, it is necessary to consider a shift in the current paradigm for discovery in PGx – specifically, should an individual SNP remain the primary genomic feature of interest at the discovery stage, or should an alternative definition based on a set of SNPs be considered toward improving the chances of success? In the context of PGx discovery without prior information, we recommend defining the genomic feature of interest as a gene, since this represents a biologically relevant unit of genetic variation with structural annotation that is independent of ancestry and is generalizable across studies.
While the concept of gene-based testing has been the subject of recent research in genome-wide association studies of human disease,5–9 the PGx space has been slow to adopt this approach potentially due to the nontrivial translation of gene-based discoveries to a patient stratification/selection strategy. For a single SNP effect, moving from PGx discovery to patient stratification/selection is relatively straightforward, as patients can be assigned to a subgroup based on their genotype call at a single locus. For a gene-level effect (or multi-SNP effect), moving from PGx discovery to patient stratification/selection requires refinement steps toward identifying the critical SNPs and functional form necessary to define the patient subgroup. However, it is important to note that while the transition to patient stratification/selection is easier for single SNP effects, there are inherent limitations in terms of subgroup size (due to allele frequency) and it is possible that a single SNP may not be sufficient in defining a classifier with clinical and commercial utility.
To realize the concept of gene-based testing, a variety of statistical methodologies have been developed to effectively harness the information captured by a set of SNPs, referred to herein more generally as region-based association testing (RBAT), as these methods are not restricted to only considering a gene, and it may be of interest to consider an alternative unit of genomic variation depending on the objectives of a given PGx study.6–9 In this work, a comparison is made across SSAT, RBAT that jointly tests the effect of a set of SNPs in a gene, and RBAT that considers identifying a gene as significant based on the minimum adjusted single SNP P-value.
In general, we demonstrate that a genomic region-based testing strategy can: 1) be more powerful (by leveraging the underlying genetic architecture and reducing the multiplicity burden); 2) lend to the detection of complex genetic effects; and 3) improve the likelihood of replication. Here, we provide proof-of-concept (POC) evaluations in support of a genomic region-based testing strategy for PGx discovery and replication, and we offer an analytical framework conducive to tailoring and PGx study design.
Materials and methods
In most PGx studies, the number of genetic markers to be investigated in the PGx discovery stage (even in a candidate gene study) is larger than the available number (n) of samples (ie, number of genetic markers >n), and thus subgroup identification approaches (such as those by Li et al)2 are often not directly applicable, therefore it is often necessary to narrow a larger set of genomic regions to a focused set of genomic regions before estimating a genetic signature for the purpose of patient stratification. The evaluation of different analytical strategies to approach this prescreening (or discovery) step is the focus of this manuscript, where emphasis is given to association testing as the statistical method of choice for the initial screening.
Herein, the focus will be on common SNPs having a minor allele frequency (MAF) ≥5%. However, similar strategies as described in this manuscript can be employed for low frequency (ie, 1%≤ MAF <5%) or rare (MAF <1%) variants, although some methods may not be applicable or may require adaptation in this context.
Association testing framework
Assume that genotype data from patients in a placebo-controlled, two-arm clinical trial will be collected, and that it is of interest to identify genetic markers with treatment-specific effects. Testing for an association between a single, or a set of, genetic marker(s) and a univariate continuous outcome of interest in the context of PGx studies can be framed in a standard linear regression framework:

where y is the phenotype vector, α is a vector of coefficients (fixed effects) for covariates contained in X, βT is the treatment effect, T a vector of the treatment indicators for each patient (1= treated, 0= placebo), ƒG(G) is a function of the genotype matrix with G representing a potential genetic main effect (ie, a prognostic effect), and ε~N(0, σ2I) is the error term. The effect of interest when aiming to identify treatment-specific effects is the interaction term, ƒGxT(G). The functional form of ƒ determines what type of association testing is performed, as outlined in the following sections.
Single SNP association testing (SSAT)
SSAT is the most commonly used approach in PGx studies. The functional form ƒ for SSAT reduces to,

where Gj is the genotype matrix containing genotypes of SNP j, coded using a genotypic model, for patients i=1,…n. The test of interest is , versus , where significance is determined via a g − 1 degree of freedom likelihood ratio test where g is the number of observed genotypes for SNP j. It is important to note that without the loss of generality, it is trivial to consider alternative codings/genetic models, such as additive, dominant, or recessive.
Region-based association testing (RBAT)
As outlined in the introduction, SSAT has been used since the inception of PGx studies despite suboptimal performance in the context of translational research in the clinical trial setting (for example, in the case of relatively small sample sizes, diverse cohorts, and potential polygenic effects of drug responses).4 Alternatively, RBAT approaches have the potential to improve power (by leveraging the underlying LD structure in genetic data and reducing the multiplicity burden) and to detect complex PGx effects. While many RBAT approaches exist, this POC study will focus on contrasting the performance of SSAT with two exemplary RBAT approaches that are often used in disease genetics to demonstrate how these two types of association testing strategies can provide complementary information in the context of PGx studies.
Single SNP region-based association testing (SS-RBAT)
A straightforward approach to test the combined effect of a set of p SNPs that has been used in genetic analyses is to combine p P-values from SSAT using methods such as Fisher’s method to combine P-values or by using the minimum P-value approach.10,11 This manuscript will consider the latter (ie, the significance of a set of p SNPs in a genomic region), evaluated via,

where pj,adjusted is the P-value of SNP j based on SSAT after adjusting for multiplicity (see the section titled, “Additional considerations for performance metrics” for details regarding multiplicity adjustment).
For the purposes of this POC study, the approach described in this section is sufficient and computationally efficient to demonstrate general performance trends.
Variance components region-based association testing (VC-RBAT)
A family of RBAT approaches that has gained popularity in recent years is known as kernel machine regression, and includes tests such as the sequence kernel association test.9 These approaches can be framed in the context of a linear mixed model and they ultimately test whether a significant proportion of phenotypic variability can be explained by genetic variation within a region of interest. Specifically, the functional form ƒ can be written as,

where and are assumed to be random effects following a multivariate normal distribution, with variance-covariance matrices K1(G) representing the main effect due to genetic variability and K2(G) = T  K1(G) used for the region-by-treatment interaction – ie, the effect of interest – where denotes the element-wise (Hadamard) matrix product. K1 and K2 are also called kernels, and they measure the genetic similarity between individuals; several choices for these kernels are available. Since this POC study focuses on common SNPs, an unweighted Identity-by-State kernel will be utilized for all evaluations.7
The test of interest for this specific RBAT approach then simplifies to the variance component test, versus, and thus this approach will be referred to herein as variance components RBAT (VC-RBAT). Significance will be determined using a linear score test introduced by Qu et al8 that allows for testing the significance of a variance component in the presence of a nuisance variance component (ie, ) and has desirable properties when sample sizes are small.
For additional details around VC-RBAT approaches, please refer to Qu et al8 and Wu et al.9
Simulation study to evaluate analytical strategies to identify subgroup-defining genetic markers
Phenotypic and genotypic data were simulated to mimic clinical trial conditions and realistic human genetic variation. Assume that a candidate gene study evaluating common SNPs across 25 genes is being conducted as part of a Phase II (or Phase III) placebo-controlled clinical trial with 400 treated and 400 placebo patients. For the purpose of this POC study, all patients are Caucasians of European ancestry. Details around the simulation of phenotypic and genotypic data are given in the following sections.
Simulation of phenotypic data
The simulation study outlined in this section aims to evaluate SSAT, SS-RBAT, and VC-RBAT in a focused set of realistic scenarios. Since the end goal of many PGx studies is to identify a subgroup of patients with enhanced treatment effects (ie, patient stratification), continuous outcomes were simulated (assuming that a subgroup solely defined by genetic markers exists) using the following model:

where Si is an indicator variable for subgroup membership, βS the subgroup main effect (ie, a prognostic effect), βSxT is the enhanced treatment effect of patients belonging to the subgroup, and the error term.
Assume that a weak treatment effect with a small effect size is observed in the overall population:

where ΔT is the scaled treatment effect (ie, the difference in means between the treated and placebo patients) scaled by the standard deviation. Furthermore, assume that the treatment effect can be partitioned into a genetic and a nongenetic component via the subgroup-by-treatment interaction:

where C is the proportion of the treatment effect explained by genetics (ie, subgroup membership) and |S| is the subgroup size. Thus, and with was used to simulate outcomes. Note that for the purpose of this POC study, no subgroup main effect was assumed (ie, was used for all simulations).
Simulation of genotypic data and assignment of patients to genetically defined subgroups
Subject-level genotype data for 254 common variants in an exemplary 63.3 kb region of the ABCA1 gene (chromosome 9: 107627259–107690527; relative to human genome GRCh38 reference assembly and Human Annotation Release 104; see Figure S1) was simulated using haplotypes from individuals of European ancestry, as downloaded from the 1000 Genomes Project.12
To allow for comparison across different scenarios, a subgroup size |S| of 30% was targeted across various subgroup definitions. Subgroup membership for each patient was determined using the following three POC scenarios (note that AA denotes the major homozygote):
- Enhanced treatment effect is driven by a single SNP located in an LD block:
- Enhanced treatment effect is driven by a single SNP not in LD with other SNPs (ie, maximum pairwise r2 of 0.2):
- Enhanced treatment effect is driven by two SNPs located in the same gene (but in different LD blocks):
Note that the MAFs of SNPs rs11790326, rs199894164, rs4100654, and rs12347784 are 0.19, 0.19, 0.08, and 0.09, respectively, generating subgroup sizes of approximately 30% for all three scenarios.
Additional considerations and performance metrics
For each of the 30 scenarios outlined in the sections titled, “Simulation of phenotypic data” and “Simulation of genotypic data and assignment of patients to genetically defined subgroups”, 1,000 datasets were simulated and randomly combined to generate 500 pairs of trials representing a discovery trial and a replication trial.
For each trial, P-values for SSAT, SS-RBAT, and VC-RBAT were recorded for all variants in the ABCA1 region or the entire ABCA1 region, respectively. For computational efficiency, P-values for the remaining 24 genes and 3,546 independent variants across these genes were drawn from a uniform distribution, since only variants in gene ABCA1 provided a genetic contribution to the treatment effect.
For the discovery trial, multiplicity adjustment was performed using a Bonferroni correction for 25 tests for VC-RBAT and 3,800 effective tests for SSAT (after consideration to dependency among SNPs). Significance was determined using an alpha-level α1 of 0.05 or 0.20 (as an alternative, relaxed threshold in the case where more risk is acceptable at the discovery stage). For the replication trial, the multiplicity adjustment was performed using a Bonferroni correction, adjusting for the number of genes/SNPs that were significant at alpha-level α1 in the discovery trial for VC-RBAT or SSAT, respectively. Significance in the replication trial was determined using an alpha-level α2 of 0.05.
For each scenario, the following performance metrics were estimated:
- Power of VC-RBAT and SS-RBAT to detect ABCA1 in the discovery trial using alpha-level α1;
- Power of SSAT to detect the subgroup-defining SNPs in the discovery trial using alpha-level α1;
- Power of VC-RBAT and SS-RBAT to discover and replicate ABCA1 using alpha-levels α1 and α2; and
- Power of SSAT to discover and replicate the subgroup-defining SNPs using alpha-levels α1 and α2.
Note that power to discover and replicate in metrics 3 and 4 was calculated as the proportion among the 500 dataset pairs where the unit of interest (ie, the SNP or gene) was significant after multiplicity adjustment in the discovery trial using alpha-level α1, and significant after multiplicity adjustment in the replication trial using alpha-level α2.
Additionally, type 1 error was estimated for scenarios where C=0 (ie, no genetic contribution to the treatment effect exists).
Results
This section summarizes the results (see Table 1; Figures 1 and 2) from the simulation study outlined in the section titled, “Simulation study to evaluate analytical strategies to identify subgroup-defining genetic markers”. The following general observations were made for the scenarios considered in this POC study:
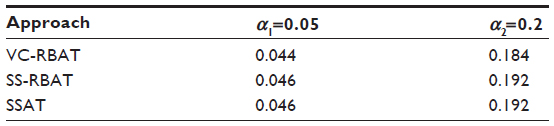 | Table 1 Type 1 error in the PGx discovery stage |
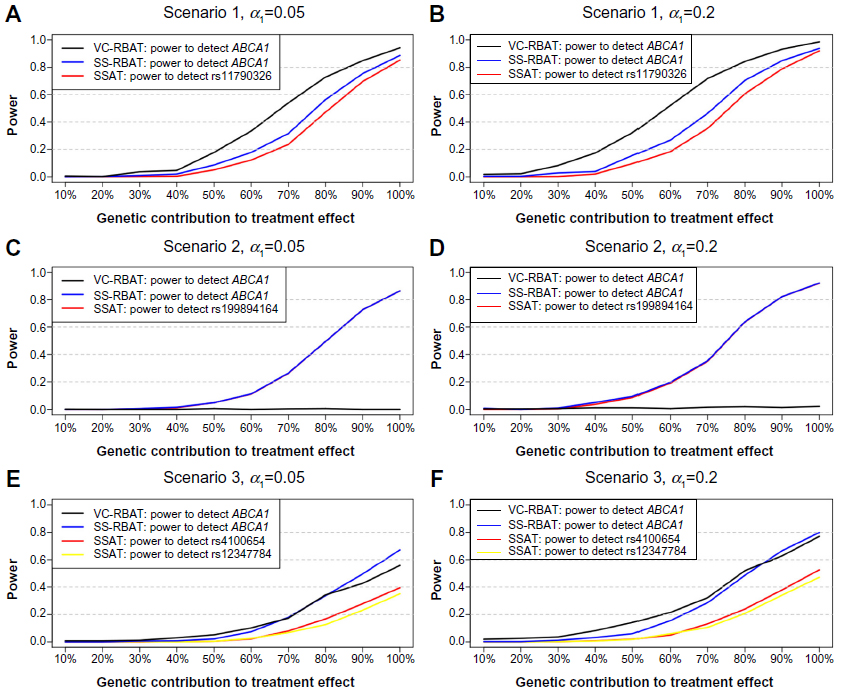 | Figure 1 Power estimates for the PGx discovery stage for all scenarios. |
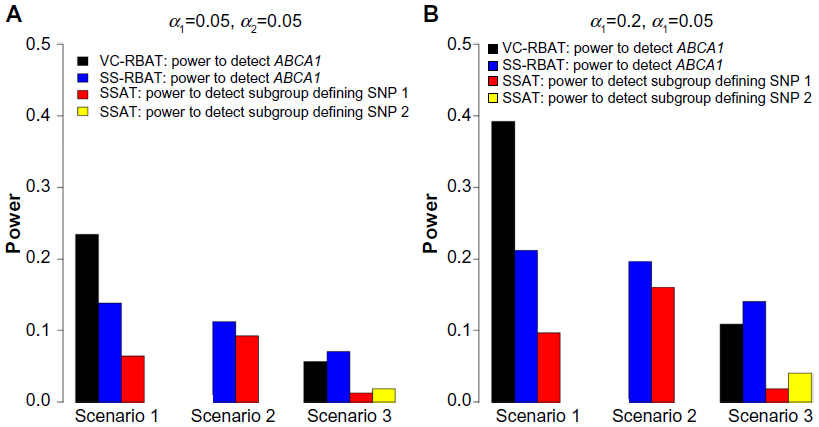 | Figure 2 Power estimates for the replication of PGx effects for selected scenarios. |
PGx discovery stage:
- In the context of no PGx effect, type 1 error is preserved (ie, the probability of a false positive is controlled at the desired level);
- If the PGx subgroup-defining SNP is located in a region of high LD, RBAT approaches considered here generally outperform SSAT, where the multimarker approach (ie, VC-RBAT) had improved power over the single SNP region-based approach (ie, SS-RBAT);
- If the PGx subgroup-defining SNP is not in LD with any other SNP in the region then, as expected, SSAT and SS-RBAT have comparable power and VC-RBAT has negligible power due to the inability to leverage information captured by other SNPs in LD with the PGx subgroup-defining SNP; and
- In the context of a multi-SNP effect, both RBAT approaches have higher power than SSAT.
PGx replication stage:
- RBAT approaches demonstrate the potential to improve the power to replicate PGx findings across the scenarios evaluated in the POC; and
- Relaxing the alpha threshold (ie, taking more risk) in the discovery stage improves the power to replicate PGx findings across the scenarios evaluated in the POC.
In summary, the results of the POC study presented here demonstrate that the performance of the selected statistical frameworks is dependent on both the true underlying PGx effect, as well as on the genomic architecture in the region where the PGx subgroup-defining SNP is located. Although in many scenarios power is limited across all approaches, this demonstrates the value of considering alternatives to SSAT, as these region-based approaches may provide complementary information not obtained by SSAT.
Discussion
To appreciate the need for advancement in PGx, one can start by taking inventory of the success in this space since the approval of Herceptin® (Genentech, Inc., South San Francisco, CA, USA) (the first drug with PGx/biomarker information on its label). A review of the United States Food and Drug Administration’s (FDA’s) table of pharmacogenomic biomarkers in drug labeling1 revealed that only 12% of drugs since Herceptin had PGx/biomarker information in their label and only 14 of these labels direct clinicians to utilize testing prior to prescription. Clearly, there is room for improvement in PGx-driven patient stratification/selection for therapeutic development and intervention; however, the current paradigm and PGx analytics are failing to produce biomarkers with clinical and commercial utility.1
While technological advancements tend to follow Moore’s law,13 similar advancements are not necessarily realized in the space of analytics. Specifically, the analytical “breakthroughs” in the space of personalized medicine have not translated to the desired impact at the patient level, especially in the area of drug effectiveness, as noted by the review of the FDA’s table. To our knowledge, aside from variations in the cytochrome p450 enzymes, no genes have been identified that harbor germline DNA variation, which impacts drug efficacy in a clinically relevant manner. At this point, incorporating better analytical strategies in the early stages of PGx discovery is necessary to deliver empirical evidence toward transforming the personalized medicine landscape.
It is subsequently proposed that consideration be given to a paradigm shift in what is generally the most commonly applied analytical strategy in the PGx discovery stage – specifically, shifting away from starting at the smallest unit of genetic variation (ie, a single variant) to starting at a larger unit of genetic variation (ie, aggregating information across genomic regions, such as from a gene). For the purposes of this manuscript, the genomic region was defined as the gene due to its consistent definition across clinical trial populations, ethnicities, and so on;5 however, there is nothing that precludes other biologically relevant units of genomic variation, such as an exon or a pathway, from being considered.
While various frameworks/methodologies exist for evaluating the impact of a genetic variation within a region, two exemplary RBAT approaches were implemented in this POC simulation study. The results outlined in the Results section demonstrate that RBAT approaches, independent of the statistical framework chosen (ie, SS-RBAT or VC-RBAT), tend to provide the following:
- Improved power to detect either single SNP or complex PGx effects (dependent on the LD structure in the region where the PGx subgroup-defining SNP resides); and
- Improved power to replicate PGx findings (ie, the ability to discover a PGx effect and then replicate it in a subsequent trial).
Understanding that genomic variation within a specific region impacts drug response is the critical first step toward developing a patient stratification/selection strategy. The prevailing thought in this manuscript is that it is first necessary to identify the correct genomic region and then to subsequently refine these findings toward understanding which specific variants are driving the response. To this point, while the topic of developing a companion diagnostic (to determine who to treat) or a laboratory-developed test (to help inform physician practice patterns) is often discussed,14 it is first necessary to implement a rigorous analytical strategy capable of both discovering the important genes/variants and identifying patients based on this set of important genes/variants (ie, subgroup identification). Future analytical work is needed to refine and effectively utilize gene-level findings, with an emphasis in the field of subgroup identification, as this will be integral in translating PGx findings to value – that is, delivering tailored, PGx-guided therapeutic development and intervention strategies.
Perhaps the most significant contribution of this manuscript is the provision of a framework to inform PGx strategy development via tailored simulations. For clinical development programs to realize the added value of PGx, tailored analytical strategies should be incorporated in the early stages of discovery to increase the chances of success at achieving your ultimate goal (whether that be the development of a diagnostic for patient stratification, understanding the mechanism of action for a drug, or identifying new drug targets). Emphasizing analytics will be paramount in realizing the potential of PGx and personalized medicine for the pharmaceutical and biotechnology industries, providers, payers, and patients.
Acknowledgments
We thank Fang Chen, Lin Li, and Dilan Paranagama for their contributions to the implementation and evaluation of the methodology and simulation studies.
Disclosure
This study results from the employment of all authors by BioStat Solutions, Inc. (BSSI). The authors report no conflicts of interest in this work.
References
Tutton R. Pharmacogenomic biomarkers in drug labels: what do they tell us? Pharmacogenomics. 2014;15(3):297–304. | |
Li L, Guennel T, Marshall SL, Cheung LW. A multi-marker molecular signature approach for treatment-specific subgroup identification with survival outcomes. Pharmacogenomics J. Epub March 18, 2014. | |
Lipkovich I, Dmitrienko A, Denne J, Enas G. Subgroup identification based on differential effect search – a recursive partitioning method for establishing response to treatment in patient subpopulations. Stat Med. 2011;30(21):2601–2621. | |
Peters, BJ, Rodin AS, De Boer A, & Maitland-van der Zee AH. Methodological and statistical issues in pharmacogenomics. Journal of Pharmacy and Pharmacology. 2010;62(2):161–166. | |
Neale BM and Sham PC. The future of association studies: gene-based analysis and replication. The American Journal of Human Genetics. 2004;75(3), 353–362. | |
Pan W. Relationship between genomic distance-based regression and kernel machine regression for multi-marker association testing. Genet Epidemiol. 2011;35(4):211–216. | |
Kwee LC, Liu D, Lin X, Ghosh D, Epstein MP. A powerful and flexible multilocus association test for quantitative traits. Am J Hum Genet. 2008;82(2):386–397. | |
Qu L, Guennel T, Marshall SL. Linear score tests for variance components in linear mixed models and applications to genetic association studies. Biometrics. 2013;69(4):883–892. | |
Wu MC, Lee S, Cai T, Li Y, Boehnke M, Lin X. Rare-variant association testing for sequencing data with the sequence kernel association test. Am J Hum Genet. 2011;89(1):82–93. | |
Kost JT, McDermott MP. Combining dependent P-values. Stat Probab Lett. 2002;60(2):183–190. | |
Westfall PH, Young SS. Resampling-Based Multiple Testing: Examples and Methods for P-Value Adjustment. New York, NY: John Wiley & Sons; 1993. | |
Abecasis GR, Altshuler D, Auton A, et al. 1000 Genomes Project Consortium. A map of human genome variation from population-scale sequencing. Nature. 2010;467(7319):1061–1073. | |
Mollick E. Establishing Moore’s Law. IEEE Annals of the History of Computing. 2006;28(3):62–75. | |
Fridlyand J, Simon RM, Walrath JC et al. Considerations for the successful co-development of targeted cancer therapies and companion diagnostics. Nat Rev Drug Discov. 2013;12(10):743–755. |
Supplementary material
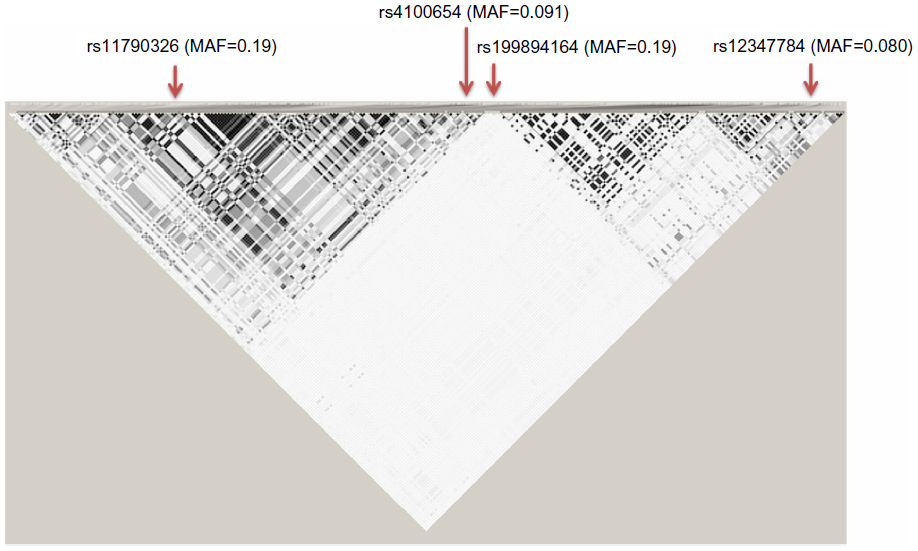 | Figure S1 Linkage disequilibrium plot of ABCA1 region used for simulation studies.
|
 © 2014 The Author(s). This work is published and licensed by Dove Medical Press Limited. The full terms of this license are available at