")
Back to Journals » Infection and Drug Resistance » Volume 15
Analysis on the Risk Factors of Malnutrition in Type 2 Diabetes Mellitus Patients with Pulmonary Tuberculosis
Received 6 July 2022
Accepted for publication 10 December 2022
Published 21 December 2022 Volume 2022:15 Pages 7555—7564
DOI https://doi.org/10.2147/IDR.S381392
Checked for plagiarism Yes
Review by Single anonymous peer review
Peer reviewer comments 3
Editor who approved publication: Professor Suresh Antony
Liangliang Ma,1 Xuelin Chen,1 Maolong Gao2
1Department of Infectious Diseases, Beijing Geriatric Hospital, Beijing, 100095, People’s Republic of China; 2Department of Science and Technology, Beijing Geriatric Hospital, Beijing, 100095, People’s Republic of China
Correspondence: Liangliang Ma, Department of Infectious Diseases, Beijing Geriatric Hospital, No. 118 Wenquan Road, Haidian District, Beijing, 100095, People’s Republic of China, Tel +86-18610672953, Email [email protected]
Objective: To explore the risk factors of malnutrition in type 2 diabetes mellitus combined with pulmonary tuberculosis (PTB-T2DM) patients and further to provide a clinical research basis for the identification and prevention of malnutrition.
Methods: From January 2020 to February 2022, 307 adult patients diagnosed with PTB-T2DM were enrolled in this retrospective study. According to whether malnutrition occurred after 6 months of treatment, patients were divided into malnutrition group (n = 123) and non-malnutrition group (n = 184). The nutritional status of patients was evaluated according to the Micro-Nutrition Assessment Scale (MNA). Evaluation of indicators was performed, including general information, disease characteristics of PTB-T2DM and laboratory indicators.
Results: Univariate logistic regression analysis showed that drinking, divorced, BMI < 18.5kg/m2, weight < 45kg, waist circumference < 79cm, hip circumference < 88cm, waist-to-hip ratio < 69.99, calf circumference < 26kg, grip strength < 28kg, NRS score ≥ 3, Hb < 106g/L, Alb < 29.00g/L, PA < 48.00μmol/L, GHB < 3.40%, serum transferrin < 1.37 mmol/L, serum potassium < 3.18mmol/L, serum sodium < 142.95 mmol/L, FEV1 ≥ 67.90% and RV < 2.89% were risk factors for malnutrition in PTB-T2DM patients (all P < 0.05). The results of multivariate logistic regression analysis showed that drinking, divorced, weight < 45kg, BMI < 18.5kg/m2, NRS score ≥ 3, Hb < 106g/L, Alb < 29.00g/L, PA < 48.00μmol/L, serum transferrin < 1.37mmol/L, FEV1 ≥ 67.90% and RV < 2.89% were independent risk factors for malnutrition in PTB-T2DM patients (all P < 0.05).
Conclusion: Drinking, divorced, weight < 45kg, BMI < 18.5kg/m2, NRS score ≥ 3, Hb < 106g/L, Alb < 29.00g/L, PA < 48.00μmol/L, serum transferrin < 1.37mmol/L, FEV1 ≥ 67.90% and RV < 2.89% may be independent risk factors for malnutrition in PTB-T2DM patients, and timely identification of high-risk groups could improve the prognosis of PTB-T2DM patients.
Keywords: risk factors, malnutrition, type 2 diabetes mellitus, pulmonary tuberculosis
Introduction
Diabetes mellitus (DM) is a metabolic disorder caused by genetic factors, environment and lifestyle, and its mechanism is the defect of insulin secretion or function. In recent years, the prevalence of DM, mainly manifested by hyperglycemia, has increased sharply, reaching 9.7%.1 In China, type 2 diabetes accounts for 90–95% of all diabetic patients.2 Tuberculosis (TB) is a chronic infectious disease caused by Mycobacterium tuberculosis,3 and most patients with latent TB infection have no obvious clinical symptoms. When the body’s resistance is reduced or cell-mediated allergy is increased, patients with latent TB will develop active TB, of which pulmonary tuberculosis (PTB) is the most common.4 China was one of 22 countries with a high TB burden globally, with about 4.5 million active TB patients.5 As many as 130,000 TB patients die every year, which was more than twice the total number of other infectious diseases in China.5 Type 2 DM is one of the risks to develop TB, and the incidence of type 2 diabetes mellitus combined with pulmonary tuberculosis (PTB-T2DM) showed an increasing trend of 19.3%–24.1%.6 These two diseases were closely related and promote each other.6 On the one hand, due to high tissue sugar content, metabolic disorders and reduced immune function, Mycobacterium tuberculosis accelerated the reproduction rate and increased the generation of drug-resistant strains, which affected the prognosis of PTB-T2DM patients;7 on the other hand, TB can aggravate the disorder of glucose metabolism in T2DM patients, increase the incidence of ketoacidosis, and present a dangerous prognosis.7 PTB-T2DM was a new challenge in the field of public health all over the world due to its severity, difficulty in treatment and worse prognosis.7
As a chronic wasting disease, patients with PTB-T2DM tend to be in a state of malnutrition, which will impair the body’s repair and immune function, thus seriously affecting the prognosis of patients and increasing the risk of disease recurrence.8,9 Previous studies reported that the incidence of malnutrition in PTB-T2DM patients is 45%–78.3%.10 The occurrence of malnutrition in PTB-T2DM patients was caused by several factors. Although T2DM patients had a high concentration of glucose in their tissues, the lack of insulin made the body unable to make full use of glucose for energy and instead decomposed protein and fat for energy, which led to the occurrence of malnutrition. Decreased appetite caused by T2DM led to different degrees of malnutrition.11 In addition, as a chronic wasting disease, PTB also increased catabolism, reduces protein and fat storage, and eventually leads to malnutrition.12 In addition, T2DM patients had a higher concentration of glucose in their tissues, which was conducive to the growth of Mycobacterium tuberculosis, further aggravating the severity.11 Therefore, it was crucial to explore the risk factors of malnutrition in PTB-T2DM patients to improve prognosis and quality of life.13 Timely identification of the potential high-risk population for malnutrition in PTB-T2DM patients was beneficial to improve the prognosis of the population. At present, there were few reports on the risk factors of malnutrition in PTB-T2DM patients.
Herein, our study aimed to explore the risk factors of malnutrition in PTB-T2DM patients, and further to provide a clinical research basis for the identification and prevention of malnutrition.
Materials and Methods
Design of the Study
From January 2020 to February 2022, 307 adult patients diagnosed with PTB-T2DM in Beijing Geriatric Hospital were enrolled in this retrospective study. All patients were enrolled according to the order of visit time from earlier to later. They were followed up for 6 months, and their nutritional status was assessed after 6 months of treatment. According to whether malnutrition occurred after 6 months of treatment, patients were divided into malnutrition group (n = 123) and non-malnutrition group (n = 184). This study protocol was formulated in accordance with the requirements of the Declaration of Helsinki of the World Medical Association. It was approved by the Ethics Committee of Beijing Geriatric Hospital (2018BJLNYY-008) (Figure 1).
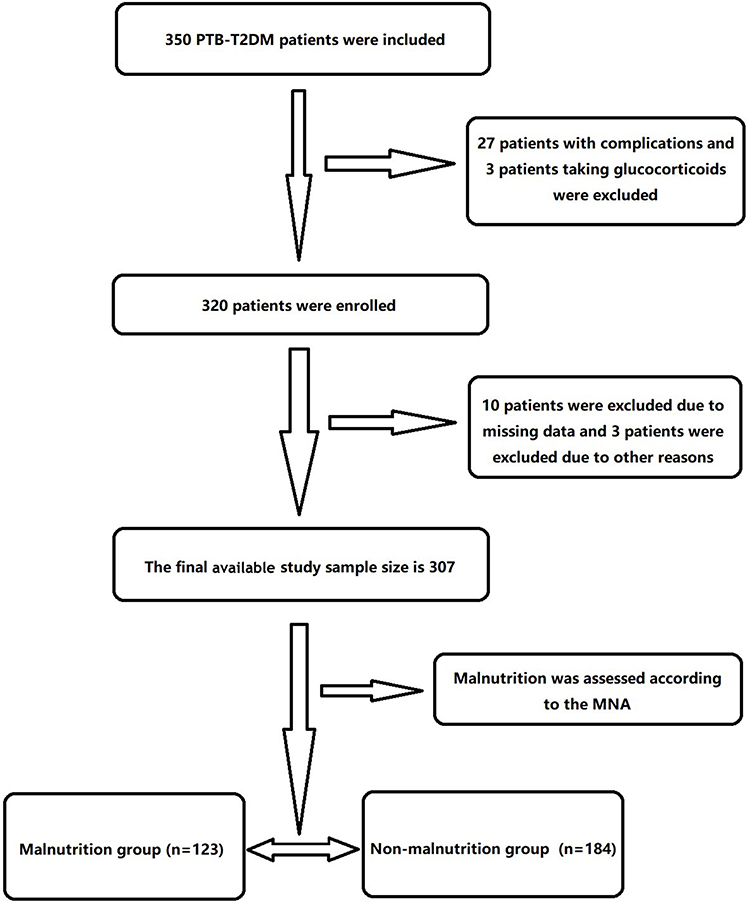 |
Figure 1 Flow chart of patient enrollment. Abbreviations: PTB-T2DM, type 2 diabetes mellitus combined with pulmonary tuberculosis; MNA, Micro-Nutrition Assessment Scale. |
Inclusion and Exclusion Criteria
Inclusion Criteria
(1) Patient diagnosed with PTB; (2) Patient diagnosed with T2DM; (3) Patients could cooperate to complete the examination, diet intervention and diet record; (4) Patients with good compliance.
Exclusion Criteria
(1) Patients with mental abnormalities; (2) Pregnant patients; (3) Patients with other serious underlying diseases, such as heart disease and hypertension; (4) Patients with malignant tumors; (5) Patients with bronchial asthma who are taking glucocorticoids.
Diagnostic Criteria
The diagnostic criteria for T2DM:14 The patient presented with classic type 2 diabetes and had an abnormal blood glucose test (random blood glucose ≥ 11.1mmol/L or fasting blood glucose ≥ 7.0mmol/L; Or oral glucose tolerance test 2h blood glucose ≥ 11.1mmol/L).
The diagnostic criteria for PTB:15 (1) Cough, expectoration, fever and other clinical symptoms, combined with typical manifestations of PTB in chest X-ray and chest CT; (2) Tuberculin skin test (PPD) response ≥10mm; (3) TB antibody positive or γ-interferon release test positive; (4) Smear and culture of mycobacterium were positive; (5) Histopathology is consistent with tuberculous changes and acid fast staining positive.
The nutritional status of patients was evaluated according to the micro Nutrition Assessment Scale (MNA),16 with a total score of 30 points, which was divided into malnutrition (score <24) and good nutritional status (score ≥24).
Evaluation Index
General information included age, sex, alcohol consumption, smoking, marital status, height, weight, Body Mass Index (BMI), waist circumference, hip circumference, waist-to-hip ratio, calf circumference, grip strength, and Nutritional Risk Screening (NRS) score.17
Data related to disease characteristics of PTB-T2DM included type of PTB, course of PTB, presence of pulmonary cavity, presence of complications, presence of extrapulmonary TB, and compliance of treatment, the course of T2DM, complications and types of treatment.
Laboratory indicators included hemoglobin (Hb), albumin (Alb), serum prealbumin (PA), neutrophil/lymphocyte ratio (NLR), glycosylated hemoglobin (GHB), fasting blood glucose (FBS), serum transferrin, serum sodium, serum potassium and pulmonary function parameters [forced vital capacity (FVC), forced expiratory volume second (FEV1), FEV1/FVC, maximal voluntary ventilation (MVV), residual volume (RV)].
Specific Method of Measurement
All data were collected by two physicians together after training, and if the data collected by the two physicians differed, the attending physician was asked to measure and assess again to determine.
Height and Weight
Fasting patients, after defecation, take off their coats and shoes and stand on 900Y measuring instrument of height and weight (produced by Henan Lejia Electronic Technology Co., Ltd.). The body was kept upright so that the headrest, buttocks, and heels of both feet remained on the same vertical plane, and the patient ‘s height and weight were measured. BMI was calculated according to height and weight values.
Waist Circumference
The subject ‘s feet were separated by 30–40 cm, the posture was kept upright and breathing smoothly, and measured at the midpoint of the line between the lower rib margin and the anterior superior iliac spine.
Hip Circumference
The subject stood naturally, the buttocks relax, and read the value around a circle at the highest point of the buttocks.
Calf Circumference
The subject ‘s legs were divided, and the circumference was measured with a soft measuring tape in the thickest horizontal position of the lower leg, and the average value of the two lower legs was taken.
Grip Strength
Electronic grip strength meter with uniform correction was used for measurement. Each hand was measured twice, and the average of four determinations was taken.
Pulmonary function tests were performed using the German Jaeger spirometer and measured according to the American Thoracic Society combined with the European Respiratory Society criteria.
Five milliliters of fasting venous blood was taken from all subjects and then centrifuged for examination. BC-5390 automatic hematology analyzer (Shenzhen Mairui Co., LTD, China) and Siemens ADVIA2400 automatic biochemical analyzer (Siemens Co., LTD, Germany) were used for detection.
Statistical Analysis
All the data collected in this study were analyzed using SPSS 23.0 software. The normality of continuous variables was tested by the Shapiro–Wilk test as well as the graphical illustration of histograms and Q–Q plots. Normally distributed measurement data were expressed as mean ± standard deviation (SD), while non-normally distributed measurement data were expressed as median (interquartile range), and the comparisons were examined by Student's t-test and Mann–Whitney test (non-parametric distribution). The categorical data were expressed as n (%), and the differences between the two groups were examined by chi-square analysis or Fisher’s Exact Test. Univariate/multivariate logistic regression analysis was used to explore the independent risk factors for malnutrition in PTB-T2DM patients, and the results were expressed as odds ratio (OR) and 95% confidence intervals (CIs). The statistical significance level was set at 0.05 for a two-sided test.
Results
Patient Characteristics
A total of 307 patients were enrolled in this study with 177 (57.65%) males and 130 (42.35%) females. The malnutrition group included 184 patients with a median age of 56.92 ± 12.81 years (range 22–73 years). The non-malnutrition group included 123 patients with a median age of 57.12 ± 13.12 years (range 22–72 years).
Univariate Analysis of Malnutrition in PTB-T2DM Patients
All indicators of general information, disease characteristic data and laboratory data were included in the univariate analysis (Table 1). There were significant differences in the indicators of drinking, marital status, BMI, weight, waist circumference, hip circumference, waist-to-hip ratio, calf circumference, grip strength, NRS score, Hb, Alb, PA, NLR, GHB, FBS, serum transferrin, serum sodium, serum potassium, FEV1 and RV between the two groups (all P < 0.05). There was no significant difference in other indicators (all P > 0.05).
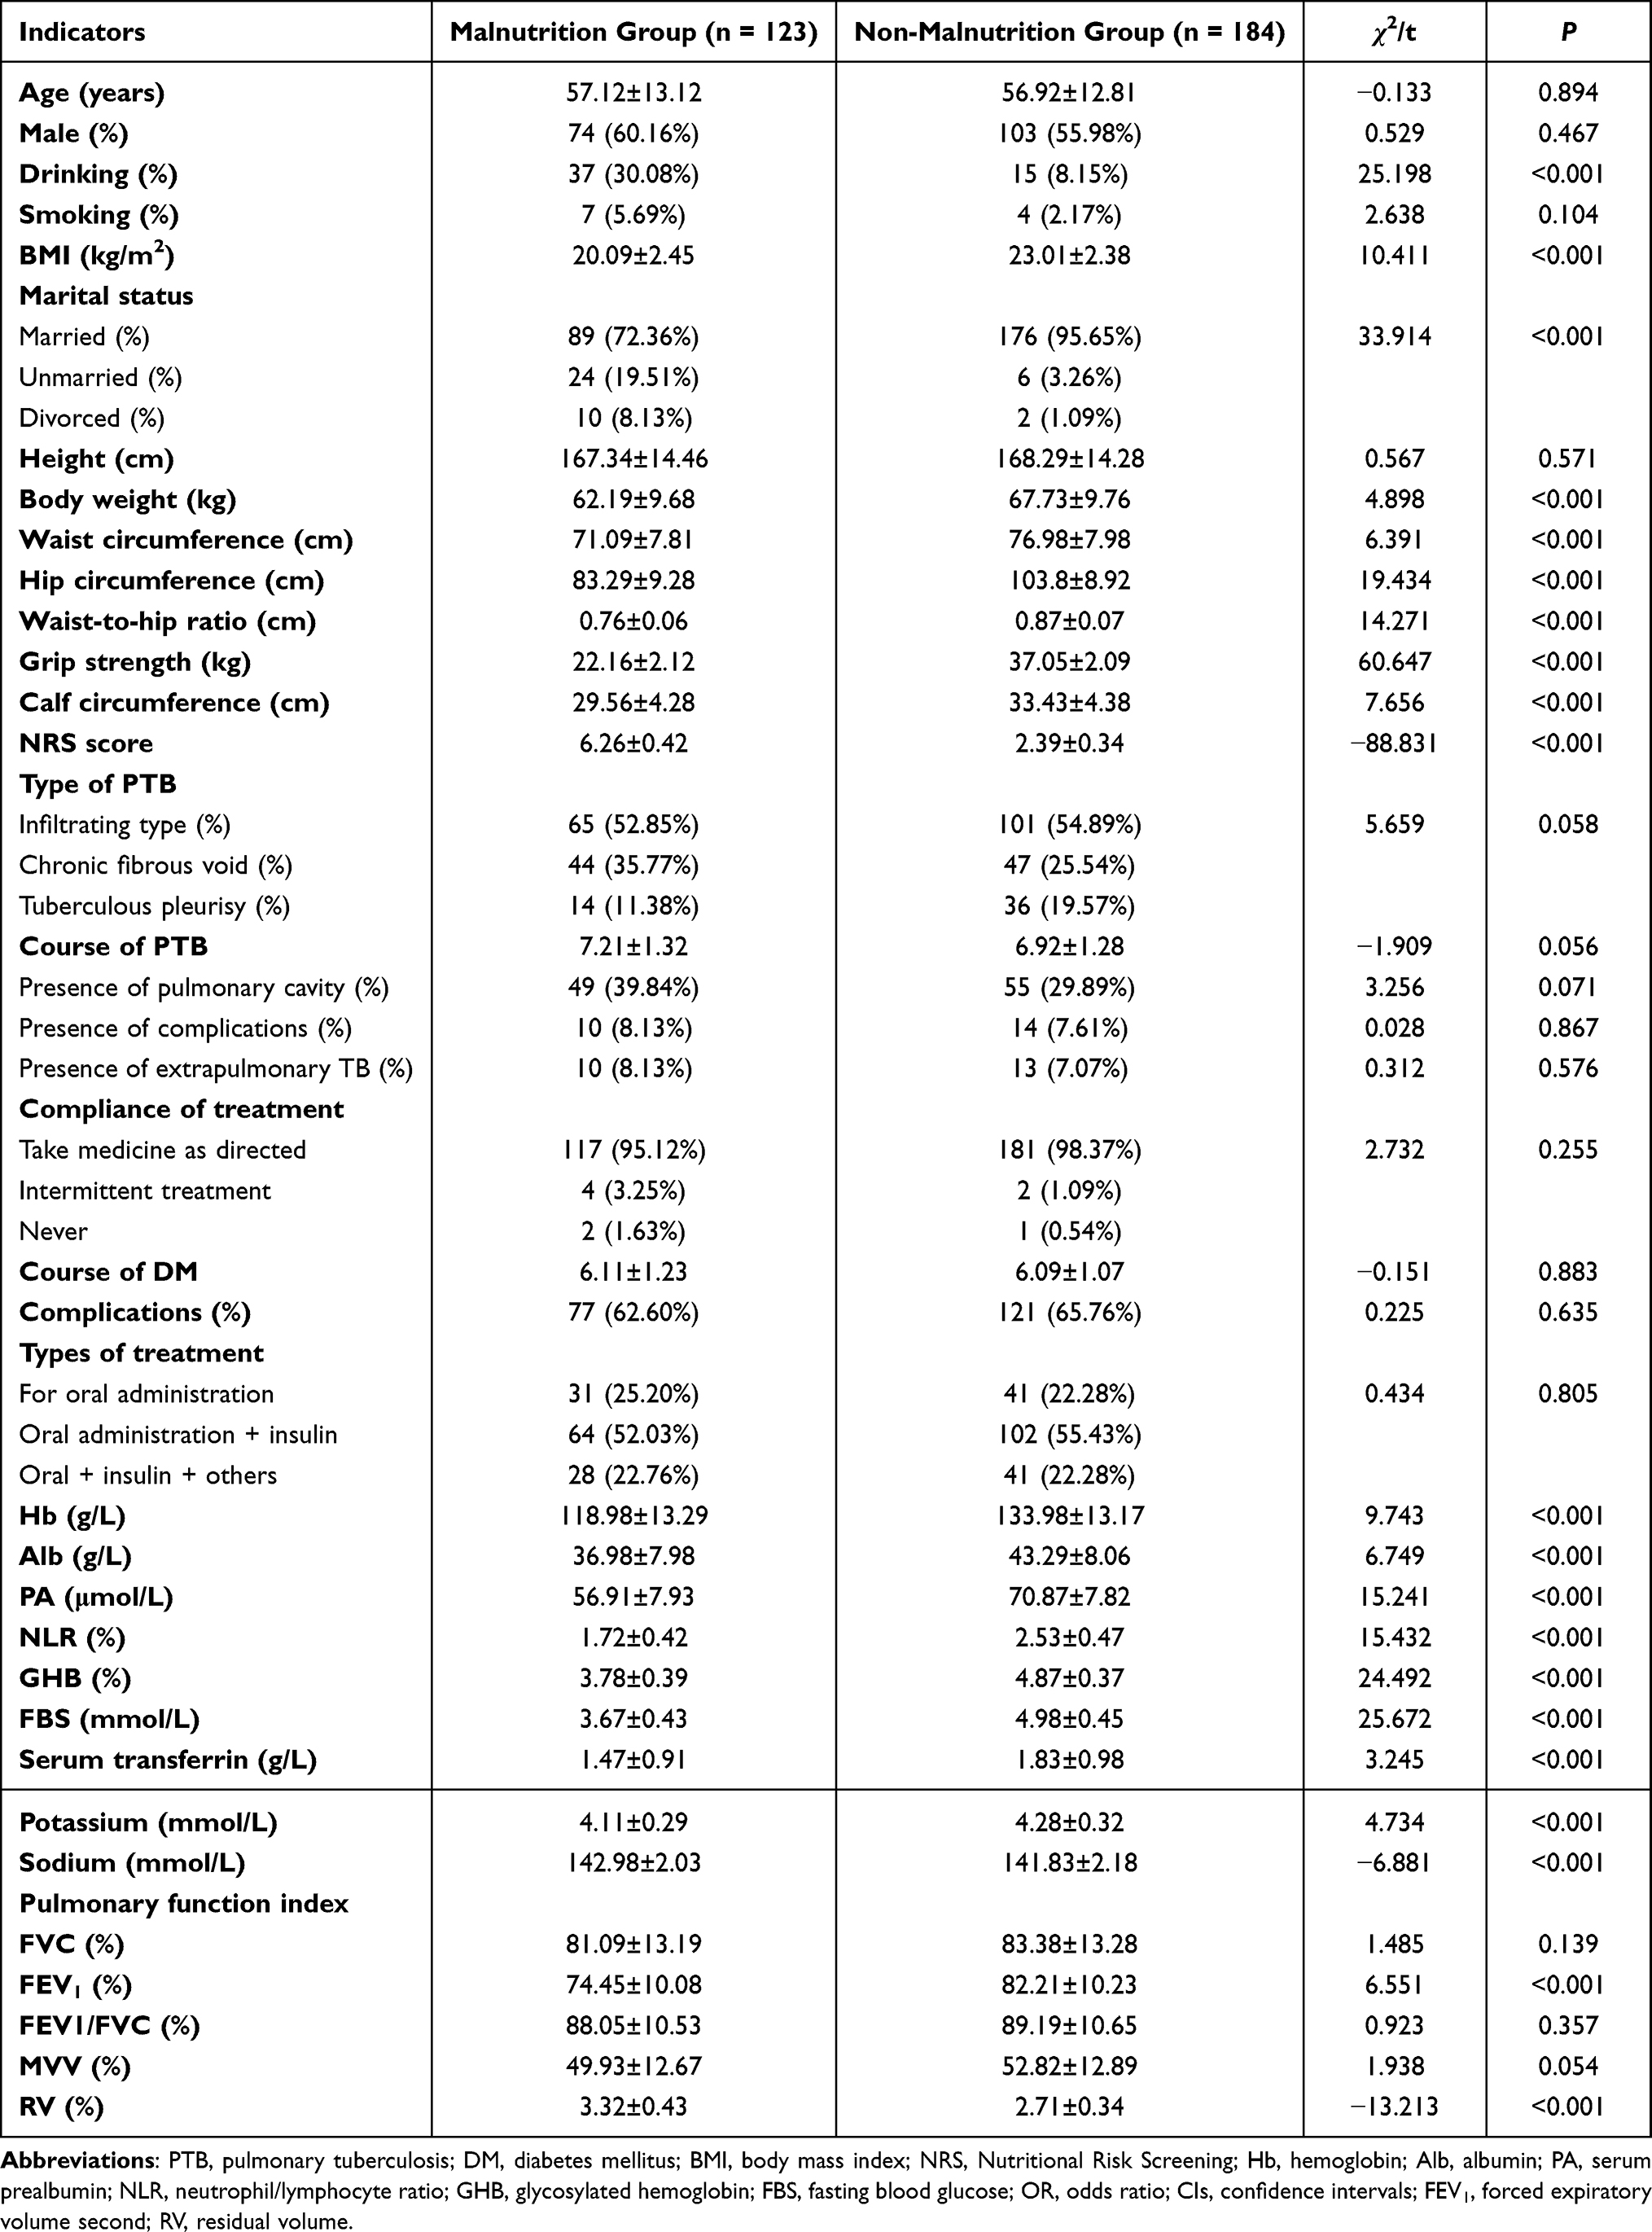 |
Table 1 Results of Univariate Analysis |
Univariate Logistic Regression Analysis of Malnutrition in PTB-T2DM Patients
With indicators of drinking, divorced, weight <45kg, BMI <18.5kg/m2, waist circumference <79cm, hip circumference <88cm, waist-to-hip ratio <69.99, calf circumference <26kg, grip strength <28kg, NRS score ≥3, Hb <106g/L, Alb <29.00g/L, PA <48.00μmol/L, NLR <1.30, GHB <3.40%, FBS <3.24mmol/L, serum transferrin <1.37mmol/L, serum potassium <3.18mmol/L, serum sodium <142.95 mmol/L, FEV1 ≥67.90% and RV <2.89% as the dependent variable and the presence of malnutrition in PTB-T2DM patients as the independent variable, univariate logistic regression analysis was conducted (Table 2). The results showed that drinking (OR = 2.421, 95% CI = 1.501–3.928), divorced (OR = 6.229, 95% CI = 2.098–10.287), BMI <18.5kg/m2 (OR = 3.321, 95% CI = 1.786–5.653), weight <45kg (OR = 1.012, 95% CI = 0.876–1.763), waist circumference <79cm (OR = 5.679, 95% CI = 4.098–11.298), hip circumference <88cm (OR = 2.769, 95% CI = 1.702–4.289), waist-to-hip ratio <69.99 (OR = 3.508, 95% CI = 3.109–4.119), calf circumference <26kg (OR = 3.056, 95% CI = 2.781–3.675), grip strength <28kg (OR = 6.098, 95% CI = 4.719–13.487), NRS score ≥3 (OR = 1.059, 95% CI = 0.873–1.231), Hb <106g/L (OR = 5.219, 95% CI = 2.098–12.136), Alb <29.00g/L (OR = 2.351, 95% CI = 1.542–5.876), PA <48.00μmol/L (OR = 6.932, 95% CI = 2.018–19.876), GHB <3.40% (OR = 3.529, 95% CI = 1.221–5.098), serum transferrin <1.37 mmol/L (OR = 3.207, 95% CI = 1.404–4.893), serum potassium <3.18mmol/L (OR = 1.137, 95% CI = 1.001–1.172), serum sodium <142.95 mmol/L (OR = 1.092, 95% CI = 0.983–1.231), FEV1 ≥67.90% (OR = 1.376, 95% CI = 1.071–1.897) and RV <2.89% (OR = 0.771, 95% CI = 0.683–0.867) were risk factors for malnutrition in PTB-T2DM patients (all P < 0.05).
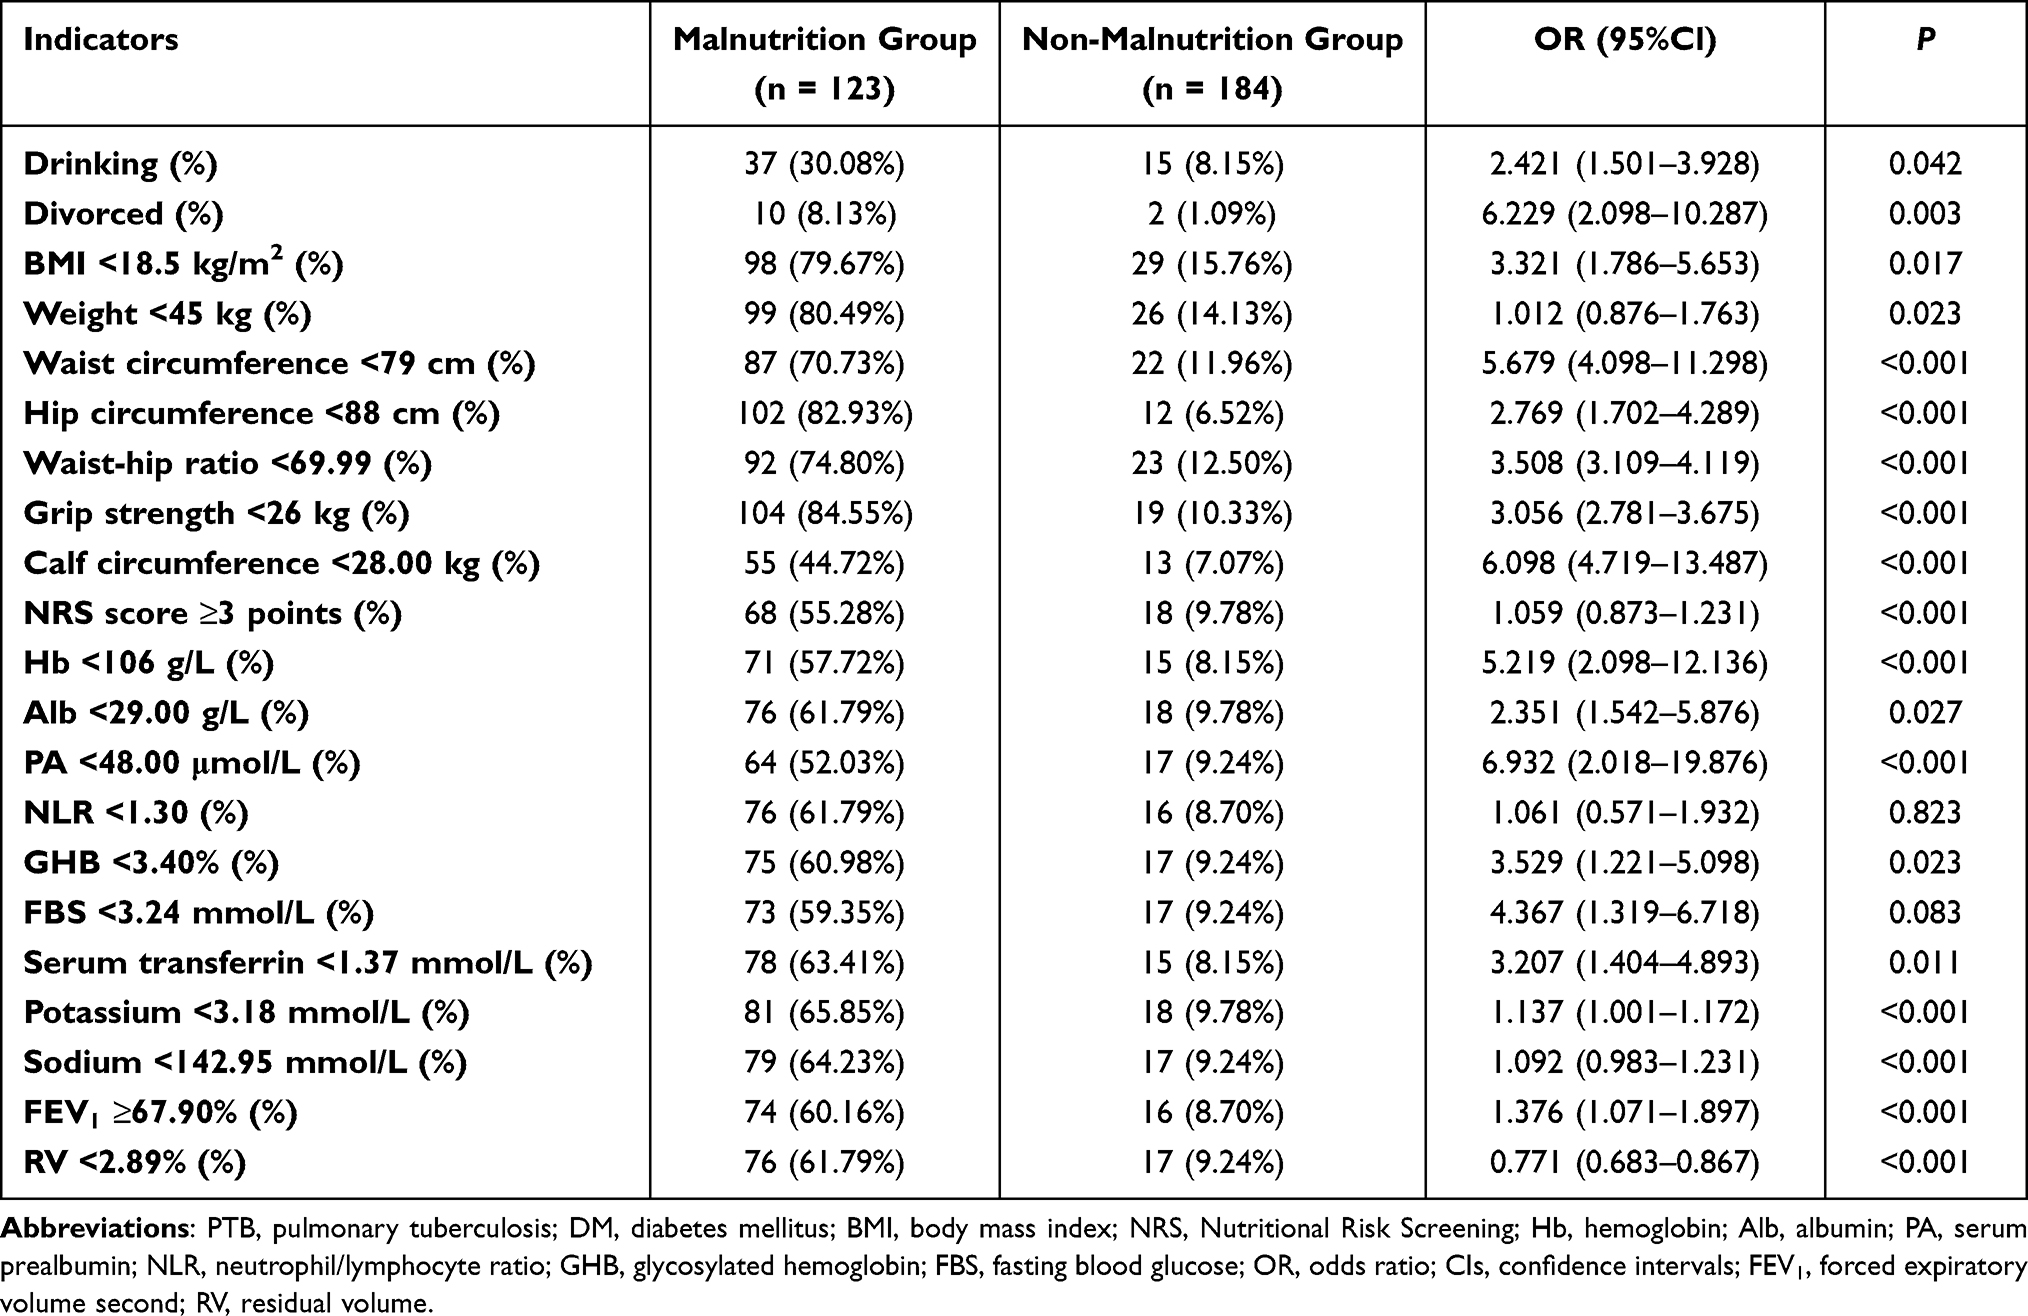 |
Table 2 Univariate Regression Analysis of Malnutrition in PTB-DM Patients |
Multivariate Logistic Regression Analysis of Malnutrition in PTB-T2DM Patients
Multivariate logistic regression analysis was conducted with the independent variables of drinking, divorced, weight <45kg, BMI <18.5kg/m2, waist circumference <79cm, hip circumference <88cm, waist-to-hip ratio <69.99, calf circumference <26kg, grip strength <28kg, NRS score ≥3, Hb <106g/L, Alb <29.00g/L, PA <48.00μmol/L, NLR <1.30, GHB <3.40%, FBS <3.24mmol/L, serum transferrin <1.37mmol/L, serum potassium <3.18mmol/L, serum sodium <142.95 mmol/L, FEV1 ≥67.90% and RV <2.89% (Table 3). The results showed that drinking (OR = 2.367, 95% CI = 1.463–3.672), divorced (OR = 1.572, 95% CI = 1.328–1.983), weight <45kg (OR = 3.187, 95% CI = 2.008–3.861), BMI <18.5kg/m2 (OR = 3.289, 95% CI = 2.172–5.231), NRS score ≥3 (OR = 1.476, 95% CI = 1.201–1.675), Hb <106g/L (OR = 1.982, 95% CI = 0.721–2.342), Alb <29.00g/L (OR = 1.746, 95% CI = 1.028–2.567), PA <48.00μmol/L (OR = 2.112, 95% CI = 1.402–3.098), serum transferrin <1.37mmol/L (OR = 1.621, 95% CI = 1.003–2.212), FEV1 ≥67.90% (OR = 0.989, 95% CI = 0.473–1.336) and RV <2.89% (OR = 2.876, 95% CI = 2.018–3.675) were independent risk factors for malnutrition in PTB-T2DM patients (all P < 0.05).
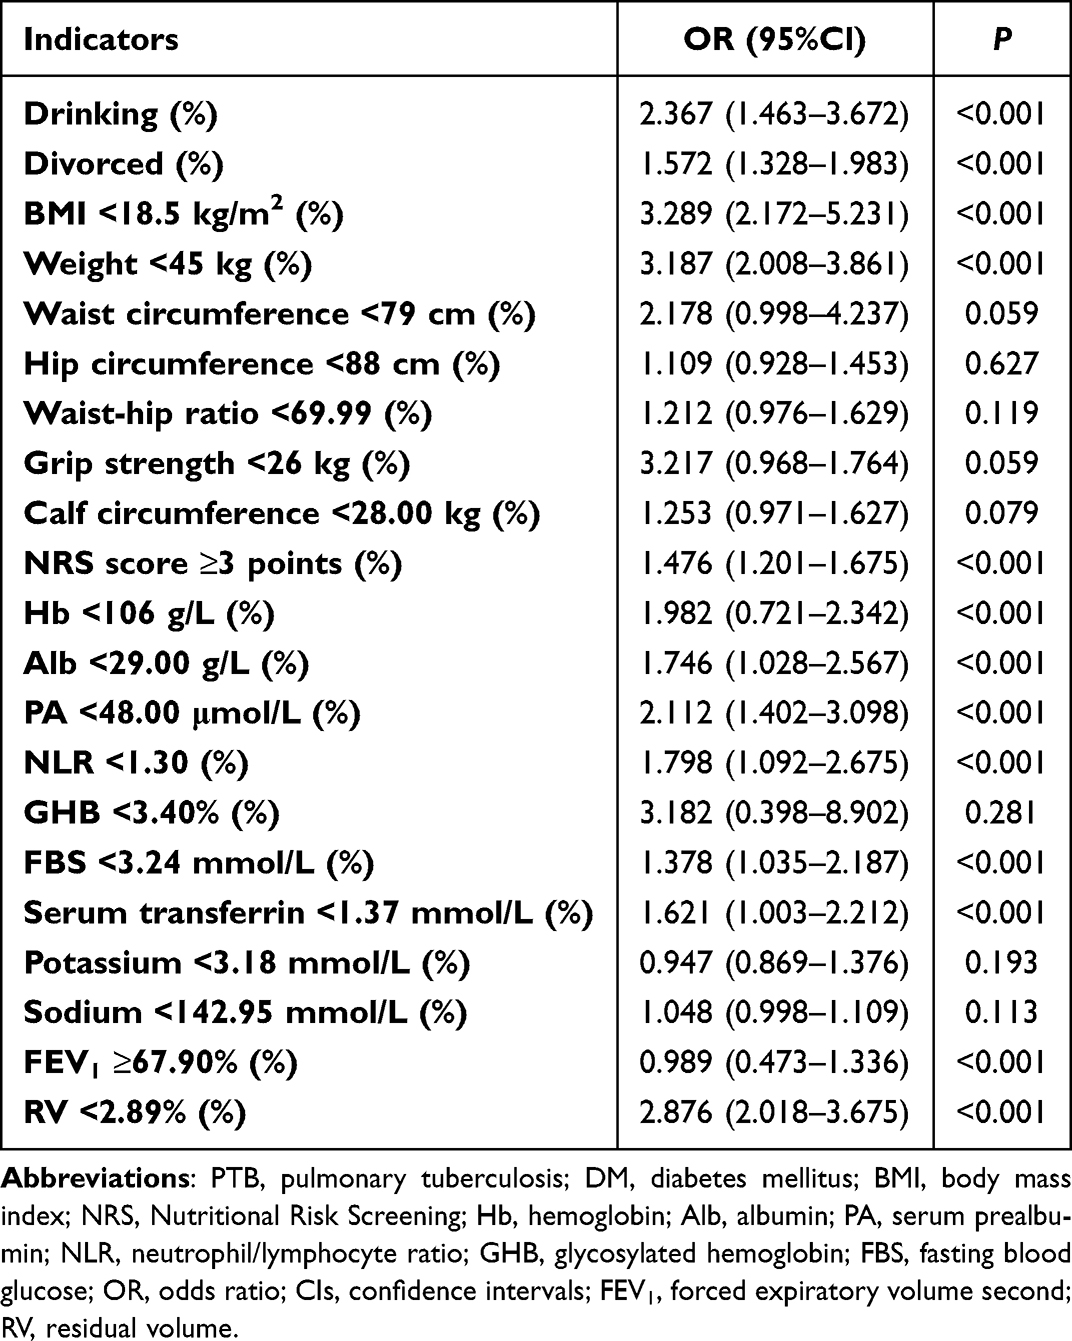 |
Table 3 Multivariate Regression Analysis of Malnutrition in PTB-DM Patients |
Discussion
The clinical symptoms of PTB-T2DM patients often be relieved after systematic in-hospital treatment, but in the process of out-of-hospital self-management, poor self-control ability or lack of disease-related knowledge often led to malnutrition and other states, which seriously threatened the prognosis of patients.18 Previous epidemiological studies have reported a 32.6% incidence of malnutrition in patients with type 2 diabetes and further explored the certainty between MNA scores and clinically common nutritional indicators.19 Another study involving 539 patients with type 2 diabetes showed that 161 (29.87%) were well nourished, 302 (56.03%) were at risk of malnutrition, and 76 (14.10%) were malnourished.20 Liu’s study showed that 69.23% of PTB patients were at risk of malnutrition with an NRS score greater than 3 points,21 it was 62.7% in another study.21,22 In the present study, the incidence of malnutrition in PTB-T2DM patients was 40.07%, which was similar to previous studies.10
The univariate analysis showed that there were significant differences in the indicators of drinking, marital status, BMI, weight, waist circumference, hip circumference, waist-to-hip ratio, calf circumference, grip strength, NRS score, Hb, Alb, PA, NLR, GHB, FBS, serum transferrin, serum sodium, serum potassium, FEV1 and RV between the malnutrition group and non-malnutrition group. The multivariate logistic regression analysis further confirmed that drinking, divorced, weight <45kg, BMI <18.5kg/m2, NRS score ≥3, Hb <106g/L, Alb <29.00g/L, PA <48.00μmol/L, serum transferrin <1.37mmol/L, FEV1 ≥67.90% and RV <2.89% were independent risk factors for malnutrition in PTB-T2DM patients.
Drinking was a key affecting factor for malnutrition in PTB patients, and a risk factor for poor prognosis of PTB.23–25 BMI was one of the important indicators to measure the metabolic balance of the body, and most people with low BMI have poor nutrient absorption function.26,27 Metabolic dysfunction in PTB-T2DM patients may be a significant factor leading to decreased BMI and severe malnutrition. Multidrug-resistant tuberculosis patients with low BMI often had malnutrition.28 Waist circumference, waist-to-hip ratio and BMI were effective tools for assessing the high-risk status of malnutrition.29 Lower leg circumference values can be used in place of BMI for rapid assessment of malnutrition status.30 The MNA score has screening and assessment functions and has been widely popularized in clinical practice, especially for the screening of malnutrition in elderly patients with chronic diseases.31 NRS scores could quickly and easily detect whether patients were combined with malnutrition17 and were more suitable for screening patients with PTB.32,33
Alb was mainly synthesized by the liver and can maintain the normal transmission of nutrients in the blood. The level of this indicator could reflect the level of blood nutrition to a certain extent.34 The levels of hemoglobin, hematocrit and ALB were decreased in PTB patients with malnutrition.35–37 The total content of PA in the body was very small, which can sensitively reflect changes in the body’s nutritional status.38 The PA level of PTB patients was reduced, and the abnormal degree of malnutrition was often more obvious.39 PA and transferrin were influencing factors of senile malnutrition.40 Changes in GHB were not affected by short-term fluctuations in blood glucose levels.41 Transferrin was the main ferric protein in plasma, and the change of its expression level was closely related to the body’s nutritional status.42 GHB and transferrin were closely related to malnutrition in T2DM nephropathy patients undergoing maintenance hemodialysis.43 Decreases in serum potassium and sodium are also factors associated with malnutrition in patients.44 In addition, previous studies have shown that PTB patients have reduced pulmonary function, which is closely related to malnutrition.18
Diet principle of PTB and T2DM existed contradiction. PTB patients need to strengthen their nutrition by increasing their carbohydrate, protein and fat intake without restricting their calorie intake. However, T2DM patients need to strictly control the intake of nutrients due to blood glucose control.45 After reviewing the literature, we concluded that the daily intake of total calories should be increased by 10% compared with that of ordinary diabetic patients, including 300–500 g/d carbohydrate, 1.0–1.5 g/d protein and 1 g/d fat.45 And limit sodium intake to no more than 3g a day. In addition, active supplementation of various vitamins and trace elements can affect the synthesis, secretion, storage and function of insulin, and also played an important role in the metabolism of energy substances, which could improve the nutritional status of patients and reduce the adverse reactions of anti-TB drugs.45
One of the limitations was that the small sample size may weaken the generalisability of the results. Another limitation was that the short follow-up time of 6 months may result in skewed results. In the further study, we will adopt a multicenter randomized controlled study with a larger sample and long-term follow-up to verify the conclusion.
Conclusions
Drinking, divorced, weight <45kg, BMI <18.5kg/m2, NRS score ≥3, Hb <106g/L, Alb <29.00g/L, PA <48.00μmol/L, serum transferrin <1.37mmol/L, FEV1 ≥67.90% and RV <2.89% may be independent risk factors for malnutrition in PTB-T2DM patients, and timely identification of high-risk groups could improve the prognosis of PTB-T2DM patients.
Data Sharing Statement
The datasets generated and analyzed during the current study are available from the corresponding author on reasonable request.
Ethics Approval and Consent to Participate
This study protocol was formulated in accordance with the requirements of the Declaration of Helsinki of the World Medical Association. It was approved by the Ethics Committee of Beijing Geriatric Hospital. Informed consent was obtained from all the study subjects before enrollment.
Funding
No funding was received for this study.
Disclosure
The authors declare that they have no competing interests in this work.
References
1. Refardt J. Diagnosis and differential diagnosis of diabetes insipidus: update. Best Pract Res Clin Endocrinol Metab. 2020;34(5):101398. doi:10.1016/j.beem.2020.101398
2. Wu ZF, Yu YL, Han HM, et al. Correlation between insulin antibody level and urinary albumin/creatinine ratio in patients with type 2 diabetes mellitus. Chin J Diabetes. 2022;30;06:431–435.
3. Natarajan A, Beena PM, Devnikar AV, et al. A systemic review on tuberculosis. Indian J Tuberc. 2020;67(3):295–311. doi:10.1016/j.ijtb.2020.02.005
4. Antonio-Arques V, Franch-Nadal J, Caylà JA. Diabetes and tuberculosis: a syndemic complicated by COVID-19. Med Clin. 2021;157(6):288–293. doi:10.1016/j.medcli.2021.04.004
5. Huahua Z, Qianqian C, Ying L, et al. Research progress of disease attitude of diabetes patients. Gene Nur. 2022;20;17:2331–2334.
6. Ugarte-Gil C, Curisinche M, Herrera-Flores E, et al. Situation of the tuberculosis-diabetes comorbidity in adults in Peru: 2016–2018. Rev Peru Med Exp Salud Publica. 2021;38(2):254–260. doi:10.17843/rpmesp.2021.382.6764
7. Armstrong LR, Kammerer JS, Haddad MB. Diabetes mellitus among adults with tuberculosis in the USA, 2010–2017. BMJ Open Diabetes Res Care. 2020;8(1):e001275. doi:10.1136/bmjdrc-2020-001275
8. Traub J, Reiss L, Aliwa B, et al. Malnutrition in patients with liver cirrhosis. Nutrients. 2021;13(2):540. doi:10.3390/nu13020540
9. Sacerdote A, Dave P, Lokshin V, et al. Type 2 diabetes mellitus, insulin resistance, and vitamin D. Curr Diab Rep. 2019;19(10):101. doi:10.1007/s11892-019-1201-y
10. Zhongfang Y, Feng S. Analysis of nutritional status in patients with pulmonary tuberculosis complicated with diabetes. Chin J Tuberculosis. 2005;27(4):236–238.
11. Kichloo A, Shaka H, El-Amir Z, et al. In-patient outcomes of patients with diabetic ketoacidosis and concurrent protein energy malnutrition: a national database study from 2016 to 2017. Postgrad Med. 2021;133(8):854–859. doi:10.1080/00325481.2021.1916231
12. Ter Beek L, Bolhuis MS, Jager-Wittenaar H, et al. Malnutrition assessment methods in adult patients with tuberculosis: a systematic review. BMJ Open. 2021;11(12):e049777. doi:10.1136/bmjopen-2021-049777
13. Zhao X, Yuan Y, Lin Y, et al. Vitamin D status of tuberculosis patients with diabetes mellitus in different economic areas and associated factors in China. PLoS One. 2018;13(11):e0206372. doi:10.1371/journal.pone.0206372
14. Chinese Diabetes Society, Chinese Medical Association. Chinese guidelines for the prevention and treatment of type 2 diabetes (2020 Edition). Chin J Diabetes. 2021;13(4):315–409.
15. Bureau of Disease Prevention and Control, Ministry of Health, Department of Medical Administration, Chinese Center for Disease Control and Prevention. Technical Specifications for Tuberculosis Prevention and Control in China.
16. Rondanelli M, Faliva MA, Peroni G, et al. A favorable effect on nutritional status of 12-week tailored texture-modified sous-vide cooking meals in institutionalized elderly women with oropharyngeal dysphagia: an intervention study. Minerva Endocrinol. 2021;46(2):202–213. doi:10.23736/S2724-6507.20.03232-0
17. Dahl H, Warz SI, Welland NL, et al. Factors associated with nutritional risk in patients receiving hemodialysis assessed by Nutritional Risk Screening 2002 (NRS2002). J Ren Care. 2022;48(2):112–118. doi:10.1111/jorc.12374
18. Wang Q, Ma A, Schouten EG, et al. A double burden of tuberculosis and diabetes mellitus and the possible role of vitamin D deficiency. Clin Nutr. 2021;40(2):350–357. doi:10.1016/j.clnu.2020.08.040
19. Zeng Y, Gong HF. Nutritional risk survey and influencing factors analysis of type 2 diabetes patients in Qingyang area. Gansu Sci Technol. 2015;37(19):144–147.
20. Zhang XM, Wei L, Lu L. Screening of nutritional status and analysis of malnutrition related factors in patients with type 2 diabetes. J Pract Prevent Med. 2019;28(5):605–607.
21. Liu JY, Qiu TT, Jiang QP, et al. Nutritional status screening analysis of 130 patients with pulmonary tuberculosis. Chin Commun Physic. 2022;38;12:161–163.
22. Danping C, Min LI. Nutritional status evaluation of 134 elderly patients with pulmonary tuberculosis in Shanghai. Occupat Health. 2019;35(5):618–621+625.
23. Yu L, Yongxiu LIU, Ming H, et al. Status and influencing factors of low weight malnutrition in newly treated pulmonary tuberculosis patients in Hetian area. J Pract Prevent Med. 2021;28(9):1076–1079.
24. Silva DR, Muñoz-Torrico M, Duarte R, et al. Risk factors for tuberculosis: diabetes, smoking, alcohol use, and the use of other drugs. J Bras Pneumol. 2018;44(2):145–152. doi:10.1590/s1806-37562017000000443
25. Bhat J, Rao VG, Sharma RK, et al. Investigation of the risk factors for pulmonary tuberculosis: a case–control study among Saharia tribe in Gwalior district, Madhya Pradesh, India. Indian J Med Res. 2017;146(1):97–104. doi:10.4103/ijmr.IJMR_1029_16
26. Yuan L, Shouyong T, Qiongdi CAI, et al. Study on body composition characteristics of pulmonary tuberculosis patients with malnutrition. J Guang Dong Med. 2021;42(4):382–385.
27. Li Z, Chen W, Li H, et al.; Chinese Oncology Nutrition Survey Group. Nutrition support in hospitalized cancer patients with malnutrition in China. Asia Pac J Clin Nutr. 2018;27(6):1216–1224. doi:10.6133/apjcn.201811_27(6).0007
28. Bade AB, Mega TA, Negera GZ. Malnutrition is associated with delayed sputum culture conversion among patients treated for MDR-TB. Infect Drug Resist. 2021;28(14):1659–1667. doi:10.2147/IDR.S293461
29. Xueyin W, Xiaocui L, Jieying L, et al. Nutrition status of retired residents in Guangzhou. Chin J Gerontol. 2015;7:1958–1960.
30. Guiping D, Yan C, Dandan H, et al. Application analysis of nutritional assessment and nursing intervention based on micro nutritional assessment (MNA) in hospitalized elderly patients with chronic diseases.
31. Mengwen Z, Shouyong T, Chunyan L, et al. Evaluation of four nutritional risk screening tools for patients with tuberculosis. Chin J Tuberculosis. 2017;39(6):626–629.
32. Yanrong L, Junhua M, Xinsheng Z, et al. Evaluation of nutritional status in patients with type 2 diabetes mellitus by NRS2002, SGA and MNA-SF. Nurs Res. 2019;33(10):1697–1701.
33. Wang ZY, Zhang NN, Li JC, et al. Serum albumin guided plasmonic nano assemblies with opposite chiralities. Soft Matter. 2021;17(26):6298–6304. doi:10.1039/D1SM00784J
34. Qiaomin J, Jing G, Zhenhui Z. Effects of nutritional support on nutritional status and cellular immune function in patients with pulmonary tuberculosis and malnutrition. Chin Mod Doc. 2021;59(1):31–34.
35. Zhisong W, Huijuan MAO, Nanlan M. Nutritional risk screening and nutritional status evaluation of pulmonary tuberculosis patients with intestinal tuberculosis before and after treatment. J Clin Lung. 2019;24(1):126–129.
36. Jiapeng F. Analysis of nutritional status of patients with pulmonary tuberculosis complicated with diabetes. Mod Hosp. 2017;17(03):415–417.
37. Arbab K, Majid H, Jafri L, et al. Assessing nutritional status of critically ill patients using serum prealbumin levels. J Ayub Med Coll Abbottabad. 2019;31(2):178–181.
38. Mingyue N. Clinical Study of Bone Metabolism and Nutritional Status in Patients with Pulmonary Tuberculosis. Wannan Medical College; 2019.
39. Hong X, Yan J, Xu L, et al. Relationship between nutritional status and frailty in hospitalized older patients. Clin Interv Aging. 2019;10(14):105–111. doi:10.2147/CIA.S189040
40. Zheng Z, Yin Y, Lu R, et al. Lycopene ameliorated oxidative stress and inflammation in type 2 diabetic rats. J Food Sci. 2019;84(5):1194–1200. doi:10.1111/1750-3841.14505
41. Wang W, Huang Y, Lan Y, et al. The application of a structural nutritional care management model in severe acute pancreatitis patients undergoing early enteral nutrition via nasal jejunal nutrition tubes. Am J Transl Res. 2021;13(7):8200–8206.
42. Jiao ZZ. Correlation Between Malnutrition and Lower Extremity Arteriosclerosis in Diabetic Nephropathy Patients Undergoing Maintenance Hemodialysis. Shandong University; 2008.
43. Channa L, Jing L, Zhao L, et al. Investigation of dietary status and analysis of malnutrition related factors in peritoneal dialysis patients. Chin J Nephrol. 2021;10(04):214–219.
44. Liangliang M. Relationship between nutritional status and pulmonary function in diabetic patients with pulmonary tuberculosis. Chin Foreign Med Res. 2020;18(12):180–182.
45. Liu E, Zhou L, Wang L. Comprehensive interpretation of the Classification of Tuberculosis (WS 196-2017). Chinese Journal of Antituberculosis. 2018;40(3):234–238.
 © 2022 The Author(s). This work is published and licensed by Dove Medical Press Limited. The full terms of this license are available at https://www.dovepress.com/terms.php and incorporate the Creative Commons Attribution - Non Commercial (unported, v3.0) License.
By accessing the work you hereby accept the Terms. Non-commercial uses of the work are permitted without any further permission from Dove Medical Press Limited, provided the work is properly attributed. For permission for commercial use of this work, please see paragraphs 4.2 and 5 of our Terms.
© 2022 The Author(s). This work is published and licensed by Dove Medical Press Limited. The full terms of this license are available at https://www.dovepress.com/terms.php and incorporate the Creative Commons Attribution - Non Commercial (unported, v3.0) License.
By accessing the work you hereby accept the Terms. Non-commercial uses of the work are permitted without any further permission from Dove Medical Press Limited, provided the work is properly attributed. For permission for commercial use of this work, please see paragraphs 4.2 and 5 of our Terms.