")
Back to Journals » Diabetes, Metabolic Syndrome and Obesity » Volume 12
Analysis of the diet quality and dietary habits of children and adolescents with type 1 diabetes
Authors Dłużniak-Gołaska K , Panczyk M , Szostak-Węgierek D , Szypowska A , Sińska B
Received 3 September 2018
Accepted for publication 26 November 2018
Published 17 January 2019 Volume 2019:12 Pages 161—170
DOI https://doi.org/10.2147/DMSO.S186237
Checked for plagiarism Yes
Review by Single anonymous peer review
Peer reviewer comments 2
Editor who approved publication: Professor Ming-Hui Zou
Karolina Dłużniak-Gołaska,1 Mariusz Panczyk,2 Dorota Szostak-Węgierek,1 Agnieszka Szypowska,3 Beata Sińska4
1Department of Clinical Dietetics, Faculty of Health Sciences, Medical University of Warsaw, Warsaw, Poland; 2Division of Teaching and Outcomes of Education, Faculty of Health Sciences, Medical University of Warsaw, Warsaw, Poland; 3Department of Pediatrics, The First Faculty of Medicine, Medical University of Warsaw, Warsaw, Poland; 4Department of Human Nutrition, Faculty of Health Sciences, Medical University of Warsaw, Warsaw, Poland
Introduction: The dietary habits of patients with type 1 diabetes are key elements of treatment as they facilitate the normalization of glycemia and maintenance of normal body weight (BW), lipid concentration, and the level of blood pressure. Therefore, the aim of this study was to analyze dietary habits and to verify the influence of the quality of diet on insulin dosage and selected clinical variables.
Materials and methods: The study included 194 subjects (8–18 years old) suffering from type 1 diabetes and treated with the use of insulin pump. A modified KomPAN questionnaire was used to assess dietary habits and the frequency of the consumption of selected products. Two groups of patients were distinguished: G1 (poorer quality of diet) and G2 (better quality of diet). Clinical data were also collected.
Results: Very low scores were noted in the whole study group as regards the index of healthy diet (27.6±11.1, 3.8–61.0). After dividing the participants into groups, it was observed that G1 included more boys (63.8%), and more girls were found in G2 (66.9%). G2 patients chose sweet and salty snacks and fried meals less frequently, and they consumed boiled dishes and avoided sweetening with sugar or honey more frequently. The following characteristics were observed in G1 patients: longer duration of the disease (6.5 vs 5.2 years), higher doses of insulin (0.86 vs 0.76 U/kg of BW/day), and being overweight (31.0% vs 17.6%) and underweight (19.0% vs 8.8%) noted twice more frequently. We did not observe differences concerning the concentration of glycated hemoglobin and lipids in the serum and the values of blood pressure.
Conclusion: The findings revealed unsatisfactory dietary habits in children and adolescents with type 1 diabetes and indicated the necessity to analyze additional factors that might influence the quality of diet of the patients.
Keywords: quality of diet, dietary habits, type 1 diabetes, index of healthy diet, index of unhealthy diet
Introduction
Currently, type 1 diabetes is one of the most common chronic diseases of the developmental age.1 It is an autoimmune disease occurring with the destruction of pancreatic β-cells responsible for insulin production, which leads to chronic hyperglycemia.1,2 In order to maintain normal levels of glycemia in patients with type 1 diabetes, intensive functional insulin therapy is used with numerous subcutaneous injections or continuous subcutaneous insulin infusion with an insulin pump.3 It is worth emphasizing that in spite of substantial progress in treatment and technology, appropriate nutrition plays a key role in the therapy of type 1 diabetes.2,4 Its key elements are the monitoring of carbohydrate consumption in each meal (eg, with carbohydrate exchange [CE]) and adjusting insulin dosage. Nutritional recommendations for patients with type 1 diabetes are based on the rules of healthy nutrition for the general population.5,6 Current recommendations of Polish Diabetes Association (PTD) issued in 2018 include limitation of the consumption of simple carbohydrates, saturated fatty acids, trans fatty acids isomers, and table salt, and increasing the consumption of complex carbohydrates (including dietary fiber) and unsaturated fatty acids.6 It needs to be emphasized that appropriate dietary habits promote the maintenance of normoglycemia and normal body weight (BW), optimal lipid level in the serum, and blood pressure in order to prevent diabetes complications.6,7 Therefore, the aim of this study was to analyze the dietary habits in children and adolescents with type 1 diabetes and to verify the influence of the quality of diet on insulin dosage and selected clinical variables.
Materials and methods
Materials
The study included 194 patients (112 girls and 82 boys) aged 8–18 years, hospitalized at the Teaching Department of Pediatric Diabetology and Pediatrics of the Independent Public Children’s Teaching Hospital in Warsaw (convenience sampling). A diagnosis of type 1 diabetes at least 1 year prior to the study and treatment with the use of insulin pump were the criteria for inclusion. Patients with a different type of diabetes or concomitant chronic diseases requiring dietary modifications (eg, celiac disease), the duration of the disease <1 year, or treated with insulin pen injections were excluded from the study. The study was conducted between October 2017 and June 2018.
Data were collected on paper by a trained interviewer during an individual interview with study participants (Paper and Pen Personal Interview). In case of children younger than 12 years, the interview was conducted with the parent or legal guardian present. The data were encoded to provide participant anonymity.
Ethics statement
The noninterventional study design was presented to the Bioethics Committee of the Medical University of Warsaw and accepted without reservations (statement no. AKBE/188/17 dated October 10, 2017).
Prior to the study, all the patients expressed oral consent to participate in the study. Each participant was individually informed about the aim and course of the study. Moreover, the participants were informed about anonymity regarding the use of data collected and results obtained and the possibility of resigning at any moment. In case of children younger than 16 years, the oral consent was also given by the parent or legal guardian. The Bioethics Committee of the Medical University of Warsaw approved all assumptions of the study.
Methods
In order to investigate dietary habits and the quality of diet of children and adolescents with type 1 diabetes, we used a modified version of KomPAN questionnaire developed by Behavioral Conditions of Nutrition Team and designed for assessing dietary habits and nutritional beliefs.8
Original KomPAN questionnaire includes 111 questions with one possible answer divided into four parts concerning A) dietary habits, B) frequency of consumption, C) beliefs about food and nutrition, and D) lifestyle and personal data. Qualitative and quantitative modifications introduced into KomPAN questionnaire were the basis for the development of the present author’s questionnaire, which was used in the study. Parts C and D were removed, which reduced the total number of questions by half. Moreover, the questions referring to the consumption of products significant in the diet of patients with type 1 diabetes were stated more precisely (eg, two separate questions were added which concerned the consumption of natural and flavored milk products). Additionally, questions designed specifically for adults (eg, concerning the consumption of alcoholic drinks) were removed.
The modified questionnaire used in the study consisted of two parts and demographic data section. Part I (dietary habits) included eleven multiple choice questions (single or multiple answer), referring to the regularity of meal consumption, eating snacks, and sweetening. Part II (the frequency of consumption of selected products) included 42 single-answer questions with the answers presented on a 6-grade scale (1= never, 2= one to three times a month, 3= once a week, 4= several times a week, 5= once daily, 6= several times a day). Demographic data section included questions about sociodemographic issues and information about the disease, anthropometric and biochemical data, and blood pressure values that were completed on the basis of patients’ medical records.
The first part of the questionnaire was used to verify dietary habits of the patients in terms of the regularity of meals consumed, eating snacks, type of thermal processing, sweetening beverages, or ready-made meals.
Two indices comprising products (or groups of products) that were potentially recommended or nonrecommended for patients with type 1 diabetes (Table 1) were developed on the basis of the second part of the questionnaire for comprehensive assessment of the quality of diet. The classification of products into “healthy” and “unhealthy” was done on the basis of current recommendations of PTD.6 According to the procedure proposed by the authors of KomPAN questionnaire, raw scores were converted into real numbers and expressed as times/day (1=0, 2=0.06, 3=0.14, 4=0.5, 5=1, 6=2). Each patient had the indices calculated by adding the frequency of consumption (times/day) of selected 11 (“index of healthy diet”) and 15 (“index of unhealthy diet”) components. Subsequently, in order to standardize the ranges of the indices, we calculated total frequencies of consumption according to the following formulae: “index of healthy diet” = (100/20) × total frequency of consumption of its eleven components (times/day) and “index of unhealthy diet” = (100/28) × total frequency of consumption of its 15 components (times/day). Therefore, index values might be expressed on the scale from 0 to 100 points. Higher values indicated higher intensity of the consumption of healthy or unhealthy products.
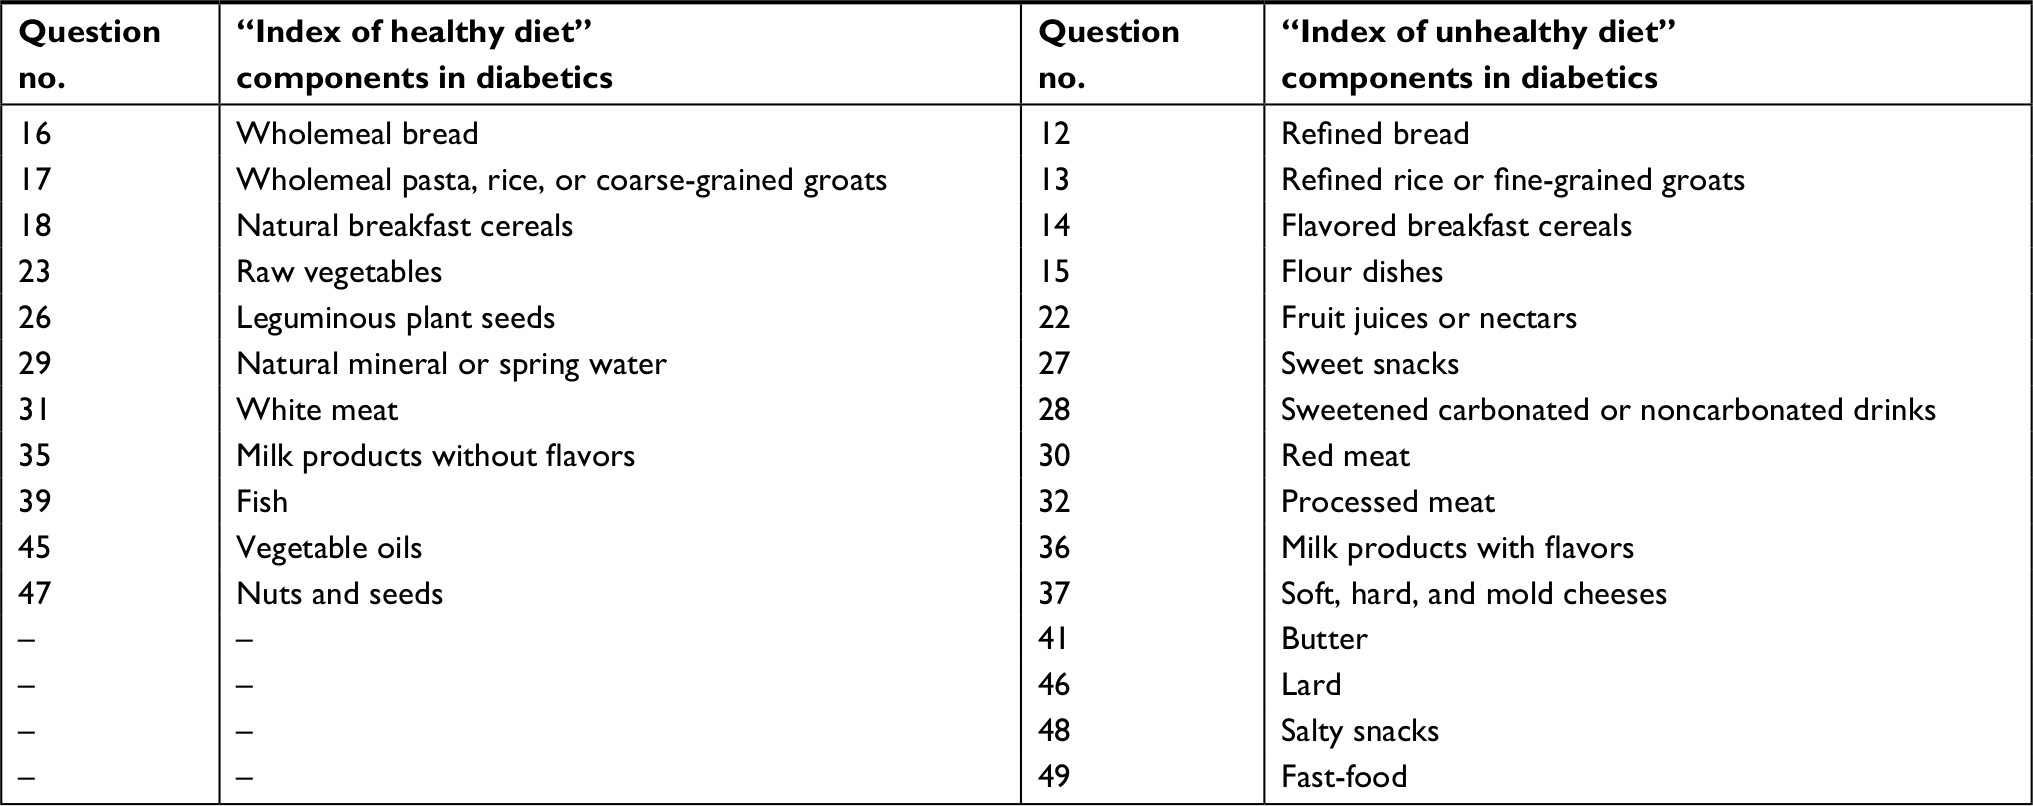 | Table 1 Components of indices of the quality of diet of patients with type 1 diabetes |
Based on anthropometric data, body mass index (BMI) was calculated for each patient according to the formula: BMI = BW (kg)/height2 (m2). Next, the obtained values were interpreted with growth charts for BMI for girls and boys in Polish population aged 3–18 years according to ranges specified by the authors.9 Moreover, the value of waist to height ratio (WHtR) was calculated for each patient expressed as the waist (cm) to height (cm) ratio. This index has a universal cutoff point (0.5) above which an increased metabolic risk is identified regardless of gender, age, and ethnicity.10
Based on the biochemical data, the occurrence of lipid disorders was assessed in each patient. Abnormal values were identified with the concentration of total cholesterol ≥200 mg/dL, LDL cholesterol ≥100 mg/dL, HDL cholesterol ≤40 mg/dL, and triglycerides ≥150 mg/dL.11 Dyslipidemia was diagnosed when at least one of the above four criteria was met. Metabolic control was also assessed in each patient based on the concentration of glycated hemoglobin (HbA1C). HbA1C ≥7.5% was assumed to be abnormal value.11 Moreover, the values of blood pressure were interpreted with growth charts for girls and boys aged 7–18 years in the Polish population.12 Systolic and/or diastolic pressure at ≥95th centile for the age, gender, and height was assumed to be abnormal.11
Statistical analyses
During the first stage, data clustering with k-means method was used to distinguish groups of patients varying in terms of diet. Selecting and distinguishing groups of similar objects in two clusters were performed in the course of the analysis. Nonhierarchical clustering algorithm was implemented on the basis of the values calculated for two indices: healthy and unhealthy diet in diabetic patients. Two groups of patients were distinguished: G1 (poorer quality of diet) and G2 (better quality of diet).
Nonparametric tests were used to compare both groups during the second stage of the analysis. Depending on the type of variables, Fisher-Freeman-Halton exact test or a two-sided Fisher’s exact test and the Mann–Whitney U test were performed.
During the third stage, the influence of selected metric variables (duration of the disease, CEs/kg BW/day, insulin dose U/kg BW/day, HbA1C levels) was estimated in relation to the ability to differentiate both patient groups. We used receiver operating characteristic (ROC) curve analysis and statistics modification proposed by Hanley and Hajian-Tilaki to compare area under the curve (AUC).13 Youden’s index was determined in order to assess the prognostic ability of the measurement and the statistical cutoff point.14
All calculations were performed with STATISTICA™ 13.1 PL software (Dell, Inc.). The level of statistical significance was assumed at 0.05.
Results
The average score noted in the whole study group as regards the index of healthy diet was 27.6±11.1 (3.8–61.0). As regards the index of unhealthy diet, the average score obtained by all the patients was 22.4±11.1 (1.8–66.3). The participants were divided into two groups: G1 (n=58) characterized by poorer quality of diet and G2 (n=136) with better quality of diet.
G1 and G2 group profiles
No significant intergroup disproportions were noted as regards the age and place of residence. However, it was observed that boys constituted the majority of G1 group and girls, the majority of G2 (P<0.001). Moreover, the disease had lasted for much longer in G1 patients (P=0.011) compared with G2 patients (Table 2).
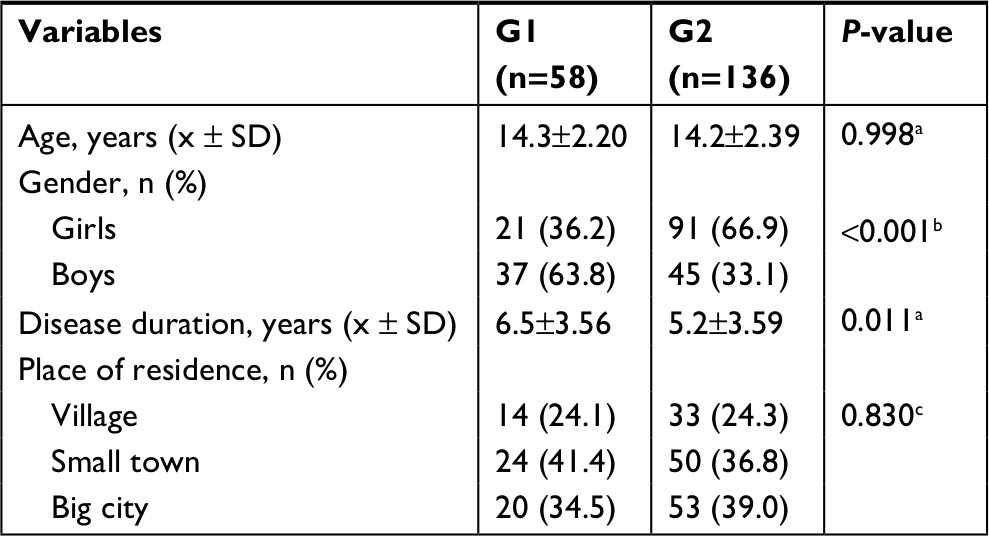 | Table 2 G1and G2 group profiles Notes: aThe Mann–Whitney U test, bFisher’s exact test, cFisher-Freeman-Halton exact test. G1, poorer quality of diet; G2, better quality of diet. Abbreviations: P, statistical significance level; x, mean. |
Analysis of dietary habits in G1 and G2 groups
Statistically significant intergroup differences were noted as regards dietary habits concerning the regularity of consuming individual meals. It was reported that the chance of daily consumption of second dinner was lower by 67% in group G2 (OR =0.33, P=0.002) (Table 3).
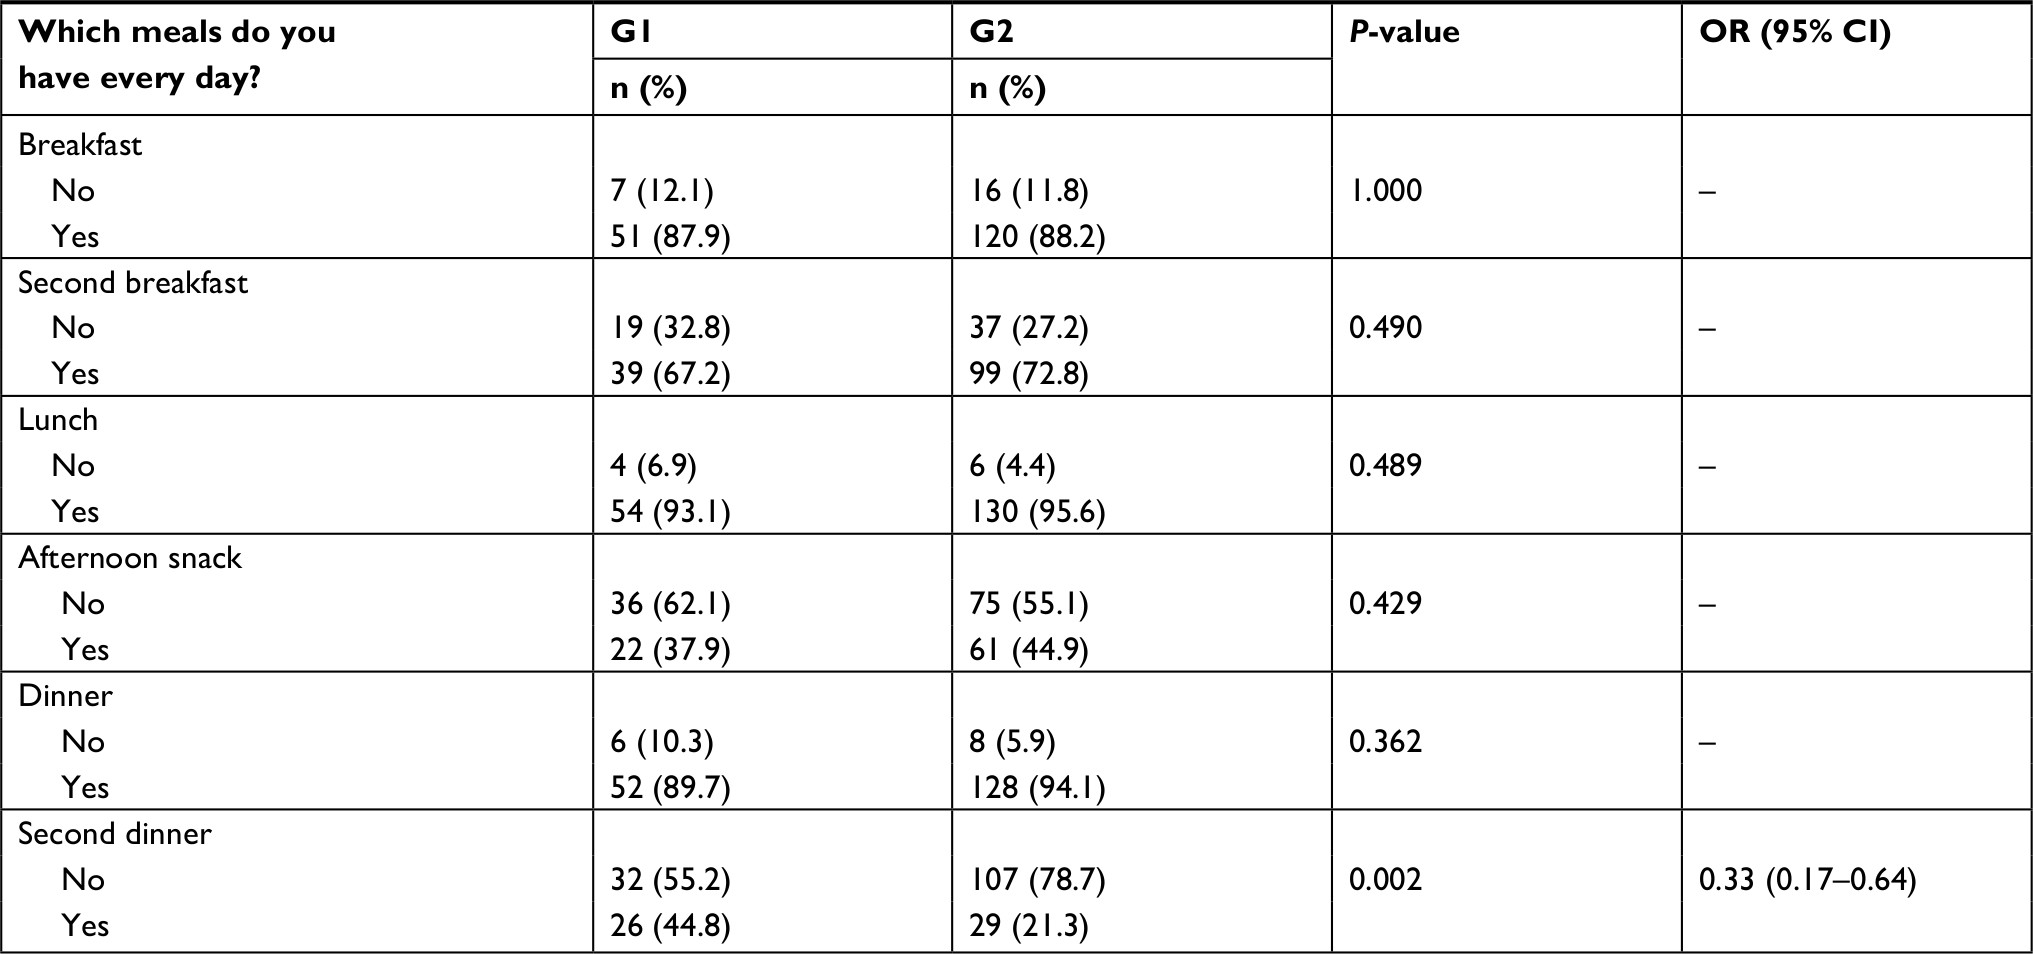 | Table 3 The regularity of consuming meals in groups G1 and G2 Notes: Fisher’s exact test. G1, poorer quality of diet; G2, better quality of diet. Abbreviation: P, statistical significance. |
Statistically significant discrepancies were also observed as regards eating between meals. It was reported that the chance of frequent consumption of sweet snacks was lower by 57% (OR =0.43, P=0.012) and the chance of regular consumption of salty snacks was lower by 62% (OR =0.38, P=0.004) in G2 patients (Table 4).
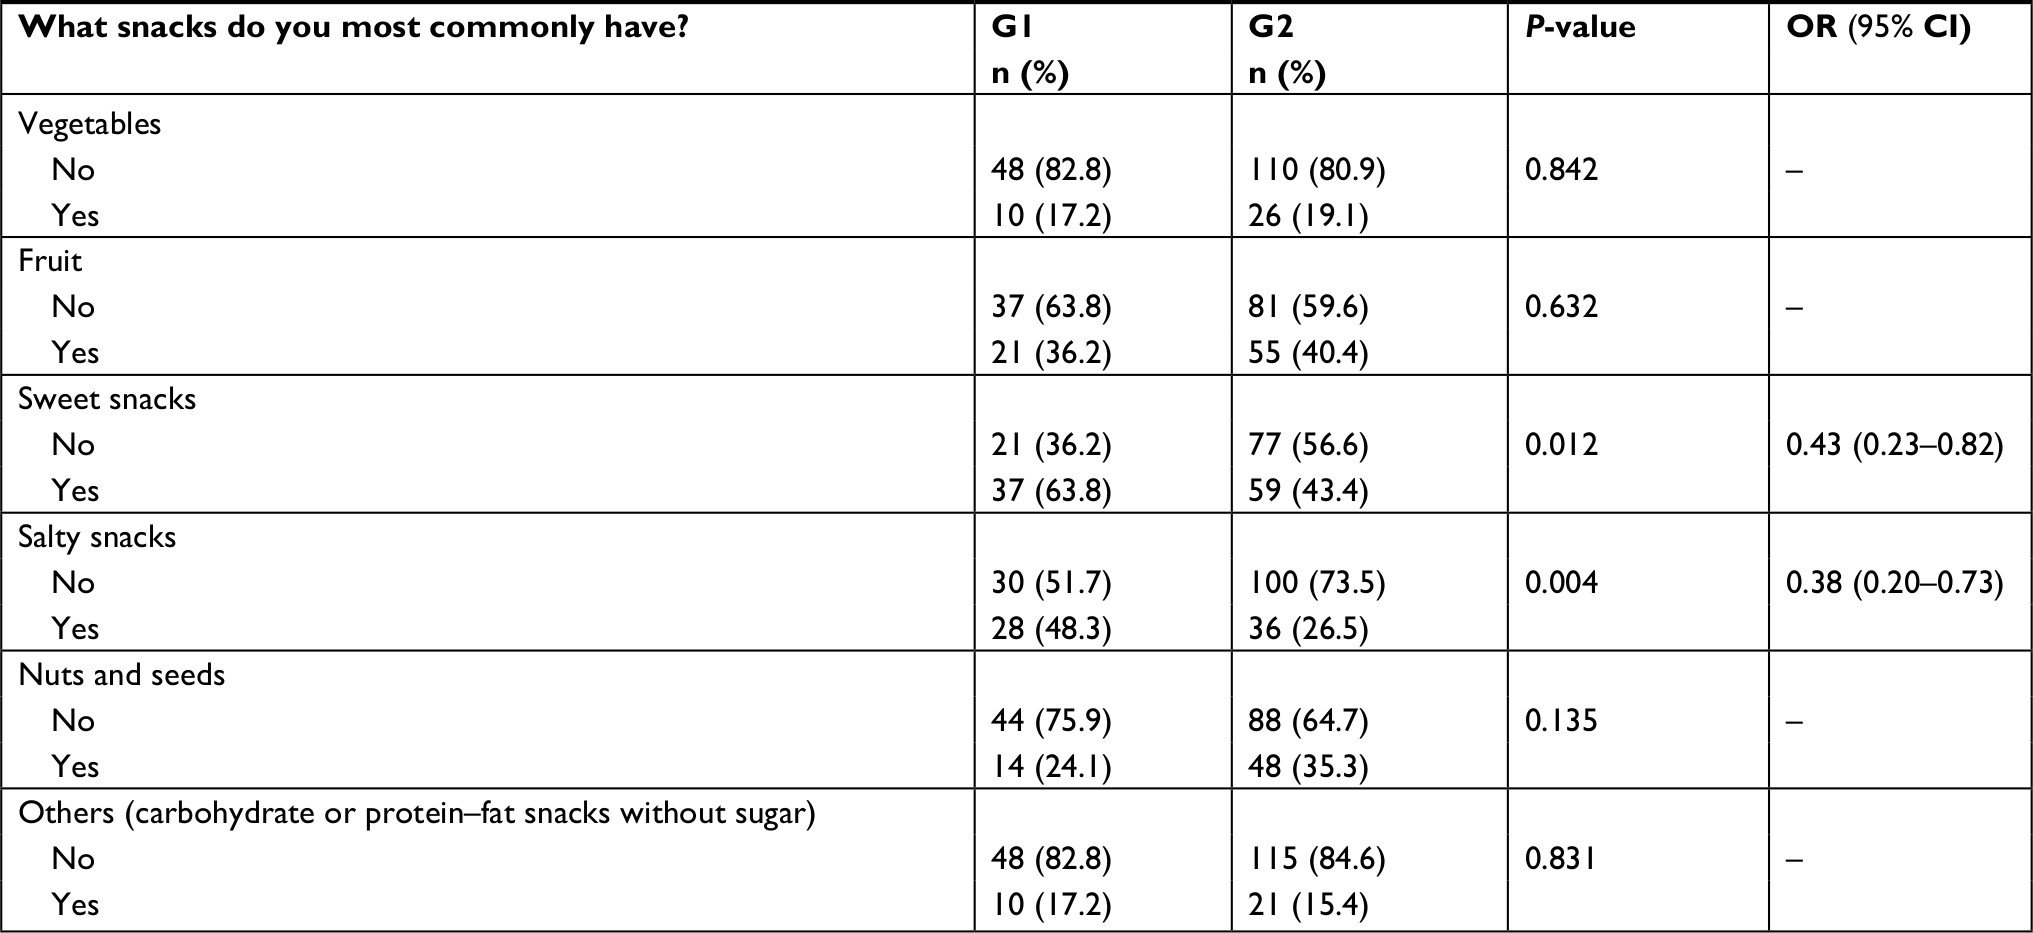 | Table 4 Snacks consumed most commonly in groups G1 and G2 Notes: Fisher’s exact test. G1, poorer quality of diet; G2, better quality of diet. Abbreviation: P, statistical significance. |
Significant differences were also noted as regards the method of thermal processing. The chance of frequent consumption of fried dishes was lower by 63% (OR =0.37, P=0.008) and the chance of regular consumption of boiled or steamed dishes was twofold higher (OR =2.42, P=0.007) in G2 (Table 5).
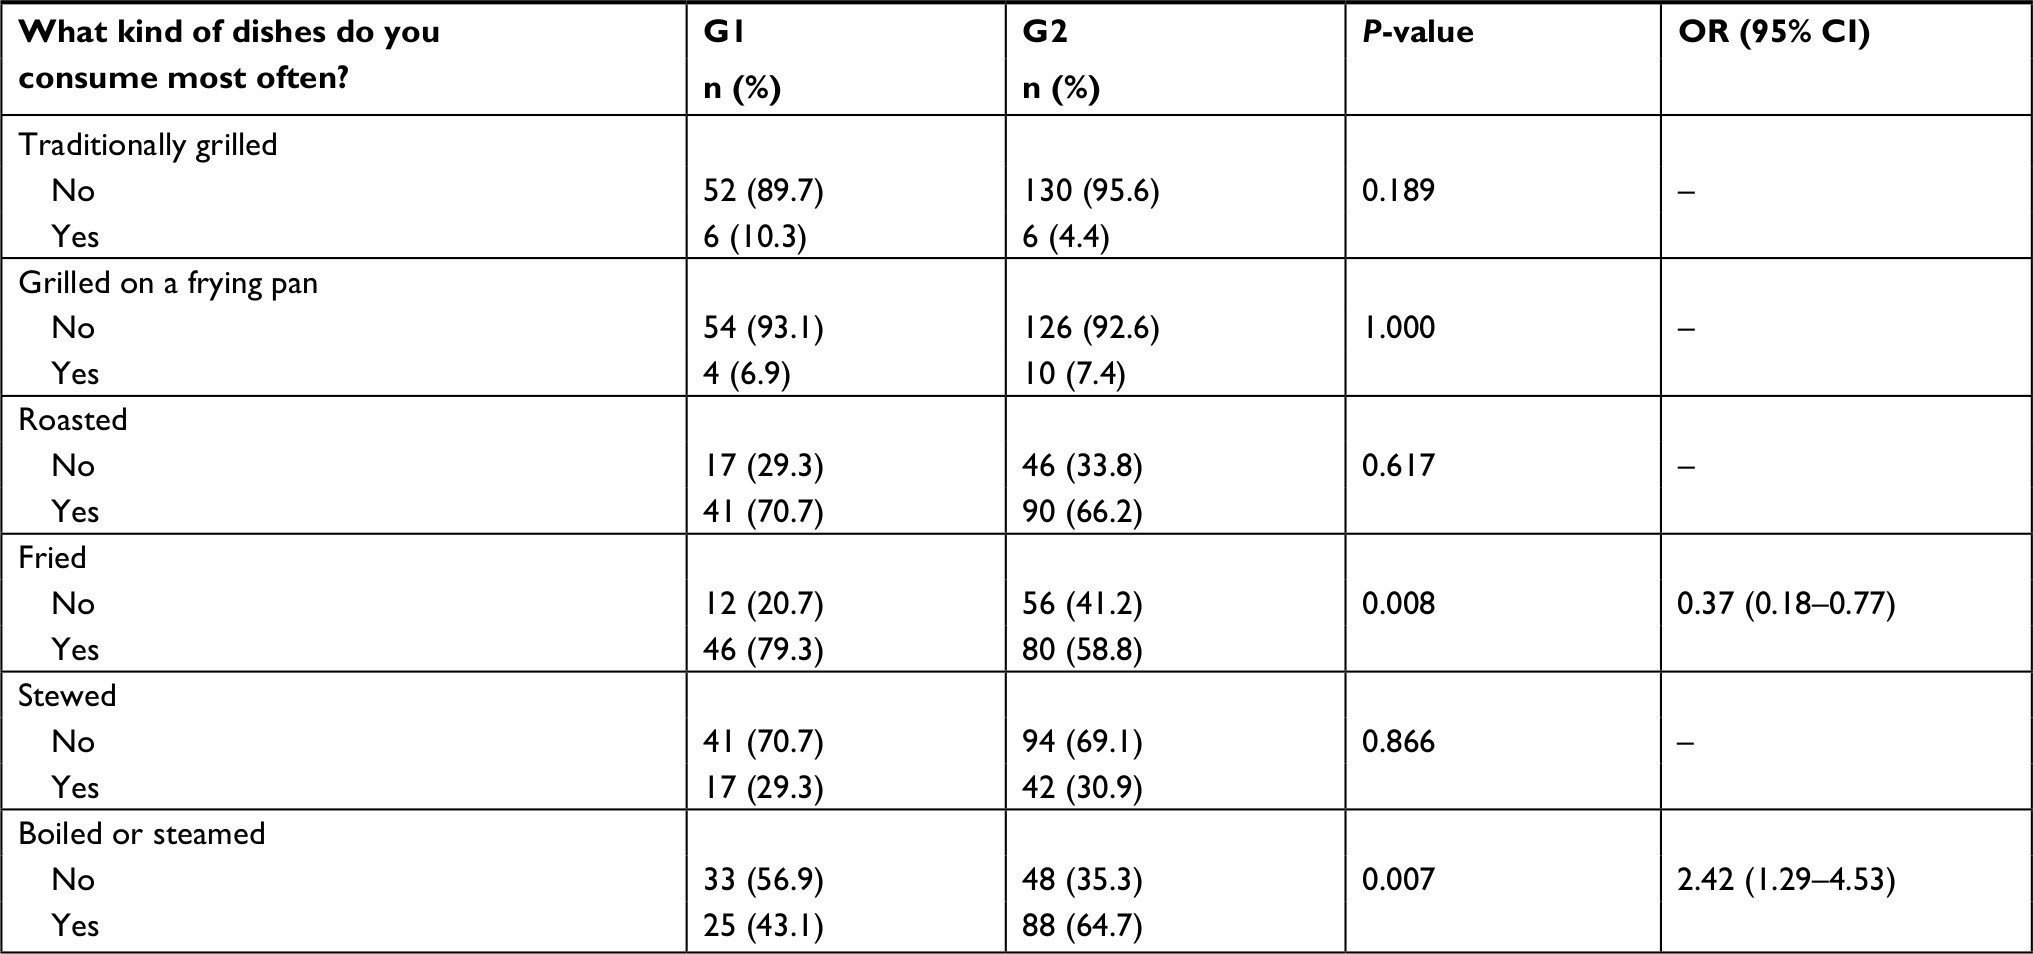 | Table 5 Most commonly selected method of thermal processing in groups G1 and G2 Notes: Fisher’s exact test. G1, poorer quality of diet; G2, better quality of diet. Abbreviation: P, statistical significance. |
Moreover, statistically significant differences (P=0.006) were also observed for dietary habits concerning sweetening beverages or ready-made dishes with sugar or honey (Table 6).
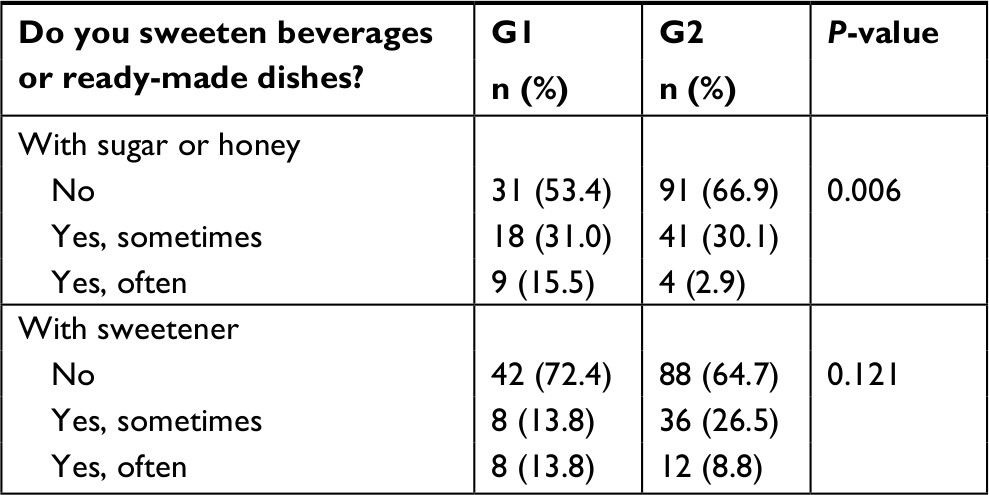 | Table 6 Comparison of sweetening beverages or ready-made dishes in groups G1 and G2 Notes: Fisher-Freeman-Halton exact text. G1, poorer quality of diet; G2, better quality of diet. Abbreviation: P, statistical significance level. |
Comparison of the consumption of CEs and clinical variables in groups G1 and G2
We did not find any significant disproportions between groups as regards daily consumption of CEs and also biochemical parameters and values of blood pressure. However, it was observed that G1 patients used significantly higher doses of insulin (P=0.021). Furthermore, it was demonstrated that both groups significantly differed in terms of abnormal values of BMI (P=0.016). Similar discrepancies were not reported in case of WHtR (Table 7).
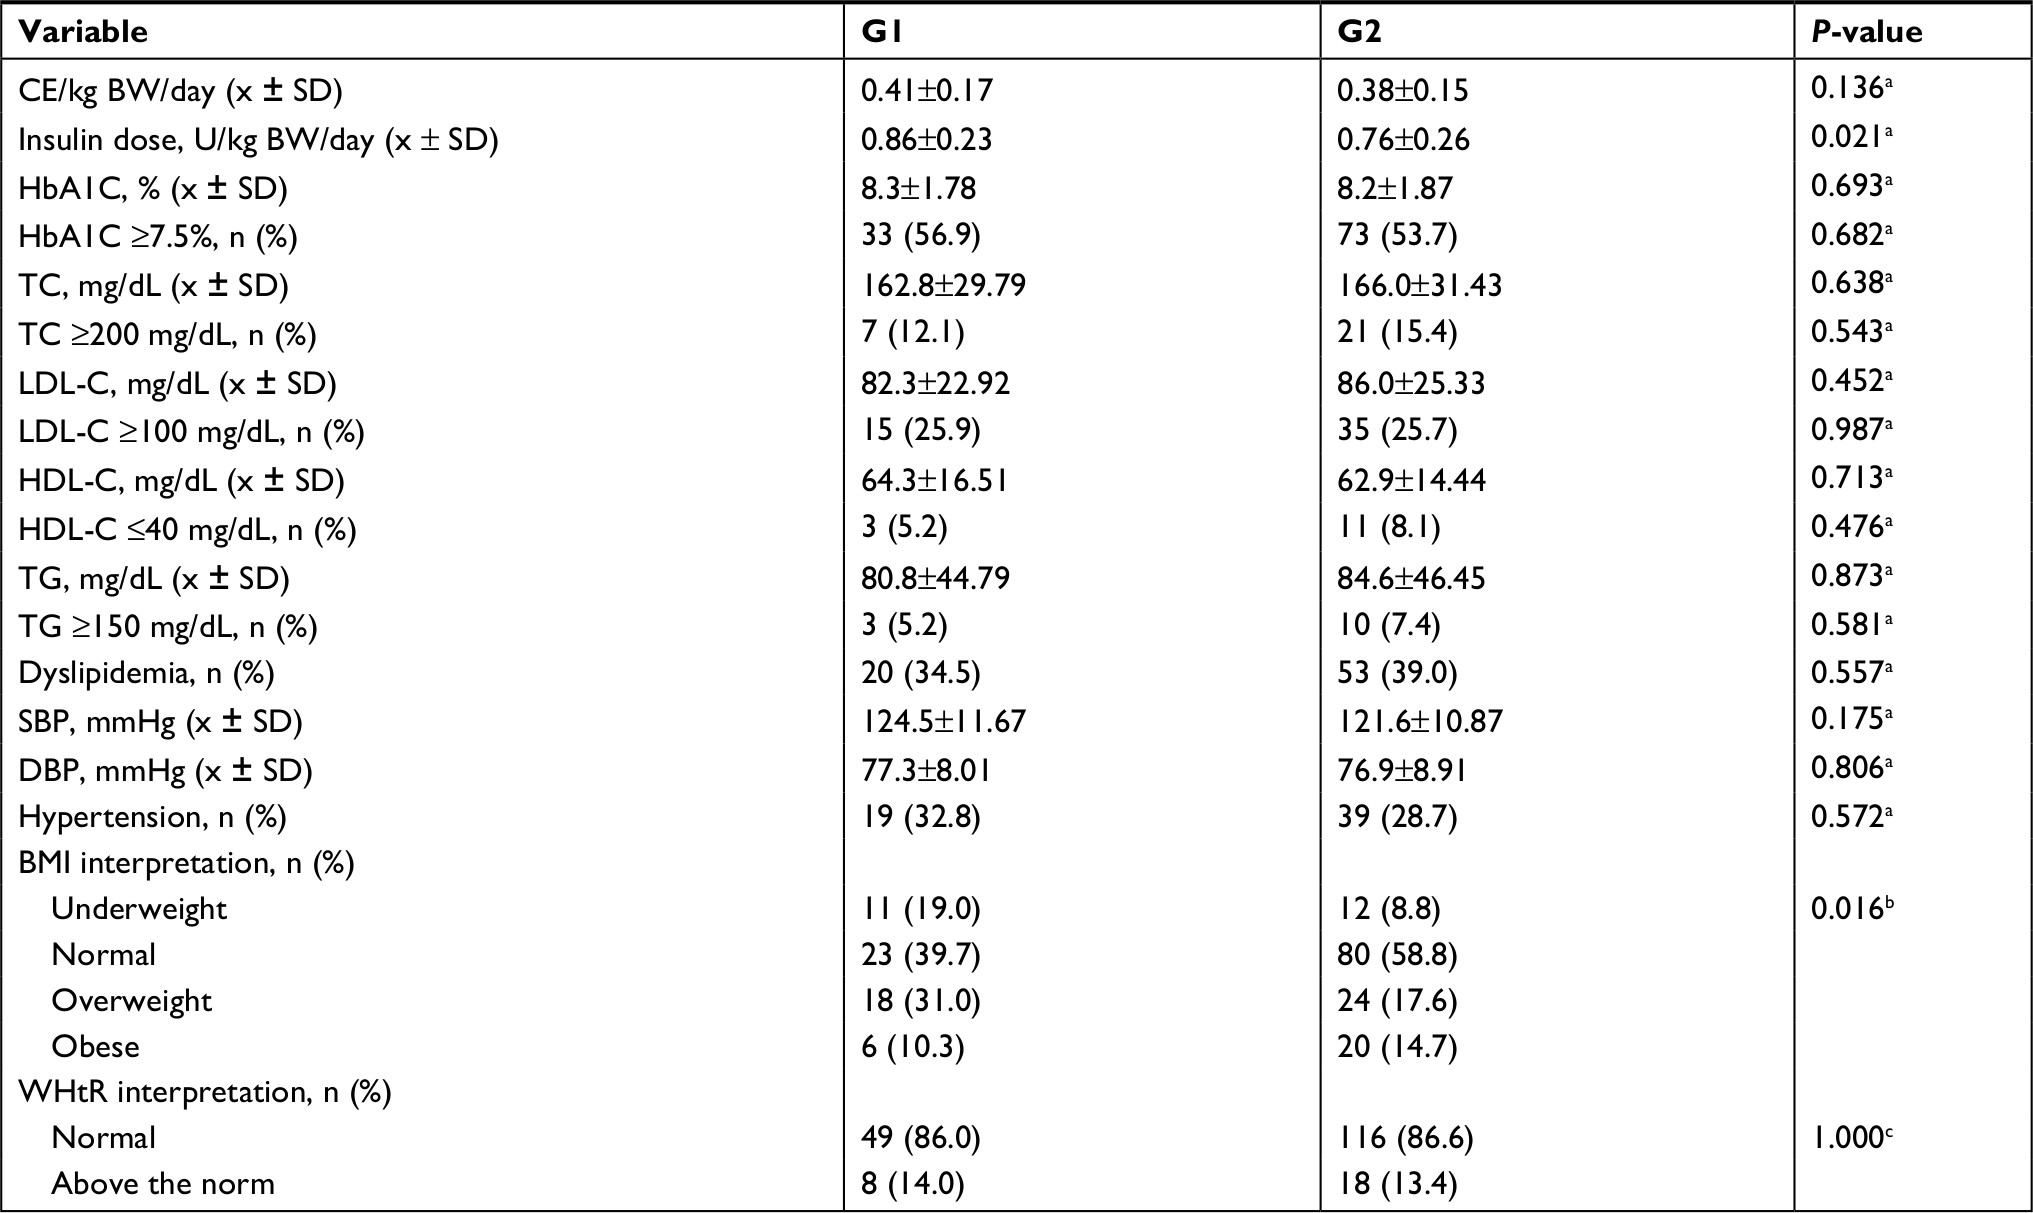 | Table 7 Comparison of daily consumption of CEs, insulin dosage, and clinical variables in groups G1 and G2 Notes: aThe Mann–Whitney U test, bFisher-Freeman-Halton exact test, cFisher’s exact test. G1, poorer quality of diet; G2, better quality of diet. Abbreviations: BMI, body mass index; BW, body weight; CE, carbohydrate exchange; HbA1C, glycated hemoglobin; HDL-C, high-density lipoprotein cholesterol; LDL-C, low-density lipoprotein cholesterol; TC, total cholesterol; TG, triglycerides; WHtR, waist to height ratio; x, mean. |
Analysis of ROC curves
The analysis also included ROC curves of selected variables, which potentially differed in G1 and G2 patients (Table 8). Statistically significant values were noted for the duration of the disease (AUC =0.615 [95% CI: 0.528–0.703], P=0.009) and daily insulin dose (AUC =0.612 [95% CI: 0.520–0.703], P=0.016).
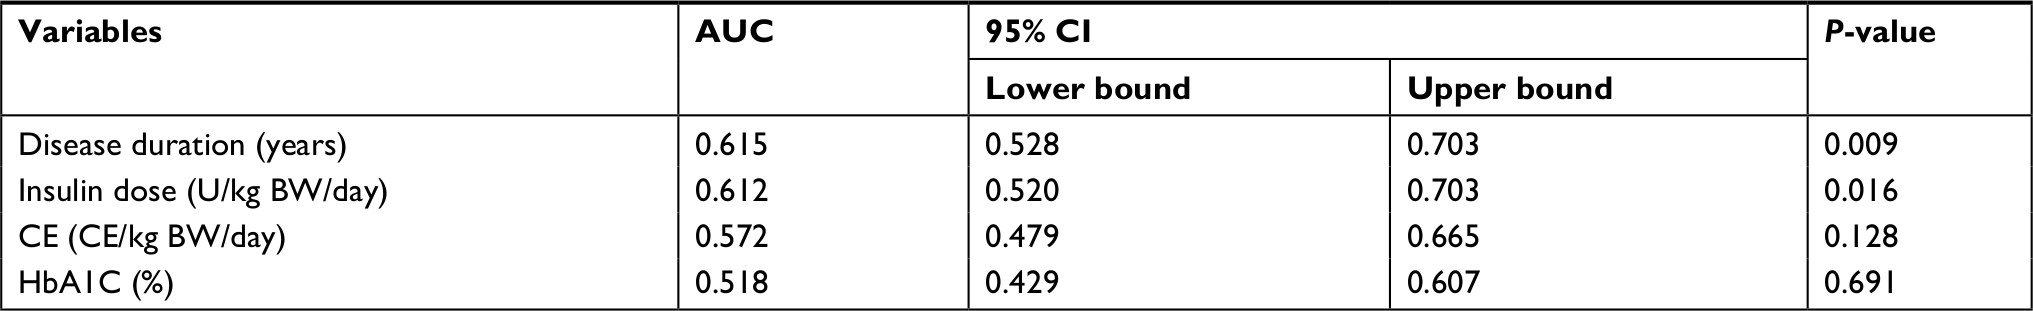 | Table 8 Analysis of ROC curves of selected diagnostic factors Abbreviations: AUC, area under the curve; BW, body weight; CE, carbohydrate exchange; HbA1C, glycated hemoglobin; ROC, receiver operating characteristics. |
Based on the ROC curve for disease duration, Youden’s index (J=0.22) and the proposed cutoff point at 5 years were determined. Youden’s index (J=0.18) and statistical cutoff point at 0.8 U/kg BW/day were also determined for daily insulin dose. Both values had the sensitivity and specificity of 60%.
Discussion
The analysis of the quality of diet of the whole study group (G1+G2) revealed very low scores as regards the consumption of products recommended for diabetics. The average score obtained by all the patients was only 27.6±11.1 and ranged from 3.8 to 61.0 (maximum value of 100). Powers et al conducted a study including 463 individuals aged 5–81 years suffering from type 1 diabetes in whom the quality of diet was assessed with Healthy Eating Index (HEI).15 The index reflects the level at which dietary recommendations for the general population are observed. The scores ranged from 53.9 to 63.7 (maximum value of 100). In children aged 5–13 years, the average score was 60.3±14.0, while in adolescents aged 13–18 years, it was 53.9±12.7. Similar results were also observed in other studies conducted using HEI in adolescents with type 1 diabetes.4,16 Based on the analysis of data collected by the Center for Nutrition Policy and Promotion, it was stated that the average HEI-2015 score was 54.9 in the general population of children and adolescents aged 2–17 years.17
Moreover, it needs to be emphasized that low scores were also observed for the consumption of products not recommended for diabetics in the study group (G1+G2). The average score obtained by all the patients was only 22.4±11.1 and ranged from 1.8 to 66.3. It indicates a relatively low intensity of the consumption of nonrecommended products. It is worth emphasizing that there is a paucity of comparable studies concerning the assessment of the quality of diet of diabetic patients with an index of unhealthy diet. However, a large cohort SEARCH study that assessed the nutrition of children and adolescents with type 1 and 2 diabetes demonstrated that <50% of individuals adhered to recommendations concerning the consumption of fiber, fruit, vegetables, and wholemeal cereal products.18 Similar conclusions were presented based on the review of professional literature conducted by Rovner and Nansel with additional remarks concerning excessive added carbohydrate and lipid consumption in a group of growing age population with type 1 diabetes.19
The whole study group was divided into two subgroups differing in terms of the quality of diet. A pronounced majority of patients (70.1%) were assigned to G2, which was characterized by a better quality of diet. Less than half of the patients (29.9%) were assigned to G1, in which the consumption of nonrecommended products was higher. However, it should be emphasized that none of the groups was characterized by good or bad quality of the diet. Then, it was noted that the groups were also different in terms of dietary habits. G2 patients significantly less frequently chose sweet (P=0.012) and salty snacks (P=0.004) and fried dishes (P=0.008). Conversely, they consumed boiled or steamed dishes more commonly (P=0.007) and avoided sweetening beverages and ready-made dishes with sugar or honey (P=0.006). The obtained results are understandable and coherent with prior assessment of the quality of diet. Interestingly, it was also demonstrated that G2 patients significantly less commonly consumed second dinner (P=0.002). However, it may result from differences in lifestyle. Eating a second dinner is usually associated with a later time of going to sleep. Therefore, some patients may give up on eating this meal.
Apart from differences in dietary habits, the analyzed groups differed significantly also as regards the structure of gender and the duration of the disease. The majority of G1 participants were boys (63.8%), while in G2 there were more girls (66.9%). The obtained data indicate a better quality of diet among girls. It may be due to the fact that women pay more attention to healthy diet.20 In comparison, a study conducted with a survey methodology in a group of 1,818 healthy children and adolescents showed that boys significantly more commonly preferred meat, fish, and poultry, while girls significantly more often chose fruit and vegetables.21 Interesting results were found in a study conducted in a group of 49 adolescents aged 13–19 years suffering from type 1 diabetes. It was demonstrated that girls consumed significantly more vegetables, fruit, and yoghurts but also syrups and juices, while boys consumed markedly more fats. The consumption of the remaining groups of products, such as bread, sweet and salty snacks, meat, fish, and their products was similar.22
Moreover, it needs to be emphasized that the duration of the disease in patients assigned to G1 was significantly longer (P=0.011), which may suggest that the duration of the disease is related to the deterioration of the quality of the diet. The relationship was confirmed with ROC curve analysis, which showed that the duration of the disease exceeding 5 years was a significant factor (P=0.009) that potentially determined the assignment of patients to G1. It seems understandable due to the fact that the diagnosis of type 1 diabetes is associated with daily self-control, also as regards the diet which, in the long run, may be troublesome. As a result, after years of struggling with the disease, patients may pay less attention to maintaining a proper diet. However, there is a paucity of studies on the relationship between disease duration in patients with type 1 diabetes and their dietary habits.
Distinct differences were noted between study groups also as regards the assessment of the normality of BW on the basis of the interpretation of BMI (P=0.016). Almost one-third of patients (31.0%) from G1 were overweight, while almost half of that number (17.6%) was observed in G2. Additionally, the majority of G2 patients (58.8%) had normal BW, while in G1 the percentage was considerably lower (39.7%). It may be due to the fact that girls, who tend to control BW to a larger extent over puberty than boys, constituted the majority of G2.23 Moreover, the percentage of underweight persons was twice higher in G1 (19.0% vs 8.8%), which may result from the fact that boys, who are more commonly underweight during puberty, were the majority of G1.24 It may be associated with high growth rate and the development of disproportions between height and BW. The obtained data also suggest the presence of a relationship between dietary habits and abnormalities in BW.
It is worth emphasizing that there is a disturbing increasing tendency toward being overweight in children, especially those suffering from diabetes. This may result in an increased risk of cardiovascular disease, insulin resistance, and short- and long-lasting complications of diabetes, which significantly affect the effectiveness of treatment.25 It also needs to be highlighted that a significant relationship exists between the introduction of insulin treatment and increased BW in type 1 diabetics.26 As regards the whole study group (G1+G2), slightly over one-third of patients (35.1%) were overweight or obese. Similar results were noted in a study conducted in 500 children and adolescents aged 4–18 years who suffered from type 1 diabetes, with 30.2% of the participants being overweight or obese.26 According to a recent Health Behaviour in School-aged Children 2014 report encompassing a group of 4,545 children and adolescents from Poland, 14.8% of the participants were overweight or obese.27
However, it needs to be noted that no significant differences were reported as regards the average levels of HbA1C in G1 and G2 (8.3% vs 8.2%). The percentage of patients with unsatisfactory metabolic control (HbA1C ≥7.5%) was also similar in both groups (56.9% vs 53.7%). However, it may result from using significantly higher (P=0.021) insulin doses by G1 patients, which probably facilitated controlling the disorders of glycemia in spite of diet mistakes. This association was confirmed with ROC curve analysis, which showed that insulin dose exceeding 0.8 U/kg BW/day was a possible consequence of poorer quality of diet in patients (P=0.016). It is worth emphasizing, though, that the relationship between dietary habits and the control of glycemia in young patients with type 1 diabetes was well documented in numerous studies.4,15,28–30 Interestingly, a study by Nansel et al conducted in a group of 252 children and adolescents with type 1 diabetes aged 8–18 years with the average duration of the disease of 6.3 years revealed very similar average hemoglobin levels (8.5%).16 This may also indicate a regularity in this age group.
We noted no differences for average serum lipid concentrations between G1 and G2. The percentage of patients with dyslipidemia was similar in both groups (34.5% vs 39.0%). It seems understandable due to the comparable quality of metabolic control in G1 and G2. This may also result from the fact that the majority of patients in both G1 and G2 (39.7% vs 58.8%) had normal BW determined with BMI. Moreover, normal WHtR values were reported in the majority of patients in both groups (G1 – 86.0%, G2 – 86.6%). This index is a simple tool to assess the risk of cardiovascular disease associated with such problems as lipid disorders.31 It is also worth noting that radical changes in the lipid profile are more commonly reported in patients with a long history of the disease (exceeding 5 years) and poor metabolic control.32 It is corroborated by the results of a multicenter cross-sectional study conducted by Schwab et al in a group of 29,979 persons with type 1 diabetes aged 1–20 years in which dyslipidemia was reported only in one-third (28.5%) of the participants.33
We noted no differences for average blood pressure values between G1 and G2. The percentage of patients with hypertension was similar in both groups (32.8% vs 28.7%). A study in 100 children and adolescents with type 1 diabetes showed hypertension in almost one-third (30%) of the patients.34 Notably, children with type 1 diabetes have higher values of blood pressure than their healthy peers. Moreover, hypertension or prehypertension is more commonly diagnosed in such a group of patients, which may lead to the development of diabetic micro- and microangiopathy.35,36 It is corroborated by the findings of a retrospective cohort study by Ahmadizar et al conducted in 3,728 patients with type 1 diabetes aged <19 years, in whom the percentage of cases of hypertension was significantly higher compared with healthy individuals (35.2% vs 11.4%).37
The results of this study are not free of limitations. Differences in the gender structure and the wide age range of the participants constitute significant limitations. Although the selection of patients for the study was made on the basis of restrictive criteria taking into account the type of diabetes, the method of treatment, or the presence of chronic comorbidities. Another important limitation is the lack of data related to the patients’ lifestyle and parents’ education level or monthly income of the family. However, the study was mainly focused on the analysis of the dietary habits and influence of the quality of diet on insulin dosage and selected clinical variables. A complete assessment of all aspects would require the use of additional questionnaires, which could probably result in a large number of refusals to participate in the study. Therefore, further research is needed to verify the relationship between various factors and the quality of diet of the patients with type 1 diabetes.
Conclusion
All in all, the obtained results indicate that the dietary habits of the study group including children and adolescents with type 1 diabetes are unsatisfactory. The factors that may have an unfavorable influence on the quality of diet seem to include male gender and the duration of the disease. Based on the obtained results, it may be stated that a poorer quality of diet is associated with higher insulin doses and being overweight. However, the study did not confirm a relationship between dietary habits and the levels of HbA1C and lipids in the serum and the value of blood pressure in the study group. It seems necessary to analyze the influence of additional factors that may contribute to the quality of diet in patients.
Disclosure
The authors report no conflicts of interest in this work.
References
Atkinson MA, Eisenbarth GS, Michels AW. Type 1 diabetes. Lancet. 2014;383(9911):69–82. | ||
Tascini G, Berioli M, Cerquiglini L, et al. Carbohydrate counting in children and adolescents with type 1 diabetes. Nutrients. 2018; 10(1):109. | ||
Polskie Towarzystwo Diabetologiczne. Zalecenia kliniczne dotyczące postępowania u chorych na cukrzycę 2018 [Clinical recommendations on proceedings in patients with diabetes 2018]. Diabetologia Praktyczna. 2018;4(Supplement A):A22–A24. Polish. | ||
Nansel TR, Lipsky LM, Liu A. Greater diet quality is associated with more optimal glycemic control in a longitudinal study of youth with type 1 diabetes. Am J Clin Nutr. 2016;104(1):81–87. | ||
Patton SR. Adherence to diet in youth with type 1 diabetes. J Am Diet Assoc. 2011;111(4):550–555. | ||
Polskie Towarzystwo Diabetologiczne. Zalecenia kliniczne dotyczące postępowania u chorych na cukrzycę 2018 [Clinical recommendations on proceedings in patients with diabetes 2018]. Diabetologia Praktyczna. 2018;4(Supplement A):A15–A17. Polish. | ||
Spinks J, Guest S. Dietary management of children with type 1 diabetes. Paediatr Child Health. 2017;27(4):176–180. | ||
Jeżewska-Zychowicz M, Gawęcki J, Wądołowska L, et al. Kwestionariusz do badania poglądów i zwyczajów żywieniowych dla osób w wieku od 16 do 65 lat, wersja 1.2 –kwestionariusz do samodzielnego wypełnienia przez Respondenta [Questionnaire for the study of views and dietary habits for people in age from 16 to 65 years, version 1.2 - questionnaire for unassisted completion by the Respondent]. W: Gawęcki J, redaktor. Kwestionariusz do badania poglądów i zwyczajów żywieniowych oraz procedura opracowania danych. Warszawa: Wydawnictwo Komitetu Nauki o Żywieniu Człowieka Polskiej Akademii Nauk; 2014:21–33. Polish. | ||
Kułaga Z, Różdżyńska-Świątkowska A, Grajda A, et al. Siatki centylowe dla oceny wzrastania i stanu odżywienia polskich dzieci i młodzieży od urodzenia do 18 roku życia [Percentile charts for growth and nutritional status assessment in Polish children and adolescents from birth to 18 year of age]. Standardy medyczne/Pediatria. 2015;12:119–135. Polish. | ||
Ashwell M, Hsieh SD. Six reasons why the waist-to-height ratio is a rapid and effective global indicator for health risks of obesity and how its use could simplify the international public health message on obesity. Int J Food Sci Nutr. 2005;56(5):303–307. | ||
Donaghue KC, Wadwa RP, Dimeglio LA, et al. ISPAD Clinical Practice Consensus Guidelines 2014. Microvascular and macrovascular complications in children and adolescents. Pediatr Diabetes. 2014;15(Supplement 20):257–269. | ||
Kułaga Z, Litwin M, Grajda A, et al. Rozkłady wartości ciśnienia krwi w populacji referencyjnej dzieci i młodzieży w wieku szkolnym [Distribution of blood pressure in school-aged children and adolescents reference population]. Standardy medyczne/Pediatria. 2010;7:100–111. Polish. | ||
Hanley JA, Hajian-Tilaki KO. Sampling variability of nonparametric estimates of the areas under receiver operating characteristic curves: an update. Acad Radiol. 1997;4(1):49–58. | ||
Youden WJ. Index for rating diagnostic tests. Cancer. 1950;3(1):32–35. | ||
Powers MA, Gal RL, Connor CG, et al. Eating patterns and food intake of persons with type 1 diabetes within the T1D exchange. Diabetes Res Clin Pract. 2018;141:217–228. | ||
Nansel TR, Haynie DL, Lipsky LM, Laffel LM, Mehta SN. Multiple indicators of poor diet quality in children and adolescents with type 1 diabetes are associated with higher body mass index percentile but not glycemic control. J Acad Nutr Diet. 2012;112(11):1728–1735. | ||
United States Department of Agriculture [homepage on the Internet]. HEI Scores for Americans. Available from: https://www.cnpp.usda.gov/hei-scores-americans. Accessed August 3, 2018. | ||
Mayer-Davis EJ, Nichols M, Liese AD, et al. Dietary intake among youth with diabetes: the SEARCH for Diabetes in Youth Study. J Am Diet Assoc. 2006;106(5):689–697. | ||
Rovner AJ, Nansel TR. Are children with type 1 diabetes consuming a healthful diet? A review of the current evidence and strategies for dietary change. Diabetes Educ. 2009;35(1):97–107. | ||
Cooke LJ, Wardle J. Age and gender differences in children’s food preferences. Br J Nutr. 2005;93(5):741–746. | ||
Caine-Bish NL, Scheule B. Gender differences in food preferences of school-aged children and adolescents. J Sch Health. 2009;79(11):532–540. | ||
Lorentsen N, Bergstad I. Diet, self-management and metabolic control in Norwegian teenagers with type 1 diabetes. Scand J Nutr. 2005;49(1):37–49. | ||
Neumark-Sztainer D, Hannan PJ, Story M, Perry CL. Weight-control behaviors among adolescent girls and boys: implications for dietary intake. J Am Diet Assoc. 2004;104(6):913–920. | ||
Dereń K, Nyankovskyy S, Nyankovska O, et al. The prevalence of underweight, overweight and obesity in children and adolescents from Ukraine. Sci Rep. 2018;8(1):3625. | ||
Da Costa VM, de Carvalho Padilha P, de Lima GC, et al. Overweight among children and adolescent with type I diabetes mellitus: prevalence and associated factors. Diabetol Metab Syndr. 2016;8(1):39. | ||
Łuczyński W, Szypowska A, Głowińska-Olszewska B, Bossowski A. Overweight, obesity and features of metabolic syndrome in children with diabetes treated with insulin pump therapy. Eur J Pediatr. 2011;170(7):891–898. | ||
Oblacińska A. Nadwaga i otyłość [Overweight and obesity]. W: Mazur J, redaktor. Zdrowie i zachowania zdrowotne młodzieży szkolnej w Polsce na tle wybranych uwarunkowań socjodemograficznych. Wyniki badań HBSC 2014. Warszawa: Instytut Matki i Dziecka; 2015:106–111. Polish. | ||
Mehta SN, Volkening LK, Anderson BJ, et al. Dietary behaviors predict glycemic control in youth with type 1 diabetes. Diabetes Care. 2008;31(7):1318–1320. | ||
Delahanty LM, Nathan DM, Lachin JM, et al. Association of diet with glycated hemoglobin during intensive treatment of type 1 diabetes in the diabetes control and complications trial. Am J Clin Nutr. 2009;89(2):518–524. | ||
Maffeis C, Morandi A, Ventura E, et al. Diet, physical, and biochemical characteristics of children and adolescents with type 1 diabetes: relationship between dietary fat and glucose control. Pediatr Diabetes. 2012;13(2):137–146. | ||
Wang S, Crandell JL, Couch SC, et al. Plasma nutrient biomarkers are associated with waist-to-height ratio in youth with type 1 diabetes. J Nutr. 2015;145(3):579–586. | ||
Wysocka-Mincewicz M, Kołodziejczyk H, Wierzbicka E, et al. Overweight, obesity and lipids abnormalities in adolescents with type 1 diabetes. Pediatr Endocrinol Diabetes Metab. 2015;21(2):70–81. | ||
Schwab KO, Doerfer J, Naeke A, et al. Influence of food intake, age, gender, HbA1c, and BMI levels on plasma cholesterol in 29 979 children and adolescents with type 1 diabetes – reference data from the German diabetes documentation and quality management system (DPV). Pediatr Diabetes. 2009;10(3):184–192. | ||
Machnica L, Deja G, Jarosz-Chobot P. Nadciśnienie tętnicze oraz stan przednadciśnieniowy u dzieci i młodzieży chorującej na cukrzycę typu 1 [Hypertension and prehypertension in children and adolescents with diabetes type 1]. Pediatr Endocrinol Diabetes Metab. 2008;14(4):215–219. Polish. | ||
Pietrzak I, Mianowska B, Gadzicka A, Młynarski W, Szadkowska A. Blood pressure in children and adolescents with type 1 diabetes mellitus – the influence of body mass index and fat mass. Pediatr Endocrinol Diabetes Metab. 2009;15(4):240–245. | ||
Downie ML, Ulrich EH, Noone DG. An update on hypertension in children with type 1 diabetes. Can J Diabetes. 2018;42(2):199–204. | ||
Ahmadizar F, Souverein P, de Boer A, Maitland-van der Zee AH. Undertreatment of hypertension and hypercholesterolaemia in children and adolescents with type 1 diabetes: long-term follow-up on time trends in the occurrence of cardiovascular disease, risk factors and medications use. Br J Clin Pharmacol. 2018;84(4):776–785. |
 © 2019 The Author(s). This work is published and licensed by Dove Medical Press Limited. The full terms of this license are available at https://www.dovepress.com/terms.php and incorporate the Creative Commons Attribution - Non Commercial (unported, v3.0) License.
By accessing the work you hereby accept the Terms. Non-commercial uses of the work are permitted without any further permission from Dove Medical Press Limited, provided the work is properly attributed. For permission for commercial use of this work, please see paragraphs 4.2 and 5 of our Terms.
© 2019 The Author(s). This work is published and licensed by Dove Medical Press Limited. The full terms of this license are available at https://www.dovepress.com/terms.php and incorporate the Creative Commons Attribution - Non Commercial (unported, v3.0) License.
By accessing the work you hereby accept the Terms. Non-commercial uses of the work are permitted without any further permission from Dove Medical Press Limited, provided the work is properly attributed. For permission for commercial use of this work, please see paragraphs 4.2 and 5 of our Terms.