")
Back to Journals » International Journal of Nanomedicine » Volume 12
Analysis of the cytotoxicity of hierarchical nanoporous graphenic carbon against human glioblastoma grade IV cells
Authors Jaworski S, Biniecka P, Bugajska, Daniluk K, Dyjak S, Strojny B, Kutwin M , Wierzbicki M, Grodzik M, Chwalibog A
Received 1 March 2017
Accepted for publication 24 April 2017
Published 18 May 2017 Volume 2017:12 Pages 3839—3849
DOI https://doi.org/10.2147/IJN.S135932
Checked for plagiarism Yes
Review by Single anonymous peer review
Peer reviewer comments 3
Editor who approved publication: Dr Thomas Webster
Sławomir Jaworski,1 Paulina Biniecka,1 Żaneta Bugajska,1 Karolina Daniluk,1 Sławomir Dyjak,2 Barbara Strojny,1 Marta Kutwin,1 Mateusz Wierzbicki,1 Marta Grodzik,1 André Chwalibog3
1Division of Nanobiotechnology, Warsaw University of Life Science, 2Faculty of Advanced Technologies and Chemistry, Military University of Technology, Warsaw, Poland; 3Department of Veterinary and Animal Sciences, University of Copenhagen, Copenhagen, Denmark
Abstract: A newly produced hierarchical, nanoporous carbon (HNC) material is studied for the first time in a biological model. The material consists of uniform particles and is characterized by a mean diameter <150 nm, a high specific surface area of 1,000 m2/g, well-developed porosity, and high electrical conductivity. These unique properties and ability to transfer charge create a possibility of employing HNC as a moderator of tumor cell growth. As the charge of HNC may interfere with cell membranes by adhesion and by bonding with cell receptors, it may block the supply of nutrients. The interactions of HNC with the U87 cells can also lead to the excessive generation of reactive oxygen species (ROS) and activate apoptotic mechanisms in cancer cells. The investigation was performed using U87 human glioblastoma and PCS-201–010 normal fibroblast cell lines, where cell morphology and ultrastructure, viability, ROS production, type of cell death, mitochondrial transmembrane potential, and the expression of genes engaged in apoptosis pathways are studied. The results demonstrate that cytotoxicity of HNC particles increases with concentration from 5 to 100 µg/mL by activation of apoptosis through the mitochondrial pathway, without inducing necrosis. Our research indicates the potential applicability of HNC in cancer therapy.
Keywords: toxicity, glioblastoma, graphenic carbon material, nanoparticles, U87 cells, fibroblast cells
Introduction
Glioblastoma (GB) grade IV is a highly heterogeneous and aggressive primary brain tumor.1,2 GB is defined by intensive proliferation and infiltrative growth and is associated with astrocytic glioma necrosis, which accounts for most cell death in GB.3 Despite treatments such as surgical resection, radiotherapy, and chemotherapy, the survival of patients diagnosed with GB is just a few months.4,5 Therefore, there is a need to implement a future treatment that would involve the use of alternative therapies, such as various carbon nanoparaticles. The nanoparticles of different carbon materials were recently widely investigated because of their in vitro and in vivo biological activity.6,7 The results of experiments on various carbon nanomaterials have shown that their diverse behavior in living organisms may be useful in cancer therapy.8–11 One of the tested materials was graphene, as previous studies have indicated that it is a very promising nanomaterial in treating glioblastoma.12
Graphene is a two-dimensional, one atom-thick layer of sp2 bonded carbon. Graphene has been investigated for use in a number of medical and biological areas, including drug/gene delivery, cancer therapy, biosensing, bioimaging, antibacterial materials, and scaffolds for cell cultures.13–15 However, different forms of graphene, such as graphene oxide and reduced graphene oxide produced by chemical methods, or pristine graphene produced by physical methods, may have different properties.16 Compared with graphene oxide, reduced graphene oxide and pristine graphene are more likely to diffuse into cancer cells and perforate cell membranes.17 Furthermore, amine-modified (G-NH2) graphene showed no stimulatory effect on human platelets and did not induce pulmonary thromboembolism in mice. This research suggested that G-NH2 is a safe biocompatible graphene derivative with potential for biomedical applications because of its lack of thrombotic and hemolytic activities.18
Although the inhibitory effects of graphene on cancer cell growth have been indicated,19 the mechanism of interaction with cancer cells is not exactly known. The presence of conductive carbon particles near/inside cells has clear effects on their growth, most probably by changing the charge transfer between cell receptors. If this theory is true, the application of carbon material with a high conductivity and high surface area should enhance this interaction effect. A single graphene sheet material seems to fulfill this expectation. Unfortunately, good-quality graphene sheets have poor Ne/SSA ratios, where Ne is the number of edges and SSA is the specific surface area per unit mass of material.
Recently, a research group from the Military University of Technology, Poland, introduced an original, effortless method of production of hierarchical, nanoporous carbon (HNC) material prepared from ubiquitous chemical reagents like oxalic acid and magnesium.20 In typical reaction performed under vacuum, the Mg/(C2H2O4) mixture reacts vigorously upon ignition in self-sustaining regime giving as a result carbon material that condenses to uniformly sized, spherical hollow and porous carbon nanospheres. Such particles are composed of graphene-like mono/multilayers, strongly folded and curved with a large number of accessible edges. Such accessible edges are extremely important because they are involved in direct contact with living cells, penetrating them for instance. Thus, if there are more ones, the probability of building theirs into biological material is more probable. HNC particles might fulfill these criteria, and due to it, high electrical conductivity, ca. 173 S/m, we decided to apply HNC in our experiments as moderators of tumor cell growth.
Materials and methods
Preparation and characterization of HNC
HNC nanoparticles were synthesized at the Military University of Technology, Warsaw, Poland. The procedure was described in detail in a recent paper.20 Fifty grams of stoichiometric mixture of magnesium with anhydrous oxalic acid was ignited under vacuum condition in 25.7 dm3 volume stainless-steel reactor. After combustion, raw, black, fluffy product was collected and then purified in an aqueous solution of HCl (20% wt). After acid treatment, the black powder was washed several times with distilled water and finally dried under vacuum at 40°C. Dry HNC powder was dispersed in ultrapure water to prepare a 1.0 mg/mL solution. After 45 min of sonification, the solution was diluted to different concentrations with 1× Dulbecco’s Modified Eagle’s Medium (DMEM; Sigma-Aldrich Corporation, St Louis, MO, USA) immediately prior to exposure to the cells.
The morphology and structure of the obtained materials were studied using a Morada 11 megapixels’ camera (Olympus Soft Imaging Solutions, Münster, Germany), scanning electron microscope (SEM; FEI QUANTA 200), transmission electron microscope (TEM; JEM-1220 JEOL, Tokyo, Japan, accelerating voltage of 80 kV), and high-resolution transmission electron microscope (HRTEM; TITAN-CUBED 80–300, accelerating voltage of 300 kV). Samples for TEM observations were prepared by placing droplets of hydrocolloids onto formvar-coated copper grids (Agar Scientific, Stansted, UK). Immediately after air-drying the droplets, the grids were inserted into the microscope.
Cell cultures
The human glioblastoma cell line U87 and PCS-201–010 human skin fibroblasts were obtained from the American Type Culture Collection (Manassas, VA, USA) and maintained in DMEM containing 10% fetal bovine serum (Life Technologies, Houston, TX, USA) and 1% penicillin and streptomycin (Life Technologies) at 37°C in a humidified atmosphere of 5% CO2/95% air in a NuAire DH AutoFlow CO2 Air-Jacketed Incubator (Plymouth, MN, USA). The HNC powder was dispersed in ultrapure water to prepare a 1.0 mg/mL stock solution. After 45 min of sonification, the solution was diluted to different concentrations with fresh 1× DMEM immediately prior to exposure to the cells.
Zeta potential measurements
The zeta potential of HNC was measured using a dynamic scattering method. After 45 min of sonification, the stock solution (1.0 mg/mL) was diluted to different concentrations (5, 10, 20, 50, and 100 μg/mL) with fresh 1× DMEM. Each sample was measured after 120 s of stabilization at 25°C in three replicates.
Cell morphology
U87 glioma cells and fibroblasts were seeded in six-well plates (1×10⁵ cells per well) and incubated for 24 h. Cells cultured in medium without the addition of HNC nanoparticles were used as the control. HNC particles were introduced to the cells at increasing concentrations (5, 10, 20, 50, and 100 μg/mL). Cell morphology was recorded using an optical microscope 24 h after exposure.
Cell ultrastructure
To investigate the cellular ultrastructure, glioma cells were washed three times with ice-cold phosphate-buffered saline (PBS; Sigma-Aldrich Corporation). The cells were collected after centrifugation (1,500 rpm for 5 min) and prefixed with 2.5% glutaraldehyde, then postfixed in 1% osmium tetroxide, dehydrated in ethanol gradients, impregnated with epoxy embedding resin (Fluka Epoxy Embedding Medium Kit; Sigma-Aldrich) and cut with an ultramicrotome (Leica EM UC6). Thin sections were poststained with uranyl acetate and lead citrate, and evaluated by a JEM-1220 (Jeol) TEM at 80 keV, with a Morada 11 megapixels’ camera (Olympus Soft Imaging Solutions).
Cell viability
Cell viability was evaluated using a PrestoBlue™ Cell Viability Assay (Life Technologies, Taastrup, Denmark). PrestoBlue™ reagent is quickly reduced by metabolically active cells, providing a quantitative measure of viability and cytotoxicity. U87 cells and fibroblasts were plated in 96-well plates (5×10³ cells per well) and incubated for 24 h. Then the medium was removed, and samples with the HNC particles were introduced to the cells at increasing concentrations (5, 10, 20, 50, and 100 μg/mL). After 24 h, 10 μL of PrestoBlue™ reagent was added to each well and incubated for an additional 2 h at 37°C. The optical density of each well was recorded at 570 nm on an enzyme-linked immunosorbent assay reader (Infinite M200, Tecan, Durham, NC, USA). Cell viability was expressed as the percentage (ODtest − ODblank)/(ODcontrol − ODblank), where “ODtest” is the optical density of cells exposed to HNC, “ODcontrol” is the optical density of the control sample, and “ODblank” is the optical density of wells without glioma cells.
Reactive oxygen species production
Reactive oxygen species (ROS) production was evaluated using DCFDA – Cellular Reactive Oxygen Species Detection Assay Kit (Abcam, Cambridge, UK). DCFDA uses the cell permeant reagent 2′,7′-dichlorofluorescein diacetate, a fluorogenic dye that measures hydroxyl, peroxyl, and other ROS activities within the cell. After diffusion into the cell, DCFDA is deacetylated by cellular esterases to a nonfluorescent compound, which is later oxidized by ROS into 2′,7′-dichlorofluorescein (DCF). U87 cells were plated on opaque-bottomed 96-well plates (3×10⁵ cells per well) and incubated for 24 h. Then, the medium was removed, and samples with the HNC particles were introduced to the cells. HNC particles were diluted in fresh DMEM and hydrocolloids were added to cells at increasing concentrations (5, 10, 20, 50, and 100 μg/mL). After 24 h the medium was removed and 100 μL of diluted DCFDA was added to each well and incubated for an additional 45 min at 37°C in the dark. DCF production was measured by fluorescence spectroscopy with excitation wavelength at 485 nm and emission wavelength at 535 nm on an enzyme-linked immunosorbent assay reader (Infinite M200).
Apoptosis/necrosis assay
An annexin V/propidium iodide (PI) assay (Alexa Fluor® 488 Annexin V/Dead Cell Apoptosis Kit with AlexaFluor 488 Annexin V and PI for flow cytometry, Life Technologies) was performed to examine whether cell death had occurred by apoptotic or necrotic pathways. After a 24 h incubation of U87 glioma cells in 75 mL flasks (1×10⁶ cells per flask), the medium was removed, and HNC samples were added at 50 μg/mL. After a further 24 h incubation, the medium was removed, and the cells were washed in ice-cold PBS. Harvested cells were suspended in 100 μL annexin-binding buffer (Invitrogen, Carlsbad, CA, USA), and subsequently, 5 μL of annexin V linked with Alexa Fluor 488 and 1 μL of PI were added (Invitrogen). Cells were analyzed using FACStrak (Becton-Dickinson, Germany; software – SimulSet), measuring the fluorescence emission at 530 and 575 nm using excitation at 488 nm.
Mitochondrial transmembrane potential
The Mitochondrial Transmembrane Potential Apoptosis Detection Kit (Abcam) was utilized to examine mitochondrial transmembrane potential, an important parameter of mitochondrial function used as an indicator of cell death. The collapse of the mitochondrial transmembrane potential coincides with the opening of the mitochondrial permeability transition pores, leading to the release of cytochrome c into the cytosol, which in turn triggers other downstream events in the apoptotic cascade. In this assay, U87 glioma cells were seeded in six-well plates (1×10⁵ cells per well) and incubated for 24 h. Cells cultured in medium without the addition of HNC particles were used as the control. HNC particles were introduced to the cells at increasing concentrations (5, 10, 20, 50, and 100 μg/mL). The cells were harvested and suspended in 1 mL of the diluted MitoCapture solution. After 20 min of incubation with reagent in 37°C and 5% CO2, mitochondrial permeability was analyzed by using a fluorescence microscope (Olympus CKX41, Poland) 24 h after exposure. MitoCapture that has aggregated in the mitochondria of healthy cells fluoresces red. MitoCapture cannot accumulate in mitochondria, remaining as a monomer in the cytoplasm, and fluorescing green.
RNA isolation and reverse transcription
In 10 mL of Milli-Q water, 0.01 g of HNC powder was dissolved to obtain the concentration of 1,000 μg/mL. Then, the prepared stocks of graphene were added to DMEM to obtain the concentration of 50 μg/mL of HNC. U87 cells were seeded in 75 cm2 culture flasks (1×10⁶ cells per flask) and incubated to reach 70% confluency. Then, the cells were washed by PBS and subsequently DMEM with HNC was added into each flask. After 24 h, cells were disassociated by 0.25% trypsin with ethylenediaminetetraacetic acid, harvested, and suspended in fresh DMEM medium. Cells were then centrifuged at 1,200 rpm for 5 min, washed with PBS, and centrifuged to obtain a pellet.
Total RNA was extracted using the PureLink® RNA Mini Kit (Ambion™, Life Technologies, Foster City, CA, USA). Briefly, the cell pellet was homogenized in RNA Lysis Solution in a TissueLyser bead mill (Qiagen, Germantown, MD, USA) for 5 min at 50 Hz. After centrifugation, the aqueous phase was transferred to clean tubes, 70% ethanol was added, and the manufacturer’s protocol was followed. RNA quantity was determined spectrophotometrically by NanoDrop 2000 (Thermo Scientific, Wilmington, DE, USA).
The reverse transcription reaction was performed with the cDNA High Capacity Reverse Transcription Kit (Applied Biosystems, Foster City, CA, USA), using 50 ng of total RNA per sample. The concentration of the generated cDNA was determined spectrophotometrically by NanoDrop 2000. cDNA was stored at −20°C for further analysis.
Real-time PCR
For mRNA expression determination, real-time PCR with relative quantification by the ddCt method and normalization to a housekeeping gene was performed. TaqMan® Fast Advanced Master Mix (Applied Biosystems) with specific TaqMan probes with primers were used for selected genes: caspase-3 (CASP3, inventoried as Hs00234387_m1), caspase-9 (CASP9, inventoried as Hs00609647_m1), and the housekeeping gene glyceraldehyde-3-phosphate dehydrogenase (inventoried as Hs03929097_g1). Runs were performed using 50 ng of cDNA per reaction. Reaction conditions were set up according to the manufacturer’s protocol. The reaction for each sample was performed in duplicate, and the experiment was repeated three times. Reactions were carried out in an ABI Prism 7500 Sequence Detection System thermocycler (Applied Biosystems). Results were analyzed using ABI Prism 7500 relative quantification study software.
Statistical analysis
The data were analyzed using monofactorial analysis of variance with Statgraphics® Plus 4.1 (StatPoint Technologies, Warrenton, VA, USA). Mean values are presented with standard error. Differences with P<0.05 were considered significant.
Results
Characterization of HNC
SEM observations showed that the HNC powder consists of spheroidal hollow particles of ca. 100–150 nm in diameter. These spheres are rather irregular in shape but uniform in size (Figure 1A). A closer look at particles using TEM microscope (Figure 1B) reveals that such particles consist of porous cubes with highly porous and permeable walls, that are ca. 30–40 nm thick and are built of disordered carbon layers. HRTEM observation (Figure 1C) confirms that the walls are composed of randomly crumpled and folded sheets give rise to a micro-mesoporous architecture with pores of a few Angstroms to several nanometers in size. The structure is disordered and rather isotropic, consisting of predominantly single carbon layers, with no obvious graphitization. That carbon microstructure presents an open, “foam-like” structure where the cell body has place to build in. High surface area (984 m2/g), and micro-mesoporous structure with high total volume of pores (2.1 cm3/g) in combination with good electrical conductivity (173 S/m) and retained hydrophilic character of carbon surface (presence of oxygen-containing functionalities)20 fulfill basic requirements in applying them in biological field.
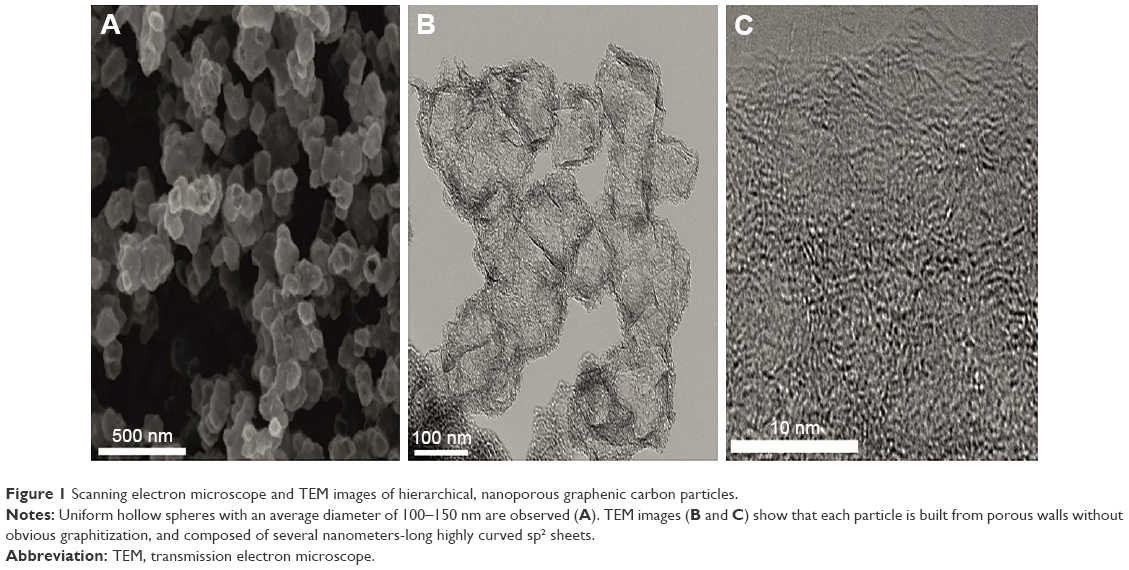 | Figure 1 Scanning electron microscope and TEM images of hierarchical, nanoporous graphenic carbon particles. |
Zeta potential measurements
The zeta potential is a key indicator of the stability of colloidal dispersions. The magnitude of the zeta potential indicates the degree of electrostatic repulsion between adjacent, similarly charged particles in a dispersion. Colloids with high zeta potential (negative or positive) are electrically stabilized while colloids with low zeta potentials tend to coagulate or flocculate. The zeta potential of HNC differed, but all of them generated negative values. Increased concentrations of HNC in fresh DMEM resulted in decreased negative zeta potential. The mean zeta potential was −30.3, −28.3, −28.5, −25.4, and −21.5 for 5, 10, 20, 50, and 100 μg/mL of HNC, respectively. These values indicate moderate stability of the colloid.
Cell morphology
In preliminary experiments with PCS-201–010 fibroblasts, the cellular morphology after treatment with HNC differed from that of the control group. Fewer cells were seen with HNC agglomerates attached to the cell body (Figure 2). In U87 glioma cells and fibroblasts, it was noticeable that HNC agglomerates attached to the cell body and to protrusions. The HNC-treated cells were more oval and denser, and their protrusions were shorter in comparison with the control cells (Figure 2).
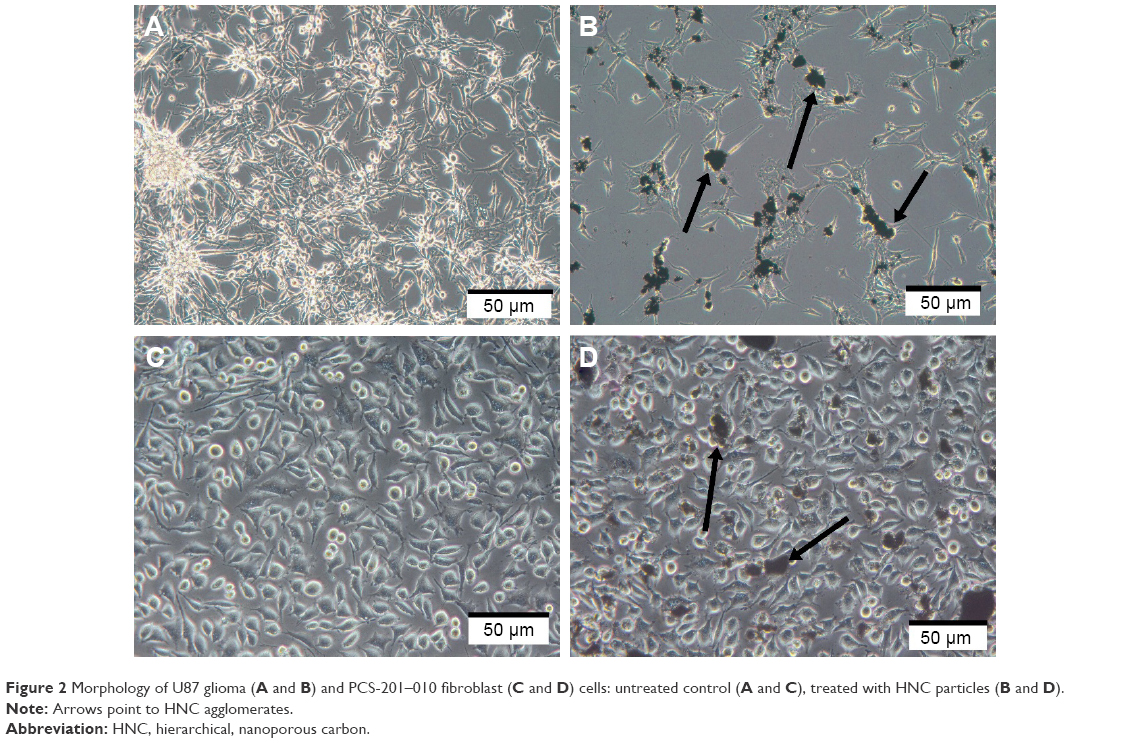 | Figure 2 Morphology of U87 glioma (A and B) and PCS-201–010 fibroblast (C and D) cells: untreated control (A and C), treated with HNC particles (B and D). |
TEM analysis of cells
The TEM images showed a typical ultrastructure of glioma cells (Figure 3). Cell structures (nucleus, mitochondria, vacuoles, Golgi apparatus, rough endoplasmic reticulum) were visible in the control group. The nuclei were elongated and had an irregular shape and unevenly distributed chromatin. Each cell had mitochondria that varied in size and shape, but most were usually oval or elongated. We observed that HNC caused changes in the cell ultrastructure. A fraction of HNC-treated glioma cells was deformed. Inside the cell, cell structures also had different morphology compared to the control group. In the HNC-treated group, endoplasmic reticulum was less visible and mitochondrial crests were destroyed. We also found HNC agglomerates inside the cells in vacuoles and cytoplasm.
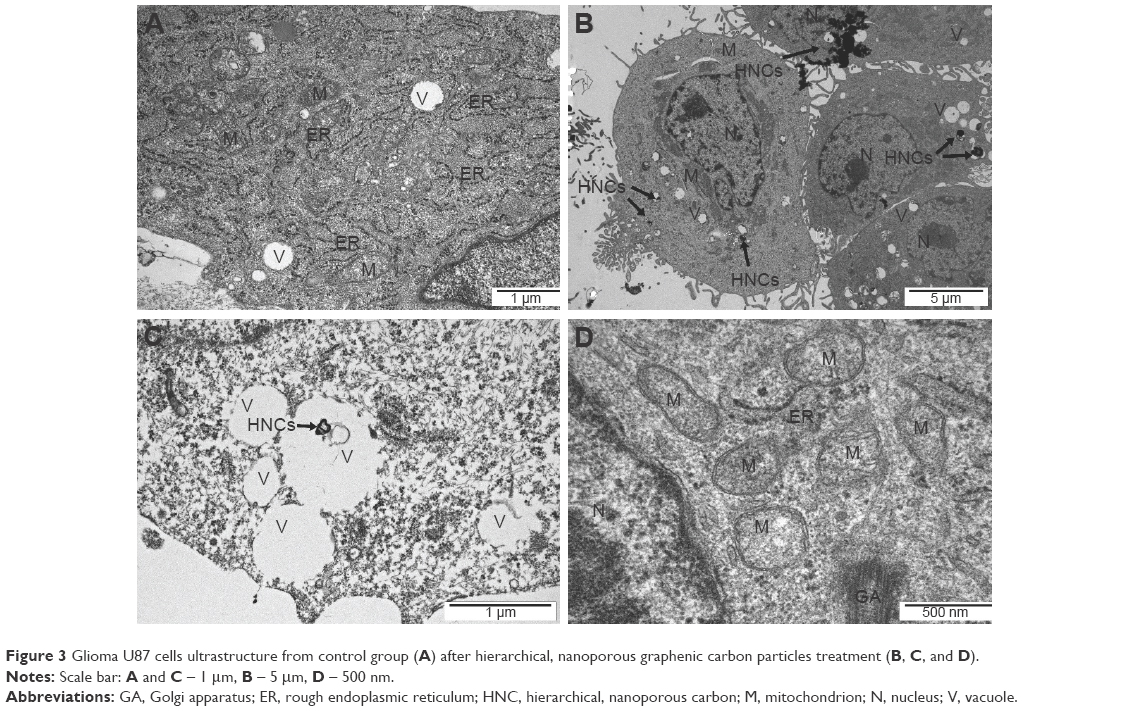 | Figure 3 Glioma U87 cells ultrastructure from control group (A) after hierarchical, nanoporous graphenic carbon particles treatment (B, C, and D). |
Cell viability
This assay is based on the ability of metabolically active cells to reduce the PrestoBlue™ reagent. The greater the number of active cells in the well, the greater the activity of cellular enzymes, resulting in a lower concentration of the dye, which can then be measured and quantified. HNC significantly (P<0.05) decreased the viability of both cell lines compared with the control group. However, the reduction in viability of glioma cells was significantly higher than that of fibroblast cells. Increased concentrations of HNC resulted in decreased vitality in U87 cells. The lowest vitality was observed at a concentration of 100 μg/mL: 56%±3.4%, and the lowest vitality in the PCS-201–010 fibroblast cells was also observed at a concentration of 100 μg/mL: 82%±2.4% (Figure 4).
 | Figure 4 Effect of HNC particles on the viability of U87 glioma (red) and PCS-201–010 fibroblast (blue) cells. |
ROS production
Low levels (or optimum levels) of ROS play an important role in signaling pathways. However, when ROS production increases and overwhelms the cellular antioxidant capacity, it can induce macromolecular damage (by reacting with DNA, proteins, and lipids) and disrupt thiol redox circuits. In the first instance, damage can lead to apoptosis or necrosis. Disruption of thiol redox circuits can lead to aberrant cell signaling and dysfunctional redox control. HNC significantly (P<0.05) increased the ROS production of U87 cell compared with the control group. Increased concentrations of HNC particles resulted in increased ROS generation in U87 glioma cells. The highest was observed at a concentration of 100 μg/mL (Figure 5).
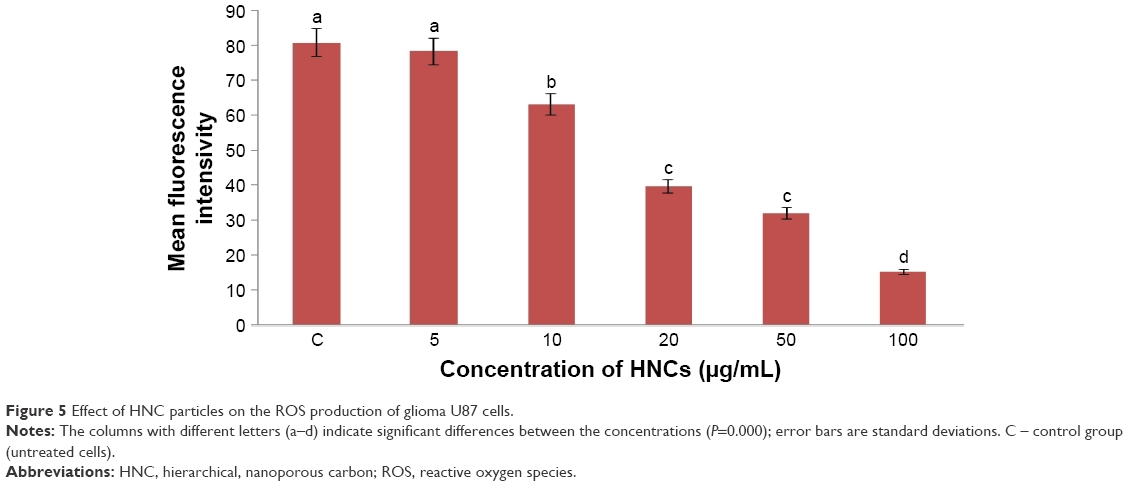 | Figure 5 Effect of HNC particles on the ROS production of glioma U87 cells. |
Apoptosis
The Alexa Fluor 488 Annexin V/PI assay (Alexa Fluor 488 Annexin V/Dead Cell Apoptosis Kit) was used to monitor phosphatidylserine (PS) translocation due to apoptosis. Soon after apoptosis is induced, PS is translocated from the inner leaflet of the plasma membrane to the outer leaflet. HNC induced apoptosis in U87 cells. The degree of apoptosis increased in glioma cells to 38%, whereas the degree of necrosis in U87 cells remained low, at ~1% (Figure 6).
 | Figure 6 Analysis of apoptosis. |
Mitochondrial transmembrane potential
Disintegration of the mitochondrial membranes is one of the first changes inside the cell that occurs upon initiation of apoptosis. Healthy cells have active mitochondria; therefore, they collect aggregates of the red dye inside them, which are visualized with fluorescence microscopy. In apoptotic cells, the green dye cannot accumulate in mitochondria; hence, it stays in the cytoplasm. Our control group had a large number of working mitochondria, and they remained red in color (Figure 6B). The mitochondria of the cells treated with HNC at a concentration of 50 μg/mL were entirely damaged (Figure 5D).
Real-time PCR
Two genes involved in the apoptosis process, CASP3 and CASP9, were investigated. CASP3 is activated in the apoptotic cell both by extrinsic (death ligand) and intrinsic (mitochondrial) pathways; CASP9 has been linked to the mitochondrial death pathway. The expression of CASP3 and CASP9 was significantly higher in comparison with the control group (Table 1).
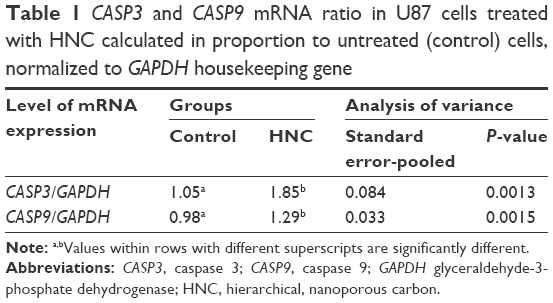 | Table 1 CASP3 and CASP9 mRNA ratio in U87 cells treated with HNC calculated in proportion to untreated (control) cells, normalized to GAPDH housekeeping gene |
Discussion
In this study, for the first time, we examined the potential toxicity of HNC nanoparticles. We treated glioma cells and human skin fibroblasts with HNC at different concentrations (5, 10, 20, 50, and 100 μg/mL), which were based on similar research on the use of graphene and other carbon nanoparticles.19,21 In either case, the base structure of the nanoparticles is very similar, consisting of very thin petals, down to one layer of carbon atoms. Therefore, with this similarity, we expected comparable effects on glioma cells after treatment.
We achieved promising results in our previous studies with nanodiamond22 and graphene12,21 in glioma therapy, and we expect the same outcome with HNC nanoparticles. The aim was to test their biological activity in in vitro cell culture by examining the changes in cell morphology and viability, and quantifying cell death.
Visualization of HNC particles showed the unique architecture of the tested particles, unparalleled by other carbon materials. Their hierarchical porous structure containing micro-, meso-, and macropores and a good electrical conductivity and hydrophilic character provide a highly electrochemically active surface area, short diffusion distance, and a high mass-transfer rate.20 In our experiments, we noted a strong tendency for the HNC particles to be localized closed to the glioma cells, indicating an affinity of HNC for the cells. Microscopic observations showed a significant difference in morphology between control and treated cells after 24 h of culturing in a medium with HNC. The light microscopy images (Figure 2) suggest that HNC has a strong affinity for the cell body, previously described in relation to graphene and different carbon allotropes.17,21 On light microscope images, it was seen that the cells treated with higher concentrations (20, 50, and 100 μg/mL) were more oval and denser and their protrusions were shorter in comparison with the control cells. The lower concentrations of HNC particles (5, 10 μg/mL) did not cause noticeable effects. At each concentration, HNC particles accumulated, especially near cell agglomerates. The agglomerates of HNC particles were also observed inside the U87 cells. In our previous study with different carbon nanoparticles, we have observed nanoparticles appearing on the bright field microphotographs as black dots, aggregated inside the cells or on the cell surface.23 However, to determine the exact interaction of nanoparticles with the cell membrane, further studies need to be conducted.
Assessment of cell viability after incubation with HNC showed that the particles have a toxic effect at higher concentrations (50 and 100 μg/mL). The results are consistent with the fact that dose is an important factor in the toxicity of carbon nanoparticles.23,24 However, the toxic effects also depend on the type of cells, as it was observed that fibroblasts (Figure 4) were less susceptible to HNC treatment than glioma cells. This might be explained by the high amount of HNC aggregates in fibroblast medium and lower affinity of the HNC particles to fibroblast cells, influencing adhesion to the cell membrane and probably HNC intake by cells. In comparison to normal (healthy) cells, cancer cells have high proliferation potential and high metabolic rate because of loss of the control of cell cycle, and they need to absorb precursors to build cell structures.
Cytotoxicity studies of graphene and related materials include the influence on the cell viability and morphology, membrane integrity, ROS generation, DNA damage, gene expression, and a mechanism of uptake.25 Oxidative stress and generation of ROS can be involved in the toxic effects of graphene-based nanomaterials.26 Assessment of ROS production showed a toxic influence of HNC on glioma cells. The interactions of the HNC particles with the U87 cells can lead to excessive ROS generation. HNC can induce dissipation of the mitochondrial membrane potential, which subsequently increases the generation of intracellular ROS and triggers apoptosis by activating the mitochondrial pathway.
Most cancer cells are highly resistant to apoptosis; hence, programmed cell death is crucial in cancer treatment because too little apoptosis results in malignant, not dying, cells.27 Therefore, our further research was focused on defining the pathway of cell death by using flow cytometry, analyzing mitochondrial transmembrane potential, and quantifying the expression of the main apoptosis markers, CASP3 and CASP9.
The results from the Annexin V/PI test have shown a predominance of apoptotic cells over necrotic ones. In comparison with control cells, the rate of apoptosis increased to 38%. The degree of necrosis was insignificant, around 1% (Figure 6). Apoptosis is a coordinated process that can be triggered through two different pathways: the death receptor pathway located on the cell membrane and the mitochondrial pathway. Theoretically, both these pathways could be triggered because HNC could interact with death receptors on the cell membrane, and we also observed degradation of mitochondria in HNC-treated cells. HNC may also interact with cell membrane surface receptors to block the transport of various substances into the cell, inducing cellular stress and apoptosis. However, the mechanism of apoptosis is still unknown. Caspases are paramount markers, which activate the apoptosis process.28 CASP3 is the main protein that takes part in both pathways in programmed cell death. The real-time PCR results have confirmed the activation of apoptotic processes. In HNC-treated glioma cells, the expression of CASP3 was higher (Table 1) than in the control group.
To provide the whole perspective on apoptosis, we conducted an alternative test, which verified the destruction of mitochondrial membranes and established the activation of apoptosis in the mitochondrial pathway. On the fluorescent microscopy image with the concentration of 50 μg/mL of HNC, where the only green color is seen, mitochondria are deactivated (Figure 6). Furthermore, a lower number and damaged mitochondria were observed. HNC particles probably enter the cells and interact with the mitochondrial membrane, which results in cytokine secretion and activation of CASP9. Consequently, the expression of CASP9 was increased significantly compared with the control group.
Taking into consideration how HNC particles behave in the cancer cell environment and that they induce cell death through apoptosis, we assume that these carbon nanoparticles may be a useful agent in cancer therapies. Their toxicity exhibits dose dependence. Therefore, the dose must be very carefully selected in future cancer therapies. Carbon nanoparticles are already used in drug delivery.29,30 HNC particles may also be potential nanocarriers; they have a relatively high surface area (up to 1,000 m2/g), which may be used for functionalization, and they can act as a host for many diverse molecules.20
The present results are preliminary, and a follow-up research elucidating molecular mechanisms of interactions between HNC and cells is necessary. At this stage, the results indicate that the contact between HNC and U87 cell membranes may be the key cause of HNC particles’ toxicity.
Conclusion
The results demonstrate that cytotoxicity of HNC particles increases with concentration. Contact between HNC and glioma inner and outer cell membranes may be the key cause of toxicity. Moreover, they only activate apoptosis through the mitochondrial pathway, without inducing necrosis. Our research indicates the potential applicability of HNC in cancer therapy.
Acknowledgments
The authors extend their appreciation to the head of the department Prof Ewa Sawosz, who inspired the research and provided general support. This work was supported by grant NCN 2013/09/N/NZ9/01898 and the Polish Ministry of Science and Higher Education by grant Iuventus Plus IP2014 008173. This report is a part of Sławomir Jaworski’s habilitation thesis.
Disclosure
The authors report no conflicts of interest in this work.
References
Zhang X, Zhang W, Cao WD, Cheng G, Zhang YQ. Glioblastoma multiforme: molecular characterization and current treatment strategy (Review). Exp Ther Med. 2012;3(1):9–14. | ||
DeAngelis LM. Brain tumors. N Engl J Med. 2001;344(2):114–123. | ||
Smith JS, Tachibana I, Passe SM, et al. PTEN mutation, EGFR amplification, and outcome in patients with anaplastic astrocytoma and glioblastoma multiforme. J Natl Cancer Inst. 2001;93(16):1246–1256. | ||
Brat DJ, Van Meir EG. Vaso-occlusive and prothrombotic mechanisms associated with tumor hypoxia, necrosis, and accelerated growth in glioblastoma. Lab Invest. 2004;84(4):397–405. | ||
Shakur SF, Bit-Ivan E, Watkin WG, Merrell RT, Farhat HI. Multifocal and multicentric glioblastoma with leptomeningeal gliomatosis: a case report and review of the literature. Case Rep Med. 2013;2013:132679. | ||
Sun X, Liu Z, Welsher K, et al. Nano-graphene oxide for cellular imaging and drug delivery. Nano Res. 2008;1(3):203–212. | ||
Cheng J, Gu Y-J, Wang Y, Cheng SH, Wong WT. Nanotherapeutics in angiogenesis: synthesis and in vivo assessment of drug efficacy and biocompatibility in zebrafish embryos. Int J Nanomedicine. 2011;6:2007–2021. | ||
Cho K, Wang X, Nie S, Chen ZG, Shin DM. Therapeutic nanoparticles for drug delivery in cancer. Clin Cancer Res. 2008;14(5):1310–1316. | ||
Farokhzad OC, Cheng J, Teply BA, et al. Targeted nanoparticle-aptamer bioconjugates for cancer chemotherapy in vivo. Proc Natl Acad Sci U S A. 2006;103(16):6315–6320. | ||
Fiorillo M, Verre AF, Iliut M, et al. Graphene oxide selectively targets cancer stem cells, across multiple tumor types: implications for non-toxic cancer treatment, via “differentiation-based nano-therapy”. Oncotarget. 2015;6(6):3553–3562. | ||
Wierzbicki M, Sawosz E, Grodzik M, Prasek M, Jaworski S, Chwalibog A. Comparison of anti-angiogenic properties of pristine carbon nanoparticles. Nanoscale Res Lett. 2013;8(1):195. | ||
Jaworski S, Sawosz E, Grodzik M, et al. In vitro evaluation of the effects of graphene platelets on glioblastoma multiforme cells. Int J Nanomedicine. 2013;8:413–420. | ||
Shen H, Zhang L, Liu M, Zhang Z. Biomedical applications of graphene. Theranostics. 2012;2(3):283–294. | ||
Lei H, Mi L, Zhou X, et al. Adsorption of double-stranded DNA to graphene oxide preventing enzymatic digestion. Nanoscale. 2011;3(9):3888–3892. | ||
Yang K, Zhang S, Zhang G, Sun X, Lee ST, Liu Z. Graphene in mice: ultrahigh in vivo tumor uptake and efficient photothermal therapy. Nano Lett. 2010;10(9):3318–3323. | ||
Park S, Ruoff RS. Chemical methods for the production of graphenes. Nature Nanotechnology. 2009;4(4):217–224. | ||
Hinzmann M, Jaworski S, Kutwin M, et al. Nanoparticles containing allotropes of carbon have genotoxic effects on glioblastoma multiforme cells. Int J Nanomedicine. 2014;9:2409–2417. | ||
Gurunathan S, Han JW, Eppakayala V, Dayem AA, Kwon DN, Kim JH. Biocompatibility effects of biologically synthesized graphene in primary mouse embryonic fibroblast cells. Nanoscale Res Lett. 2013;8(1):393. | ||
Sawosz E, Jaworski S, Kutwin M, et al. Graphene functionalized with arginine decreases the development of glioblastoma multiforme tumor in a gene-dependent manner. Int J Mol Sci. 2015;16(10):25214–25233. | ||
Dyjak S, Kiciński W, Norek M, et al. Hierarchical, nanoporous graphenic carbon materials through an instant, self-sustaining magnesiothermic reduction. Carbon. 2016;96:937–946. | ||
Jaworski S, Sawosz E, Kutwin M, et al. In vitro and in vivo effects of graphene oxide and reduced graphene oxide on glioblastoma. Int J Nanomedicine. 2015;10:1585–1596. | ||
Grodzik M, Sawosz E. Nanoparticles of carbon allotropes inhibit glioblastoma multiforme angiogenesis in ovo. Int J Nanomedicine. 2011;6:3041–3048. https://www.scienceopen.com/document_file/7e391eba-7461–45c0–91b1-ca75457a0747/PubMedCentral/7e391eba-7461–45c0–91b1-ca75457a0747.pdf. Accessed July 15, 2014. | ||
Zakrzewska KE, Samluk A, Wierzbicki M, et al. Analysis of the cytotoxicity of carbon-based nanoparticles, diamond and graphite, in human glioblastoma and hepatoma cell lines. PLoS One. 2015;10(3):e0122579. | ||
Fiorito S, Serafino A, Andreola F, Togna A, Togna G. Toxicity and biocompatibility of carbon nanoparticles. J Nanosci Nanotechnol. 2006;6(3):591–599. | ||
Jarosz A, Skoda M, Dudek I, Szukiewicz D. Oxidative stress and mitochondrial activation as the main mechanisms underlying graphene toxicity against human cancer cells. Oxid Med Cell Longev. 2016;2016:5851035. | ||
Yuan J, Gao H, Sui J, Duan H, Chen WN, Ching CB. Cytotoxicity evaluation of oxidized single-walled carbon nanotubes and graphene oxide on human hepatoma HepG2 cells: an iTRAQ-coupled 2D LC-MS/MS proteome analysis. Toxicol Sci. 2012;126(1):149–161. | ||
Wong RSY. Apoptosis in cancer: from pathogenesis to treatment. J Exp Clin Cancer Res. 2011;30:87. | ||
Cohen GM. Caspases: the executioners of apoptosis. Biochemical J. 1997;326(Pt 1):1–16. | ||
Montellano A, Da Ros T, Bianco A, Prato M. Fullerene C60 as a multifunctional system for drug and gene delivery. Nanoscale. 2011;3(10):4035–4041. | ||
Wang X, Low XC, Hou W, et al. Epirubicin-adsorbed nanodiamonds kill chemoresistant hepatic cancer stem cells. ACS Nano. 2014;8(12):12151–12166. |
 © 2017 The Author(s). This work is published and licensed by Dove Medical Press Limited. The full terms of this license are available at https://www.dovepress.com/terms.php and incorporate the Creative Commons Attribution - Non Commercial (unported, v3.0) License.
By accessing the work you hereby accept the Terms. Non-commercial uses of the work are permitted without any further permission from Dove Medical Press Limited, provided the work is properly attributed. For permission for commercial use of this work, please see paragraphs 4.2 and 5 of our Terms.
© 2017 The Author(s). This work is published and licensed by Dove Medical Press Limited. The full terms of this license are available at https://www.dovepress.com/terms.php and incorporate the Creative Commons Attribution - Non Commercial (unported, v3.0) License.
By accessing the work you hereby accept the Terms. Non-commercial uses of the work are permitted without any further permission from Dove Medical Press Limited, provided the work is properly attributed. For permission for commercial use of this work, please see paragraphs 4.2 and 5 of our Terms.