")
Back to Journals » International Journal of General Medicine » Volume 14
Analysis of Risk Factors for Changes in the Renal Two-Dimensional Image in Gout Patients
Authors Dang W, Xu X, Luo D, Luo H , Hu J, Zhou J, Liu J, You L
Received 26 August 2021
Accepted for publication 23 September 2021
Published 5 October 2021 Volume 2021:14 Pages 6367—6378
DOI https://doi.org/10.2147/IJGM.S336220
Checked for plagiarism Yes
Review by Single anonymous peer review
Peer reviewer comments 2
Editor who approved publication: Dr Scott Fraser
Wantai Dang,1,* Xiaohui Xu,2,* Danling Luo,2 Hui Luo,2 Jin Hu,2 Jingguo Zhou,1 Jian Liu,2 Lanlan You2
1Department of Rheumatism and Immunity, Clinical Medical College and The First Affiliated Hospital of Chengdu Medical College, Chengdu, Sichuan, 610500, People’s Republic of China; 2Department of Ultrasound, Clinical Medical College and The First Affiliated Hospital of Chengdu Medical College, Chengdu, Sichuan, 610500, People’s Republic of China
*These authors contributed equally to this work
Correspondence: Lanlan You Email [email protected]
Objective: To explore the effects of different blood uric acid levels in gout patients on the two-dimensional image of the kidney and the risk factors for gout-related kidney damage for providing clinical evidence to enable early prevention and treatment of gout-related kidney damage.
Methods: We obtained information of 227 patients with primary gout and estimated the association between two-dimensional kidney images and clinical indicators using binary logistic regression.
Results: Our study showed that different uric acid levels, age, disease course, cystatin C (CysC) level, and γ-glutamyl transpeptidase level were correlated with echo of the renal medulla (P < 0.05). CysC level was correlated with the renal cortex thickness and kidney stones in different uric acid-level groups (P < 0.05). Disease course, aspartate transaminase (AST) level, creatinine (CREA) level, and tophi were risk factors for renal cortex thinning in gout patients (P = 0.045, 0.026, 0.004, 0.006, respectively). The disease course, platelet (PLT) count, and high-density lipoprotein (HDL-C) level were risk factors for kidney stone formation in gout patients (P = 0.037, 0.022, 0.023, respectively), while CysC level and C-reactive protein (CRP) level were risk factors for increased renal medulla echo in these patients (P = 0.022, 0.028, respectively).
Conclusion: Our study revealed disease course, AST level, CREA level, tophi, PLT count, HDL-C level, CysC level and CRP level may be important predictors of renal image changes.
Keywords: gout, two-dimensional ultrasound, renal medulla, renal cortex, kidney stones
Introduction
Gouty arthritis is currently one of the most common types of inflammatory arthritis across the world.1 It is a metabolic and inflammatory immune disease caused by impaired purine metabolism and/or decreased excretion of uric acid. With continuous increase in the blood uric acid level, the precipitation of monosodium urate (MSU) crystals and deposition is observed in the tissues or organs, and then cause a series of pathological processes, such as: activate the NLRP3 inflammasome, and this activation involves several molecular mechanisms including xanthine oxidase up-regulation and mitochondrial dysfunction.2 Urate is the degradation product of purines, the main sources of which are cell turnover, dietary intake and de novo synthesis.3 The synthesis of uric acid (UA) primarily occurs in liver. Xanthine oxidase (XO) are the key enzymes responsible for the synthesis of UA in purine metabolism.4 It is a crucial enzyme in purine metabolism, catalyzes the oxidation of hypoxanthine and xanthine to UA. XO catalyzes the oxidation of xanthine and hypoxanthine into UA. In addition, during such oxidation process XO generates reactive oxygen species (ROS) and hydrogen peroxide leading to oxidative stress. The hyperuricemia and oxidative stress caused by XO are considered as important factors that results in gout.5 Hence, Some studies investigate xanthine oxidase (XO) inhibitory activity in order to contribute to antihyperuricemic effect.6 Studies have confirmed that gout independently increases the risk of advanced kidney disease, and the degree of kidney damage in gout patients is 57% higher than that in the general population.1 Many studies have shown that gout patients can experience kidney damage with disease progression and that kidney damage can reduce the excretion of uric acid and accelerate the formation of tophi.7,8 Studies have confirmed that high levels of serum uric acid (SUA) can activate the renin-angiotensin system, causing renal vasoconstriction; further, it can induce renal interstitial inflammation. Elevated uric acid levels induce a decrease in NO synthesis and an increase in blood pressure via the stimulation of the renin–angiotensin system. Indeed, one experimental studies have shown that UA can stimulate oxidative stress, reduce NO bioavailability, and stimulate the intracellular renin-angiotensin system in human endothelial cells; Ko J etc. have also reported that a decrease in NO production, an activation of renin production, and a rarefaction of peritubular capillaries (PTCs) preceded the development of interstitial fibrosis. Both the hemodynamic and structural changes could play a role in how UA may cause kidney disease.9 Therefore, the assessment of renal function in patients with gout is very important for predicting renal damage.10–12 Ultrasonography (US) has good diagnostic accuracy and high specificity in the diagnosis of gout. It can accurately detect the hyperechoic crystal deposition in the renal medulla of gout patients13 and can visually observe the shape, size, and echo of the kidney to assess the condition of the kidney.14,15 However, the influence of different blood uric acid levels in patients with gout on the two-dimensional kidney images and the related clinical indicators remains unclear. Therefore, we aimed to explore the impact of different blood uric acid levels in patients with gout on the two-dimensional kidney images and the related clinical indicators, to explore the risk factors for kidney damage in these patients, and to provide clinical evidence for the early prevention and treatment of gout-related kidney damage.
Materials and Methods
Participants
A total of 227 patients with primary gout in the intermittent period were enrolled (Figure 1). As per the inclusion criteria, patients with primary gout that was diagnosed as per the 2015 American Academy of Rheumatology/European Anti-Rheumatism Alliance Gout Classification Diagnostic Criteria16 and those who had not been given uric acid-reducing treatment or other related treatments in the previous 3 months were included (Patients with hypertension, diabetes and hyperlipidemia did not receive drug intervention). Primary gout is caused by congenital purine metabolism disorder and (or) uric acid excretion disorder on the basis of excluding other diseases, rather than secondary to kidney disease or some drugs caused by decreased uric acid excretions, myeloproliferative disease and tumor chemotherapy resulting in increased uric acid production. Based on the exclusion criteria, patients with severe diseases, such as diseases of the heart, liver, kidney, lung, and endocrine system; patients with rheumatoid arthritis, systemic lupus erythematosus, or other autoimmune diseases (These immune disorders were ruled out by testing for rheumatoid factor and anti-citrullinated peptide autoantibodies and other immune-related indicators); patients with bone tumors, bone tuberculosis, and systemic infectious diseases; patients with secondary gout caused by radiotherapy, chemotherapy, drugs, and blood diseases; patients with pseudogouty arthritis; patients undergoing long-term hormone therapy; patients with a serious illness that might affect the results of this study; previous diseases such as diabetes, hypertension and chronic nephritis can cause kidney damage; and those who refused to provide informed consent for study participation were excluded from the trial. The study population included 219 men and 8 women, aged 20–90 years, with an average age of 46.352 ± 14.94 years. The study subjects were grouped as per the quartile of SUA level, as follows: Q1 was SUA ≤ 436 μmol/L, Q2 was 436 μmol/L < SUA ≤ 513 μmol/L, Q3 was 513 μmol/L < SUA ≤ 611 μmol/L, and Q4 was SUA > 611 μmol/L. This study was approved by the Medical Ethics Committee of the First Affiliated Hospital of Chengdu Medical College, and informed consent was obtained from all the subjects.
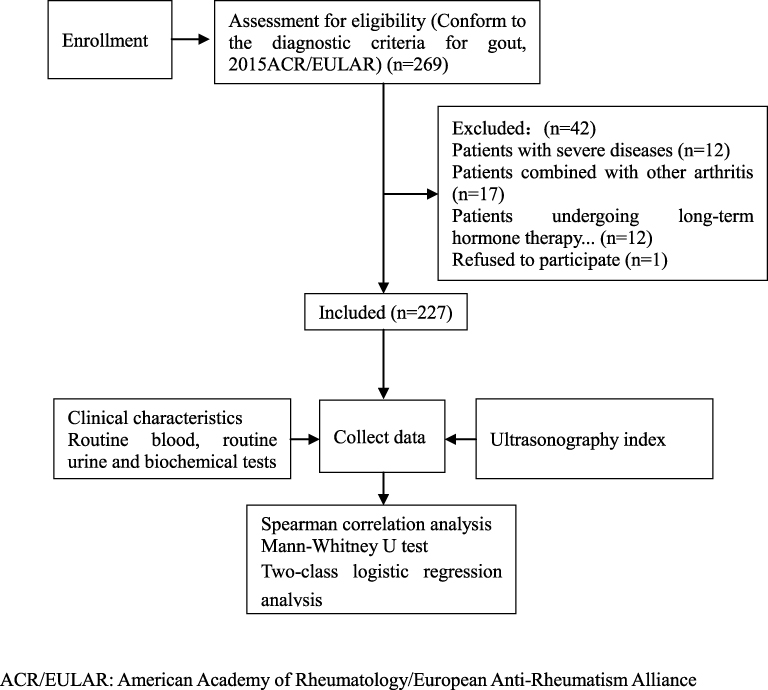 |
Figure 1 CONSORT flow diagram. Abbreviation: ACR/EULAR, American Academy of Rheumatology/European Anti-Rheumatism Alliance. |
Methods
Medical History Taking
Information about the patients’ medical history was collected in detail; we recorded the following details: sex, age, disease course, presence or absence of tophi, and the disease was secondary to hypertension and/or diabetes. Moreover, a unified standard method was used to measure the height and weight of the patients, using which their body mass index (BMI) values were calculated. The formation of tophi in the corresponding joints was observed and recorded by the investigator.
Sample Collection of Routine Blood and Biochemical Tests
Venous blood was collected after an overnight fast from the patients. The patients did not consume any food or drink for at least 8 hours before the sample collection. On the day of sample collection, early in the morning, 5 mL of cubital venous blood was collected from each patient and placed in heparin anticoagulation tubes. After centrifugation at 3000 rpm for 5 min, the plasma was separated from each sample, sealed in individual EP tubes, and stored in a refrigerator at −20°C for testing various indicators. The measurement of liver function metabolism-related indicators, kidney function-related indicators, electrolytes, urinary uric acid (UUA), and C-reactive protein (CRP) level was performed using 7600 automatic biochemical analyzer (Hitachi Limited, Tokyo, Japan). The erythrocyte sedimentation rate (ESR) was measured with the MONITOR-100 erythrocyte sedimentation rate analyzer (Vital Diagnostics S.r.l., Balzella, Italy). The complete blood routine was tested using the XN-9000 whole blood automatic analyzer (Sysmex Corporation, Kobe, Japan), and the complete urine routine was tested using the UF-4000 automatic urine analyzer (Sysmex Corporation, Kobe, Japan). In addition, the MORD formula was used to calculate the estimated glomerular filtration rate (eGFR).
Ultrasonography
The EPIQ7c ultrasonic imaging instrument (PHILIPS, Washington, USA) with convex array probe was used. The probe frequency was 1–5 MHz, and the abdominal kidney mode was selected. The subject was made to lie on his/her back or side, with the probe at the posterior axillary line, directing the sound beam inside and forward, for longitudinal scanning. The liver and spleen were taken as the acoustic window to obtain the largest coronal surface of the kidney. The kidney under the coronal plane was broad bean-shaped convex and concave, and the middle part of the kidney was the hilar structure. The longitudinal section of the kidney of a healthy person is elliptical or flat oval, with a smooth and clear capsule. Compared with the echo of the liver parenchyma, the renal cortex had a uniform mid-to-low echo, and the renal medulla was composed of renal cones.17 The renal cones were round or triangular with weak echo, as depicted in (Figure 2C). The tip of the vertebral body was blunt and round, extending to the renal sinus, called the renal papilla. In the early stage of gout, the stones were small, distributed in the papilla of the kidney, and there was generally no sound in the back. US has high sensitivity and specificity for large calculi (≥5 mm); therefore, this test defined the intrarenal hyperechoic light mass ≥ 5 mm as having calculus,18 as shown in (Figure 2B). With disease progression, strong echoic light clusters were visible throughout the renal cone and were arranged in a radial pattern, followed by sound and shadow,19 as shown in (Figure 2A). The anteroposterior, left-right, and up-and-down diameters of the left and right kidneys of 227 patients with primary gout were measured, and the average of the left and right kidney volumes were calculated. Meanwhile, the cortical thickness and parenchymal thickness of the left and right kidneys were measured, and the average value was determined. Moreover, we confirmed whether the renal medulla echo was higher (radial) than the adjacent cortex echo and whether kidney stones were present.14
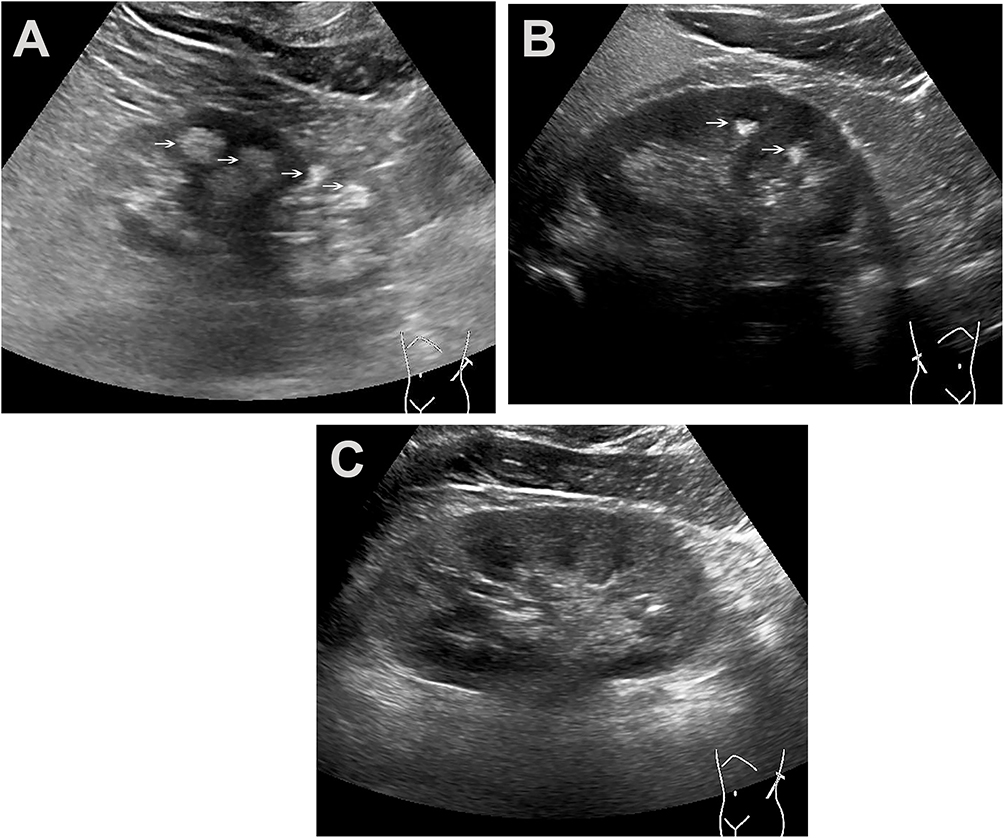 |
Figure 2 Ultrasound examination of the kidney in a patient with gout. (A) The largest coronal surface of the kidney in the patient’s lateral position shows that the right renal medulla of the patient with gout has increased echo (indicated by the yellow arrow). (B) The largest coronal view of the kidney from a patient in lateral decubulation, showing a pyramidal stone in a patient with gout (indicated by the yellow arrow). (C) Maximum coronal view of ultrasonography kidney image of a normal patient in lateral decubitus position. |
Statistical Analyses
SPSS22.0 software (IBM, Armonk, NY, USA) was used for performing all the statistical analyses. Normally distributed data are expressed as mean ± standard deviation (x ± s) values. Spearman correlation analysis was used to evaluate the relationship between variables, and the Mann–Whitney U-test was used to test whether the difference between the analysis groups was significant. Two-class logistic regression analysis was performed, and the results were considered statistically significant at P < 0.05.
Results
Clinical Characteristics and Ultrasonography Index Statistics
This study involved 227 patients, including 8 women (3.5%) and 219 men (96.5%); 42 patients (18.5%) had hypertension, while 185 (81.5%) did not have hypertension. Twenty-eight patients (12.3%) had diabetes, while 199 (87.7%) did not; 172 patients (75.6%) had tophi, while 55 (24.4%) did not have tophi (Table 1). (Hypertension, diabetes patients are secondary to gout, rather than the primary).
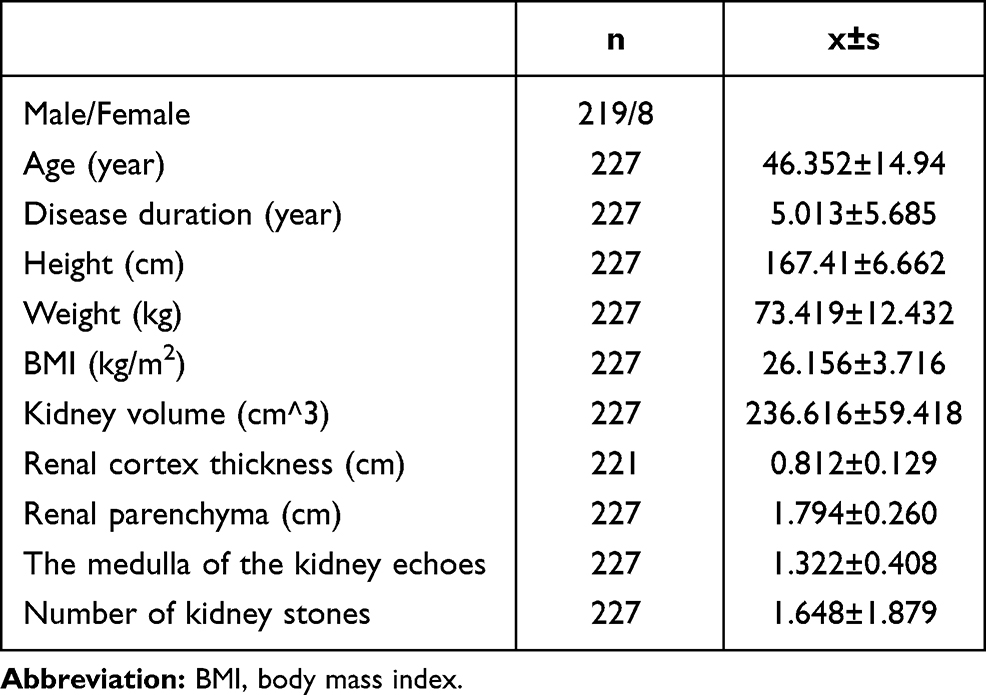 |
Table 1 Analysis of Clinical Characteristics and Ultrasonic Indicators of Patients with Gout |
The Correlation Between SUA Level and Laboratory Indicators in Patients with Gout
Serum uric acid (SUA) levels were positively correlated with basophil (BA), alanine aminotransferase (ALT), aspartate transaminase (AST), UREA (urea), CREA, estimated glomerular filtration rate (eGFR), CysC, β2-microglobulin (β2-MG), triglycerides (TG), total protein (TP) and albumin (ALB). The serum uric acid (SUA) level was negatively correlated with pH and fasting plasma glucose (FPG) (P < 0.05) (Table 2).
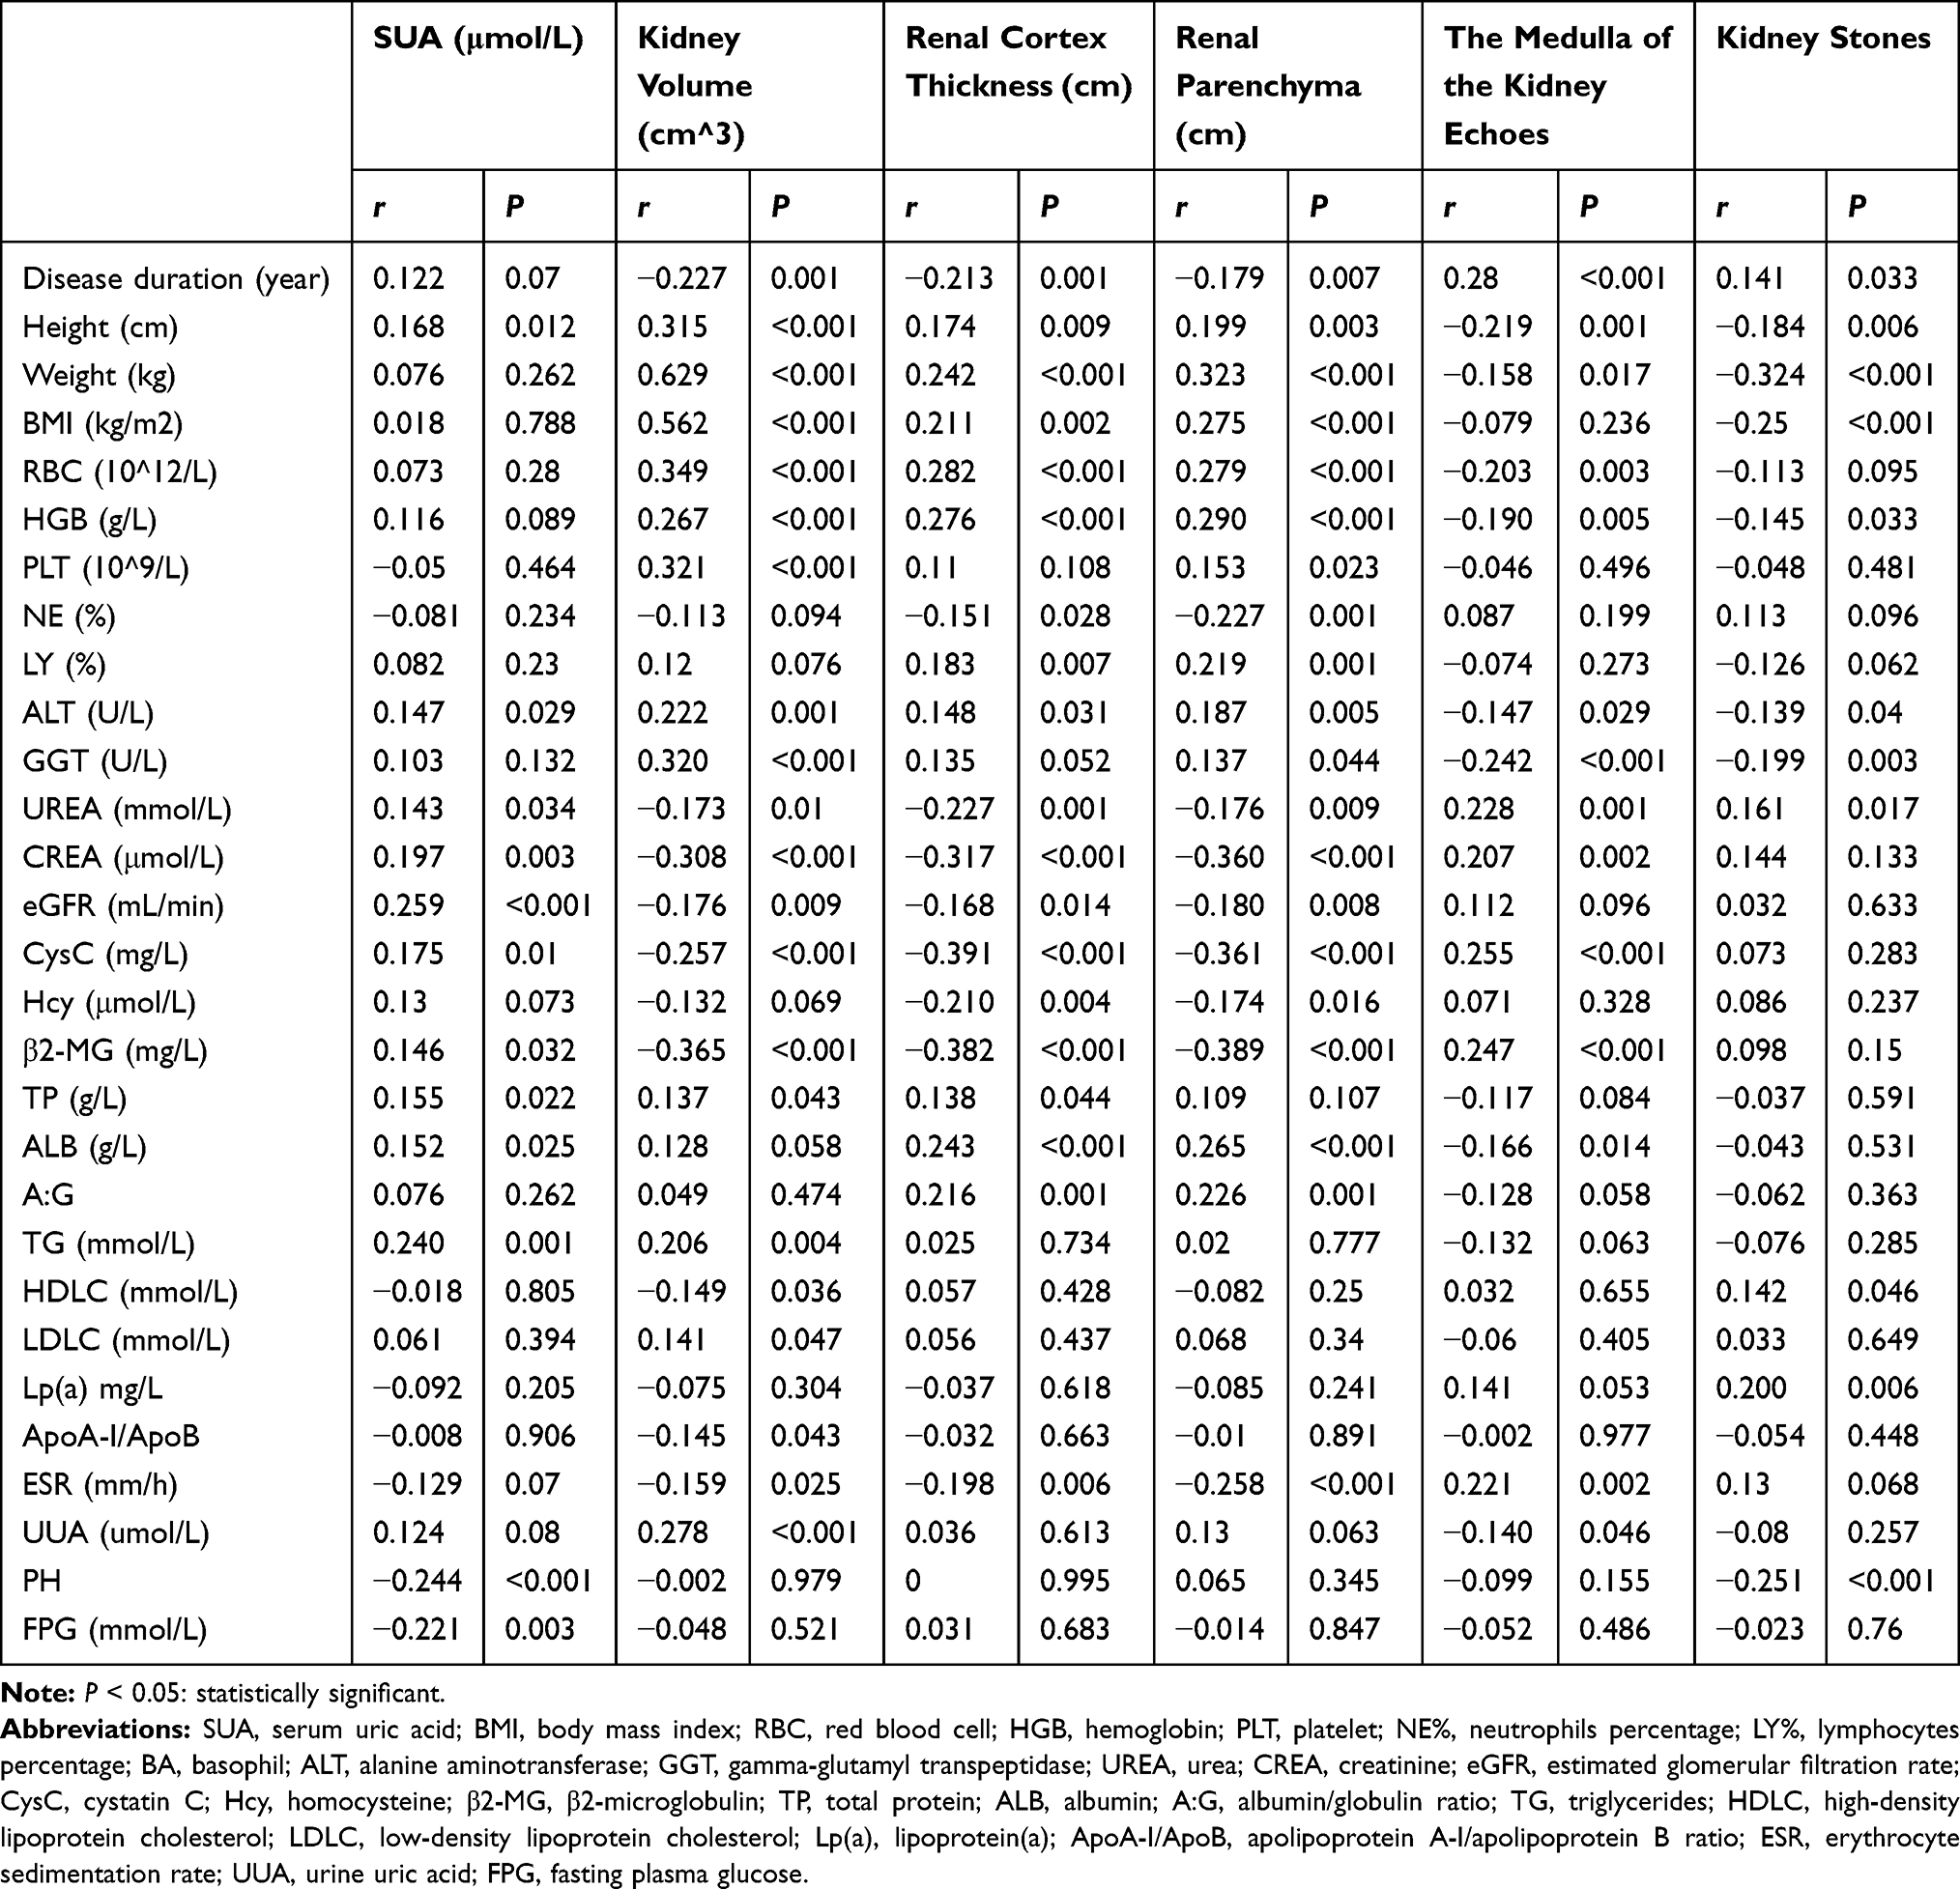 |
Table 2 Correlation Analysis of SUA and Ultrasonic Indexes with Laboratory Indexes |
The Correlation of Ultrasonography Indicators with General Condition and Laboratory Indicators in Patients with Gout
Kidney volume was positively correlated with height, weight, BMI, red blood cell (RBC) count, hemoglobin (HGB) level, platelet (PLT), ALT, GGT, UAA, TP, TG, and low-density lipoprotein cholesterol (LDL-C), while it was negatively correlated with age, disease course, urea level, creatinine (CREA) level, eGFR, cystatin C (CysC), β2-microglobulin (β2-MG), high-density lipoprotein cholesterol (HDL-C) level, apolipoprotein A-I/apolipoprotein B (ApoA-I/ApoB) ratio, and ESR (P < 0.05) (Table 2).
The thickness of the renal cortex was positively correlated with height, weight, BMI, RBC, HGB level, lymphocytes percentage (LY%), ALT, TP, albumin, and white sphere ratio A:G, while it was negatively correlated with age, disease course, neutrophil percentage (NE%) count, urea level, CREA level, eGFR, CysC level, β2-MG level, homocysteine (Hcy) level, and ESR (P < 0.05) (Table 2).
The parenchymal thickness of the kidney was positively correlated with the height, weight, BMI, RBC count, HGB level, PLT count, LY%, mononuclear cells (MO), ALT level, GGT level, albumin level, and white sphere ratio, while it was negatively correlated with age, disease course, NE%, urea level, CREA level, eGFR, CysC level, β2-MG level, and ESR (P < 0.05) (Table 2).
The echo of the renal medulla was positively correlated with age, disease course, urea level, CREA level, CsyC level, β2-MG level, and ESR, and it was negatively correlated with height, weight, RBC count, HGB level, BA, ALT level, GGT level, ALB level, and UUA level (P < 0.05) (Table 2).
Kidney stones were positively correlated with disease course, urea level, CREA level, HDL-C level, and lipoprotein A level, and it was negatively correlated with height, weight, BMI, HGB level, ALT level, GGT level, and PH value (P < 0.05) (Table 2).
Intra-Group Correlation Analysis Between the Groups with Different Levels of Blood Uric Acid
Patients were grouped as per the quartile of the SUA level, as follows: Q1 was SUA ≤ 436 μmol/L, Q2 was 436 μmol/L < SUA ≤ 513 μmol/L, Q3 was 513 μmol/L < SUA ≤ 611 μmol/L, and Q4 was SUA > 611 μmol/L.
When the SUA level was in the range of 436 μmol to 513 μmol/L and 513 μmol/L to 611 μmol/L, the thickness of the renal cortex was negatively correlated with the CysC level (r = −0.446, P = 0.001; r = −0.409, P = 0.002). When the range of SUA was > 611 μmol/L, the renal medulla echo was positively correlated with the CysC level (r = 0.292, P = 0.034). When the SUA level was 513–611 μmol/L, the renal medulla echo was negatively correlated with the GGT level (r = −0.460, P < 0.001); further, there was a positive correlation between kidney stones and the CysC level (r = 0.367, P = 0.005).
Binary Logistic Regression Analyses
With the thickness of the renal cortex set as the dependent variable Y and adjusting for confounding factors such as height, weight, BMI, CREA level, CysC level, and β2-MG level etc., binary logistic regression analysis was performed. The results showed that the disease course [OR = 0.872 (0.762, 0.997)], AST level [OR = 0.911 (0.84, 0.989)], CREA level [OR = 0.345 (0.167, 0.713)], and tophi [OR = 0.12 (0.026, 0.551)] were risk factors for the thinning of the renal cortex in gout patients (Figure 3A).
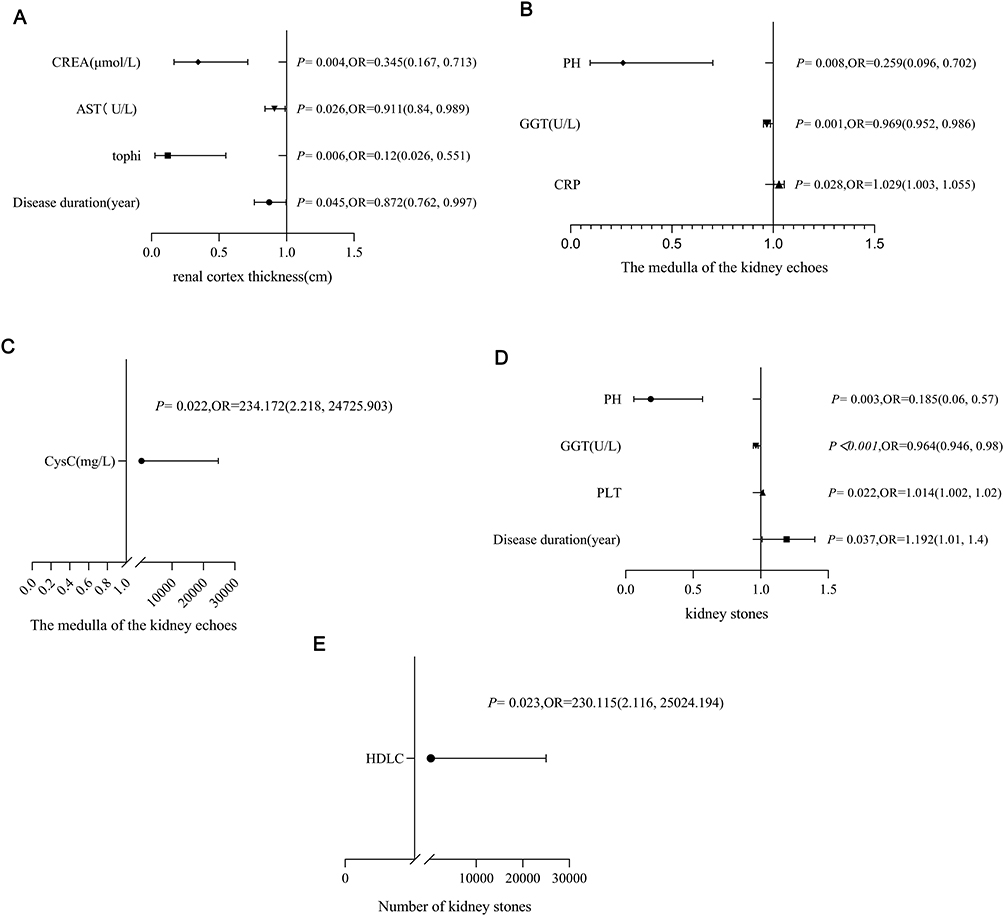 |
Figure 3 Logistic regression analysis of renal ultrasound parameters and laboratory indexes in patients with gout. P < 0.05: statistically significant. (A) Risk factors for renal cortical thickness, showing that disease duration, AST, CREA and tophi were risk factors of renal cortical thinning in patients with gout. [OR (95% CI) were respectively 0.872 (0.762, 0.997), 0.911 (0.84, 0.989), 0.345 (0.167, 0.713), 0.12 (0.026, 0.551)]. (B and C) Risk factors for renal medulla echo, showing that CRP and CysC are risk factors of renal hyperechogenicity of renal medulla in patients with gout [OR (95% CI) were respectively 1.029 (1.003, 1.055), 234.172 (2.218, 24725.903)].PH and GGT are protective factors of renal hyperechogenicity of renal medulla in patients with gout [OR (95% CI) were respectively 0.259 (0.096, 0.702), 0.969 (0.952, 0.986)], Among them, GGT protection factor is weak. (D and E) Risk factors for the presence of renal stones, showing that disease duration, PLT and HDL-C are the risk factors for gout patients with nephrolithiasis [OR (95% CI) were respectively 1.192 (1.01, 1.406), 1.014 (1.002, 1.027), 230.115 (2.116, 25024.194)], PH and GGT are protective factors of kidney stone formation in patients with gout [OR (95% CI) were respectively 0.185 (0.06, 0.574), 0.964 (0.946, 0.983)], Among them, GGT protection factor is weak. Abbreviations: CREA, creatinine; AST, aspartate transaminase; GGT, gamma-glutamyl transpeptidase; CRP, C reactive protein; CysC, cystatin C; PLT, platelet; HDL-C, high-density lipoprotein cholesterol. |
With the renal medulla echo set as the dependent variable Y and adjusting for confounding factors such as disease duration, height, weight, BMI, urea level, CREA level and β2-MG level etc., binary logistic regression analysis was performed. The results showed that PH value [OR = 0.259 (0.096, 0.702)], GGT [OR = 0.969 (0.952, 0.9896)] were the protective factors for hyperechoic renal medulla in gout patients, while CysC level [OR = 234.172 (2.218, 24725.903)] and CRP level [OR = 1.029 (1.003, 1.055)] were risk factors for high echo of the renal medulla in gout patients (Figure 3B and C).
Binary logistic regression analysis was performed using the number of kidney stones as the dependent variable Y and adjusting for confounding factors such as age, height, weight, BMI, WBC count, RBC count, HGB level, NE%, LY% etc., The results showed that the disease course [OR = 1.192 (1.01, 1.406)] and PLT count [OR=1.014 (1.002, 1.027)] were risk factors for a larger number of kidney stones in gout patients, and PH value [OR = 0.185 (0.06, 0.998)] was a protective factor for kidney stones (Figure 3D and E).
Discussion
Gouty arthritis is one of the most common inflammatory arthritis worldwide. The global prevalence of this disorder is about 1% to 6.8%,20 and the incidence is about 0.58–2.89/1000 people/year. Gout is more common in men than in women. Despite the increasing prevalence and incidence of gout, it is poorly managed in many countries. Kidney damage is a common complication in patients with primary gout20 with a high incidence. It is one of the main reasons for the decline in the quality of life and an increase in the mortality rate of patients with primary gout. Current studies have shown that the main cause of kidney damage in gout may be closely related to the deposition of urate in the kidney tissue21 that leads to chronic progressive interstitial inflammation of the kidneys, renal tubular atrophy, degeneration, fibrosis, and sclerosis. Patients with chronic kidney disease (CKD) have a high prevalence of accelerated inflammation and endothelial dysfunction. Hyperuricaemia is associated with endothelial dysfunction. Decreased nitric oxide bioavailability may be the main reason.22 Studies have shown that,23 especially for gout patients with initial symptoms of related kidney diseases before the age of 30 y, early detection and timely intervention can alleviate renal damage, improve renal function, and resolve primary gout. Moreover, it is noteworthy that such management can improve the life quality and reduce the mortality rate in gout patients.
Our research found that the development of tophi, disease course, CREA level, and AST level of joint tophi were risk factors for the thinning of the renal cortex in gout patients. Studies have shown that in comparison to patients without tophi, early gout patients with tophi tend to show significantly higher BMI and SUA levels at an early stage, with lower eGFR. Moreover, it is known that high SUA levels and gout duration are the main determinants of tophi formation.24 In the clinical diagnosis and treatment process, US can enable early detection of the deposition of urate crystals in the joints and kidneys of patients and facilitate early identification of patients with asymptomatic hyperuricemia.25,26 Our study found an increased risk of renal cortex thinning in patients with gout combined with articular tophi. This result indicated the possibility of performing early renal US in patients with articular tophi for the early detection of renal damage. Moreover, we found that the longer the course of gout patients, the higher the risk of thinning of the renal cortex. This result further suggested that early detection and early intervention of gout patients were extremely important to prevent gout-induced kidney damage. It is known that CREA is a product of muscle metabolism in the human body and is mainly filtered by the glomerulus and excreted from the body. If the glomerular filtration capacity decreases, the serum CREA concentration rises proportionately. If the blood creatinine value is higher than the normal value, it indicates kidney damage; therefore, the blood CREA level can more accurately reflect renal parenchymal damage.27,28 Our research found that the higher the CREA level, the higher the risk of renal cortex thinning in gout patients, suggesting that in the clinical diagnosis and treatment process, we could indirectly predict renal function impairment through the US changes in the renal cortex. In contrast, we could also use the blood CREA level to predict the related changes in the renal cortex indirectly. Moreover, our research showed that the higher the AST, the higher the risk of renal cortex thinning in gout patients. Although the AST level is an indicator of liver metabolism and appears to exert limited influence on the kidneys, genome-wide association studies29,30 have confirmed that the kidneys, intestines, and liver are related sites for uric acid regulation. Therefore, changes in AST may be an indirect risk factor for the thinning of the renal cortex in gout patients.
Our study found that the echo of the renal medulla in gout patients tended to be increased. Our results showed that when the uric acid level was 436–611 μmol/L, the thickness of the renal cortex was negatively correlated with the CysC level; when the range of the SUA level was > 611 μmol/L, the echo of the renal medulla was positively correlated with the CysC level. In addition, when the range of SUA level was 513–611 μmol/L, there was a positive correlation between the presence of kidney stones and CysC level. It could be inferred that the higher the level of uric acid in gout patients, the more severe the damage to the renal cortex and the medulla. Therefore, CysC and kidney stones are closely related to the renal damage caused by high uric acid levels. Moreover, logistic regression analysis showed that CysC and CRP levels were risk factors for increased renal medulla echo in gout patients. Previous studies have found that CysC level can reflect the changes in renal function more sensitively in patients with hydronephrosis caused by ureteral stones.31 Meanwhile, as per previous studies, in patients with acute kidney injury, the CysC level could predict the recovery of the kidney earlier than creatinine level.32 CysC level can detect the changes in renal function earlier and more sensitively; Research work has demonstrated that CysC is a sensitive indicator for the diagnosis of early renal damage.33 Previous studies have suggested that UA-induced endothelial dysfunction in the kidney is a major mechanism of renal disease via induction of impaired vasodilatation and hemodynamic alteration. Vascular diseases might be associated with hyperuricemia, which leads to endothelial cell damage and vascular smooth muscle cell proliferation. CysC might be a marker for renal function damage and inflammation. Hyperuricemia is the risk factor of renal disorder in gout patients.34 Therefore, dynamic monitoring of CysC has important clinical significance in the assessment of the degree of kidney damage.35,36 Our results further suggested that CysC had important significance in the assessment of early renal damage in gout patients. It is known that the serum CRP concentration is increased during the acute phase of gout. Studies have confirmed that CRP is the main MSU binding protein,37 and CRP can enhance the binding of C1qB and MSU crystals in human serum. However, it is unclear whether the combination of CRP and MSU crystals will regulate inflammation in the acute phase or whether this is an ineffective attempt by the immune system to clear the crystals. Our research showed that the increased combination of CRP and MSU crystals might accelerate the deposition of MSU crystals in the kidney that increases the echo of the renal medulla under ultrasonography. Our research also found that when the uric acid level was 513–611 μmol/L, the renal medulla echo was negatively correlated with the GGT level. Furthermore, the logistic regression analysis showed that GGT was a weak protective factor for the elevation of kidney stones and renal medulla echo in gout patients. It is known that GGT is an enzyme located outside the cell membrane and is widely distributed in human tissues, with the highest proportion being present in the kidneys.38 Increased GGT activity is an important sign of increased oxidative stress and insufficient anti-oxidation. Research has shown that increased GGT activity is associated with an increased risk of cardiovascular disease.39 Moreover, elevated serum GGT level can predict the occurrence of metabolic syndrome and cardiovascular disease.39–42 The results of our study contradicted those reported by previous studies. The mechanism might be related to the enhancement of GGT activity to compensate for oxidative stress, and its increase could be an early marker of early kidney damage. However, the present results need to be confirmed in future studies on larger samples.
The prevalence of kidney stones in gout patients is very high.43 Our study found that the disease course, PLT count, and HDL-C level were risk factors for kidney stones in gout patients. Previous studies have shown that patients with gout tend to show hyperactivity of platelets.44 It is known that glycoprotein VI (GPVI) receptors exist on platelets and are proteolytically cleaved after platelet activation. During the occurrence and development of gout, especially in the acute phase, platelet activation increases. Therefore, the mechanism by which elevated PLT increases kidney stones in patients with gout may be closely related to the changes in the renal vascular blood flow caused by enhanced platelet activation. This result is crucial for predicting the occurrence of kidney stones in gout patients. However, this result needs to be confirmed by a large number of clinical studies. Previous studies have reported that 61% of gout patients have hyperlipidemia.45 Owing to the composition and biological complexity of HDL, HDL may promote RCT, anti-oxidation, anti-inflammatory, anti-apoptosis, and anti-thrombosis functions. According to the Third National Health and Nutrition Examination Survey Report in the United States, after adjusting for age and sex, elevated high-density lipoproteins in gout patients can lower the risk of gout. Studies have shown46–48 that serum urate-mediated effect between HDL-C and gout, suggesting that elevated HDL-C can reduce serum urate, thus directly affecting gout and indirectly lowering the risk of gout. Our research showed that HDL-C is a risk factor for kidney stone formation in gout patients, and its mechanism might be related to its impaired anti-inflammatory activity. However, this result needs to be confirmed by a large number of clinical studies.
In sum, our study showed that the disease course, AST level, CREA level, and tophi were risk factors for renal cortex thinning in gout patients. Disease course, PLT count, and HDL-C level were risk factors for kidney stone formation in gout patients, and CysC and CRP levels were risk factors for increased renal medulla echo in gout patients. These findings suggested that we should pay attention to the above-mentioned laboratory indicators early in the clinical diagnosis and treatment process to enable early identification and timely intervention of renal changes in patients with gout. To a certain extent, it can early detect the occurrence of kidney damage in gout patients. Our results also showed that in the clinical diagnosis and treatment process, the assessment of renal function in gout patients should focus on the indicator of the CysC level. The increase in this index posed a very high risk for an increase in the renal medulla echo; therefore, it might be an independent risk factor for the increase of renal medulla echo, and early evaluation and intervention of this indicator might be crucial for preventing kidney damage caused by gout. However, owing to the limitation of the sample size, further research on a larger sample is needed.
Data Sharing Statement
Data and materials from this trial are available upon reasonable request and approval by the corresponding author.
Compliance with Ethical Standards
All participants provided informed written consent. All procedures performed in studies involving human participants were in accordance with the ethical standards of the Affiliated Hospital of Chengdu Medical College and with the 1964 Helsinki declaration and its later amendments or comparable ethical standards (2018CYFYIRB-BA-02).
Acknowledgments
This study was made possible by the collaborative efforts of doctors, nurses, and administrators at the recruiting hospital. We thank everyone who contributed their time and expertise.
Author Contributions
All authors made substantial contributions to conception and design, acquisition of data, or analysis and interpretation of data; took part in drafting the article or revising it critically for important intellectual content; agreed to submit to the current journal; gave final approval for the version to be published; and agreed to be accountable for all aspects of the work.
Funding
This work was supported by the National Natural Science Foundation of China (No. 81603441), the Basic Application Research Project of Sichuan Science and Technology Department (No. 2017JY0297), Key Projects of Health Commission of Sichuan Province (No. 18ZD041), the Innovative Team Building Project of Chengdu Medical College (No. CYTD18-03), the School Cooperation Project of Nanchong (No. NSMC20170452), and the Key Projects of The First Affiliated Hospital of Chengdu Medical College (No. CYFY2019ZD01), Project of Sichuan Provincial Administration of traditional Chinese Medicine (No. 2020JC0023). Scientific research project of Sichuan Provincial Health Commission (key research project, No. 19ZD004).
Disclosure
The authors report no conflicts of interest in this work.
References
1. Christiansen SN, Østergaard M, Terslev L. Ultrasonography in gout: utility in diagnosis and monitoring. Clin Exp Rheumatol. 2018;36:61–67.
2. Castelblanco M, Lugrin J, Ehirchiou D, et al. Hydrogen sulfide inhibits NLRP3 inflammasome activation and reduces cytokine production both in vitro and in a mouse model of inflammation. J Biol Chem. 2018;293(7):2546–2557. doi:10.1074/jbc.M117.806869
3. Dalbeth N, Choi HK, Joosten LAB, et al. Gout. Nat Rev Dis Primers. 2019;5(1):69. doi:10.1038/s41572-019-0115-y
4. Le Y, Zhou X, Zheng J, et al. Anti-hyperuricemic effects of astaxanthin by regulating xanthine oxidase, adenosine deaminase and urate transporters in rats. Mar Drugs. 2020;18(12):610. doi:10.3390/md18120610
5. Johnson P, Loganathan C, Iruthayaraj A, Poomani K, Thayumanavan P. S-allyl cysteine as potent anti-gout drug: insight into the xanthine oxidase inhibition and anti-inflammatory activity. Biochimie 2018;154:1–9. doi:10.1016/j.biochi.2018.07.015
6. Tian Y, Lin L, Zhao M, Peng A, Zhao K. Xanthine oxidase inhibitory activity and antihyperuricemic effect of Moringa oleifera Lam. leaf hydrolysate rich in phenolics and peptides. J Ethnopharmacol. 2021;270:113808. doi:10.1016/j.jep.2021.113808
7. Feig DI, Kang D-H, Johnson RJ. Uric acid and cardiovascular risk. N Engl J Med. 2008;359(17):1811–1821. doi:10.1056/NEJMra0800885
8. Johnson RJ, Kang D-H, Feig D, et al. Is there a pathogenetic role for uric acid in hypertension and cardiovascular and renal disease? Hypertension. 2003;41(6):1183–1190. doi:10.1161/01.HYP.0000069700.62727.C5
9. Ko J, Kang HJ, Kim DA, et al. Uric acid induced the phenotype transition of vascular endothelial cells via induction of oxidative stress and glycocalyx shedding. FASEB J. 2019;33(12):13334–13345. doi:10.1096/fj.201901148R
10. Kuo CF, See LC, Luo SF, et al. Gout: an independent risk factor for all-cause and cardiovascular mortality. Rheumatology. 2010;49(1):141–146. doi:10.1093/rheumatology/kep364
11. Kuang-Hui Y, Chang-Fu K, Shue-Fen L, et al. Risk of end-stage renal disease associated with gout: a nationwide population study. Arthritis Res Ther. 2012;14(2):83. doi:10.1186/ar3806
12. Shavit L, Girfoglio D, Vijay V, et al. Vascular calcification and bone mineral density in recurrent kidney stone formers. Clin J Am Soc Nephrol. 2015;10(2):278–285. doi:10.2215/CJN.06030614
13. Lee YH, Song GG. Diagnostic accuracy of ultrasound in patients with gout: a meta-analysis. Semin Arthritis Rheum. 2018;47(5):703–709. doi:10.1016/j.semarthrit.2017.09.012
14. Bardin T, Nguyen QD, Tran KM, et al. A cross-sectional study of 502 patients found a diffuse hyperechoic kidney medulla pattern in patients with severe gout. Kidney Int. 2021;99(1):218–226. doi:10.1016/j.kint.2020.08.024
15. Joseph D, Philipp R, van Langevelde K, et al. Recent developments in advanced imaging in gout. Ther Adv Musculoskelet Dis. 2019;16:11.
16. Tuhina N, Jansen TLTA, Nicola D, et al. 2015 gout classification criteria: an American College of Rheumatology/European League Against Rheumatism collaborative initiative. Ann Rheum Dis. 2015;74(10):1789–1798. doi:10.1136/annrheumdis-2015-208237
17. Quaia E, Correas JM, Mehta M, Murchison JT, Gennari AG, van Beek EJR. Gray scale ultrasound, color Doppler ultrasound, and contrast-enhanced ultrasound in renal parenchymal diseases. Ultrasound Q. 2018;34(4):250–267. doi:10.1097/RUQ.0000000000000383
18. Wong C, Teitge B, Ross M, Young P, Robertson HL, Lang E. The accuracy and prognostic value of point-of-care ultrasound for nephrolithiasis in the emergency department: a systematic review and meta-analysis. Acad Emerg Med. 2018;25(6):684–698. doi:10.1111/acem.13388
19. Grenier N, Merville P, Combe C. Radiologic imaging of the renal parenchyma structure and function. Nat Rev Nephrol. 2016;12(6):348–359. doi:10.1038/nrneph.2016.44
20. Dehlin M, Jacobsson L, Roddy E. Global epidemiology of gout: prevalence, incidence, treatment patterns and risk factors. Nat Rev Rheumatol. 2020;16(7):380–390. doi:10.1038/s41584-020-0441-1
21. Hochberg MC. Seminars in arthritis and rheumatism enters a new decade. Semin Arthritis Rheum. 2010;39(4):223. doi:10.1016/j.semarthrit.2009.11.001
22. Martin WJ, Harper JL. Innate inflammation and resolution in acute gout. Immunol Cell Biolm. 2010;88(1):15–19. doi:10.1038/icb.2009.89
23. Lai S, Dimko M, Galani A, et al. Early markers of cardiovascular risk in chronic kidney disease. Ren Fail. 2015;37(2):254–261. doi:10.3109/0886022X.2014.982489
24. Lu CC, Wu SK, Chung WS, Lin LH, Hung TW, Yeh CJ. Metabolic characteristics and renal dysfunction in 65 patients with tophi prior to gout. Clin Rheumatol. 2017;36(8):1903–1909. doi:10.1007/s10067-017-3663-0
25. Lu CC, Wu SK, Chen HY, Chung WS, Lee MC, Yeh CJ. Clinical characteristics of and relationship between metabolic components and renal function among patients with early-onset juvenile tophaceous gout. J Rheumatol. 2014;41(9):1878–1883. doi:10.3899/jrheum.131240
26. Yoon-Jeong O, Won MK. Presence of tophi is associated with a rapid decline in the renal function in patients with gout. Sci Rep. 2021;11:5684. doi:10.1038/s41598-021-84980-6
27. Sun C, Qi X, Tian Y, Gao L, Jin H, Guo H. Risk factors for the formation of double-contour sign and tophi in gout. J Orthop Surg Res. 2019;14(1):239. doi:10.1186/s13018-019-1280-0
28. Huang Z, Liu X, Liu Y, et al. Clinical characteristics and risk factors of ulceration over tophi in patients with gout. Int J Rheum Dis. 2019;22:1052–1057.
29. Borghi C, Agabiti-Rosei E, Johnson RJ, et al. Hyperuricaemia and gout in cardiovascular, metabolic and kidney disease. Eur J Intern Med. 2020;80:1–11. doi:10.1016/j.ejim.2020.07.006
30. Major TJ, Dalbeth N, Stahl EA, Merriman TR. An update on the genetics of hyperuricaemia and gout. Nat Rev Rheumatol. 2018;14(6):341–353. doi:10.1038/s41584-018-0004-x
31. Liu J. Evaluation of serum cystatin C for diagnosis of acute rejection after renal transplantation. Transplant Proc. 2012;44(5):1250–1253. doi:10.1016/j.transproceed.2012.01.138
32. Mao W, Liu S, Wang K, et al. Cystatin C in evaluating renal function in Ureteral Calculi Hydronephrosis in adults. Kidney Blood Press Res. 2020;45:109–121.
33. Gharaibeh KA, Hamadah AM, El-Zoghby ZM, Lieske JC, Larson TS, Leung N. Cystatin C predicts renal recovery earlier than creatinine among patients with acute kidney injury. Kidney Int Rep. 2018;3(2):337–342. doi:10.1016/j.ekir.2017.10.012
34. Tang H, Zhao Y, Tan C, Liu Y. Significance of serum markers and urinary microalbumin in the diagnosis of Early renal damage in patients with gout. Clin Lab. 2021;67(5). doi:10.7754/Clin.Lab.2020.200722
35. Zhang QB, Zhu D, Wen Z, et al. High levels of serum uric acid, cystain C and lipids concentration and their clinical significance in primary gouty arthritis patients. Curr Rheumatol Rev. 2019;15(2):141–145. doi:10.2174/1573397114666180705095625
36. Xu LL, Gao W, Chen ZM, et al. Relationships between diabetic nephropathy and insulin resistance, inflammation, Trx, Txnip, CysC and serum complement levels. Eur Rev Med Pharmacol Sci. 2020;24:11700–11706.
37. Alberts A, Klingberg A, Wessig AK, et al. C-reactive protein (CRP) recognizes uric acid crystals and recruits proteases C1 and MASP1. Sci Rep. 2020;10(1):6391. doi:10.1038/s41598-020-63318-8
38. Ndrepepa G, Kastrati A. Gamma-glutamyl transferase and cardiovascular disease. Ann Transl Med. 2016;4(24):481. doi:10.21037/atm.2016.12.27
39. Ndrepepa G, Colleran R, Kastrati A. Gamma-glutamyl transferase and the risk of atherosclerosis and coronary heart disease. Clin Chim Acta. 2018;476:130–138. doi:10.1016/j.cca.2017.11.026
40. Lee DS, Evans JC, Robins SJ, et al. Gamma glutamyl transferase and metabolic syndrome, cardiovascular disease, and mortality risk: the Framingham Heart Study. Arterioscler Thromb Vasc Biol. 2007;27(1):127–133. doi:10.1161/01.ATV.0000251993.20372.40
41. Corti A, Belcastro E, Dominici S, Maellaro E, Pompella A. The dark side of gamma-glutamyltransferase (GGT): pathogenic effects of an ‘antioxidant’ enzyme. Free Radic Biol Med. 2020;160:807–819. doi:10.1016/j.freeradbiomed.2020.09.005
42. Obara R, Kamiya M, Tanaka Y. γ-Glutamyltranspeptidase (GGT)-activatable fluorescence probe for durable tumor imaging. Angew Chem Int Ed Engl. 2021;60(4):2125–2129. doi:10.1002/anie.202013265
43. Viljoen A, Chaudhry R, Bycroft J. Renal stones. Ann Clin Biochem. 2019;56(1):15–27. doi:10.1177/0004563218781672
44. Conway R, Murphy C-L, Madigan A, et al. Increased platelet reactivity as measured by plasma glycoprotein VI in gout. Platelets. 2018;29(8):821–826. doi:10.1080/09537104.2017.1366974
45. Elfishawi MM, Zleik N, Kvrgic Z, et al. The rising incidence of gout and the increasing burden of comorbidities: a population-based study over 20 years. J Rheumatol. 2018;45(4):574–579. doi:10.3899/jrheum.170806
46. Yu X, Wang T, Huang S, Zeng P. Evaluation of the causal effects of blood lipid levels on gout with summary level GWAS data: two-sample Mendelian randomization and mediation analysis. J Hum Genet. 2021;66(5):465–473. doi:10.1038/s10038-020-00863-0
47. Wang Y, Wang Y, Jia X, et al. The anti-inflammatory properties of HDLs are impaired in gout. Clin Rheumatol. 2021;40(4):1525–1531. doi:10.1007/s10067-020-05374-z
48. Liang J, Jiang Y, Huang Y, et al. The comparison of dyslipidemia and serum uric acid in patients with gout and asymptomatic hyperuricemia: a cross-sectional study. Lipids Health Dis. 2020;19(1):31. doi:10.1186/s12944-020-1197-y
 © 2021 The Author(s). This work is published and licensed by Dove Medical Press Limited. The full terms of this license are available at https://www.dovepress.com/terms.php and incorporate the Creative Commons Attribution - Non Commercial (unported, v3.0) License.
By accessing the work you hereby accept the Terms. Non-commercial uses of the work are permitted without any further permission from Dove Medical Press Limited, provided the work is properly attributed. For permission for commercial use of this work, please see paragraphs 4.2 and 5 of our Terms.
© 2021 The Author(s). This work is published and licensed by Dove Medical Press Limited. The full terms of this license are available at https://www.dovepress.com/terms.php and incorporate the Creative Commons Attribution - Non Commercial (unported, v3.0) License.
By accessing the work you hereby accept the Terms. Non-commercial uses of the work are permitted without any further permission from Dove Medical Press Limited, provided the work is properly attributed. For permission for commercial use of this work, please see paragraphs 4.2 and 5 of our Terms.