")
Back to Journals » Cancer Management and Research » Volume 13
Analysis of m6A-Related lncRNAs for Prognosis Value and Response to Immune Checkpoint Inhibitors Therapy in Hepatocellular Carcinoma
Authors Wang Y , Li N , Tian D, Zhou CW, Wang YH, Yang C, Zeng MS
Received 8 June 2021
Accepted for publication 29 July 2021
Published 16 August 2021 Volume 2021:13 Pages 6451—6471
DOI https://doi.org/10.2147/CMAR.S322179
Checked for plagiarism Yes
Review by Single anonymous peer review
Peer reviewer comments 5
Editor who approved publication: Professor Bilikere Dwarakanath
Yi Wang,1,* Na Li,1,* Di Tian,1,* Chang-Wu Zhou,1 You-Hua Wang,2 Chun Yang,1 Meng-Su Zeng1
1Department of Radiology, Zhongshan Hospital, Fudan University, Shanghai Institute of Medical Imaging, Shanghai, 200032, People’s Republic of China; 2Department of Orthopaedics, Affiliated Hospital of Nantong University, Nantong, Jiangsu, 226001, People’s Republic of China
*These authors contributed equally to this work
Correspondence: Meng-Su Zeng; Chun Yang
Department of Radiology, Zhongshan Hospital, Fudan University, Shanghai Institute of Medical Imaging, Xuhui District, Shanghai, 200032, People’s Republic of China
Tel +86 13501922963
; Tel +86 18702135336
Email [email protected]; [email protected]
Introduction: N6-methyladenosine (m6A) modification and long non-coding RNAs (lncRNAs) play pivotal roles in the progression of hepatocellular carcinoma (HCC). However, how their interaction is involved in the prognostic value of HCC and immune checkpoint inhibitors (ICIs) therapy remains unclear.
Methods: The RNA sequencing and clinical data of HCC patients were collected from TCGA database. The prognostic m6A-related lncRNAs were screened out with Pearson correlation test, univariate Cox analysis and least absolute shrinkage and selection operator (LASSO) Cox regression. Patients with HCC were classified into 2 subtypes by consensus clustering. Survival analyses were performed to assess the prognostic value of different clusters and risk models. Potential tumor correlated biological pathways correlated with different clusters were explored through gene set enrichment analysis. We also identified the relationship of the risk model and clusters with response to immune checkpoint inhibitors (ICIs) therapy and tumor microenvironment (TME). Furthermore, the prognostic value of the 9 m6A-related lncRNAs was validated in the external cohort. Finally, the role of SNHG4 was explored by silencing and overexpression of SNHG4 through conducting proliferation, migration and invasion experiments.
Results: Patients from 2 clusters and different risk groups based on m6A-related lncRNAs had significantly different clinicopathological characteristics and overall survival outcomes. Tumor-correlated biological pathways were found to be correlated with Cluster 2 through GSEA. Moreover, we found that patients from different clusters and risk groups expressed higher levels of immune checkpoint genes and had distinct TME and different responses for ICIs therapy. Prognostic value of this risk model was further confirmed in the external cohort. Finally, consistent with the discovery, SNHG4 played an oncogenic role in vitro.
Conclusion: Our study demonstrated that the 9 m6A-related lncRNA signature may serve as a novel predictor in the prognosis of HCC and optimize (ICIs) therapy. SNHG4 plays an oncogenic role in HCC.
Keywords: N6-methyladenosine, long non-coding RNAs, prognosis, immune checkpoints inhibitors therapy, hepatocellular carcinoma
Introduction
As the fourth leading cause of cancer-related deaths, harboring aggressive characteristics and dismal prognosis,1 hepatocellular carcinoma (HCC) has higher level of molecular heterogeneity, which contributes to various prognosis outcomes.2 Especially the development of single cell sequencing technology opens new avenues to excavate the underlying mechanism of tumor microenvironment reprogramming from genetic and epigenetic levels. In addition to tumor cells, immune cell infiltration and stromal cells play even more crucial parts in the development of HCC.3 As the most prevalent mRNA modification, m6A acts dynamically in cancer progression through various RNA metabolisms, such as RNA processing, nuclear export and translation regulation.4 Recently, multiple studies have put efforts into exploring the role of m6A in liver carcinogenesis. According to Chen et al,5 as one component of m6A “writers” complex, METTL3 was up-regulated in HCC, which was associated with poor prognosis. They illustrated the interaction pattern among METTL3, SOCS2 and YTHDF2, which provided a new mechanism for HCC progression. Two other categorical m6A regulators, “readers” and “erasers”, also dynamically participate in carcinogenesis. For instance, FTO, as a stimulator of PKM2 mRNA demethylation, is up-regulated in protein translation, thereby promoting HCC.6 The absence of YTHDF2 in HCC impedes the decay of IL11 and SERPINE2. Consequently, the up-regulated IL11 and SERPINE2 will modulate the tumor microenvironment.7 Long non-coding RNAs (lncRNAs) can be divided into signaling, decoy, guide and scaffold lncRNAs according to their functions.8 Aberrant expression of lncRNAs will disrupt the balance of normal biological environment as risk driver for various cancers. MALAT1, HULC and HOTAIR are most implicated to be up-regulated in HCC.9 The interaction pattern between m6A and lncRNAs can be classified into m6A-modified lncRNAs and lncRNAs regulating m6A-modified RNAs.10 The stability of lncRNAs can be improved by m6A modification, which can facilitate the function of oncogenic lncRNAs mainly through lncRNA-mediated ceRNA network.11–13 For instance, in HCC, METTL3 modifies lncRNA LINC00958 and up-regulates miR-3619-5p, the priority sponge of LINC00958, to increase the expression of HCC-derived growth factor (HDGF).14 Conversely, as for the mechanism of lncRNAs regulating m6A modifications, it has been reported that GATA3-AS can promote m6A reader protein KIAA1429 m6A modification of GATA3 pre-mRNA as a guide lncRNA, and contribute to HCC progression.15 Although some studies have described the interplay between m6A and lncRNAs participating in HCC promotion, more mutual regulatory mechanisms between them need to be determined. Besides, their mutual role in the formation of tumor-immune microenvironment still remains elusive.
In this study, we attempted to analyze the role of m6A-related lncRNAs in predicting prognosis and their associations with clinicopathological features in patients with HCC. SNHG4, as one of the prognostic m6A-related lncRNAs, was demonstrated to promote HCC cell proliferation, migration and invasion in our study. Moreover, we also explored the correlation of m6A-related lncRNAs with tumor microenvironment, immune checkpoint genes and response to the immune checkpoint inhibitors (ICIs) therapy, with the results providing insights into the potential new mechanism of tumor microenvironment modulation and optimizing the selection criteria of patients suitable for ICIs therapy.
Materials and Methods
Data Collection and Processing
RNA sequencing data and clinical data were downloaded from TCGA database via the GDC data portal (https://portal.gdc.cancer.gov/repository) for collecting the raw count data of 374 HCC samples and 50 paired normal samples. Then, a total of 14,086 lncRNAs were obtained according to the Ensemble IDs of genes for further analysis. Additionally, corresponding clinical data of patients with HCC were also collected. Immunophenoscore information (IPS) for each sample in TCGA-STAD were downloaded from The Cancer Immunome Database (TCIA) (https://tcia.at/home). Patients with missing status or time data of over survival (OS) were excluded. Ultimately, 370 HCC patients with lncRNA expression data and clinicopathological data including age, gender, grade, stage and TNM staging were selected in the final cohort for analysis; they were randomly assigned into the training or validation cohort at the ratio of 7:3 with the caret package. Continuous variables were converted to categorical variables for analysis, and variables in the training and validation cohort were compared with the chi-square test.
Identification of m6A-Related Genes and Prognostic m6A-Related lncRNAs
Based on previous literature, expression matrixes of 23 m6A-related genes were extracted according to the mRNA expression data in TCGA-LIHC, including expression data on writers (METTL3, METTL14, METTL16, WTAP, VIRMA, ZC3H13, RBM15 and RBM15B), readers (YTHDC1, YTHDC2, YTHDF1, YTHDF2, YTHDF3, HNRNPC, FMR1, LRPPRC, HNRNPA2B1, IGFBP1, IGFBP2, IGFBP3 and RBMX) and erasers (FTO and ALKBH5). Subsequently, m6A-related lncRNAs were first filtered with the “limma” R package by setting cor >0.5 and P<0.001, and co-expression network graph was plotted by the “igraph” R package. Then, the prognostic m6A-related lncRNAs with the criterion of P<0.05 were screened through univariate Cox regression analysis. The expression differences of lncRNAs between HCC tissue and normal adjacent tissues were examined by Wilcoxon test.
Identification of m6A-Related lncRNA Subgroups by Consensus Clustering
To further explore the underlying biological characteristics of m6A-related lncRNAs, patients with HCC were clustered into different subtypes by the “ConsensusClusterPlus” R package with iterations of 50 and resample rate of 0.8. The optimal k value (k=2) was determined to obtain a stable cluster. The subgroup analysis was performed on clinicopathological factors between two clusters by Kaplan–Meier survival method and log rank test.
Analysis on Correlations of Different Clusters with Immune Checkpoint-Related Genes and Tumor Microenvironment (TME)
Scores of immune, stromal and ESTIMATE were calculated with ESTIMATE algorithm by the “estimate” package. Between the two clusters, expression differences of immune checkpoint molecules, and immune, stromal and ESTIMATE score differences were analyzed by Wilcoxon test. The correlations between m6A-related lncRNAs and immune checkpoint genes were analyzed by Pearson correlation test, with P<0.05 indicating statistical difference.
Through GSEA, 1000 permutations were randomly sampled with the false discovery rate (FDR) <0.05 as the cut-off value to study the difference in tumor signaling pathways between patients of Cluster 2 and Cluster 1.
Construction and Validation of Risk Model and Its Association with Clinicopathological Features and Immune Checkpoint Genes
The least absolute shrinkage and selection operator (LASSO) regression algorithm was implemented to further select the m6A-related lncRNAs in the training queue that were associated with overall survival. Thereafter, the expression levels of the 9 identified lncRNAs and corresponding coefficients obtained by the LASSO regression algorithm were used to establish the risk model, and the risk-scoring formula was as follows: Risk score = coef1*x1+coef2*x2+coef3*x3+ … +coefi*xi (coef refers to the coefficient of each lncRNA, and x refers to the expression level of each lncRNA). Patients were divided into high-risk and low-risk group in both training and validation cohorts according to the median risk score, respectively. To evaluate the predictive accuracy of the risk model, receiver operating characteristic (ROC) was applied in training and validation cohorts. The calibration curves and time-independent ROC analysis were conducted in the external cohorts. The OS difference between low-risk and high-risk group was detected by Kaplan–Meier survival method and log rank test. Whether the risk score was an independent prognostic factor was evaluated through univariate and multivariate Cox regression analysis. The risk score differences concerning clinicopathological factors, immune score and two clusters were further explored by Wilcoxon test, as well as the analysis on expression differences of immune checkpoint genes and the responses to ICIs therapy.
Patients and Follow-Up
Clinical tissues, tumors and areas adjacent to the margin of the tumors were collected from HCC patients who underwent surgical curative resection between 2015 and 2018 at the Liver Cancer Institute of Fudan University (Shanghai, China). Patients with incomplete detailed clinical information were excluded, and 50 patients were finally selected. Ethical approval was confirmed by the Zhongshan Hospital Research Ethics Committee, and written informed consent was obtained from all of the patients (Permit ID number: B2018-236). Follow-up time ranged from 198 to 1386 days, and the median follow-up time was 893 days.
qRT-PCR Analysis
Total RNA was extracted using MolPure Cell RNA Kit (YEASEN Biotech Co., Ltd). cDNA synthesis was carried out by using Hifair III 1st Strand cDNA Synthesis SuperMix for qPCR (YEASEN Biotech Co., Ltd). The relative lncRNA expression levels were calculated with 2–ΔΔCT method, and glyceraldehyde 3-phosphate dehydrogenase (GAPDH) served as an internal control; the sequences of qPCR primers are presented in Table S1. All experiments were performed in triplicate.
Cell Culture and Transfection
HCC cell lines Huh7, MHCCLM3 and PLC/PRF/5 were purchased from the Cell Bank of the Chinese Academy of Sciences (Shanghai, China). All the cell lines were cultured in DMEM (Gibco, CA, United States) supplemented with 10% fetal bovine serum (Australia Origin, Gibco, Carlsbad, CA, United States), 1% penicillin/streptomycin (Beyotime, China) and incubated at 37°C with 5% CO2.
siRNAs and negative control (si-NC) were synthesized by Sangon (Shanghai, China). siRNA oligos targeting SNHG4 were CCACUAGGACACACAGAUUTT for sense and AAUCUGUGUGUCCUAGUGGTT for antisense; for negative control siRNA, sense was 1U*1A*1C*1U*A*A*G*U*G*U*A*G*A*U*U*1C*1U*1G*1C. For SNHG4 overexpression, the full-length SNHG4 cDNA was amplified and subcloned into pcDNA3.1 by Sangon (Shanghai, China). An empty vector was used as a negative control. For transfection, 1×10⁵ cells were seeded in a six-well plate; 125 μL Opti-MEM medium and 5 μL lipofectamine3000 were incubated for 15 minutes at room temperature. Meanwhile, 125 μL Opti-MEM medium and 2.5 μg siRNA were incubated for 15 minutes for transfection. For transfection of pcDNA3.1, 5 μL P3000 needs to be added for incubation. Then, si-RNA/pcDNA3.1-lipid complex was added to cells. After 48 h, the cells were harvested for further experiments.
Colony Formation
For colony formation assay, cells were digested into single-cell suspension and 2000 cells seeded in a six-well plate. To each well, 200 μL complete medium was added every 2 days to prevent drying, and they were incubated in a 5% CO2 incubator for 2 to 3 weeks. Colonies were fixed with 4% paraformaldehyde and stained with 0.4% crystal violet for 15 min. Then, the clones were washed with 2 mL PBS repeatedly. The colonies were imaged by the microscope and quantified by ImageJ (version 1.53).
Cell Migration and Invasion Assay
For cell migration assay, one hundred thousand cells were cultured in the 24-well transwell plates (8 μm pore size, Corning, NY, USA), 0.3 mL serum-free medium was added to coated filters and 0.8 mL DMEM containing 10% FBS was placed in the lower chamber. For Matrigel invasion assays, 5 μL Matrigel (BD Biosciences, USA) was diluted with DMEM at the ratio of 1:9. One hundred thousand cells suspended in serum-free medium were plated in the upper chambers with diluted Matrigel, and 0.8 mL medium with 20% FBS was added to the lower chamber. After incubation for a suitable amount of time, the cells were fixed in 4% paraformaldehyde, stained by crystal violet and counted under a microscope.
EdU Incorporation Assay
EdU incorporation assay was conducted by EdU assay kit (Beyotime, Shanghai, China). Huh7 and MHCCLM3 were transfected with si-NC and si-SNHG4, respectively; MHCCLM3 and PLC/PRF/5 were transfected with pcDNA3.1 and pcDNA3.1-SNHG4, respectively; and cells were seeded in a 96-well plate with a density of around 1×10⁴ cells/ well. After culturing for 24 h, 100 μL EdU solution (20 μM) was added to each well and incubated for 4 h. The cells were fixed in 50 μL PBS containing 4% paraformaldehyde for 30 min. Then, 50 μL 2 mg/mL glycine was added for 5 min. After washing with PBS, the cells were incubated with 100 μL 1×Apollo staining solution for 30 min. The staining solution was discarded, and the cells were washed with 100 μL PBS containing 0.5% TritonX-100 for 10 min. After washing again with PBS, 100 μL 1×Hoechst 33,342 was added for a 30 min incubation at room temperature. After washing with PBS, the positive cells were visualized under a microscope. The results were analyzed by ImageJ (version 1.53).
Western Blotting Analysis
Huh7 and MHCCLM3 cells which were transfected with si-NC and si-SNHG4, respectively, were harvested with RIPA lysis buffer containing 1 mM Na3VO4, 1 mM Cocktail and 1 mM PMSF. Cell debris was removed by centrifugation. The total protein concentration was determined by the BCA protein assay. The protein samples were boiled for 5 min in 1×SDS sample buffer and fractionated by 12% SDS-PAGE and transferred to PVDF membrane. The membrane was blocked with 5% nonfat milk in TBST (20 mM Tris, pH 7.6, and 137 mM NaCI containing 0.1% Tween-20) for 1 h at room temperature and incubated with primary antibodies overnight at 4°C. Then the membrane was washed and incubated with secondary antibody for 1 h. The protein bands were visualized using enhanced chemiluminescence reagents (Thermo Fisher Scientific, Inc., Rockford, IL, USA) and Tanon 5200 Chemiluminescent Imaging System (Tanon, Shanghai, China) detection. The following primary antibodies were used: GAPDH (1:1000, Proteintech), ki-67 (1:1000, Proteintech), PCNA (1:1000, Proteintech), Bax (1:1000, Cell Signaling Technology), Bcl-2 (1:1000, Proteintech), Cleaved caspase-9 (1:1000, Cell Signaling Technology) and Cleaved caspase-3 (1:1000, Cell Signaling Technology). The following second antibody was used: goat anti-rabbit/anti-mouse-peroxidase-conjugated second antibody (1:5000, Abcam).
Statistical Analysis
The initial processing of the expression data downloaded from TCGA was conducted by the Perl (version 5.24.3). All statistical analyses were performed using R software (version 4.0.2) and GraphPad Prism (version 8.2.0). A P-value <0.05 was considered to have statistical significance.
Results
Identification of m6A-Related lncRNAs in Patients with HCC
The study flowchart is displayed in Figure 1. A total of 14,086 lncRNAs and expression matrixes of 23 m6A-related genes were extracted from TCGA-LIHC RNA sequencing dataset, with the value of Pearson correlation >0.5 and P<0.01, which were set as the criteria for preliminarily selecting m6A-related lncRNAs. A total of 338 lncRNAs were found to be significantly correlated with m6A-related genes with positive correlations. The co-expression network graph is shown in Figure 2A. Subsequently, 25 lncRNAs were obtained through univariate Cox regression analysis (P<0.001) when the prognostic data were integrated. The clinical baseline information of 370 HCC cases in TCGA database is presented at Table 1. The forest plot showed that all the screened lncRNAs can be risk factors with HR (hazard ratio) >1 (Figure 2B). The heatmap (Figure 2C) and the boxplot (Figure 2D) demonstrated that 25 lncRNAs can be up-regulated in the HCC tissues compared with those in the normal tissues (Figure 2C and D). Thereafter, we investigated the interrelationship between the 25 lncRNAs (Figure 2E), showing that although the correlation between AC099850.2 and AC026412.3 was weak, most of them were significantly positive.
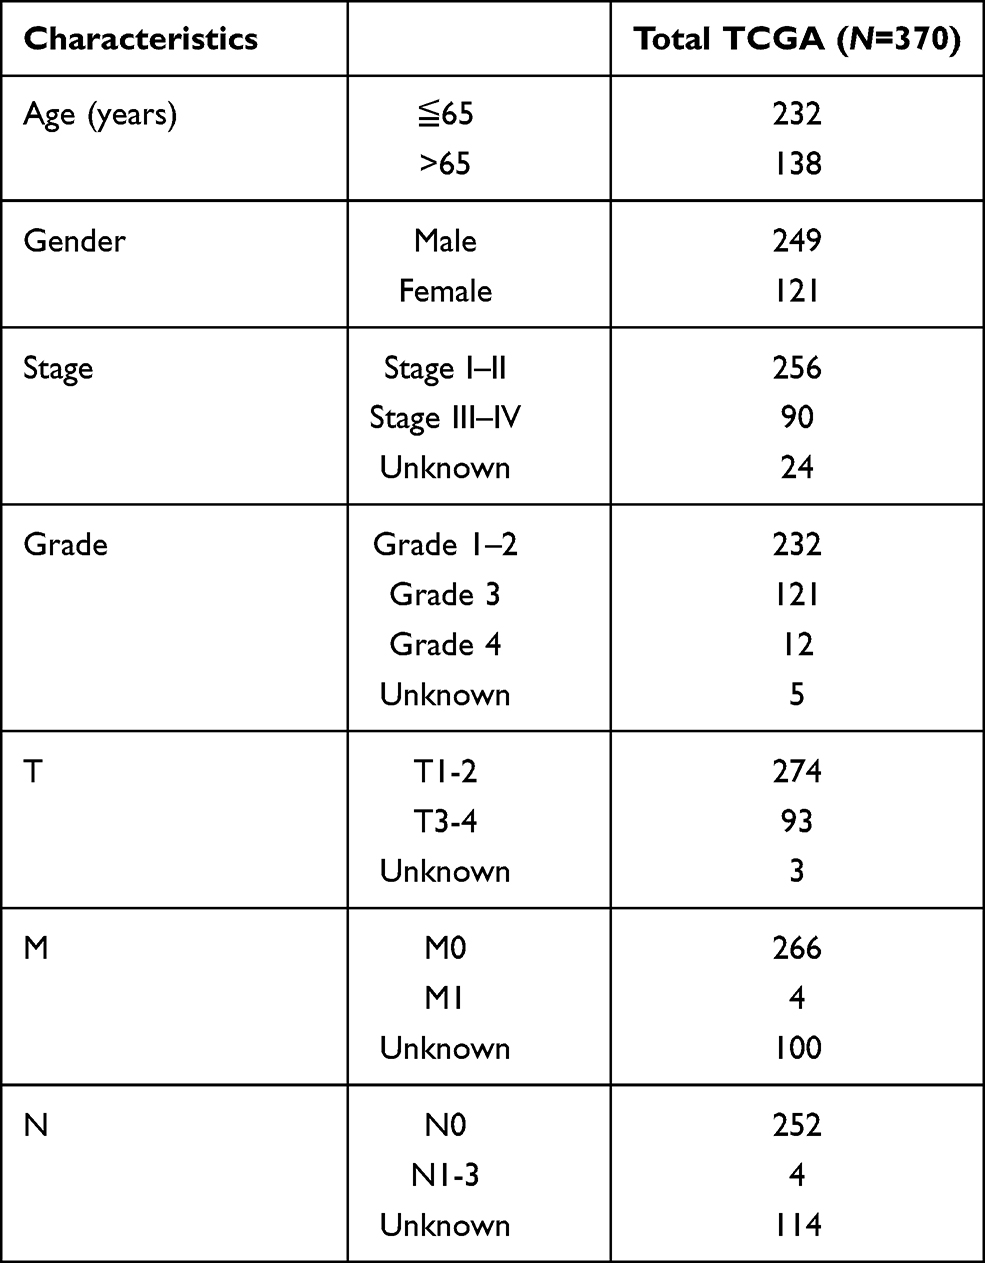 |
Table 1 Clinical Characteristics of the HCC Cases in TCGA Database |
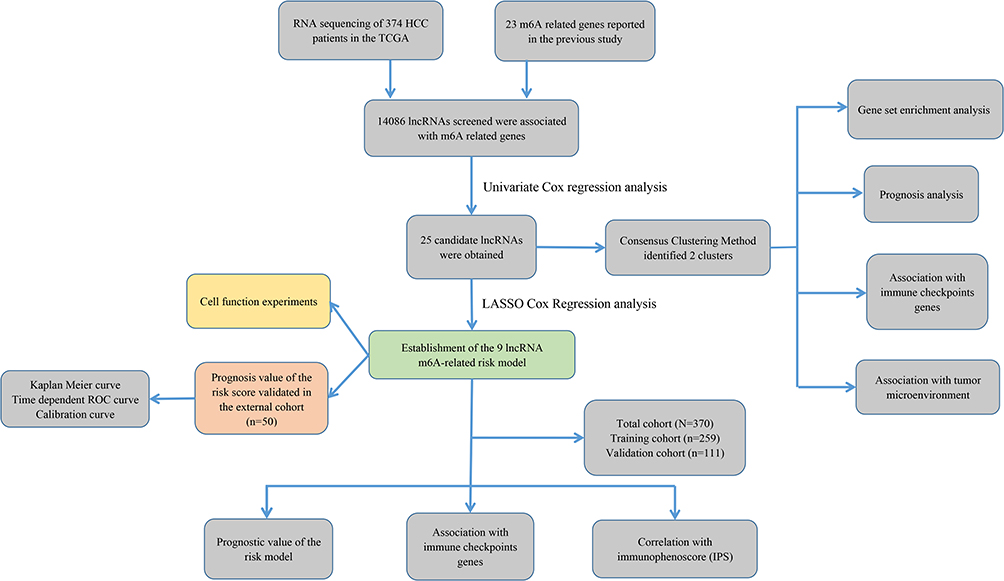 |
Figure 1 Study flowchart of this study. |
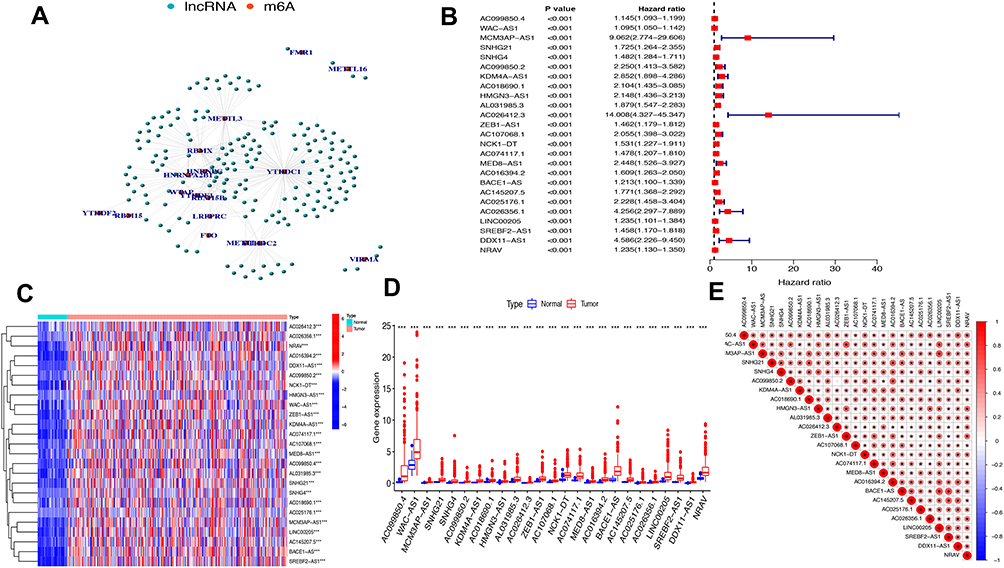 |
Figure 2 The lncRNAs significantly correlated with m6A-related genes. (A) Co-expression network of m6A-related genes and lncRNAs. (B) Forest plot of the prognostic ability of the 25 m6A-related lncRNAs. (C and D) Heatmap (C) and expression value (D) of the 25 m6A-related lncRNAs in 50 normal tissues and 374 tumor tissues. ***P<0.001. (E) Interrelationship between the 23 m6A-related lncRNAs. |
Consensus Clustering Identified Two Clusters of HCC with Distinct Prognoses Based on m6A-Related lncRNAs
Based on the similar expression of 25 lncRNAs in HCC samples, the samples were clustered with consensus clustering method, to further elucidate the biological discrepancies among subgroups. The CDF curves of consensus matrix indicated that, when k=2, the interference between subgroups is minimal and the distinction is significant (Figure 3A–C). A total of 370 patients with HCC were separated into Cluster 1 (n=313) and Cluster 2 (n=57). As shown in the heatmap (Figure 3D), the expression of 25 lncRNAs in Cluster 2 was dramatically higher than that in Cluster 1. Moreover, the clinicopathological characteristics were compared between two subgroups. As expected, patients with more advanced grade (grade 3 or grade 4) (P<0.05) and stage (stage III–IV) (P<0.01) covered a larger proportion in Cluster 2. Meanwhile, the patients in Cluster 2 were preferentially associated with the late T stage, while no evident differences of N stage and M stage were observed between the two groups. Also, we found that, in Cluster 2, female patients were dominant (P<0.05), with no statistically significant difference in the distribution of age between the two subgroups. In addition, the OS of the patients in Cluster 2 was shorter than that in Cluster 1 (Figure 3E).
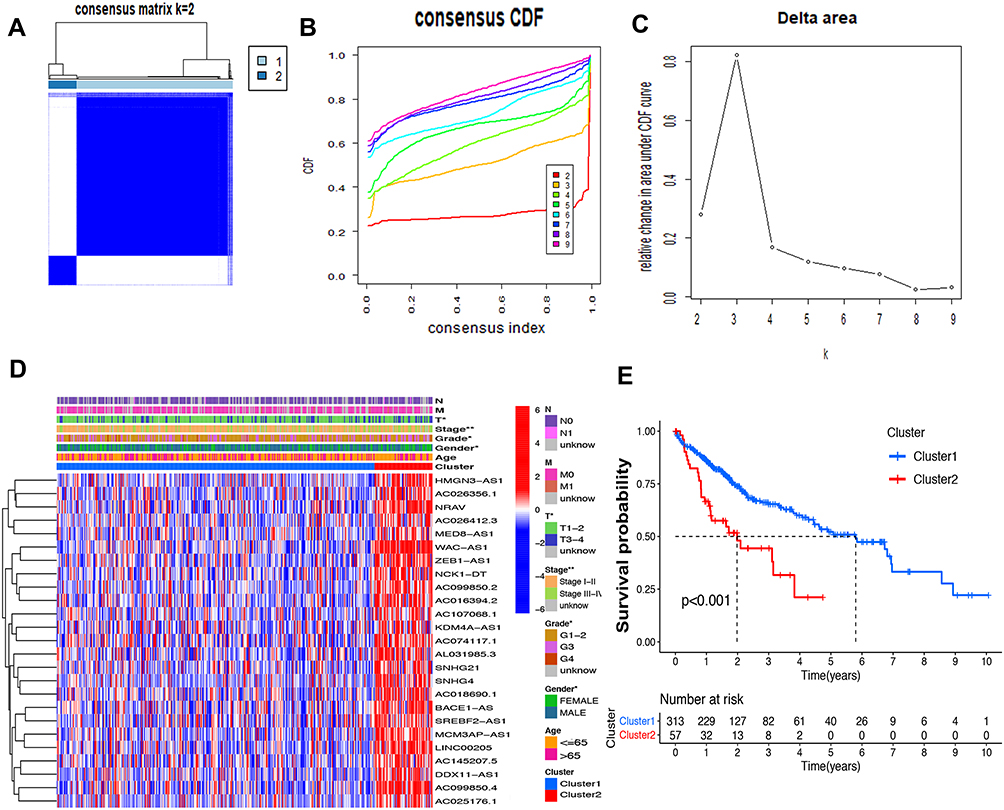 |
Figure 3 Differential survival outcomes of HCC in Cluster 1/2 subtypes. (A) Consensus score matrix of all samples when k=2. (B) The cumulative distribution functions (CDF) for k=2 to 9. (C) Relative change in area under CDF area for k=2 to 9. (D) Heatmap of clinicopathological features and different lncRNA expression pattern in Cluster 1/2. (E) Survival analysis of Cluster 1/2 in the total TCGA cohort. *P<0.05, **P<0.01. |
The association of the two clusters and the prognosis of patients with HCC was indicated by comparing survival rates of the two clusters in different clinical subgroups, with the drawn survival plots (Figure S1A-I), indicating that survival rates of two clusters have significant differences in age <65 (P<0.001), male (P<0.001), grade 1 + grade 2 (P<0.001), stage III + stage IV (P=0.001), M0 (P<0.001), N0 (P<0.001), T1+T2 (P=0.034) and T3+T4 (P<0.01). As illustrated in the survival plots, patients in Cluster 2 had worse OS than those in Cluster 1.
Association of TME and Immune Checkpoint Genes with Two Clusters
Immune checkpoint blockade can increase antitumor immunity by blocking intrinsic down-regulators of immunity. Recent evidences have suggested the interplay between m6A modifications and lncRNAs on the biological function involved in cancer progression, and m6A modifications had the potential to to promote immunotherapy. Herein, 5 immune checkpoint genes were selected, including PD-L1, CTLA4, HAVCR2, TIGIT and B7-H3, which were reported as effective targets for immunotherapy. The differential expression of these above immune checkpoint genes in the two subtypes and the correlation of these molecules with m6A-related lncRNAs were identified. All these findings show that CTLA4 (P<0.01, Figure 4B), HAVCR2 (P<0.01, Figure 4C), TIGIT (P<0.001, Figure 4D) and B7-H3 (P<0.01, Figure 4E) in Cluster 2 had higher expression than the counterparts, without any statistical difference with PD-L1 (P>0.05, Figure 4A). Moreover, the correlations between immune checkpoint genes and m6A-related lncRNAs were analyzed, with the results as shown in Figure 4F, suggesting that AC099850.4 was positively correlated with the 5 immune checkpoint genes (P<0.05), which implied that the potential role of m6A-modified lncRNAs in regulating the immunomodulators may open new avenues to explore the anticancer immunotherapy.
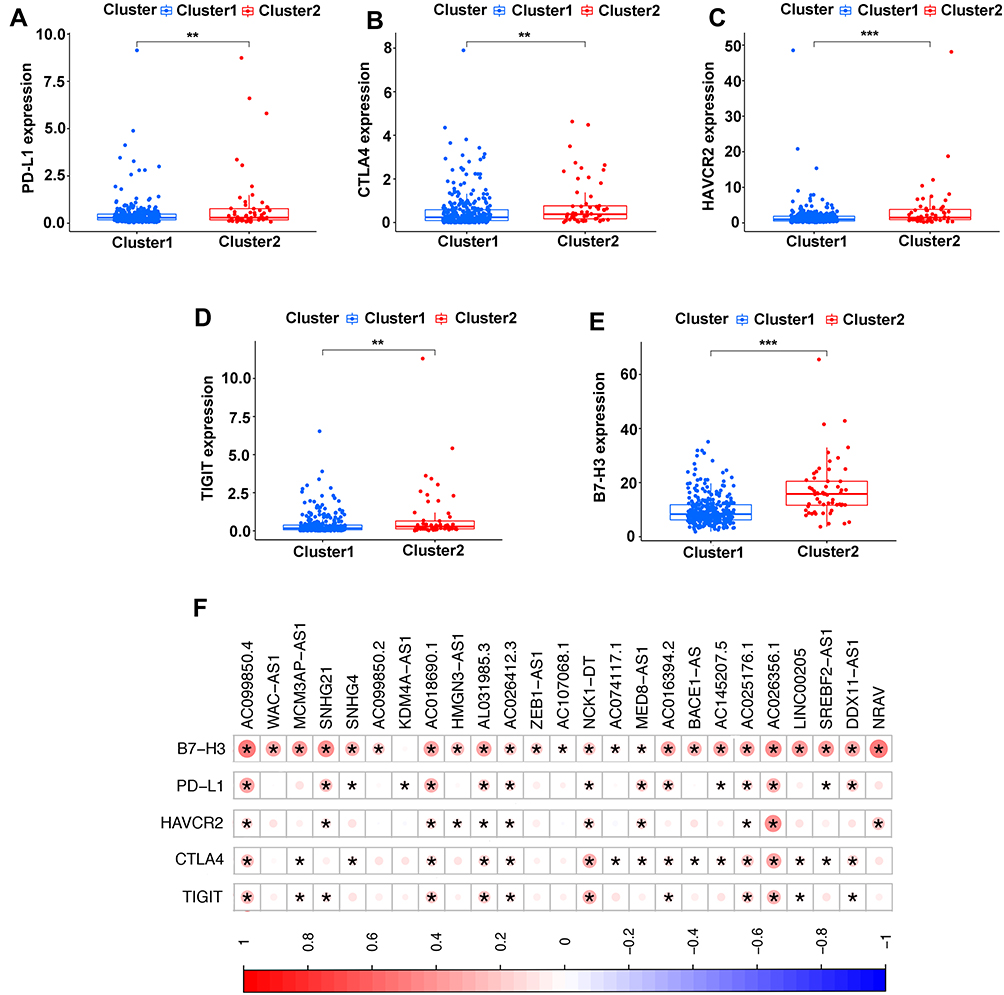 |
Figure 4 Comparison of the expression levels of immune checkpoints genes between Cluster 1/2 subtypes. (A–E) The expression level of PD-L1 (A), CTLA4 (B), HAVCR2 (C), TIGIT (D), B7-H3 (E) in two subtypes. (F) Correlation of the 23 m6A-related lncRNAs with each immune checkpoint gene. **P<0.01, ***P<0.001. |
To get more insights into the interplay between m6A-related lncRNAs and immunity, TME has predominant impact on the tumor progression as a crucial cellular milieu for immune cells, stromal cells and extracellular matrix molecules, hence, the distribution differences of the estimated proportion of immune and stromal between the two clusters were calculated by ESTIMATE algorithm. As shown in Figure 5A–C, although the immune score had no significant difference between the two clusters (P=0.14), Cluster 2 harbored lower stromal score (P<0.01) and ESTIMATE score (P=0.017). These findings revealed that a larger proportion of stromal components in TME is likely associated with lower expression of m6A-related lncRNAs.
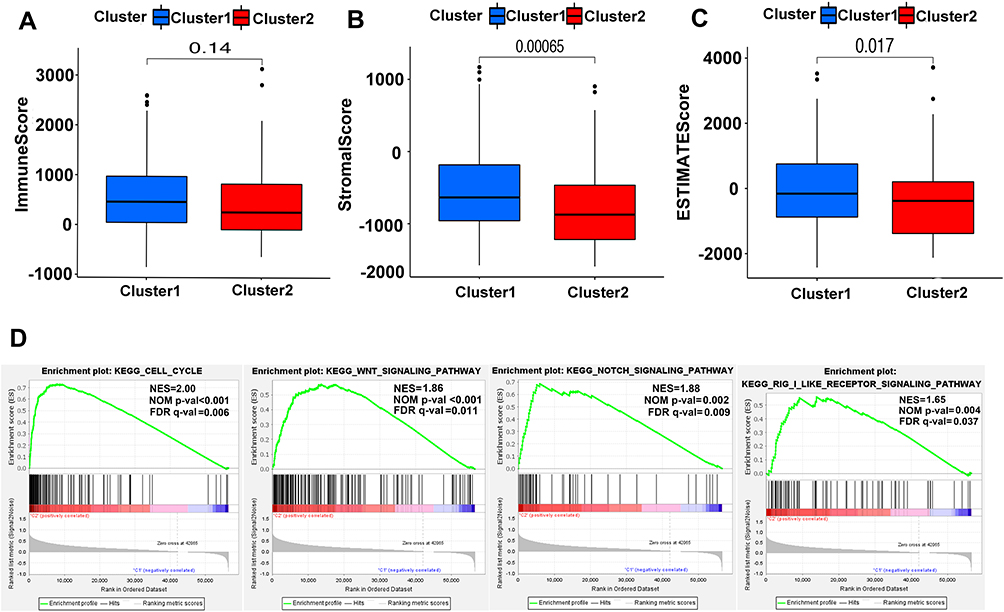 |
Figure 5 ESTIMATE and GSEA analysis in Cluster 1/2. (A–C) Comparison of immune score (A), stromal score (B) and ESTIMATE score (C) in two subtypes. (D) GSEA showed that cell cycle, Wnt signaling pathway, notch signaling pathway and RIG-1-like receptor signaling pathway are differentially enriched in Cluster 2. NES, normalized enrichment score; NOM p-val, normalized P-value; FDR q value: false discovery rate q value. |
For investigating the biological mechanism leading to the heterogeneity of the two clusters, GSEA was implemented and it was found that several tumor hallmarks were dynamically enriched in Cluster 2 compared with Cluster 1, including cell cycle (normalized enrichment score [NES]=2.00, normalized P<0.001), WNT signaling (NES=1.86, normalized P<0.001), NOTCH signaling (NES=1.88, normalized P=0.002) and RIG-1-like receptor signaling (NES=1.65, normalized P=0.004) (Figure 5D). The aforementioned multiple signaling differences between the two clusters above indicated the potential role of m6A-related lncRNAs in the development of HCC.
Construction and Validation of a Prognostic Model for Patients with HCC Based on m6A-Related lncRNAs
As assessed through the univariate Cox regression analysis, 25 differentially expressed m6A-related lncRNAs were found to be significantly associated with OS. To identify the most powerful prognostic m6A-related lncRNAs, nine lncRNAs containing SNHG4, KDM4A-AS1, AC026356.1, SREBF2-AS1, AL031985.3, AC026412.3, AC074117.1, DDX11-AS1 and NRAV, and coefficients of each of the lncRNAs were finally identified through LASSO regression analysis (Figure 6A–C). Based on the regression coefficients and expressions of the 9 prognostic markers, a risk model was constructed, and the formula was as follows: risk score = 0.4977 * expression (SNHG4) + 0.4692 * expression (KDM4A-AS1) + 0.1908 * expression (AC026356.1) + 0.1065 * expression (SREBF2-AS1) + 0.0834 * expression (AL031985.3) + 0.3039 * expression (AC026412.3) + 0.1935 * expression (AC074117.1) + 0.0688 * expression (DDX11-AS1) + 0.0294 * expression (NRAV). According to the median value of the risk score, patients with HCC were divided into high-risk and low-risk groups. The predictive performance of the risk model was evaluated with ROC curves, and the area under the ROC curve (AUC) for OS was 0.805 in the training cohort (Figure 6D) and 0.696 (Figure 6G) in the validation cohort. Furthermore, the distributions of risk scores and survival status of each patient in both the training and the validation cohorts are displayed in Figure 6E and F. The figure indicates that with the increase of the risk score the mortality rate increased and the survival time was shorter. The heatmap indicates that all the 9 lncRNAs were highly expressed in the high-risk group in both training cohort and validation cohort (Figure 6H and I). Taken together, our results suggested that the risk scores based on the 9 m6A-related lncRNAs had optimal predictive ability of the prognosis in patients with HCC.
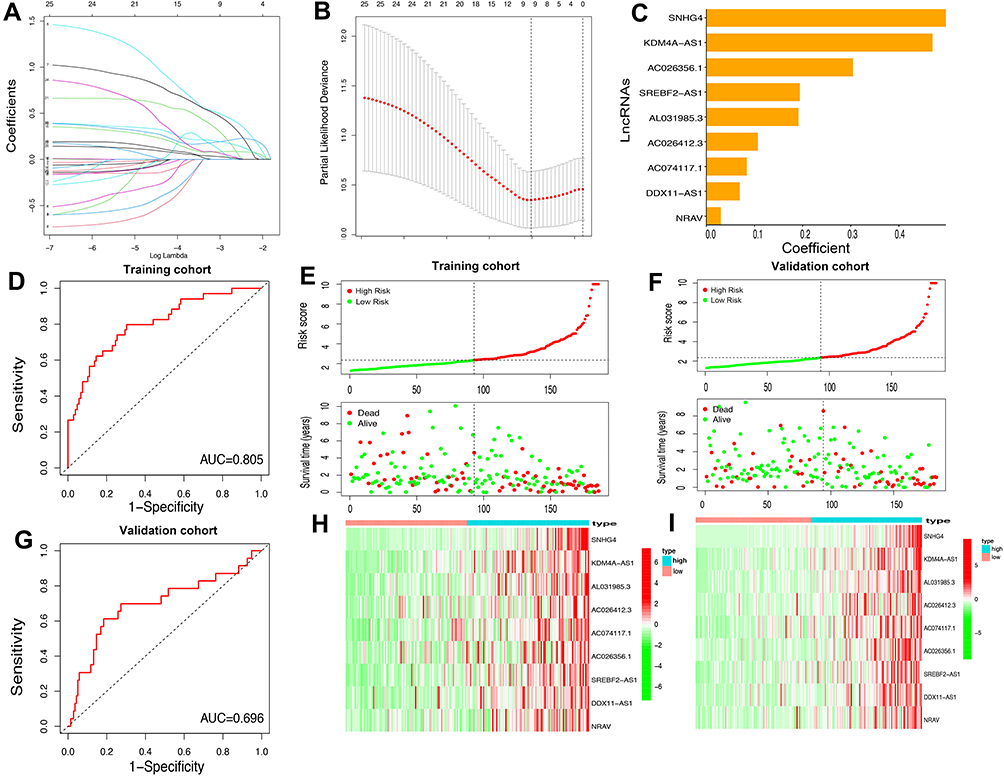 |
Figure 6 Construction of the HCC prognostic risk model based on 9 m6A-related lncRNAs. (A and B) Least absolute shrinkage and selection operator (LASSO) regression was performed; the penalization coefficient λ in the LASSO model was tuned using 10-fold cross-validation and minimum criterion for the selection of m6A-related lncRNAs. (C) Barplot of the coefficients of selected lncRNAs. (D and G) Receiver operating characteristic (ROC) curves of risk model for predicting survival in the training (D) and validation cohort (G). (E and F) Distribution of risk score, survival status of HCC patients and heatmap of the 9 m6A-related lncRNAs in the high/low-risk group in the training (H) and validation (I) cohort. |
Risk Score Based on m6A-Related lncRNAs Was an Independent Prognostic Factor for Patients with HCC
Whether the risk model based on the m6A-related lncRNAs could independently predict the prognosis of patients with HCC was determined by univariate and multivariate Cox regression analysis. The results of univariate Cox regression analysis showed that OS was evidently associated with stage (HR, 1.636; 95% CI, 1.232–2.173, P<0.001) and riskScore (HR, 1.154; 95% CI, 1.104–1.207, P<0.001) in the training cohort (Figure 7A) and stage (HR, 1.706; 95% CI, 1.267–2.299, P<0.001) and riskScore (HR, 1.011; 95% CI, 1.003–1.018, P=0.005) in the validation cohort (Figure 7C). After adjusting the clinicopathological factors in the multivariate Cox regression analysis, stage (HR, 1.451; 95% CI, 1.072–1.963, P<0.001) and riskScore (HR, 1.138; 95% CI, 1.085–1.193, P<0.001) in the training cohort (Figure 7B) and stage (HR, 1.824; 95% CI, 1.335–1.193, P<0.001) and riskScore (HR, 1.012; 95% CI, 1.003–1.020, P=0.008) in the validation cohort (Figure 7D) still acted as powerful prognostic factors (Table 2). The survival curves revealed that, both in the training and validation cohorts, patients in the high-risk HCC group exhibited worse OS compared with those in the low-risk group (training cohort: P=0.006, validation cohort: P=0.008) (Figure 7E and F). Furthermore, in the subgroup analysis for patients with different stages of HCC, P-values were 0.02 and 0.007 for patients with stage I–II and stage III–IV, respectively, which were calculated by log rank analysis (Figure 7G and H).
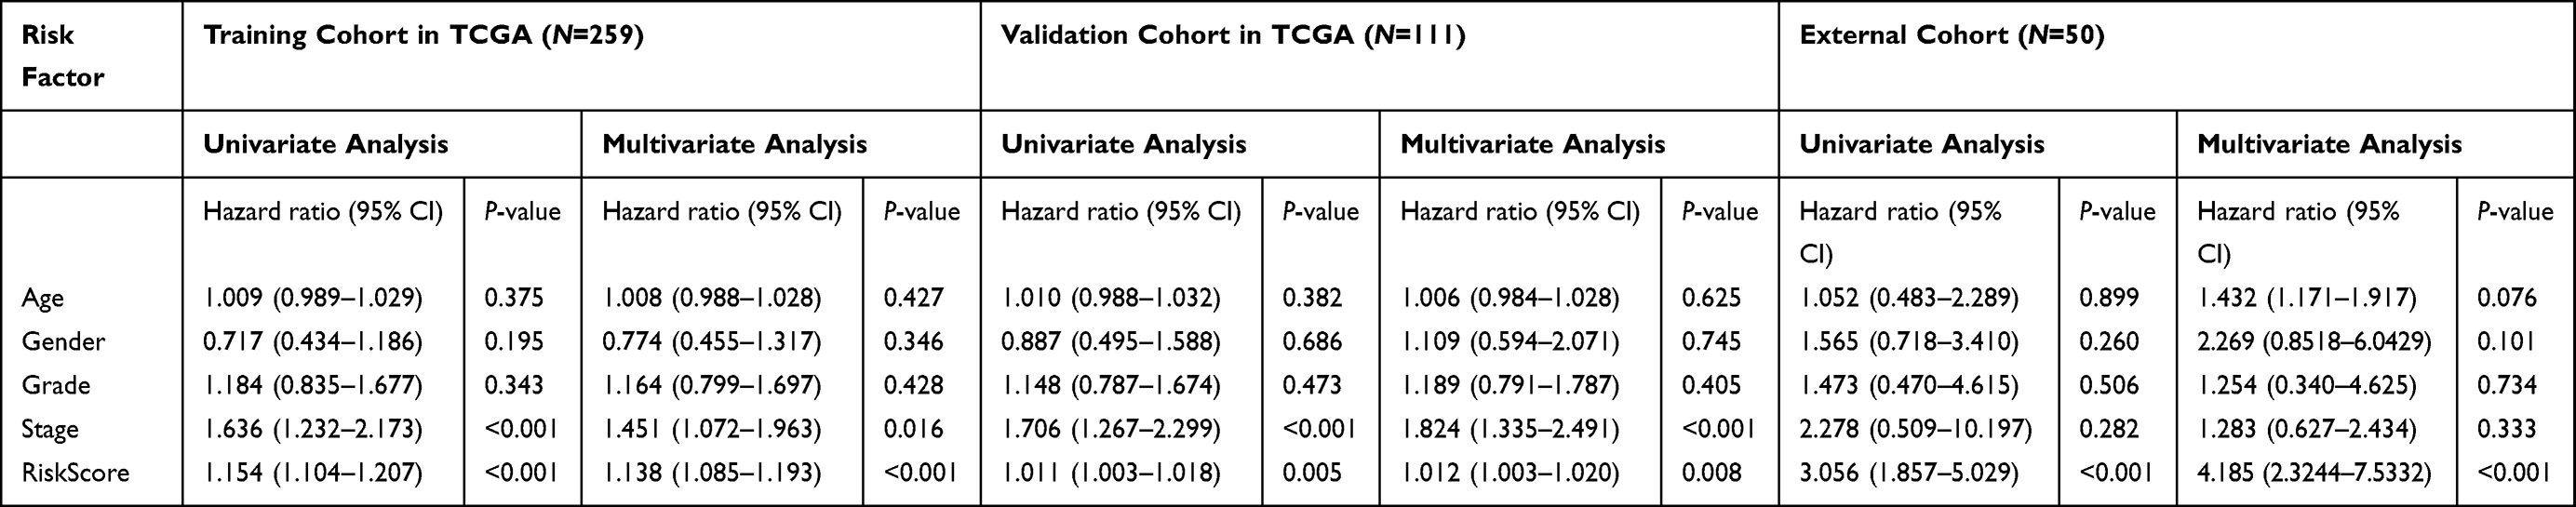 |
Table 2 Univariate and Multivariate Analysis of Risk Score and Clinical Factors with OS in the Training Cohort and Testing Cohort of TCGA, and External Validation Cohort |
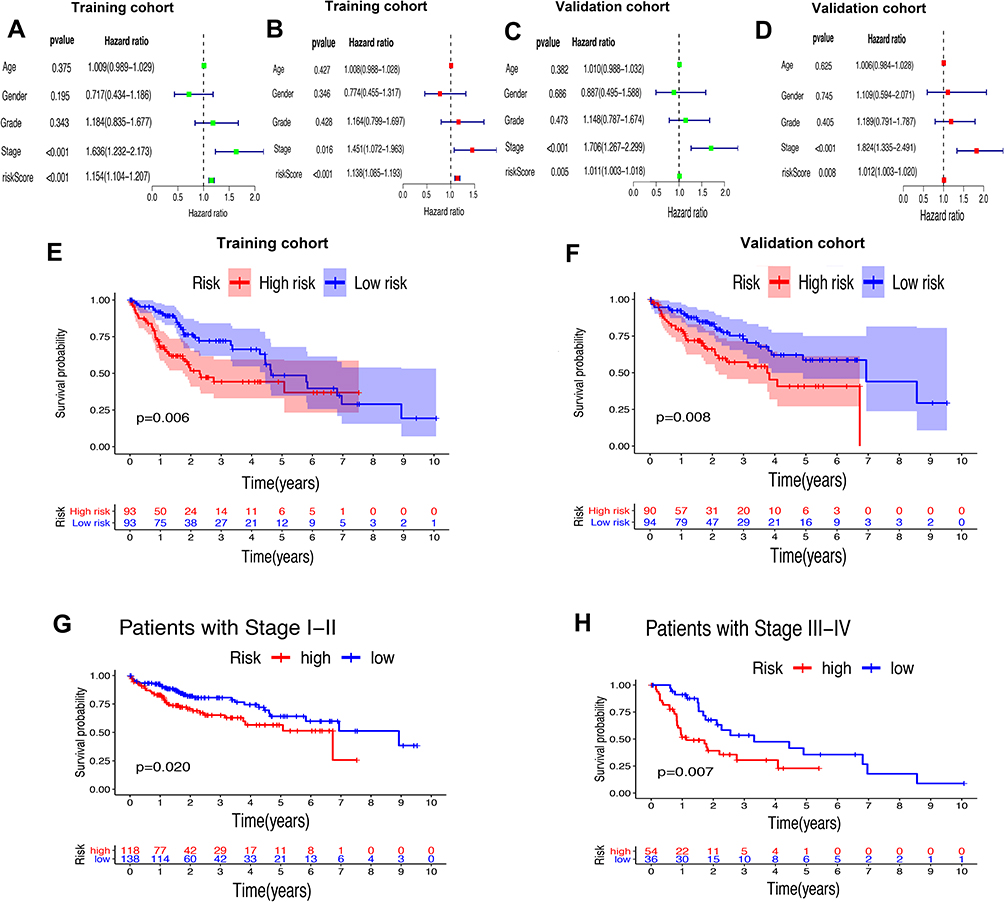 |
Figure 7 Univariate and multivariate analysis showed that the risk score calculated by LASSO model was an independent prognostic predictor. (A and B) Univariate (A) and multivariate (B) Cox analysis in the training cohort. (C and D) Univariate (C) and multivariate (D) Cox analysis in the validation cohort. (E and F) Kaplan–Meier analysis showed that the high-risk group exhibited worse survival outcome than the low-risk group in the training (D) and validation (E) cohort. (G and H) Subgroup Kaplan–Meier analysis of HCC patients in the stage I–II group (G) and stage III–IV group (H). |
Prognostic Risk Score Was Associated with Clinicopathological Factors, Immune Score and Immune Checkpoint Genes
First of all, we further evaluated the relationship between risk and the 9 prognostic m6A-related lncRNAs. As expected, it could be concluded from the heatmap that all the 9 prognostic m6A-related lncRNAs have remarkably higher expressions in the patients from the high-risk group (Figure 8A). Then, it can be also referred from the heatmap and the scatter diagrams (Figure 8B–E) that there were statistical differences of risk score in the stratification of cluster (P<0.001), immune score (P=0.003), stage (P=0.0025), grade 1+grade 2 vs grade 3 (P<0.001) and grade 1+grade 2 vs grade 4 (P=0.0042), while there was no significant difference of risk score between grade 3 and grade 4 (P=0.17). Furthermore, we found that PD-L1 (P=0.037, Figure 9A), B7-H3 (P<0.01, Figure 9B), CTLA4 (P<0.01, Figure 9C), HAVCR2 (P<0.001, Figure 9D) and TIGIT (P=0.02, Figure 9E) of patients in the high-risk group had higher expression than in the low-risk group. In addition, the relationship between risk score and immunophenoscore, which was a predictor of response to anti-cytotoxic T lymphocyte antigen-4 (CTLA-4) and anti-programmed cell death protein 1 (anti-PD-1), was explored. The results showed that different risk groups tend to have different immune checkpoint inhibitor responses including anti-CTLA-4 therapy, anti-PD-1 therapy or combination of both therapy with all P-value <0.01 (Figure 10A–D). Collectively, these facts strongly indicated that risk score established on m6A-related lncRNAs exhibited valuable clinical data with a crucial implication value for immunotherapy.
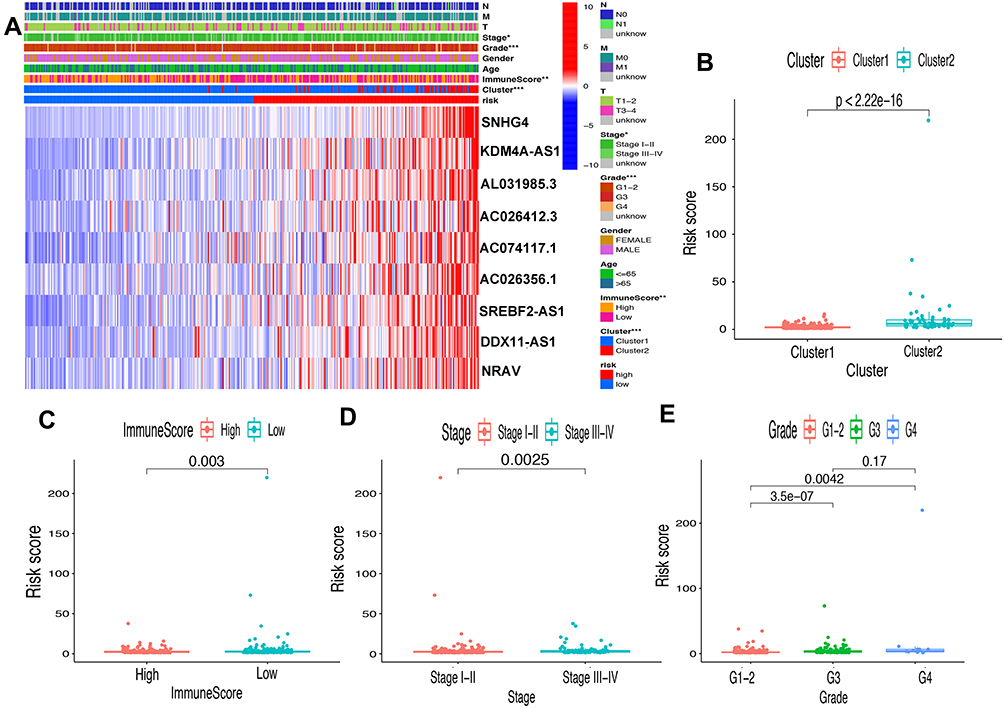 |
Figure 8 Prognostic risk score correlated with clinicopathological features, Cluster 1/2 subtypes and immunoscore. (A) Heatmap of clinicopathological features, immune score and different lncRNA expression pattern in high/low-risk group. * P<0.05, ** P<0.01, *** P<0.001. (B–E) Comparison of risk score distribution in the different sample classification of Cluster 1/2 (B), high/low immune score (C), stage I–II/III–IV (D) and grade 1–-2, grade 3 and grade 4 (E). |
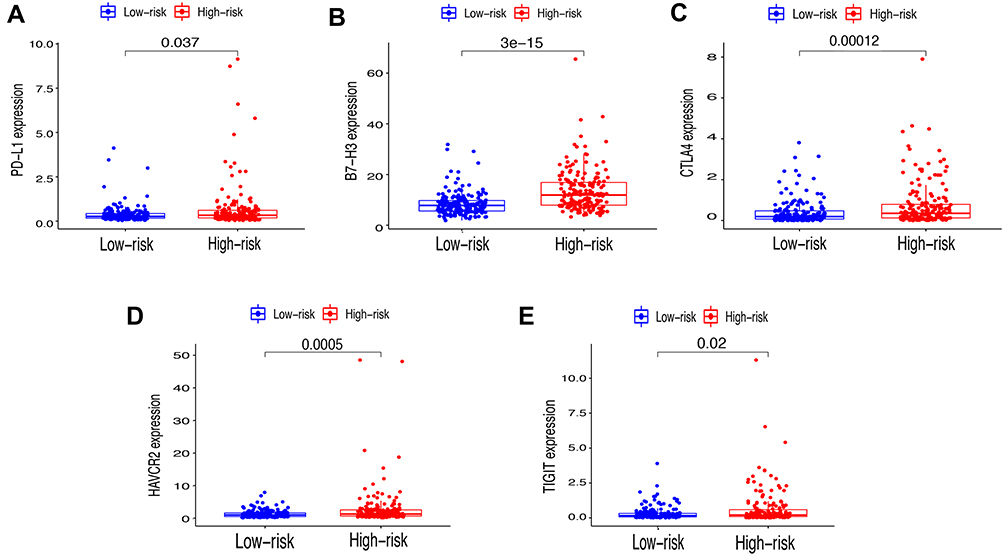 |
Figure 9 Relationships between risk score and expression level of immune checkpoint genes. (A) PD-L1, (B) B7-H3, (C) CTLA4, (D) HAVCR2 and (E) TIGIT. |
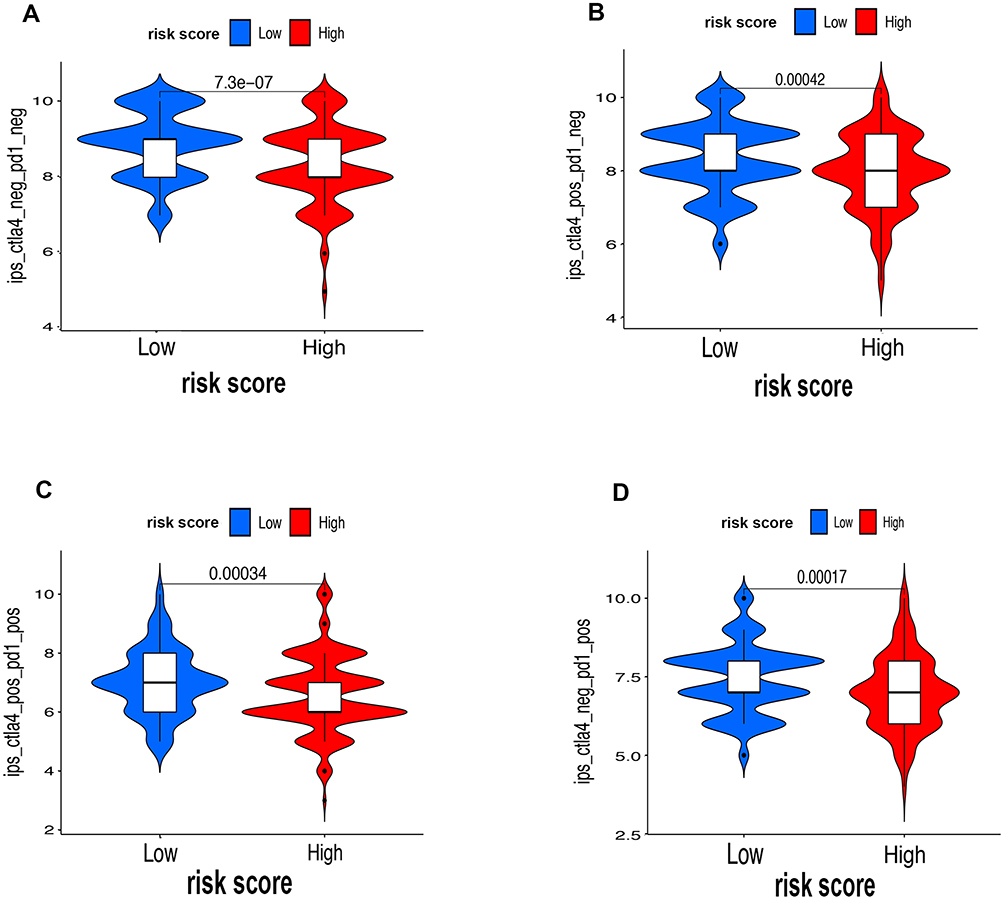 |
Figure 10 The associations between risk score and response to immune checkpoints ICIs therapy. (A–D) The response to anti-PD1 or anti-CTLA4 in high-risk and low-risk groups. |
Prognostic Value of the Risk Score in the External Clinical Validation Set
We collected 50 HCC patients from the Liver Cancer Institute of Fudan University (Shanghai, China) as the external clinical validation set. First off, we detected the expression profile of all the 9 m6A-related lncRNAs of each patient’s tumor tissue and adjacent normal tissue and found that the results were consistent with TCGA cohort (Figure 11A). Then, the risk score of each patient was calculated based on the formula of risk model. Median risk score (3.067) served as the cut-off point dividing patients into high- and low-risk group. The baseline clinical characteristics of different risk groups are summarized in Table 3. Univariate and multivariate Cox regression analysis confirmed that risk score was notably associated with OS (Table 2). The baseline information of Kaplan–Meier curve showed that patients with high risk had a worse OS than those with low risk (P=0.035) (Figure 11B). The C-index for the risk score predicting OS of HCC patients was 0.744 in the external clinical cohort (Figure 11C). Time-dependent AUC ranged from 0.744 to 0.900, which indicated that the risk score had a satisfactory prediction value with the fluctuation of time (Figure 11D). The calibration plot graphically showed relatively good agreement between the actual survival status and predicted survival status (Figure 11E). In the light of these results, we concluded that the risk model constructed by 9 m6A-related lncRNAs had robust prognosis prediction value.
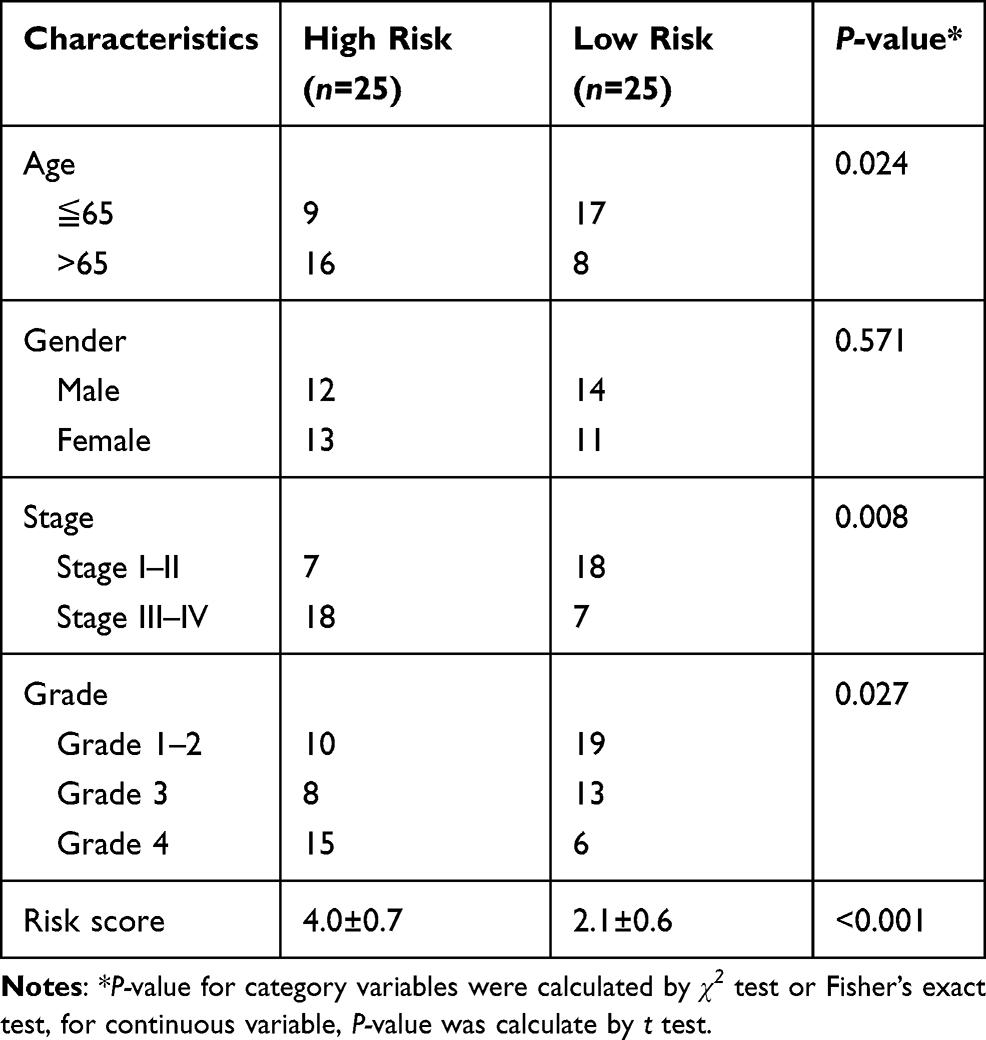 |
Table 3 Clinical Characteristics of HCC Patients in External Cohort Stratified by Risk Status |
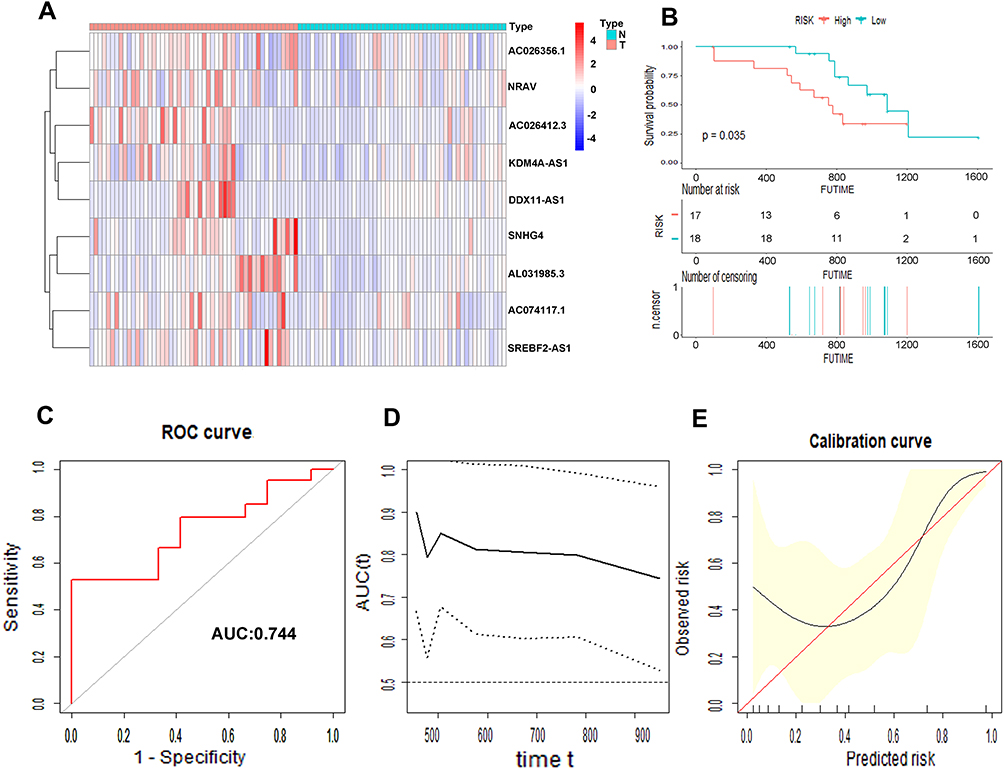 |
Figure 11 Prognostic value of the 9 m6A-related lncRNAs in the external cohort. The heatmap showed the expression profiles of the 9 m6A-related lncRNAs in 50 tumor tissues and adjacent normal tissues (A). The Kaplan–Meier curve of the OS between low risk and high risk split by median risk score (B). ROC curves of risk score for predicting OS (C). Time dependent AUC analysis where the solid and dashed lines depict the AUC and its 95% CI, respectively (D). The calibration curves of risk score for the prediction of survival (E). |
Silencing SNHG4 Inhibits HCC Proliferation, Migration and Invasion in vitro
SNHG4 had the highest coefficient of the risk model constructed by LASSO regression model, which meant that SNHG4 was highly associated with the prognosis of HCC. However, the role of SNHG4 in the development of HCC remains elusive. Therefore, we aimed to test whether SNHG4 plays biological roles in HCC. We first evaluated the transfection efficiency in the Huh7 and MHCCM3 by qRT-PCR and found that the expression level of SNHG4 was significantly decreased after transfection of si-SNHG4 (Figure 12A and B). The EdU incorporation assay revealed a significant suppression in the proliferation of Huh7 and MHCCLM3 cells after transfection of si-SNHG4 (Figure 12C and D). Then, colony formation assays indicated that the silencing of SNHG4 could significantly decrease the growth of both cell lines (Figure 12E and F). Transwell migration and invasion assays revealed that the down-regulation of SNHG4 could decrease the motility and invasiveness in both cell lines (Figure 12G and H). Finally, we detected the expression of proliferation-related and apoptosis-related proteins after silencing SNHG4 by Western blot analysis. As shown, silencing SNHG4 resulted in decreased ki67, PCNA and Bcl-2 expression, while it also led to increased Bax, Cleaved caspase-3 (Cleaved casp-3) and Cleaved caspase-9 (Cleaved casp-9) expression (Figure 12I and J). Overall, the above results indicated that silencing SNHG4 inhibits proliferation, migration and invasion of HCC.
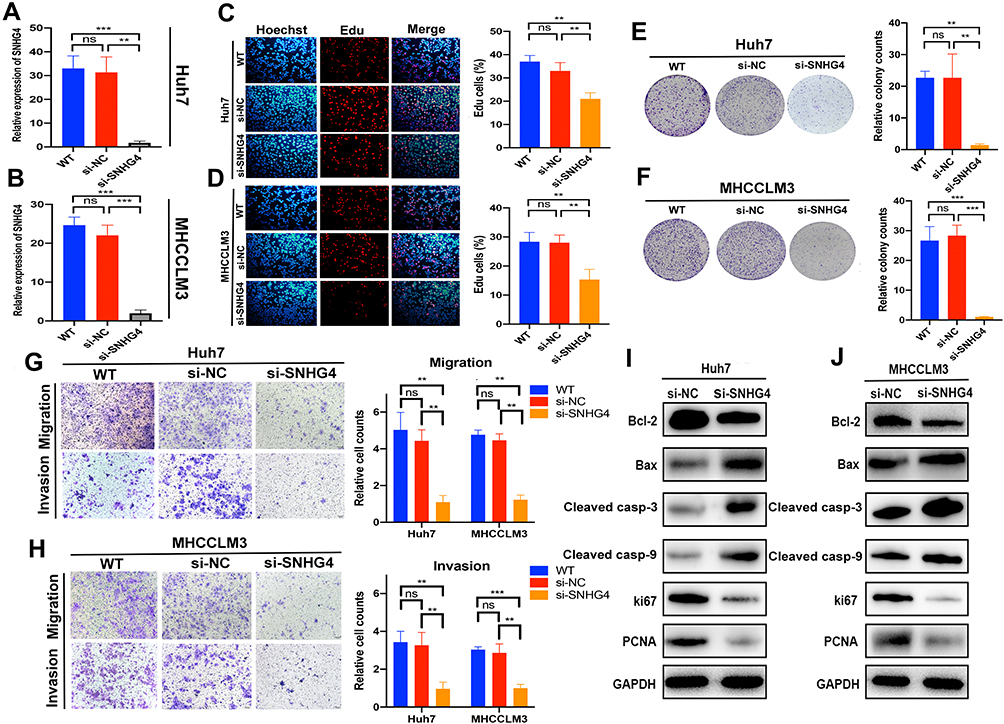 |
Figure 12 Silencing of SNHG4 inhibits proliferation, migration and invasion in vitro. qRT-PCR to detect the relative silencing levels of SNHG4 in Huh7 and MHCC-LM3 cells (A and B). Representative images of EdU assay of Huh7 and MHCC-LM3 with si-NC, si-SNHG4 and wild-type cells (C and D). Colony formation ability of Huh7 and MHCC-LM3 transfected with si-NC and si-SNHG4 and wild-type cells (E and F). Transwell assay for investigating migration and invasive properties Huh7 and MHCC-LM3 transfected with si-NC, si-SNHG4 and wild-type cells (G and H). Bcl-2, Bax, Cleaved casp-3, Cleaved casp-9, Ki67 and PCNA were assessed by Western blot analysis (I and J). **P<0.01, ***P<0.001, n=3. |
Overexpression of SNHG4 Accelerates Proliferations, Migration, Invasion of HCC Cells in vitro
Next, we transfected pcDNA3.1-SNHG4 plasmids into MHCCLM3 and PLC/PRF/5 cells, and qRT-PCR analysis showed that SNHG4 was greatly increased in cells overexpressing SNHG4 compared to those in the control cells (Figure 13A). Then we performed EdU incorporation assays, colony formation, migration and invasion assays to analyze the effect of SNHG4 on cell proliferations. Our results showed that SNHG4-overexpressing cells had significantly higher EdU incorporation (Figure 13B and C) and colony formation (Figure 13D and E). Moreover, SNHG4-overexpressing cells had increased abilities of migration and invasion compared to control cells (Figure 13F and G). Collectively, the above results demonstrated that SNHG4 overexpression promotes proliferation, migration and invasion of HCC.
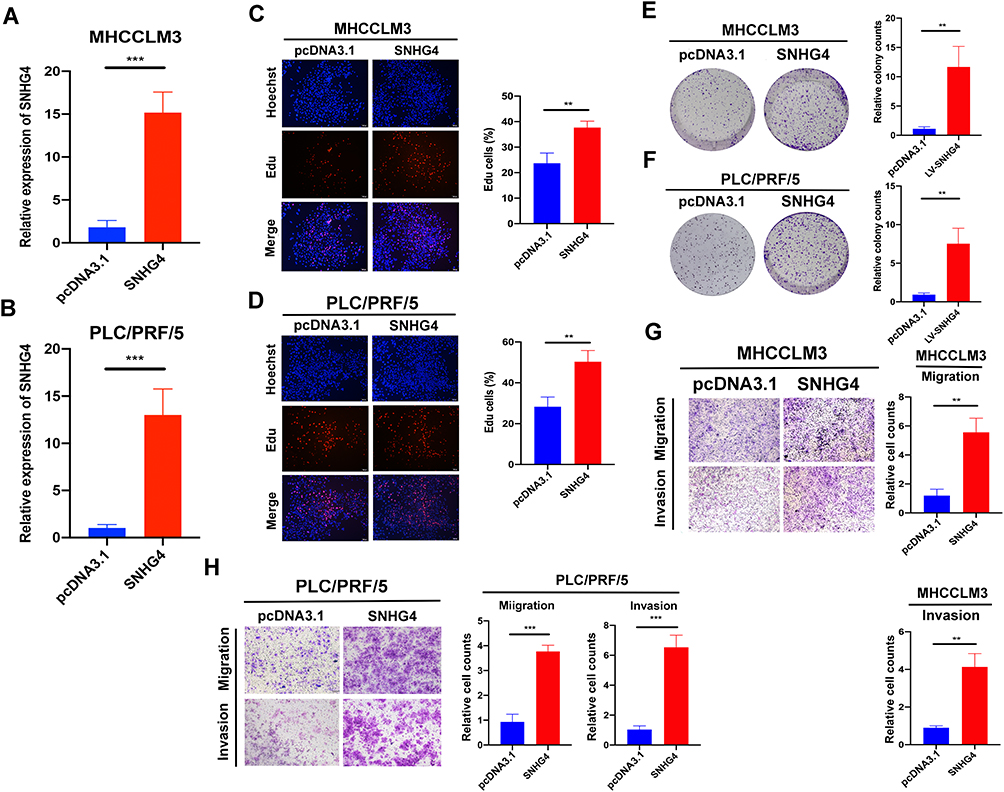 |
Figure 13 Overexpression of SNHG4 promotes proliferation, migration and invasion in vitro. qRT-PCR to detect the relative transfection efficiency of pcDNA3.1-SNHG4 in MHCCLM3 and PLC/PRF/5 cells (A and B). Representative images of EdU assay in pcDNA3.1 and SNHG4 of MHCC-LM3 and PLC/PRF/5 cells (C and D). Colony formation ability of MHCC-LM3 and PLC/PRF/5 cells transfected with pcDNA3.1 and SNHG4 (E and F). Transwell assay for investigating migration and invasive properties in MHCC-LM3 and PLC/PRF/5 cells transfected with pcDNA3.1 and SNHG4 (G and H). **P<0.01, ***P<0.001, n=3. |
Discussion
The interaction model between m6A and lncRNAs has gained more and more attention in recent years. Their regulatory network is involved in tumor cell proliferation, invasion and metastasis of various cancers, thus providing novel targets for cancer diagnosis and therapy.16 LncRNAs and M6A have been demonstrated to play pivotal roles in regulating cancer biological function, respectively, but the mutual regulation mechanism between them remains unclear. Therefore, it is of great value to explore the potential biological response of these deregulated m6A-related lncRNAs in cancers.
In this study, first of all, we screened out the lncRNAs related to m6A regulatory proteins in HCC samples from TCGA database based on their prognostic value. All selected lncRNAs were dramatically up-regulated in tumor tissues as risk factors for HCC prognosis. Then these HCC samples were clustered into two subtypes according to different expression patterns of lncRNAs. Among the finally identified 9 lncRNAs, SNHG4 and KDM4A-AS were the top two, which were highly correlated with HCC prognosis. SNHG4 has been demonstrated to be an oncogene in osteosarcoma by sponging miR-224-3p, and KDM4A was implicated to enhance the malignancy of various types of cancer including non-small cell lung cancer, prostate cancer and HCC.17–20 Our results unveiled that both of them probably interacted with m6A modification, promoting the exploration of a more sophisticated underlying mechanism of carcinogenesis. The risk score was constructed based on LASSO regression algorithm, with satisfactory prediction performance. Besides, we observed that risk score was also tightly associated with clinicopathological factors, such as stage and grade. According to the univariate and multivariate analysis, risk score was an independent factor affecting the prognosis of patients with HCC. These findings could serve as significant clinical prognosis indicators to some extent.
Mounting evidence demonstrated that m6A modification is actively involved in the immune system: m6A modification patterns were found to be associated with different immune profiles in colon cancer and gastric cancer, PD-L1 expression level also varies among various m6A patterns and thus m6A patterns could predict the immune therapy response as an innovative indicator.21,22 Consumption of FTO has been reported to suppress the expression of immune checkpoint genes, avoiding immune escape.23 In another study, researchers found that YTHDF1-deficient could enhance the antitumor response of antigen-specific CD8+ T cell and the efficacy of PD-L1 checkpoint blockade therapy.24 However, whether m6A regulators and lncRNAs can collaboratively influence the immune landscape in HCC has not been recognized. Herein, we revealed two distinct m6A-related lncRNA expression patterns of HCC samples based on the ESTIMATE algorithm, and found that the two distinct clusters had remarkably different stromal scores, with no statistical difference in immune scores. However, there were significant differences in the distribution of immune scores among different risk groups. Notably, patients from the low-risk group had higher immune scores, which may be related to infiltration of anti-tumor immune cells. GSEA was performed to further investigate the activation of biological pathways that differed in tumor prognosis and tumor microenvironment between the two clusters. The results indicated that cell cycle, Wnt signaling pathway, notch signaling pathway and RIG-1-like receptor signaling pathway were preferentially enriched in Cluster 2, with worse prognosis. Interestingly, the activation of these pathways also plays indispensable roles in modulating tumor immune environment. Previous studies suggested that Wnt overexpression disrupts immune cell recruitment, thereby reducing the CD8+ T cell infiltration.25 Notch signaling pathway can determine the differentiation of T cells and myeloid cells; moreover, notch also regulates other components of TME and cancer stem cells, participating in the complex cross-talk among these tumor-related cells.26 RIG-1 was also found to enhance anti-CTLA4 checkpoint blockade efficacy and prolong clinical responses.27 In summary, we hypothesized that m6A-related lncRNAs and these activated pathways collaboratively controlled the different prognosis and TME between two clusters.
For HCC, therapies are varied, including surgical resection, radiofrequency ablation, transcatheter arterial chemoembolization and liver transplant, but they are often limited by inevitably high recurrence rates or low candidate ratios.2 As a promising new therapy, immunotherapy has gradually changed the pattern of cancer treatment.28 The most studied immune checkpoints are PD-1 and CTLA4. The PD-1 pathway is involved in inhibiting the late activation of T cells in surrounding tissues, while CTLA4 regulates T cell immune responses mainly at the priming phase in lymph nodes.29 However, anti-PD-1 and anti-CTLA4 therapies often tend to be less effective, and thus an increasing number of immune checkpoints have been found, such as T cell immunoglobulin and ITIM domain (TIGIT), V-domain Ig suppressor of T cell activation (VISTA) and B7 homolog 3 protein (B7-H3).30 Recent evidence suggests that a possible explanation for different response rates of immune checkpoint blockade might be epigenetic modifications.31,32 We investigated the relationship between lncRNAs and immune profiles in a variety of cancer types, and the results highlighted the potential role of lncRNAs in predicting immunotherapy responses.33,34 Meanwhile, Sun et al34 found that inhibition of METTL3 and METTL4 could augment response of anti-PD-1 treatment in colorectal cancer and melanoma. In our study, we attempted to investigate the mutual function of m6A and lncRNAs involved in controlling the expression of immune checkpoint genes. We found that Cluster 2 had higher expression of immune checkpoint genes, and the high-risk group had consistent results. Besides, the correlation of each m6A-related lncRNA and immune checkpoint genes was also identified. Most importantly our findings uncovered that different expression patterns of m6A-related lncRNAs may have potential to evaluate the response to immune checkpoint blockade therapy.
Small nucleolar RNA host gene (SNHG) family has been widely studied in the development of HCC by regulating the molecular signal networks. SNHG mostly acts as a ceRNA binding miRNA to modulate diverse pathways in HCC.35 Elevated expression of SNHG16 is associated with poor prognosis in HCC, and SNHG16 promotes HCC progression through the miR-302a-3p/FGF19 axis.36 SNHG3 was determined to facilitate HCC invasion by regulating the EMT via the miR-128/CD151/Akt/PI3K/Snail pathway.37 SNHG4 has also been reported to participate in diverse tumor biology; it can facilitate cervical cancer progression by targeting miR-148a-3p to regulate C-Met.38 In prostate cancer, SNHG4 could be up-regulated by SP1 and regulating ZIC5 via miR-377.39 However, how SNHG4 takes part in the HCC development is unclear. In our study, qRT-PCR, EdU incorporation assays, transwell migration and invasion assays and Western blot assays were used to explore the correlation between HCC and SNHG4, and we found that up-regulated SNHG4 was positively correlated with HCC. The results were in accordance with bioinformatics analysis. Bcl-2/Bax/Cleaved caspase-3 as an apoptotic signaling pathway has been implicated in various diseases.40,41 Our Western blot analysis revealed that silencing SNHG4 could down-regulate Bcl-2 expression, while the expressions of Bax, Cleaved caspase-3 and Cleaved caspase-9 increased, indicating that SNHG4 might regulate apoptosis in HCC. However, as an m6A-related lncRNA, the in-depth regulation network of SNHG4 in HCC should be further explored.
Our study also has several limitations. Firstly, the results of the study should be further validated in external cohorts with larger numbers. Secondly, more specific mechanisms of interplay between m6A and lncRNAs and how this regulatory pattern contributes to the reshape of TME should be further explored. Thirdly, whether m6A-related lncRNAs participate in other biological processes of cancer should be investigated. Finally, although the correlations between the risk model and clinicopathological features or TME have statistical differences, the clinical differences should be further validated because the mean differences were not so obvious.
In summary, patients from TCGA-LIHC database were divided into Cluster 1 or 2 by consensus clustering analysis according to expression patterns of m6A-related lncRNAs. Then, based on the prognosis value of m6A-related lncRNAs, a risk score was constructed with satisfactory prognostic value, which was further confirmed in the external clinical cohort. Meanwhile, patients in the Cluster 1 or 2 or different risk groups were also significantly associated with clinicopathological characteristics, TME and immune checkpoint gene expression levels. Finally, SNHG4 was identified as an oncogenic m6A-related lncRNA for promoting HCC progression in vitro.
Data Sharing Statement
A publicly available database was analyzed in this study; it can be found in the The Cancer Genome Atlas (https://portal.gdc.cancer.gov/).
Ethics Statement
This study protocol which involved human participants was approved by the Clinical Research Ethics Committee of Zhongshan Hospital of Fudan University (B2018-236), and informed consent was obtained from all of the patients. All the analyses of data and material have been performed in accordance with the Declaration of Helsinki.
Acknowledgments
This work was supported by grants from the National Natural Science Foundation of China (grant number 91859107), the Shanghai Science and Technology Committee (grant number 18DZ1930102, grand number 19411965500), the Shanghai Municipal Key Clinical Specialty (shslczdzk03202), the Clinical Research Plan of SHDC (SHDC2020CR1029B), Zhongshan Hospital, Fudan University (grant number 2018ZSLC22, 2020ZSLC61) and Clinical Research Plan of SHDC (SHDC2020CR1029B).
Disclosure
All authors state that they have no conflicts of interest.
References
1. Yang JD, Hainaut P, Gores GJ, Amadou A, Plymoth A, Roberts LR. A global view of hepatocellular carcinoma: trends, risk, prevention and management. Nat Rev Gastroenterol Hepatol. 2019;16(10):589–604. doi:10.1038/s41575-019-0186-y
2. Llovet JM, Montal R, Sia D, Finn RS. Molecular therapies and precision medicine for hepatocellular carcinoma. Nat Rev Clin Oncol. 2018;15(10):599–616. doi:10.1038/s41571-018-0073-4
3. Lu C, Rong D, Zhang B, et al. Current perspectives on the immunosuppressive tumor microenvironment in hepatocellular carcinoma: challenges and opportunities. Mol Cancer. 2019;18(1):130. doi:10.1186/s12943-019-1047-6
4. He L, Li H, Wu A, Peng Y, Shu G, Yin G. Functions of N6-methyladenosine and its role in cancer. Mol Cancer. 2019;18(1):176. doi:10.1186/s12943-019-1109-9
5. Chen M, Wei L, Law CT, et al. RNA N6-methyladenosine methyltransferase-like 3 promotes liver cancer progression through YTHDF2-dependent posttranscriptional silencing of SOCS2. Hepatology. 2018;67(6):2254–2270. doi:10.1002/hep.29683
6. Li J, Zhu L, Shi Y, Liu J, Lin L, Chen X. m6A demethylase FTO promotes hepatocellular carcinoma tumorigenesis via mediating PKM2 demethylation. Am J Transl Res. 2019;11(9):6084–6092.
7. Hou J, Zhang H, Liu J, et al. YTHDF2 reduction fuels inflammation and vascular abnormalization in hepatocellular carcinoma. Mol Cancer. 2019;18(1):163. doi:10.1186/s12943-019-1082-3
8. Bhan A, Soleimani M, Mandal SS. Long Noncoding RNA and Cancer: a New Paradigm. Cancer Res. 2017;77(15):3965–3981. doi:10.1158/0008-5472.CAN-16-2634
9. Huang Z, Zhou JK, Peng Y, He W, Huang C. The role of long noncoding RNAs in hepatocellular carcinoma. Mol Cancer. 2020;19(1):77. doi:10.1186/s12943-020-01188-4
10. Dai F, Wu Y, Lu Y, et al. Crosstalk between RNA m(6)A Modification and Non-coding RNA Contributes to Cancer Growth and Progression. Mol Ther Nucleic Acids. 2020;22:62–71. doi:10.1016/j.omtn.2020.08.004
11. Huang H, Weng H, Chen J. m(6)A Modification in Coding and Non-coding RNAs: roles and Therapeutic Implications in Cancer. Cancer Cell. 2020;37(3):270–288. doi:10.1016/j.ccell.2020.02.004
12. Chen Y, Lin Y, Shu Y, He J, Gao W. Interaction between N(6)-methyladenosine (m(6)A) modification and noncoding RNAs in cancer. Mol Cancer. 2020;19(1):94. doi:10.1186/s12943-020-01207-4
13. Fazi F, Fatica A. Interplay Between N (6)-Methyladenosine (m(6)A) and Non-coding RNAs in Cell Development and Cancer. Front Cell Dev Biol. 2019;7:116. doi:10.3389/fcell.2019.00116
14. Zuo X, Chen Z, Gao W, et al. M6A-mediated upregulation of LINC00958 increases lipogenesis and acts as a nanotherapeutic target in hepatocellular carcinoma. J Hematol Oncol. 2020;13(1):5. doi:10.1186/s13045-019-0839-x
15. Lan T, Li H, Zhang D, et al. KIAA1429 contributes to liver cancer progression through N6-methyladenosine-dependent post-transcriptional modification of GATA3. Mol Cancer. 2019;18(1):186. doi:10.1186/s12943-019-1106-z
16. Ma S, Chen C, Ji X, et al. The interplay between m6A RNA methylation and noncoding RNA in cancer. J Hematol Oncol. 2019;12(1):121. doi:10.1186/s13045-019-0805-7
17. Xu R, Feng F, Yu X, Liu Z, Lao L. LncRNA SNHG4 promotes tumour growth by sponging miR-224-3p and predicts poor survival and recurrence in human osteosarcoma. Cell Prolif. 2018;51(6):e12515. doi:10.1111/cpr.12515
18. Chen DB, Xie XW, Zhao YJ, et al. RFX5 promotes the progression of hepatocellular carcinoma through transcriptional activation of KDM4A. Sci Rep. 2020;10(1):14538. doi:10.1038/s41598-020-71403-1
19. Sun S, Yang F, Zhu Y, Zhang S. KDM4A promotes the growth of non-small cell lung cancer by mediating the expression of Myc via DLX5 through the Wnt/β-catenin signaling pathway. Life Sci. 2020;262:118508. doi:10.1016/j.lfs.2020.118508
20. Mu H, Xiang L, Li S, Rao D, Wang S, Yu K. MiR-10a functions as a tumor suppressor in prostate cancer via targeting KDM4A. J Cell Biochem. 2019;120(4):4987–4997. doi:10.1002/jcb.27774
21. Chong W, Shang L, Liu J, et al. m(6)A regulator-based methylation modification patterns characterized by distinct tumor microenvironment immune profiles in colon cancer. Theranostics. 2021;11(5):2201–2217. doi:10.7150/thno.52717
22. Zhang B, Wu Q, Li B, Wang D, Wang L, Zhou YL. m(6)A regulator-mediated methylation modification patterns and tumor microenvironment infiltration characterization in gastric cancer. Mol Cancer. 2020;19(1):53. doi:10.1186/s12943-020-01170-0
23. Su R, Dong L, Li Y, et al. Targeting FTO Suppresses Cancer Stem Cell Maintenance and Immune Evasion. Cancer Cell. 2020;38(1):79–96.e11. doi:10.1016/j.ccell.2020.04.017
24. Han D, Liu J, Chen C, et al. Anti-tumour immunity controlled through mRNA m(6)A methylation and YTHDF1 in dendritic cells. Nature. 2019;566(7743):270–274. doi:10.1038/s41586-019-0916-x
25. Pai SG, Carneiro BA, Mota JM, et al. Wnt/beta-catenin pathway: modulating anticancer immune response. J Hematol Oncol. 2017;10(1):101. doi:10.1186/s13045-017-0471-6
26. Janghorban M, Xin L, Rosen JM, Zhang XH. Notch Signaling as a Regulator of the Tumor Immune Response: to Target or Not To Target? Front Immunol. 2018;9:1649. doi:10.3389/fimmu.2018.01649
27. Heidegger S, Wintges A, Stritzke F, et al. RIG-I activation is critical for responsiveness to checkpoint blockade. Sci Immunol. 2019;4:39. doi:10.1126/sciimmunol.aau8943
28. Johnston MP, Khakoo SI. Immunotherapy for hepatocellular carcinoma: current and future. World J Gastroenterol. 2019;25(24):2977–2989. doi:10.3748/wjg.v25.i24.2977
29. Topalian SL, Taube JM, Anders RA, Pardoll DM. Mechanism-driven biomarkers to guide immune checkpoint blockade in cancer therapy. Nat Rev Cancer. 2016;16(5):275–287. doi:10.1038/nrc.2016.36
30. Qin S, Xu L, Yi M, Yu S, Wu K, Luo S. Novel immune checkpoint targets: moving beyond PD-1 and CTLA-4. Mol Cancer. 2019;18(1):155. doi:10.1186/s12943-019-1091-2
31. Ali MA, Matboli M, Tarek M, et al. Epigenetic regulation of immune checkpoints: another target for cancer immunotherapy? Immunotherapy. 2017;9(1):99–108. doi:10.2217/imt-2016-0111
32. Xu F, Jin T, Zhu Y, Dai C. Immune checkpoint therapy in liver cancer. J Exp Clin Cancer Res. 2018;37(1):110. doi:10.1186/s13046-018-0777-4
33. Zhang Y, Zhang L, Xu Y, Wu X, Zhou Y, Mo J. Immune-related long noncoding RNA signature for predicting survival and immune checkpoint blockade in hepatocellular carcinoma. J Cell Physiol. 2020;235(12):9304–9316. doi:10.1002/jcp.29730
34. Sun J, Zhang Z, Bao S, et al. Identification of tumor immune infiltration-associated lncRNAs for improving prognosis and immunotherapy response of patients with non-small cell lung cancer. J Immunother Cancer. 2020;8:1. doi:10.1136/jitc-2019-000110
35. Shuwen H, Xi Y, Quan Q, Yin J, Miao D. Can small nucleolar RNA be a novel molecular target for hepatocellular carcinoma? Gene. 2020;733:144384. doi:10.1016/j.gene.2020.144384
36. Li W, Xu W, Song JS, Wu T, Wang WX. LncRNA SNHG16 promotes cell proliferation through miR-302a-3p/FGF19 axis in hepatocellular carcinoma. Neoplasma. 2019;66(3):397–404. doi:10.4149/neo_2018_180720N504
37. Zhang PF, Wang F, Wu J, et al. LncRNA SNHG3 induces EMT and sorafenib resistance by modulating the miR-128/CD151 pathway in hepatocellular carcinoma. J Cell Physiol. 2019;234(3):2788–2794. doi:10.1002/jcp.27095
38. Li H, Hong J, Wijayakulathilaka W. Long non-coding RNA SNHG4 promotes cervical cancer progression through regulating c-Met via targeting miR-148a-3p. Cell Cycle. 2019;18(23):3313–3324. doi:10.1080/15384101.2019.1674071
39. Wang ZY, Duan Y, Wang P. SP1-mediated upregulation of lncRNA SNHG4 functions as a ceRNA for miR-377 to facilitate prostate cancer progression through regulation of ZIC5. J Cell Physiol. 2020;235(4):3916–3927. doi:10.1002/jcp.29285
40. Yip KW, Reed JC. Bcl-2 family proteins and cancer. Oncogene. 2008;27(50):6398–6406. doi:10.1038/onc.2008.307
41. Gaumer S, Guénal I, Brun S, Théodore L, Mignotte B. Bcl-2 and Bax mammalian regulators of apoptosis are functional in Drosophila. Cell Death Differ. 2000;7(9):804–814. doi:10.1038/sj.cdd.4400714
 © 2021 The Author(s). This work is published and licensed by Dove Medical Press Limited. The full terms of this license are available at https://www.dovepress.com/terms.php and incorporate the Creative Commons Attribution - Non Commercial (unported, v3.0) License.
By accessing the work you hereby accept the Terms. Non-commercial uses of the work are permitted without any further permission from Dove Medical Press Limited, provided the work is properly attributed. For permission for commercial use of this work, please see paragraphs 4.2 and 5 of our Terms.
© 2021 The Author(s). This work is published and licensed by Dove Medical Press Limited. The full terms of this license are available at https://www.dovepress.com/terms.php and incorporate the Creative Commons Attribution - Non Commercial (unported, v3.0) License.
By accessing the work you hereby accept the Terms. Non-commercial uses of the work are permitted without any further permission from Dove Medical Press Limited, provided the work is properly attributed. For permission for commercial use of this work, please see paragraphs 4.2 and 5 of our Terms.