")
Back to Journals » International Journal of General Medicine » Volume 15
Analysis of Gene Co-Expression Network to Identify the Role of CD8 + T Cell Infiltration-Related Biomarkers in High-Grade Glioma
Authors Feng P, Li Y, Tian Z, Qian Y, Miao X, Zhang Y
Received 26 November 2021
Accepted for publication 8 February 2022
Published 22 February 2022 Volume 2022:15 Pages 1879—1890
DOI https://doi.org/10.2147/IJGM.S348470
Checked for plagiarism Yes
Review by Single anonymous peer review
Peer reviewer comments 4
Editor who approved publication: Dr Scott Fraser
Peng Feng,1,* Yuchen Li,2,* Zhijie Tian,1,* Yuan Qian,1 Xingyu Miao,1 Yuelin Zhang3
1Neurosurgery, Shaanxi Provincial People’s Hospital, Xian, 710068, People’s Republic of China; 2Hengyang Medical School, University of South China, Hengyang, 421001, People’s Republic of China; 3Xi’an Medical University, Xian, 710021, People’s Republic of China
*These authors contributed equally to this work
Correspondence: Xingyu Miao; Yuelin Zhang, Email [email protected]; [email protected]
Background: High-grade glioma is a type of heterogeneous lethal brain tumor most common in adults. At present, immune checkpoint inhibitors (ICIs) are being considered for first-line therapeutics for malignant GBM. Nonetheless, molecular markers for malignant GBM are unavailable at present. As a result, it is important to explore molecular markers related to immunity for GBM.
Materials and Methods: The present study adopted a deconvolution algorithm for quantifying immunocyte composition and measuring gene expression, and used weighted gene co-expression network analysis (WGCNA) to analyze GBM expression data obtained from Gene Expression Omnibus (GEO), Chinese Glioma Genome Atlas (CGGA), and the Cancer Genome Atlas Glioblastoma Multiforme (TCGA-GBM) databases. Thereafter, key CD8+ T cell infiltration-related genes and modules were identified, and database analysis was conducted to verify the therapeutic and immune features of the selected genes.
Results: From this study, CD8+ T cell-related modules were identified. By using consistent clustering analysis, two panels of genes (red and green) with the highest correlation with CD8+ T cells infiltration were used to construct high-, low-expression groups, silent and/or mixed group of T cell infiltrations. In the high and low CD8+ T cell infiltration groups, a total of 535 differential genes were obtained, of which ten genes (RPS5, RPS6, FAU, RPS19, RPS23, RPS15A, RPS29, RPS14, RPS16, RPS27A) were identified through protein–protein interactions and co-expression network analysis. Post Cox regression and Kaplan–Meier (K-M) survival analysis, RPS5, RPS6, and RPS16 were selected as candidate prognostic biomarkers related to CD8+ T cells.
Conclusion: The three associated genes RPS5, RPS6, and RPS16 were markedly related to degree of T cell infiltration and immune-related activated. We identified their potential biomarkers and therapeutic targets associated with the extent of CD8+ T cell infiltration in GBM.
Keywords: prognosis, mutation, glioblastoma, gene, WGCNA
Introduction
Glioblastoma (GBM) is a cancer condition that can occur at any age, but especially frequently among adult gliomas (approximately 45% of all gliomas).1,2 However, the prognosis is extremely poor with a median survival rate of 12–15 months.3 A recent study showed that the inhibition of the surveillance of immune response can contribute to the growth of brain cancer tissue. The interaction between glioblastoma cells and extracellular matrix (ECM) has been found to be another key point in the occurrence of glioma. In addition, exposure to radiation causes GBM; long-term exposure to higher doses of non-ionizing radiation is related to the formation of GBM. Finally, viral infections such as cytomegalovirus (CMV)-induced mutations are considered to be a potential cause of GBM formation.4 Often, surgery is the first choice of treating patients with GBM, where the tumor tissue is removed with great precision, fully protecting the brain function of patients, combined with radiotherapy, chemotherapy, and electric field treatment with integrated adjuvant treatment measures.5 However, GBM, being highly invasive, is difficult to eradicate with surgery, and therefore the patients’ prognosis may be poor and the mortality rate remains high. Hence, new treatment methods need to be designed to control tumor progression and improve patient prognosis.
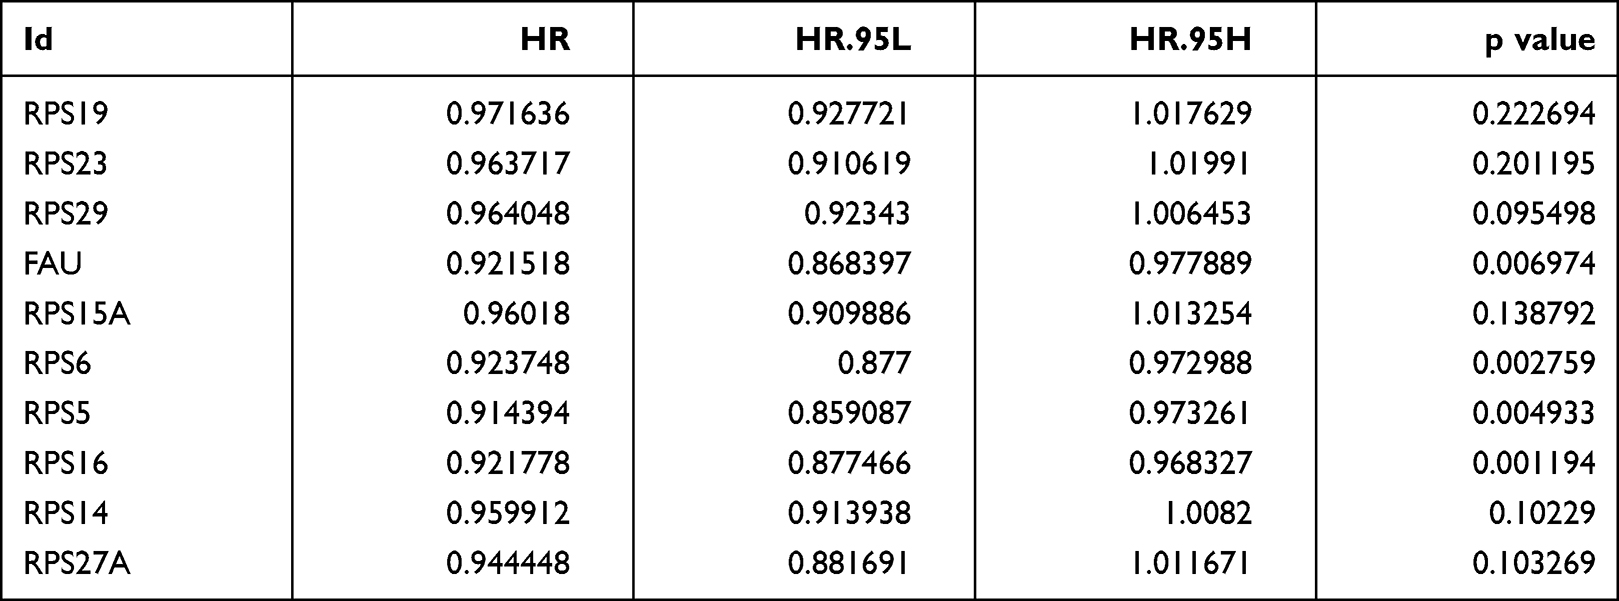 |
Table 1 Univariate Cox Proportional Hazards Analyses of Overall Survival of GBM Patients |
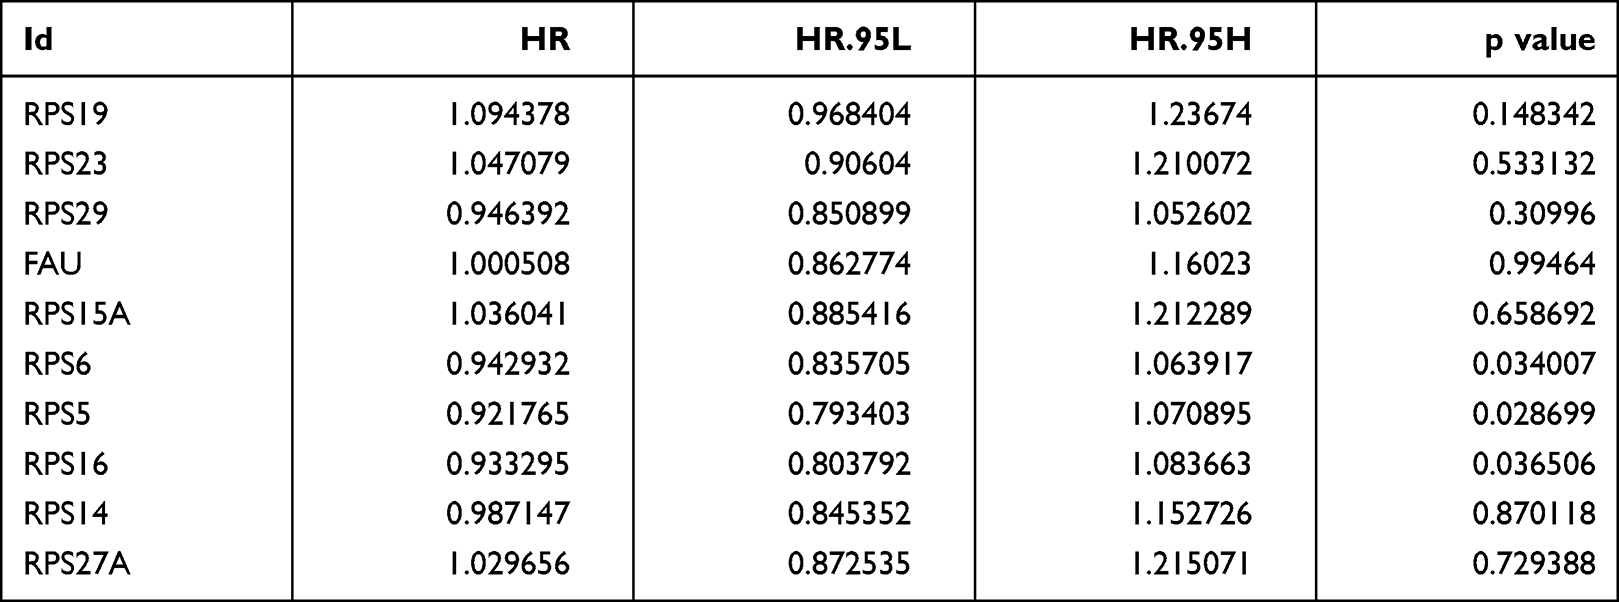 |
Table 2 Multivariate Cox Analysis Showing the Hazard Ratios (HR) of Different Factors |
In recent years, immune checkpoint inhibitors have played a key role in providing anti-tumor effect by intervening in the interaction of the checkpoint molecular receptors with their ligands, thereby regulating tumor immune response. Further, a lot has been discovered about the molecular mechanisms associated with GBM genesis and progression, the immune system, and the central nervous system (CNS).6–8 With this background, immune checkpoint inhibitors (ICIs) are now being considered for first-line therapeutics for malignant GBM. Nonetheless, molecular markers for malignant GBM are unavailable at present. As a result, it is important to explore molecular markers related to immunity for GBM.
The strong changes induced in tumor microenvironment (TME) features affect immunotherapy response and play an important role.9–12 Among the diverse tumor immune cells, CD8+ T cells are known to be associated with the adaptive immunity of tumors occupying the greatest fraction and function. In many solid tumors, a high degree of CD8 + T cell infiltration was found to be the main factor for tumor immunotherapy.13–15 Immune biomarkers for high-grade gliomas have been analyzed extensively, yet it is not possible to use these observed candidate factors in clinical practice directly. Therefore, the identification of biomarkers related to the immune infiltration mechanism of CD8+ T cells may contribute to monitoring the response to GBM immunotherapy.
A recent study showed that a higher CD8/CD4 ratio is a predictor of overall survival in glioblastoma patients, and also the proliferation of CD8+ T cells could enhance survival, and measures may be taken to promote the dominance of CD8+ T cells in GBM to interfere with the immunoregulatory effects of IFNγ in the tumor microenvironment.16
In recent years, technology involving bioinformatics has rapidly developed, and numerous approaches have been established for identifying biomarkers.17 Weighted gene co-expression network analysis (WGCNA) has been developed as an efficient approach for mining gene correlations in identifying pivotal anticancer genes and related modules.20 This algorithm approach has been extensively used for identifying RNA transcripts.18,19 Typically, a cell type is identified by estimating relative subsets of RNA transcripts. Similarly, CIBERSORT is a bioinformatics approach for the analysis of gene expression profiles that utilizes the deconvolution algorithm for quantifying immunocytes21 and estimates the degree of immune cell infiltration within each malignant tumor type, like prostate cancer (PCa)22 or kidney cancer.23
To explore the functional role of TME and identify a suitable biomarker for GBM, this study adopted WGCNA based gene expression profiles in GBM and CIBERSORT algorithm for calculating the composition of T cells in samples. Thereafter, key CD8+ T cell infiltration-related genes and modules were identified, and database analysis was conducted to verify the therapeutic and immune features of the selected genes. Through this study, we also discovered and validated candidate prognostic biomarkers.
Materials and Methods
Sources of Gene Expression Profiles
The mRNA expression profiles were obtained from 1092 GBM samples in Gene Expression Omnibus (GEO, http://www.ncbi.nlm.nih.gov/geo/), CGGA, and TCGA databases. A total of 1092 patients’ mRNA expression with detailed survival information was download from TCGA-GBM from TCGA database (https://portal.gdc.cancer.gov/), CGGA dataset and GEO datasets including GSE4412 and GSE7696. After merging of multiple data-sets across platforms, the normalization of data was required. Expression values were log-transformed and meanwhile we used the “ComBat” algorithm to reduce the possibility of batch effects due to non-biotech bias between different data-sets.
Evaluation of Tumor-Infiltrating Immune Cells
CIBERSORT, an analytical algorithm used to analyze RNA expression profiles for assessing diverse cell type proportions from every sample, showed 22 TIIC scores. And then, we used the 22 TIIC scores as the trait data of WGCNA.
Co-Expression Network Construction
The R package “WGCNA” was used to build the co-expression network considering the levels of 4187 genes. Firstly, a single transcript expression profile was transformed to a similarity matrix according to Pearson’s correlation coefficients of matched genes. Subsequently, the similarity matrix was transformed into an adjacent matrix, like amn = |cmn|β (amn = paired gene adjacency; cmn = paired gene Pearson’s correlation). Typically, β enhanced the potent gene-gene correlation while reducing poor correlations. To construct a scale-free network, this study selected β = 7 to be a soft thresholding power (Figure 1A and B). At this β, the adjacency matrix was converted into a topological overlap matrix. Thereafter, the hierarchical clustering tree was built by dynamic hybrid cutting, where one leaf stood for one gene. To classify genes whose expression profiles were close in diverse modules, a dynamic hybrid cutting approach was adopted for which the bottom-up algorithm was used, and a minimal module size threshold was set to be 30. The focus of the study was to show red and green modules associated with CD8+ T cells and to identify the two central modules (Figure 2A).
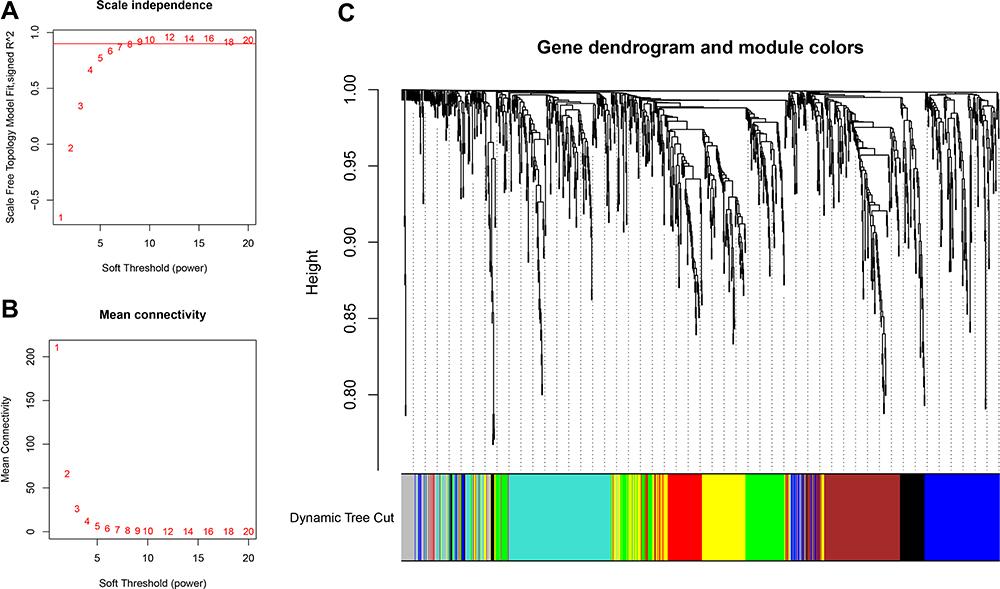 |
Figure 1 Selection of appropriate beta value to construct hierarchical clusters by (A) analysis of the unscaled fitting index of 1–20 soft threshold power (β). (B) Analysis of the average connectivity of 1–20 soft threshold powers. (C) Classification of genes into different modules through hierarchical clustering (different colors are used to represent different modules). |
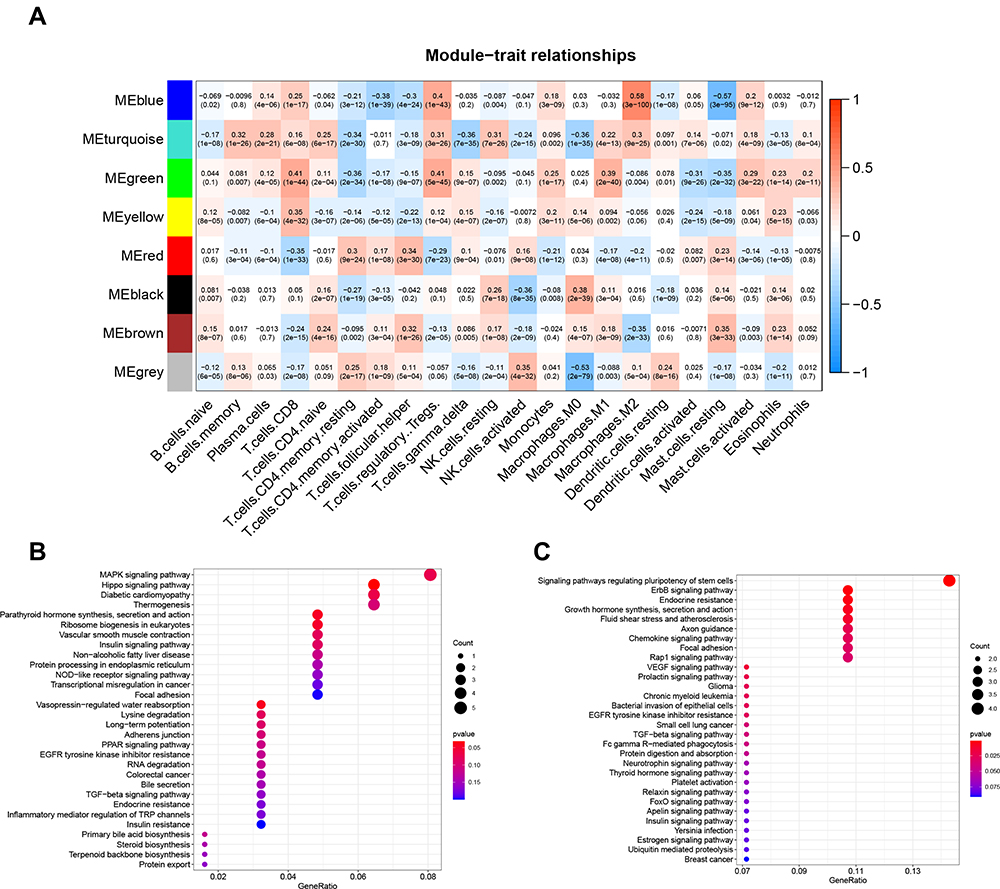 |
Figure 2 (A) The heat map showing a correlation between characteristic genes of the module and infiltration of T cells. Enrichment analysis of genes in (B) green pane. (C) red panel. |
Genomic Variation Analysis (GSVA) and Functional Annotation
To explore differences in BPs in the previously mentioned four groups, the R package “GSVA” was adopted. Based on MSigDB database, this study acquired “c2.cp.kegg.v6.2.symbols” for GSVA. Adjusted P<0.05 value stood for statistical significance. Group-related genes were later annotated by R package cluster Profiler upon the threshold of FDR<0.05.
We included the use of the gray and brown plates as T CD8+ high-infiltration-related genes and low-infiltration-related genes, respectively, and used consensus ClusterPlus (parameters: rep¼100, pItem¼0.8, pFeature¼1) for clustering. Euclidean distance and D2 were used to measure distance and clustering algorithm separately.
Results
Tumor-Infiltrating Immune Cells (TIIC) Assessment
CIBERSORT, an analytical algorithm used to analyze RNA expression profiles for assessing diverse cell type proportions from every sample, showed 22 TIIC scores. And then, we used the 22 TIIC scores as the trait data of WGCNA.
GBM Gene Co-Expression Network
The co-expression network was built based on 4187 gene expression profiles by R package “WGCNA”. Thereafter, the mean Pearson’s correlation and linkage coefficients were determined for clustering 1092 samples, while genes showing close expression profiles were clustered for forming a tree branch, which stood for one gene module. To build a scale-free network, we picked β = 8 (scale free R2 = 0.87676) as the soft-thresholding power (Figure 1A and B). There were eight modules formed (Figure 1C).
Identification and Enrichment Analysis of Hub Modules
Among these eight modules, we selected CD8+ T cells as candidate markers and therefore focused on showing red and green modules associated with CD8 + T cells (Figure 2A). The green module showed a strong negative correlation with CD8+ T cells (R2 = 0.41, P = 1e-44), and the red module showed a strong positive correlation with CD8 + T cells (R2 =−0.35, P = 1e−33). Among them, the red section showed a total of 81 genes, and the green section showed a total of 128 genes. Many genes observed from the red section were found to be related to pathways that regulate immunity, like the pathway modulating stem cell pluripotency, the ErbB pathway, and endocrine resistance (Figure 2C). The genes in the green section were enriched with pathways that negatively regulate immunity, such as the MAPK signaling pathway and the Hippo signaling pathway (Figure 2B).
Immunity Section Grouping
The median expression level of co-expressed gray panel genes and the median expression level of brown panel genes were used to assign groups that showed CD8+ T cells with high infiltration group (gray panel gene>0, brown panel gene <0) and CD8+ T cells with low infiltration group (gray panel gene <0, brown panel gene>0), mixed group (gray panel gene>0, brown panel gene>0) and silent group (gray panel gene<0, brown panel gene<0) (Figure 3A–C). The CD8+ T cells were found to belong to the high infiltration group, which was further verified for acceptable infiltration levels (Figure 3D).
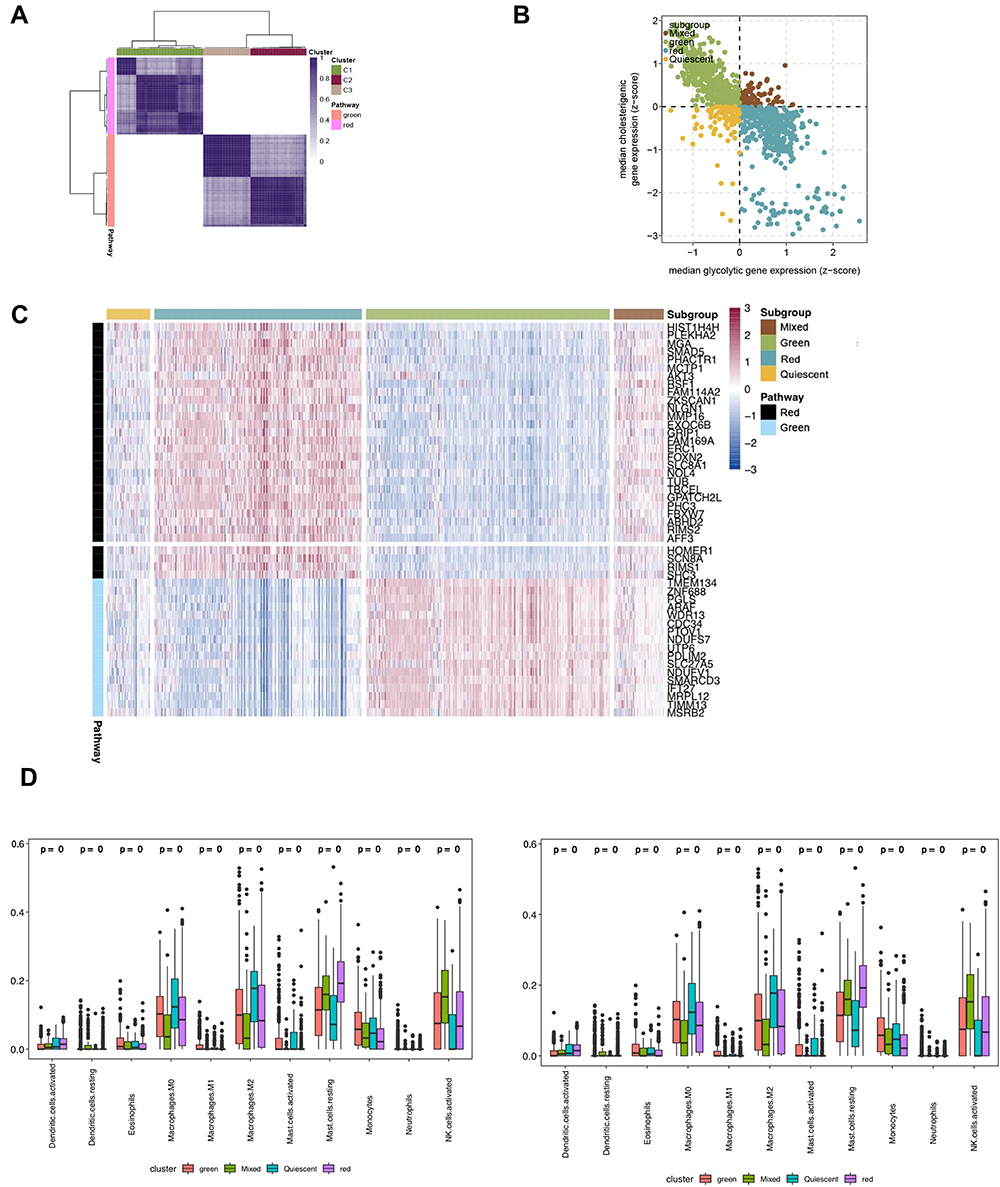 |
Figure 3 (A) The heat map depicting a consistent clustering solution (k = 3) of related genes represented in red and green blocks in the GBM sample (n = 1092). (B) Scatter plot showing the median expression level of a red plate (x-axis) and green plate (y-axis) genes co-expressed in each GBM sample with subgroups assigned based on the relative expression levels of related genes in red and green panels. (C) The heat map depicting the expression levels of genes co-expressed in red and green panels in each subgroup. (D) The distribution of immune cells in each subgroup. |
Grouped Enrichment Analysis
The biological behavior between different groups by GSVA (Figure 4) showed the green plate to be significantly enriched with oxidative phosphorylation and ribosome. The red plate showed the enrichment pathways related to complete immune suppression, including the TGF beta, ERBB, and MTOR pathways.
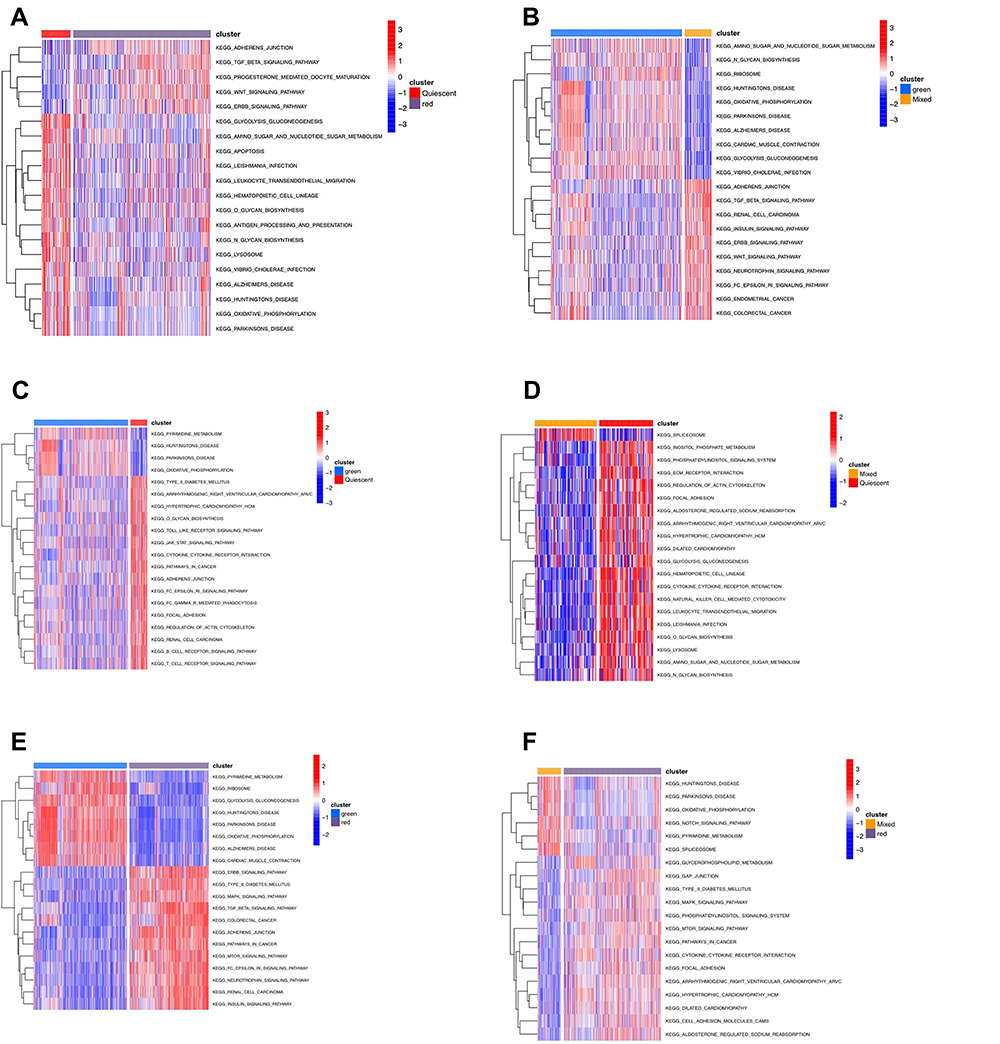 |
Figure 4 (A–F) The biology function analysis between different subtypes. |
Differential Gene Analysis and Prognostic Analysis of High and Low Infiltration Groups
Analysis of differential genes by Limma, between high and low infiltration groups to identify key genes that affect CD8+ T cell infiltration, showed altogether 535 differential genes (Figure 5A). The search approach (STRING; http://string-db.org) to identify interacting genes for construction of PPI network was based on co-regulated pivot genes and evaluated significant differences between these DEG-encoded proteins. Interaction and Cytoscape (v3.0, https://cytoscape.org/) software for identifying and visualizing interaction between these proteins along with cytoHubba software were used to screen the top 10 core genes (Figure 5B). Following that, we extracted these 10 core genes and tested them for survival and prognosis analysis, wherein we found that a total of 3 genes showed survival differences, including RPS5, RPS6, and RPS16 (p<0.5, Figure 5C–E). In COX analysis, these genes were shown to become independent prognostic factors (Tables 1 and Tables 2).
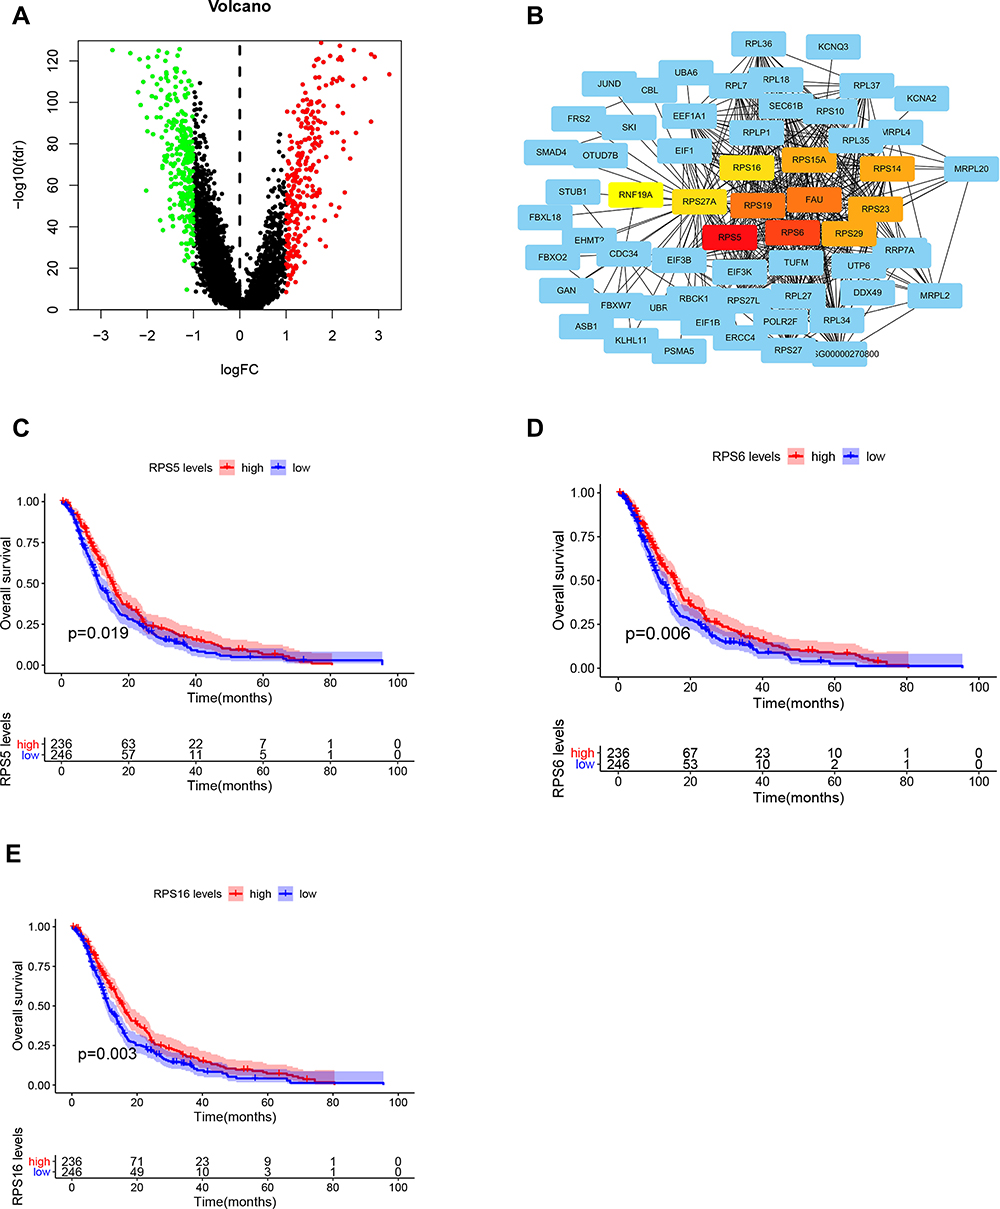 |
Figure 5 (A) Differential gene analysis of the red and green panel group. (B) Screening of core genes from differential genes. (C–E) Survival curves of RPS5, RPS6, and RPS16. |
Discussion
The immune system of a human body is equivalent to a “scavenger” in its functioning. During the normal physical condition, it can identify and remove cancer cells from the TME. However, the malignant tumor cells bypass this effect and can develop into a variety of types under the supervision of the same immune system, thereby escaping the attack strategies of the immune system, which include the various stages of the anti-tumor immune response.
GBM is a frequently occurring aggressive adult cancer condition which, like other tumors, genetically alters the host causing a diseased state due to the loss of control over growth and inadaptability of the human body (including the effects of the immune system).
The current treatment for GBM includes radiotherapy and chemotherapy, surgical treatment, and immunotherapy. At present, immunotherapy is a promising treatment method which can effectively improve the prognosis of patients with GBM. The efficacy of immunotherapy largely depends on the expression of PD-1. The interaction of PD-1 and PD-L1 (especially in the T cell) can promote invasion of glioblastoma multiforme by creating an immunoregulatory axis.24 And the PD-1 pathway could regulate immunological homeostasis and influence the mechanism of autoimmunity protection. The PD-L1 expression of GBM can activate the PD-1 receptor, leading to the negative regulation of T cells, especially CD8+ T cells. A recent study showed that the PD-L1 expression of a tumor can be activated by activation of various receptors such as toll like receptor (TLR), epidermal growth factor receptor (EGFR), interferon alpha receptor (IFNAR), and interferon-gamma receptor (IFNGR). A recent study identified that the PD-L1 expression in T cells was correlated with WHO grading and could be identified as a tumor biomarker.
Notably, at the tumor site, there are several inhibitory signals which frequently lead to dysfunction of tumor-specific T cells. Selecting such signals via immune checkpoint inhibitors (ICI) may rejuvenate T cells and improve clinical efficacy. ICIs have been successfully applied in GBM and have attracted great interest in exploring immune factors for immunotherapy.25 Of these, CD8+ T cells serve as the main mediator for anticancer immunity in modulating their response, which has been the main focus of several cancer immunotherapy strategies. After recognition of specific antigen peptides presented via human leukocyte antigen (HLA, in humans) or major histocompatibility complex (MHC, in vertebrates), CD8+ T cells have been shown to be activated for killing cancer cells. Studies extensively report their important function in immunotherapy. Thus, for tumor patients, it is important to identify the prognostic factors and the target of immunotherapy to improve survival rate. Currently, single cell sequencing and analysis have been widely used in various cancer analyses. Especially in GBM, single cell analysis can be used to identify the key prognostic factors26,27 and understand the tumor microenvironment.28
In this study, we used the cibersort and WGCNA analysis to identify the related genes of CD8+ T cell infiltration, and green and red modules were marked as the positive and negative genes with CD8+ T cell infiltration. Our study showed that the green module genes were correlated with oxidative phosphorylation and ribosome, the red module genes were enriched with the TGF beta, ERBB, and MTOR pathways. With the two algorithms, we were able to accuratelyidentify the related genes of CD8+ T cell infiltration. In order to confirm the high/low CD8+ infiltration samples, we used the unsupervised clustering analysis to identify different subtypes of CD8+ T cell infiltration which actuated different prognosis. A total of four subtypes were identified, which showed significant differences in survival, indicating their potential to promote the progression of GBM. Based on that, we identified the green subtype was high CD8+ T cell infiltration and activated immune-related pathways and the red was marked as cold immune response. Then we used the GSVA analysis to understand the underlying biology function, and the result showed that the red cluster was significantly enriched with glycolysis and immune pathways such as the B-cell and T-cell receptor pathways and green plate showed the enrichment pathways related to complete immune activation, including the TGF beta, MAPK, and MTOR pathways, which is consistent with our classification. To obtain the key genes, we used the limma packages to confirm 535 differential genes between red and green groups, and 10 core genes (RPS5, RPS6, FAU, RPS19, RPS23, RPS15A, RPS29, RPS14, RPS16, RPS27) were obtained by using a protein interaction network. The expressions of RPS5, RPS6, and RPS16 showed visible differences in survival, and also, the COX analysis of these genes showed that these genes are independent prognostic factors. The deregulation of RPS5 gene expression (constitutive expression) affects RPS5 protein level and delays both the onset of initiation of erythroid maturation and entrance in cell cycle arrest in inducer-treated MEL cells.29 Ribosomal protein S6 (rpS6), a component of the 40S ribosomal subunit, has been reported to be associated with various physiological and pathophysiological functions. A recent study showed that phosphorylation of rpS6 attenuates KRAS-induced DNA damage and p53-mediated tumor suppression.30 The transfection-enforced re-expression of RPS16 restores oncogenic-like activity in USP1-deficient HCC cells. Importantly, the high expression of USP1 and RPS16 in liver tissue is a prognostic factor for poor survival of HCC patients.31
Our research showed that the green subtypes had high immune cell infiltration and were enriched with oxidative phosphorylation and ribosome. Between the green subtype and red subtype, we found that RPS5, RPS6, and RPS16 had significant expression in the green subtype and could be prognostic factors of GBM. As the core genes of green subtypes, RPS5, RPS6, and RPS16 are involved in CD8+ T cell infiltration regulation and the activation of oxidative phosphorylation and ribosome pathways. Altogether, the three associated genes RPS5, RPS6, and RPS16 were markedly related to degree of T cell infiltration and immune-related activity. Our study has one limitation. In our study, we investigated these genes which may be potential biomarkers and targets for GBM immunotherapy, with certain notable limitations in the study. The mechanism and validation of these genes still need to be further researched in clinical and molecular biology experiments.
Abbreviations
GBM, glioblastoma multiforme, glioblastoma; CGGA, Chinese Glioma Genome Atlas; TCGA-GBM, The Cancer Genome Atlas Glioblastoma Multiforme; GEO, Gene Expression Omnibus; WGCNA, weighted gene co-expression network analysis; K-M, Kaplan–Meier; ECM, extracellular matrix; CMV, cytomegalovirus; CNS, central nervous system; ICIs, immune checkpoint inhibitors; TME, tumor microenvironment.
Data Sharing Statement
Data supporting our findings are already included in the manuscript.
Ethics Approval and Consent to Participate
All methods of this study were carried out in accordance with relevant guidelines and regulations. The data of this study are from TCGA, CGGA and GEO public databases, and did not involve animal experiments or human specimens, no ethics‐related issues. Ethical approval had been obtained for the patient data in the databases. Users can download relevant data for free for research and publish relevant articles. Our study was based on open source data, so there are no ethical issues.
Consent for Publication
Every author involved with the manuscript agreed to the publication of the manuscript.
Acknowledgments
We acknowledge TCGA, CGGA and GEO databases for providing their platforms and contributors for uploading their meaningful datasets.
Author Contributions
All authors made a significant contribution to the work reported, whether that is in the conception, study design, execution, acquisition of data, analysis and interpretation, or in all these areas; took part in drafting, revising or critically reviewing the article; gave final approval of the version to be published; have agreed on the journal to which the article has been submitted; and agree to be accountable for all aspects of the work.
Funding
This study was supported by a grant (No. 2021SF-355) from the Shaanxi Province Key R&D Program.
Disclosure
The authors declare that the research was conducted in the absence of any commercial or financial relationships that could be construed as a potential conflict of interest.
References
1. Weller M, Wick W, Aldape K, et al. Glioma. Nat Rev Dis Primers. 2015;1:15017. doi:10.1038/nrdp.2015.17
2. Wen PY, Reardon DA. Neuro-oncology in 2015: progress in glioma diagnosis, classification and treatment. Nat Rev Neurol. 2016;12(2):69–70. doi:10.1038/nrneurol.2015.242
3. Porter KR, McCarthy BJ, Freels S, Kim Y, Davis FG. Prevalence estimates for primary brain tumors in the United States by age, gender, behavior, and histology. Neuro Oncol. 2010;12(6):520–527. doi:10.1093/neuonc/nop066
4. Krenzlin H, Behera P, Lorenz V, et al. Cytomegalovirus promotes murine glioblastoma growth via pericyte recruitment and angiogenesis. J Clin Invest. 2019;129(4):1671–1683. doi:10.1172/JCI123375
5. Omuro A, DeAngelis LM. Glioblastoma and other malignant gliomas: a clinical review. JAMA. 2013;310(17):1842–1850. doi:10.1001/jama.2013.280319
6. Ansell SM, Lesokhin AM, Borrello I, et al. PD-1 blockade with nivolumab in relapsed or refractory Hodgkin’s lymphoma. N Engl J Med. 2015;372(4):311–319. doi:10.1056/NEJMoa1411087
7. Garon EB, Rizvi NA, Hui R, et al. Pembrolizumab for the treatment of non-small-cell lung cancer. N Engl J Med. 2015;372(21):2018–2028. doi:10.1056/NEJMoa1501824
8. Filley AC, Henriquez M, Dey M. Recurrent glioma clinical trial, CheckMate-143: the game is not over yet. Oncotarget. 2017;8(53):91779–91794. doi:10.18632/oncotarget.21586
9. Quail DF, Joyce JA. Microenvironmental regulation of tumor progression and metastasis. Nat Med. 2013;19(11):1423–1437. doi:10.1038/nm.3394
10. de Henau O, Rausch M, Winkler D, et al. Overcoming resistance to checkpoint blockade therapy by targeting PI3Kγ in myeloid cells. Nature. 2016;539(7629):443–447. doi:10.1038/nature20554
11. Quail DF, Bowman RL, Akkari L, et al. The tumor microenvironment underlies acquired resistance to CSF-1R inhibition in gliomas. Science. 2016;352(6288):aad3018. doi:10.1126/science.aad3018
12. Kaneda MM, Messer KS, Ralainirina N, et al. PI3Kγ is a molecular switch that controls immune suppression. Nature. 2016;539(7629):437–442. doi:10.1038/nature19834
13. Galon J, Costes A, Sanchez-Cabo F, et al. Type, density, and location of immune cells within human colorectal tumors predict clinical outcome. Science. 2006;313(5795):1960–1964. doi:10.1126/science.1129139
14. Sharma P, Shen Y, Wen S, et al. CD8 tumor-infiltrating lymphocytes are predictive of survival in muscle-invasive urothelial carcinoma. Proc Natl Acad Sci U S A. 2007;104(10):3967–3972. doi:10.1073/pnas.0611618104
15. Mahmoud SMA, Paish EC, Powe DG, et al. Tumor-infiltrating CD8+ lymphocytes predict clinical outcome in breast cancer. J Clin Oncol. 2011;29(15):1949–1955. doi:10.1200/JCO.2010.30.5037
16. Mauldin IS, Jo J, Wages NA, et al. Proliferating CD8+ T cell infiltrates are associated with improved survival in glioblastoma. Cells. 2021;10:12. doi:10.3390/cells10123378
17. Lin T, Gu J, Qu K, et al. A new risk score based on twelve hepatocellular carcinoma-specific gene expression can predict the patients’ prognosis. Aging. 2018;10(9):2480–2497. doi:10.18632/aging.101563
18. Liu H, Sun Y, Tian H, et al. Characterization of long non-coding RNA and messenger RNA profiles in laryngeal cancer by weighted gene co-expression network analysis. Aging. 2019;11(22):10074–10099. doi:10.18632/aging.102419
19. Niemira M, Collin F, Szalkowska A, et al. Molecular signature of subtypes of non-small-cell lung cancer by large-scale transcriptional profiling: identification of key modules and genes by weighted gene co-expression network analysis (WGCNA). Cancers. 2019;12(1):37. doi:10.3390/cancers12010037
20. Langfelder P, Horvath S. WGCNA: an R package for weighted correlation network analysis. BMC Bioinform. 2008;9:559. doi:10.1186/1471-2105-9-559
21. Newman AM, Liu CL, Green MR, et al. Robust enumeration of cell subsets from tissue expression profiles. Nat Methods. 2015;12(5):453–457. doi:10.1038/nmeth.3337
22. Zhao SG, Lehrer J, Chang SL, et al. The immune landscape of prostate cancer and nomination of PD-L2 as a potential therapeutic target. J Natl Cancer Inst. 2019;111(3):301–310. doi:10.1093/jnci/djy141
23. Zhang S, Zhang E, Long J, et al. Immune infiltration in renal cell carcinoma. Cancer Sci. 2019;110(5):1564–1572. doi:10.1111/cas.13996
24. Zeng J, See AP, Phallen J, et al. Anti-PD-1 blockade and stereotactic radiation produce long-term survival in mice with intracranial gliomas. Int J Radiat Oncol Biol Phys. 2013;86(2):343–349. doi:10.1016/j.ijrobp.2012.12.025
25. Zhao J, Chen AX, Gartrell RD, et al. Immune and genomic correlates of response to anti-PD-1 immunotherapy in glioblastoma. Nat Med. 2019;25(3):462–469. doi:10.1038/s41591-019-0349-y
26. Sun X, Liu X, Xia M, Shao Y, Zhang XD. Multicellular gene network analysis identifies a macrophage-related gene signature predictive of therapeutic response and prognosis of gliomas. J Transl Med. 2019;17(1):159. doi:10.1186/s12967-019-1908-1
27. Zhang J, Guan M, Wang Q, Zhang J, Zhou T, Sun X. Single-cell transcriptome-based multilayer network biomarker for predicting prognosis and therapeutic response of gliomas. Brief Bioinform. 2020;21(3):1080–1097. doi:10.1093/bib/bbz040
28. Cheng J, Zhang J, Wu Z, Sun X. Inferring microenvironmental regulation of gene expression from single-cell RNA sequencing data using scMLnet with an application to COVID-19. Brief Bioinform. 2021;22(2):988–1005. doi:10.1093/bib/bbaa327
29. Matragkou CN, Papachristou ET, Tezias SS, Tsiftsoglou AS, Choli-Papadopoulou T, Vizirianakis IS. The potential role of ribosomal protein S5 on cell cycle arrest and initiation of murine erythroleukemia cell differentiation. J Cell Biochem. 2008;104(4):1477–1490. doi:10.1002/jcb.21722
30. Khalaileh A, Dreazen A, Khatib A, et al. Phosphorylation of ribosomal protein S6 attenuates DNA damage and tumor suppression during development of pancreatic cancer. Cancer Res. 2013;73(6):1811–1820. doi:10.1158/0008-5472.CAN-12-2014
31. Liao Y, Shao Z, Liu Y, et al. USP1-dependent RPS16 protein stability drives growth and metastasis of human hepatocellular carcinoma cells. J Exp Clin Cancer Res. 2021;40(1):201. doi:10.1186/s13046-021-02008-3
 © 2022 The Author(s). This work is published and licensed by Dove Medical Press Limited. The full terms of this license are available at https://www.dovepress.com/terms.php and incorporate the Creative Commons Attribution - Non Commercial (unported, v3.0) License.
By accessing the work you hereby accept the Terms. Non-commercial uses of the work are permitted without any further permission from Dove Medical Press Limited, provided the work is properly attributed. For permission for commercial use of this work, please see paragraphs 4.2 and 5 of our Terms.
© 2022 The Author(s). This work is published and licensed by Dove Medical Press Limited. The full terms of this license are available at https://www.dovepress.com/terms.php and incorporate the Creative Commons Attribution - Non Commercial (unported, v3.0) License.
By accessing the work you hereby accept the Terms. Non-commercial uses of the work are permitted without any further permission from Dove Medical Press Limited, provided the work is properly attributed. For permission for commercial use of this work, please see paragraphs 4.2 and 5 of our Terms.