")
Back to Journals » International Journal of General Medicine » Volume 15
Analysis of Ferroptosis-Related LncRNAs Signatures Associated with Tumor Immune Infiltration and Experimental Validation in Clear Cell Renal Cell Carcinoma
Authors Chen X , Tu J, Ma L, Huang Y, Yang C, Yuan X
Received 18 December 2021
Accepted for publication 10 March 2022
Published 19 March 2022 Volume 2022:15 Pages 3215—3235
DOI https://doi.org/10.2147/IJGM.S354682
Checked for plagiarism Yes
Review by Single anonymous peer review
Peer reviewer comments 2
Editor who approved publication: Dr Scott Fraser
Xinyi Chen,1 Jingyao Tu,1 Li Ma,1 Yongbiao Huang,1 Chunguang Yang,2 Xianglin Yuan1
1Department of Oncology, Tongji Hospital, Tongji Medical College, Huazhong University of Science and Technology, Wuhan, Hubei, People’s Republic of China; 2Department of Urology, Tongji Hospital, Tongji Medical College, Huazhong University of Science and Technology, Wuhan, People’s Republic of China
Correspondence: Xianglin Yuan, Department of Oncology, Tongji Hospital, Tongji Medical College, Huazhong University of Science and Technology, Jie Fang Road 1095, Wuhan, Hubei Province, People’s Republic of China, Tel/Fax +8602783662683, Email [email protected]
Background: Clear cell renal cell carcinoma (ccRCC) is the most aggressive subtype of renal cell carcinoma. Ferroptosis is an iron-dependent programmed cell death. Long non-coding RNAs (lncRNAs) emerge as a critical role in regulating cancer progression.
Objective: This study aimed to identify molecular regulation of ferroptosis-related lncRNAs (FRLs) in ccRCC.
Methods: The prognostic value of FRLs was investigated in ccRCC samples downloaded from The Cancer Genome Atlas (TCGA) and Gene Expression Omnibus (GEO) dataset. The FRLs were screened out by Pearson correlation test. The 465 FRLs confirmed as potential prognostic factors through univariate Cox regression analysis were entered into Lasso and multivariate Cox regression to build a FRLs prognostic signature. A risk score based on the prognostic model divided ccRCC patients into low- and high-risk groups. A prognostic nomogram, derived from the prognostic signature and integrating clinical characteristics, was constructed. Gene set enrichment analysis (GSEA) revealed the immune- and tumor-associated pathways. Two distinct clusters were identified with different immune signatures through consensus clustering analysis. The prognostic value of some hub FRLs was externally validated via three GEO datasets (GSE46699, GSE53757 and GSE66272) and online databases. Finally, the three FRLs (LINC00460, LINC00941 and LINC02027) were verified through in vitro experiments.
Results: The FRLs prognostic signature, including 7 independent prognostic lncRNAs, exhibited good accuracy in predicting overall survival (OS) of ccRCC patients. This signature was correlated with immune infiltration and immune checkpoint blockade (ICB). We correlated two distinct clusters with immune infiltration signature of ccRCC. The worse prognosis of cluster 2 was probably mediated by immune evasion. We also found that the expression levels of LINC00460 and LINC00941 in ccRCC cell lines were higher than those in HK-2 cells, but LINC02027 showed the inverse trend.
Conclusion: Collectively, our study demonstrated a FRLs prognostic signature which had great clinical value in prognosis assessment.
Keywords: clear cell renal cell carcinoma, ferroptosis, long non-coding RNA, immune microenvironment, prognostic signature
Introduction
Clear cell renal cell carcinoma (ccRCC) is the most fatal cancer in genitourinary system and accounts for approximately 80% of renal cell carcinomas.1 Patients with ccRCC are generally characterized by a poor response to radiotherapy and chemotherapy.2 Despite immune checkpoint inhibitors (ICIs) having made a considerable breakthrough in ccRCC,3 their treatment efficacy varies significantly across individuals. To enhance clinical efficacy and alleviate symptoms of cases, it is urgent to elucidate the underlying molecular mechanisms and facilitate prediction of ccRCC prognosis.
The research of tumor ferroptosis has seen a rapid increase during the past decades. Ferroptosis is a form of cell death with a reliance on ferrous iron and featured by intracellular aggregation of reactive oxygen species (ROS),4 which is distinguished from apoptosis and autophagy.5 Dysregulated iron metabolism is a hazard factor for tumors and as well facilitates tumor progression.6 As tumor cells typically have greater iron needs to sustain abnormal metabolism and aberrant proliferation, tumor tissues are over-reliance on iron for proliferation.7,8 Recent studies indicate that induction of ferroptosis has appeared to be a promising therapeutic strategy, in particular, applicable for malignant tumors with the development of resistance in conventional treatments.9 More importantly, there has been a great deal of work that devoted to exploring the role of ferroptosis in ccRCC.10,11 In fact, regulation of ferroptosis pathways may overcome or prevent drug resistance to the existing chemotherapeutic agents, opening a novel insight for cancer treatment. On the other hand, long non-coding RNAs (lncRNAs) are a class of functional RNA and >200 nucleotides in length which can regulate gene expression at both the transcriptional and post-transcriptional levels even if they do not have protein-coding function.12 As is well known, dysregulated expression of lncRNA has been implicated in solid tumor progression, metastasis, and poor clinical outcomes.13 Moreover, dysregulated lncRNAs have been recognized to serve a critical role in the pathogenicity of urinary system tumors.14 Furthermore, there has been a few bioinformatic research indicating that dysregulation of ferroptosis on lncRNAs facilitates the progression of multiple cancers, such as hepatocellular carcinoma,15 colon cancer16 and head and neck squamous cell carcinoma.17 However, the effect of ferroptosis on the dysregulation of lncRNAs in human cancers is still poorly characterized. In particular, the impact of ferroptosis on lncRNA-dependent ccRCC progression has also been scarcely studied. Hence, a detailed understanding of ferroptosis-related lncRNAs (FRLs) involved in ccRCC might be beneficial to identify novel diagnostic and prognostic biomarkers.
In addition to the insufficient understanding of FRLs, the potential role of ferroptosis in tumor immune signatures also remained less studied. Currently, ferroptosis has been demonstrated to serve an essential role in regulating immune responses, exerting anti-cancer effects.18 Just recently, Yang et al elucidated that a regulation based on ROS-ferroptosis-glycolysis could enhance tumor chemo-immunotherapy by inducing immunogenic cell death (ICD) and releasing tumor antigens to trigger antitumor immunity.19 Meanwhile, lncRNAs have been verified to exert regulatory functions in tumor immune microenvironment, including but not restricted to immune cell activation and infiltration.20 Therefore, a comprehensive analysis of immune signature associated with FRLs might be useful in guiding immunotherapy decision-making.
In this study, using a bioinformatics approach, we determined the prognostic significance of FRLs and investigated their associations with immune signatures in ccRCC patients based on The Cancer Genome Atlas (TCGA) database. Our results suggested that 7 FRLs were screened out as independent prognostic factors. Furthermore, we established a FRLs prognostic signature including 7 lncRNAs, as noted above, and it could effectively predict the overall survival (OS) of ccRCC patients. In addition, the risk score was calculated for each patient incorporating all the FRLs in the prognostic model, and ccRCC patients were classified into low‐ and high‐risk groups according to the selected cut-off value: median risk scores. We then figured out that there was substantial variation between low‐ and high‐risk groups in prognostic and clinical characteristics. Furthermore, an accurate nomogram was generated to visually predict the 1-, 3, and 5-year OS in patients with ccRCC. Finally, we correlated FRLs prognostic signature with the immune phenotype, which could be regarded as potential clinical prognostic indicators and exploitable as immune therapeutic targets for ccRCC patients.
Materials and Methods
Datasets and Ferroptosis-Related Genes
Expression profiles of the ccRCC were obtained from TCGA-GDC (https://portal.gdc.cancer.gov/) database. We selected HTseq-FPKM files of 611 samples, including 539 tumor samples and 72 normal samples. We also retrieved data of corresponding 537 ccRCC patients from TCGA cohort (henceforth referred to as TCGA-KIRC) with clinicopathological information and survival in an analogous manner. From the Gene Expression Omnibus (GEO) database (http://www.ncbi.nlm.nih.gov/geo/), three ccRCC datasets GSE46699,21 GSE5375722 and GSE6627223) were selected for bioinformatics analysis. Additionally, the ferroptosis-related genes (FRGs) were collected from FerrDb (http://www.zhounan.org/ferrdb),24 a web-based platform that provided a comprehensive and most up-to-date database about ferroptosis markers, regulators and associated diseases. Ultimately, we identified 382 (driver: 150; suppressor: 109; marker: 123) FRGs.
Annotation of lncRNAs and Identification of Ferroptosis-Related lncRNAs
The data annotation of human lncRNAs was retrieved from the GENCODE.25 For further analysis, annotation of the lncRNAs was conducted. As a result, 14,056 lncRNAs were identified in TCGA-KIRC. We performed the “limma” package to calculate the correlation between the expression of FRGs and lncRNAs. The threshold was set as the correlation coefficient > 0.5 and P-value < 0.001. Then we identified 2179 FRLs based screening methods as described above. The “limma” package was also used to evaluate differentially expressed lncRNAs (DELs) between normal and tumor groups,26 with a false discovery rate (FDR) <0.05.
Molecular Mechanism and Immune Infiltrate Analysis
Functional enrichment analysis was performed with GO and KEGG to explore the main biological attributes. We analyzed the functions of ferroptosis-related DELs by GO and KEGG with “clusterProfiler” package (FDR < 0.05). In order to calculate the relative proportions of tumor-infiltrating immune cells between the two clusters in 530 TCGA-KIRC patients, the CIBERSORT algorithm was adopted through the R software package “CIBERSORT”,27 with the LM22 signature matrix containing 22 immune cell subtypes. Meanwhile, p < 0.05 was taken as cut-off value for significance which was eligible for further analysis and validation. The Wilcoxon rank-sum test was conducted to determine the significant difference in distributions of immune cells infiltration among the two clusters. Violin plots were also created with the R software package “vioplot” to visualize the different relative abundance of tumor-infiltrating immune cells. The estimated score, immune score, and stromal score of all the patients were subsequently calculated through ESTIMATE algorithm.28 In the meantime, the TIMER,29 CIBERSORT,27 QuanTIseq,30 MCPcounter,31 xCell32 and Epic algorithms were conducted to estimate cellular components or immune responses between high- and low-risk groups based on FRLs prognostic signature. The differences in immune response through different algorithms were visualized using a heatmap. Additionally, single-sample gene set enrichment analysis (ssGSEA) was used to quantify the tumor-infiltrating immune cell subgroups between the two groups as well as assess their immune function. Potential immune checkpoints were also derived from previous literature.
Ferroptosis-Related lncRNAs Prognostic Significance Construction
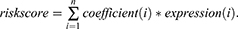
The clinicopathological data, including gender, age, TNM classification, Grade, Stage, survival time and survival status were also collected from TCGA. Firstly, univariate Cox regression analysis was performed to filtrate the FRLs, which were prognosis-related in ccRCC (p < 0.01). Then, multivariable Cox regression analysis was executed to establish a prognostic model by incorporating all the independent predictors identified through the Lasso regression model (p < 0.05), The risk coefficient of each gene was also calculated with “glmnet” package in R after eliminating the genes bearing the risk of overfitting, according to the following formula:
In addition, with the median risk score serving as a cut-off point, the ccRCC patients were assigned as having the higher risk value (≥50%) or the lower risk value (<50%) into low- and high-risk groups. The receiver operating characteristic (ROC) curve was established to evaluate the predictive value of the constructed prognostic model through the “survival ROC” R package. Prognostic analysis was performed through the R package “survival”; meantime, “survplot” R package was utilized to generate Kaplan-Meier plots with the Log rank test. In order to prove that the FRLs prognostic model was independent of other clinicopathological factors, univariate Cox regression, Lasso regression and multivariate Cox regression analysis were executed successively again and subsequently constructed the nomogram based on them. The nomogram-predicted probabilities against the actual observed outcome were further assessed by generating the calibration curve. For a more intuitive visualization of the difference in FRLs expression levels between high- and low-risk groups as well as the clinicopathological indexes, the heatmap was generated utilizing the R package “pheatmap”.
Consensus Clustering of Ferroptosis-Related lncRNAs
Consensus clustering, a resampling-based methodology, is universally applied for clustering the gene expression profile and evaluating the stability of the identified clusters. Based on the expression consensus of 7 FRLs recognized ahead, the ccRCC patients were subdivided into two subgroups by adopting the optimal k-means clustering. Cluster analysis was carried out utilizing the R package ‘ ConsensusClusterPlus’ with repeated computation 1000 times, by which stability and reliability of outcome could be ensured.33
Cell Culture and Treatment
Renal clear cell carcinoma cell lines (786-O, Caki-1, ACHN and OS-RC-2) as well as human renal proximal tubule epithelial cells (HK-2 cells) were acquired from the American Type Culture Collection (ATCC, Manassas, VA, United States). Cell incubation was done at 37°C in a humid 5% CO2 environment and was routinely cultured in RPMI 1640 or DMEM supplemented with 10% fetal bovine serum (Invitrogen, Carlsbad, CA, United States), except for Caki-1 cells, which were maintained in McCoy’s 5A (modified) medium (Gibco, USA).
Total RNA Extraction, Reverse Transcription and qRT-PCR Analysis
Total RNA of each cell line for RT-PCR analysis was collected in TRIzol (Takara, Japan). The RNA concentration was measured by NanoDrop 2000 (ThermoFisher Scientific). Then, 10 μg of total mRNA was used for cDNA synthesis using a Vazyme HiScript Q RT SuperMix for qPCR (Vazyme, Nanjing, China) through S1000 Thermal Cycler (Bio-Rad, USA), as instructed by the manufacturer. qPCR was done on a 7900HT Fast Real-Time PCR System (ThermoFisher Scientific) with 2× SYBR Green qPCR Master Mix (low ROX) kit (Bimake, China). All primers used for the qRT-PCR (LINC00460, LINC00941 and LINC02027) were synthesized by RiboBio (Guangzhou, China).
Statistical Analyses
The Wilcox rank-sum test function in R was applied to determine the FRLs exhibiting significantly different expression levels between the normal and the tumor group. Correlation analyses between FRGs and lncRNAs were conducted using cor.test() function in R (|Pearson R| > 0.5, p < 0.001). The Chi-square test was applied to compare the distribution of the following clinicopathological features: Grade (Grade 1-2 or Grade 3-4), Stage (Stage I–II or Stage III–IV), T-staging (T1-2 or T3-4), N-staging (N0 or N1-3), M-staging (M0 or M1), age (≤ 65 or > 65 years) and gender (male or female) between low- and high-risk groups in ccRCC. The Log rank test was used for the Kaplan–Meier curves, comparing the OS between different groups. The non-parametric Spearman rank test was applied for association analysis between risk score and the immune infiltration. Statistical significance was considered as p < 0.05. All analyses in this research were carried out using R studio software (version 4.0.2).
Results
Identification of Ferroptosis-Related lncRNAs in ccRCC Patients
First of all, applying the annotated reference downloaded from the “GENCODE” website,25 a total of 14,056 lncRNAs was identified in the TCGA cohort for subsequent analysis. As a next step, we obtained the expression profiles of the 382 corresponding FRGs from FerrDb24 (150 drivers, 109 suppressors and 123 markers). After performing Pearson correlation test, only the lncRNAs that revealed strong expression correlation with one or more of the 382 FRGs were defined as the ferroptosis-related lncRNAs (FRLs) (|Pearson R| > 0.5, P-value < 0.001). Finally, a total of 2179 lncRNAs that showed significant association with FRGs were screened out. After extracting the expression values of 2179 FRLs in ccRCC, 119 up-regulated lncRNAs and 67 down-regulated genes were identified (FDR < 0.05, log2FC >1; Table S1). The differentially expressed FRLs were visualized by volcano and heatmaps (Figures 1A and B). To evaluate the underlying molecular function and potential signaling pathways associated with the differentially expressed FRLs, we conducted GO and KEGG analyses. The GO enrichment revealed that these lncRNAs mainly participated in cellular response to chemical stress, response to hypoxia and response to decreased oxygen levels in BP. CC was mainly up-regulated in apical part of cell, apical plasma membrane and basal plasma membrane. MF mainly regulated iron ion binding, lyase activity and oxidoreductase activity (Figure 1C). The major KEGG pathways included HIF−1 signaling pathway, MicroRNAs in cancer and Arachidonic acid metabolism (Figure 1D; Table S2). To investigate the prognostic value of the FRLs, univariate Cox regression was then conducted to screen the potential lncRNA predictors from the 2179 FRLs (p < 0.01). As a result, it was identified that 465 FRLs exhibited a significant correlation with the prognosis of TCGA-KIRC patients, as listed in Table S3.
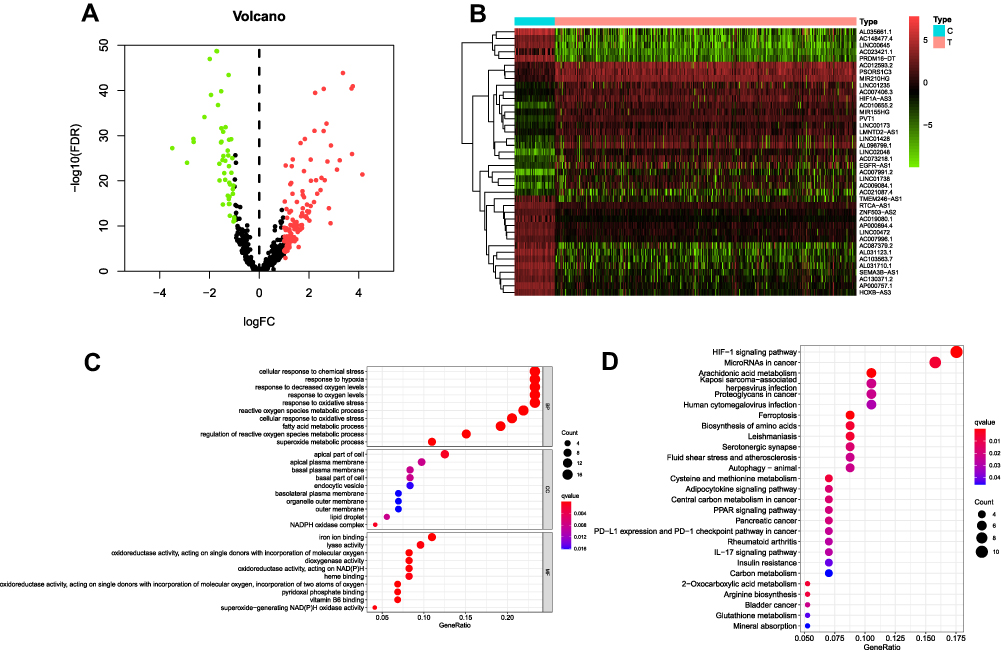 |
Figure 1 The differentially expressed FRLs. (A and B) The volcano plot and heatmap of the differentially expressed ferroptosis-related lncRNAs (FRLs). The red indicated up-regulated and green for down-regulated. (C and D) GO and KEGG pathway enrichment of the differentially expressed FRLs. |
Construction of Ferroptosis-Related lncRNAs Prognostic Signature
To build a FRLs prognostic signature for OS prediction in ccRCC patients, we integrated all 465 prognostic FRLs s as mentioned above into a multivariate Cox regression analysis. In order to prevent the model from overfitting, the Lasso regression was performed, and 13 genes were screened with the optimal adjustment parameter λ selected by 10-fold cross-validation (Figures 2A and B). Subsequently, as the outcome of multivariate Cox regression, 7 FRLs including LINC00460, LINC00941, LINC02027, AC027271.1, AC026401.3, AC124854.1 and AC020907.4 were incorporated into the FRLs prognostic signature, all of which were considered as key biomarkers and independent prognostic indicators (Table 1; Figure 2C). Each patient’s risk score was calculated based on the coefficient of 7 FRLs in prognostic signature using the above-mentioned formula in the “Materials and Methods”. Afterward, patients in ccRCC cohort were divided into low- (n=265) and high-risk (n=265) groups, with the median value of risk scores considered a cut-off. PCA revealed efficient discernment of patients with various risks into two subgroups (Figure 2D). Furthermore, the PCA result was validated by t-distributed stochastic neighbor embedding (tSNE) (Figure 2E). Kaplan–Meier survival curves demonstrated that high-risk patients had significantly worse OS probability compared with the patients in the low-risk group (p < 0.001) (Figure 2F). Conducting comparative analysis between the risk score and the corresponding survival status distributions, we figured out that patients in the high-risk group had a higher risk score and corresponding higher mortality rate compared to the low-risk group (Figure 2G). In addition, the ROC curves suggested that FRLs prognostic signature had satisfactory balanced sensitivity and specificity for predicting 1-, 3- and 5-year OS in ccRCC (AUC of 1-year = 0.763, 3-year = 0.735, 5-year = 0.766, respectively; Figure 2H). Considering the clinical utility of the risk model, we drew a decision curve analysis (DCA) curve (Figure 2I). Additionally, the connections between the prognosis-related lncRNAs (yellow square) and FRGs (gray circle) considered significant were visualized with Cytoscape (v.3.8.0) and presented in Figure 3A. A Sankey diagram of these prognosis-related lncRNAs and FRGs network was also shown in Figure 3B. Subsequently, Kaplan–Meier survival analysis was conducted and further confirmed that 7 lncRNAs, identified as the independent prognostic factors, indicated a significant association with OS in ccRCC patients (p < 0.01) (Figure 4). Collectively, all these results demonstrated that the risk score model incorporating these 7 independent prognostic indicators was able to potently predict the prognosis of ccRCC patients.
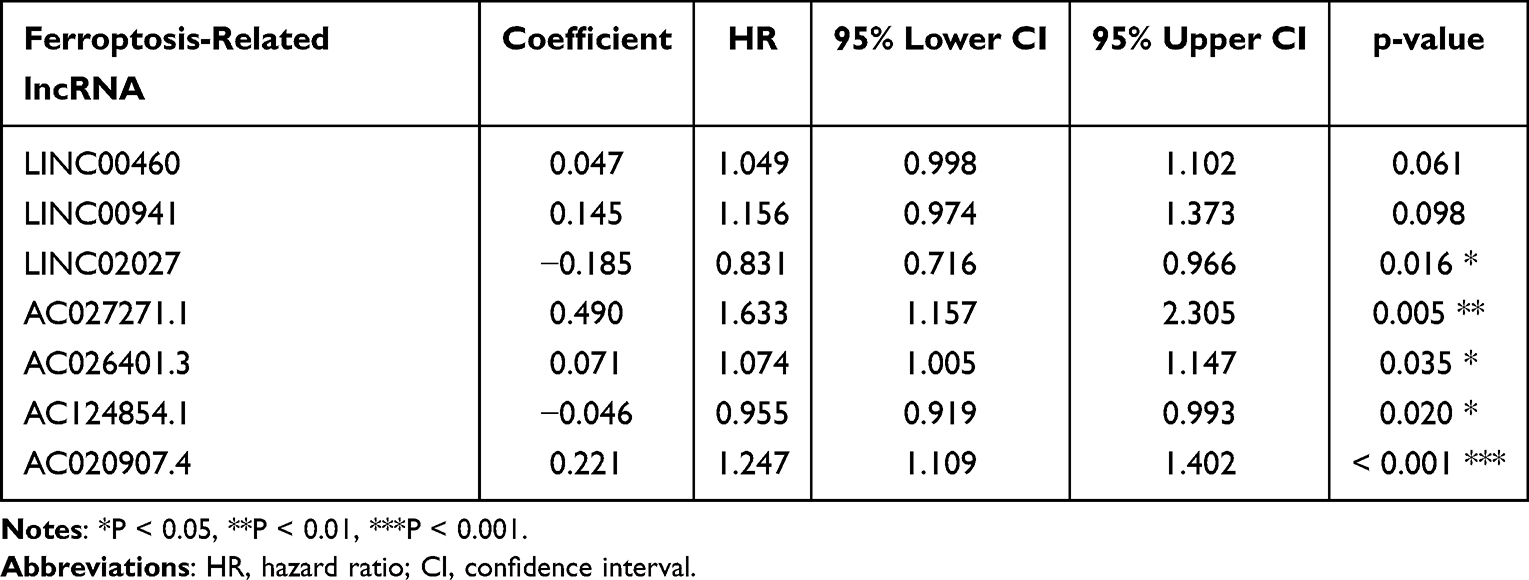 |
Table 1 Multivariate Cox Proportional Hazards Regression Model Including 7 Ferroptosis-Related lncRNAs as the Independent Prognostic Biomarkers for Overall Survival in Patients with KIRC |
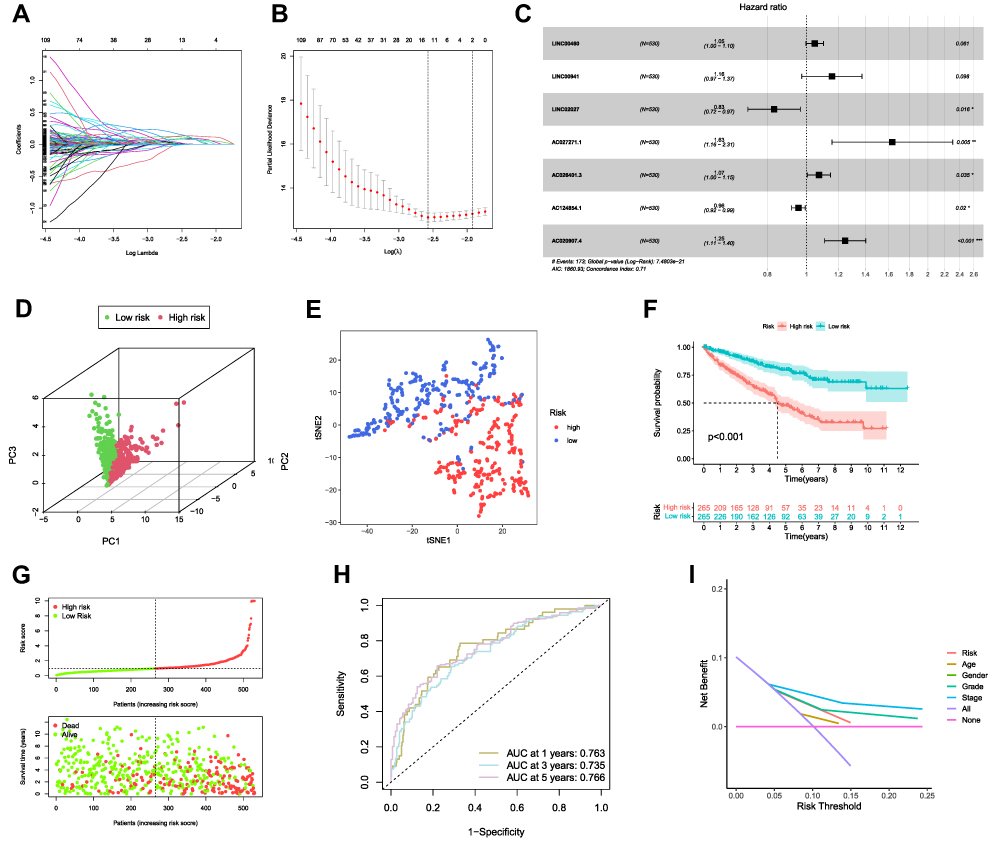 |
Figure 2 Construction of FRLs prognostic signature for ccRCC. (A and B) The Lasso regression analysis identified 13 lncRNAs in 465 prognostic FRLs. The optimal penalty parameter λ was obtained through ten-fold cross-validation. (C) Multivariate Cox proportional hazards regression model integrated 7 lncRNAs into the FRLs prognostic signature. (D and E) PCA and tSNE plot based on the risk score. (F) Kaplan–Meier survival curve of the OS in the high- and low-risk groups. (G) Predictor scores of ccRCC patients were sorted deriving from the prognostic model. The scatter plot of all patient’s survival states. (H) ROC curves for the predicting OS at 1, 3 and 5 years. (I) DCA of the risk variables. *p < 0.05, **p < 0.01, ***p < 0.001. Abbreviations: ROC, receiver operating characteristic curves; DCA, decision curve analysis. |
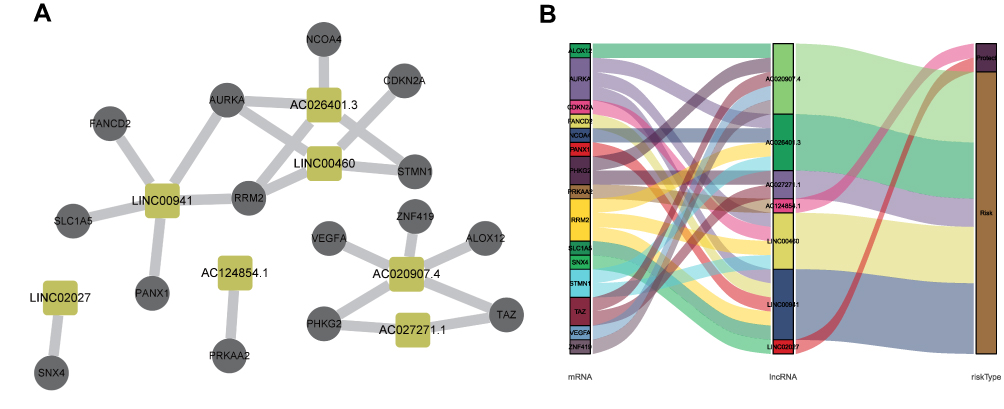 |
Figure 3 The constructed FRGs and FRLs networks. (A) Co-expression network consists of FRGs and the significantly related lncRNAs visualized by Cytoscape (version 3.8.0) (yellow square represents lncRNA, gray circle represents FRGs). (B) Sankey diagram for FRGs and FRLs network. |
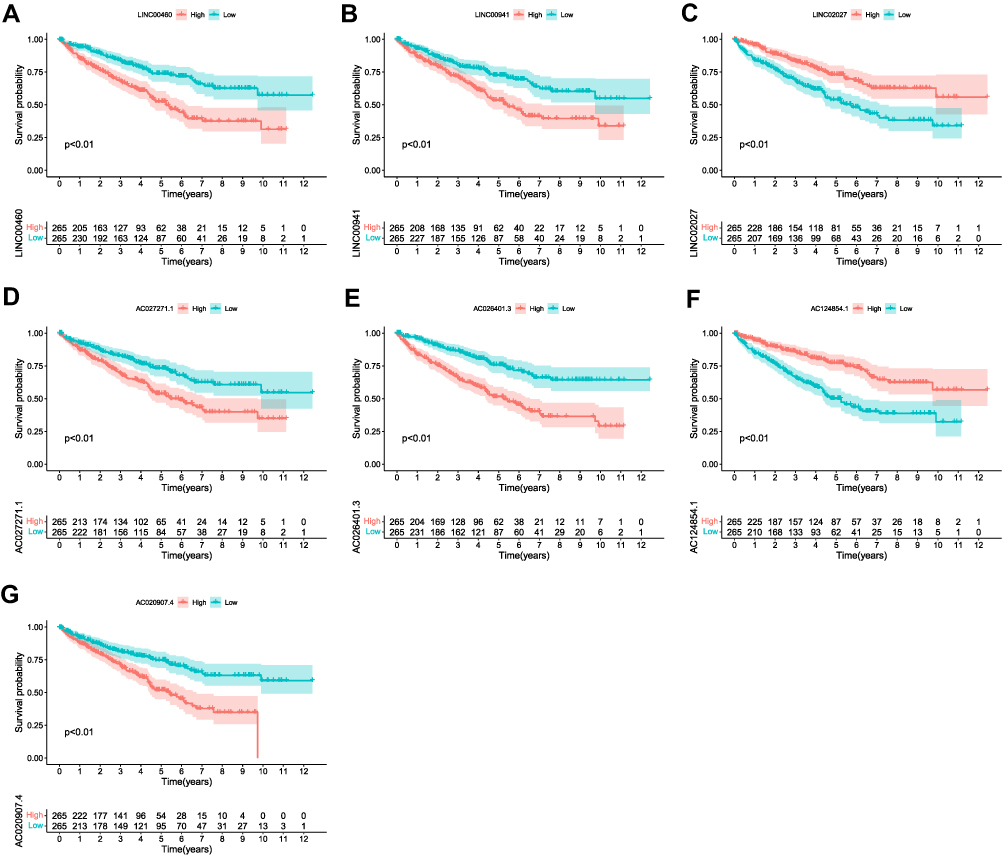 |
Figure 4 Kaplan–Meier survival curves of the 7 FRLs as independent prognostic factors significantly associated with OS in ccRCC patients. (A–G) Kaplan-Meier curves of LINC00460, LINC00941, LINC02027, AC027271.1, AC026401.3, AC124854.1 and AC020907.4 (p < 0.01). |
Stratification Analysis Associated with Clinicopathological Characteristics for the Ferroptosis-Related lncRNAs Prognostic Signature
As is well known, clinicopathological characteristics such as grade, stage, TNM-staging, age and gender were recognized as survival-associated factors. To comprehensively understand prognostic values of this prognostic model, we next sought to determine whether there was some degree of correlation between clinicopathological characteristics and the risk score model including 7 FRLs as noted above. Hence, Chi-Square test was carried out to determine whether the FRLs prognostic signature had sort of predictive effectiveness for predicting the clinicopathological features in ccRCC patients. Results from Chi-Square test were visualized using the heatmap (Figure 5A), which depicted that there were significant discrepancies in the distribution of Grade (p < 0.01), Stage (p < 0.001), M-staging (p < 0.001) and T-staging (p < 0.001) between high- and low-risk groups. Detailed results are presented in Table 2. The heatmap also indicated that the expression of LINC02027 and AC124854.1 had negative correlations with risk score and might act as the independent favorable prognostic factors, whereas the expression of the LINC00460, LINC00941, AC027271.1, AC026401.3 and AC020907.4 showed positive correlations and served as unfavorable prognostic factors (Figure 5A). We further conducted stratification analyses in order to evaluate whether the FRLs prognostic signature remained its predictive potency across diverse subgroups. The results revealed that there were indeed some distinct differences in risk scores across different subgroups in Grade, Stage, N-staging, M-staging and T-staging (p < 0.05), meanwhile, higher risk scores were related to the more advanced clinicopathological features (Figures 5B-F), but neither age nor gender was significantly associated with the risk scores (not shown in Figure 5). The Kaplan–Meier survival analysis demonstrated that only the patients with N1-3 resulted in no statistically significant difference (p > 0.05; probably because the number of patients was insufficient to make meaningful comparisons) (Figure 5L), apart from this subgroup, higher risk patients had worse OS in all of the Grade, Stage and T/N/M-staging subgroups (Figures 5G-K and 5M-P). In general, these results indicated that the FRLs prognostic signature could serve as a potential predictor for ccRCC patients.
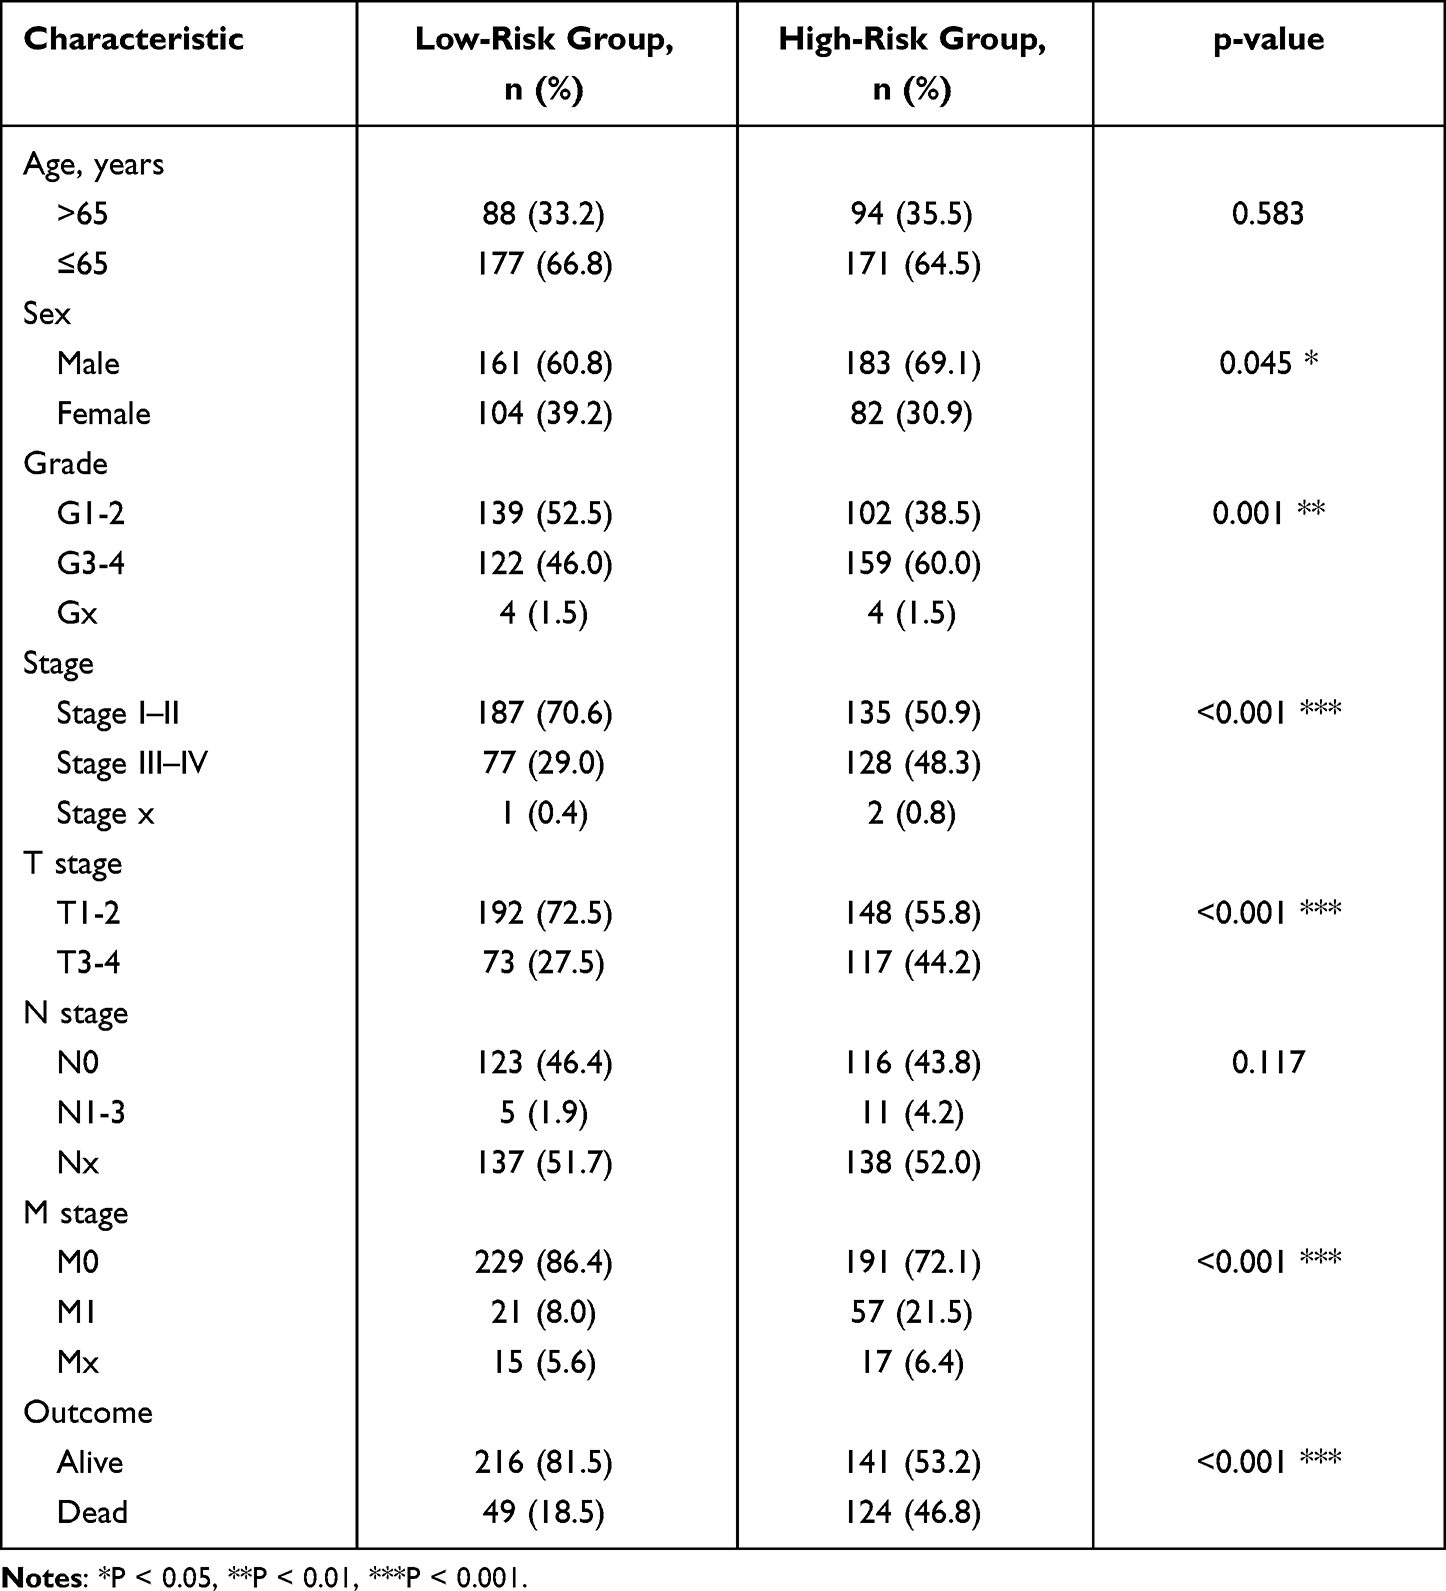 |
Table 2 Clinicopathological Characteristics in the Low- and High-Risk Groups in the TCGA-KIRC Patients |
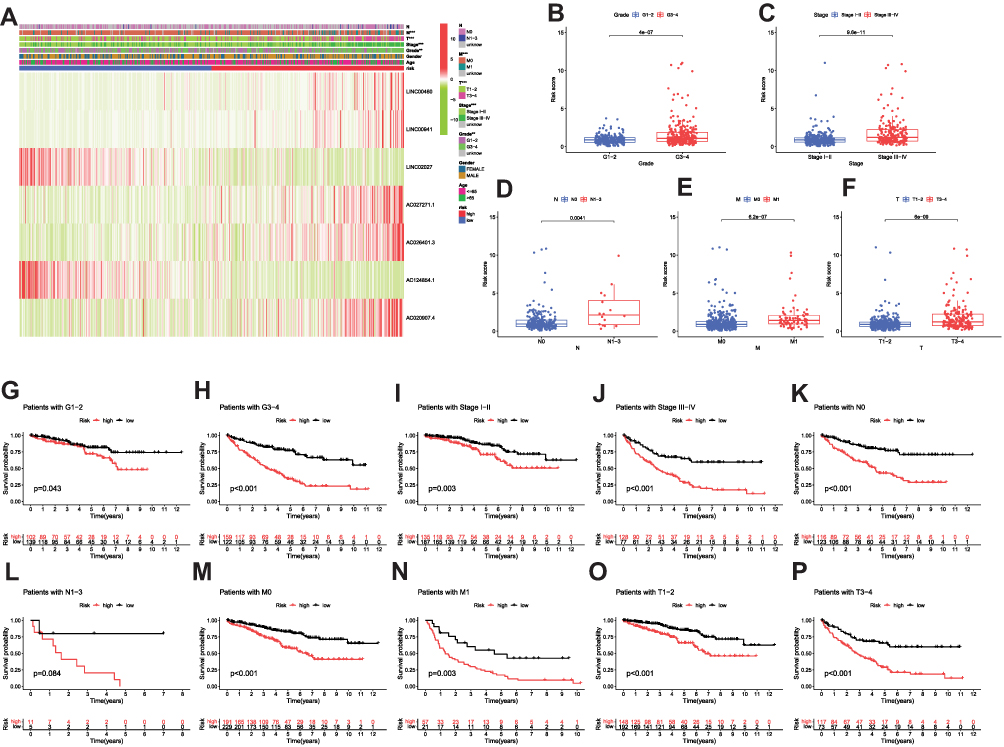 |
Figure 5 The associations between the risk score and different clinicopathological features. (A) Heatmap graphically illustrates the relationships between the expression levels of the 7 FRLs and clinicopathological features. (B–F) Clinicopathological characteristics (Grade, Stage, N-staging, M-staging and T-staging) of patients with different risk scores. Chi-square test was applied to determine whether the correlations between clinical features and risk score were statistical significance. (G–P) Kaplan-Meier curves of OS between every two groups stratified by Grade (Grade 1-2 or Grade 3-4), Stage (Stage I–II or Stage III–IV), N-staging (N0 or N1-3), M-staging (M0 or M1) and T-staging (T1-2 or T3-4). **p < 0.01, ***p < 0.001. |
Construction of Nomogram Derived from Ferroptosis-Related lncRNAs Prognostic Signature
To further substantiate the predictive potency of FRLs prognostic signature, univariate as well as multivariate Cox regression analyses were implemented next. As expected, univariate Cox analysis confirmed that FRLs prognostic signature served as an adverse prognostic indicator for OS (Hazard ratio: 1.059, 95% CI: 1.044–1.074, p < 0.001; Figure 6A). Then multivariate Cox analysis further corroborated this result by confirming the prognostic signature as an independent predictor for unfavorable prognosis (Hazard ratio: 1.042, 95% CI: 1.026–1.058, p < 0.001; Figure 6B). Therefore, from these results, we could make conclusions that our prognostic signature could be considered as an independent prognostic predictor and might have practical value for clinical prognosis assessment. To develop a clinically-relevant quantitative approach for predicting survival probability of ccRCC patients, we constructed a nomogram composed of the clinicopathological features such as Age, Gender, Grade, Stage and the newly generated risk score (Figure 6C). With the red line (the actual observation) suggesting a good fit of the grey line (the reference line), the calibration plots for predicting the survival probability at 1-, 3- and 5-year showed excellent consistency between the nomogram-predicted probabilities and actual observations (Figures 6D–F). The ROC curve also exhibited acceptable accuracy and discrimination of the FRLs prognostic signature regarding 1-, 3- and 5-year OS, respectively (AUC of 1-year = 0.753, 3-year = 0.722, 5-year = 0.756, respectively; Figures 6G–I).
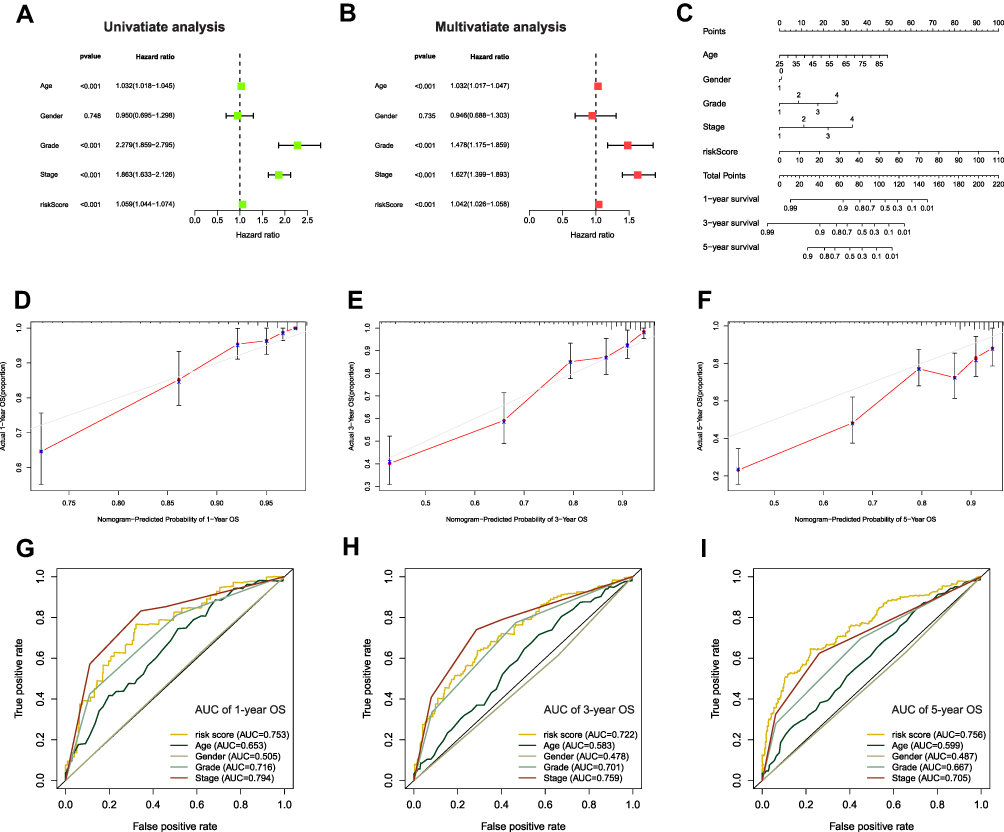 |
Figure 6 Evaluation of FRLs prognostic signature and nomogram construction in ccRCC. (A and B) Univariate and multivariate Cox regression analyses suggested that the risk score derived from the prognostic model was an independent prognostic predictor in ccRCC patients. (C) A nomogram integrated risk score derived from the FRLs prognostic signature and clinicopathological features (Grade, Stage, N-staging, M-staging and T-staging). (D–F) Calibration curve of the nomogram showed a good predictive ability for predicting 1-, 3-, and 5-years OS in ccRCC patients. (G–I) ROC curves for predicting 1-, 3-, and 5-years OS in ccRCC patients. |
Consensus Clustering of Prognostic Ferroptosis-Related lncRNAs Recognized Two Clusters of ccRCC Patients with Significantly Different Prognosis
In total, 530 ccRCC patients were clustered into two subgroups, named as cluster 1 (n = 145) and cluster 2 (n = 385) based on the expression patterns of 7 FRLs in the prognostic signature as mentioned above (Table 1). Ultimately, with the ConsensusClusterPlus R software package, k = 2 was certified as the least crossover by testing a range of k = 2 to 10 in TCGA-KIRC cohort (Figures 7A-C). As a result, we divided ccRCC patients into two clusters, named cluster 1 and cluster 2. We then investigated the clinicopathological features between these two subgroups, and Chi-square test results demonstrated that the two ccRCC clusters were significantly related to Stage (***p < 0.001), Grade (***p < 0.001), T-staging (***p < 0.001) as well as M-staging (**p < 0.01) (Figure 7D), which suggested that these clinical parameters had significant different ratio between the two ccRCC clusters. Furthermore, Kaplan-Meier analysis exhibited a significantly poorer prognosis in patients from cluster 2 rather than the patients from cluster 1 (p < 0.001) (Figure 7E), which strongly agreed with the results that cluster 2 had a higher level of FRLs prognostic signature-based risk score than cluster 1, as presented in Figure 7F (p < 0.001). These results provided further evidence to conclude that FRLs prognostic signature was strongly associated with the prognosis of ccRCC patients.
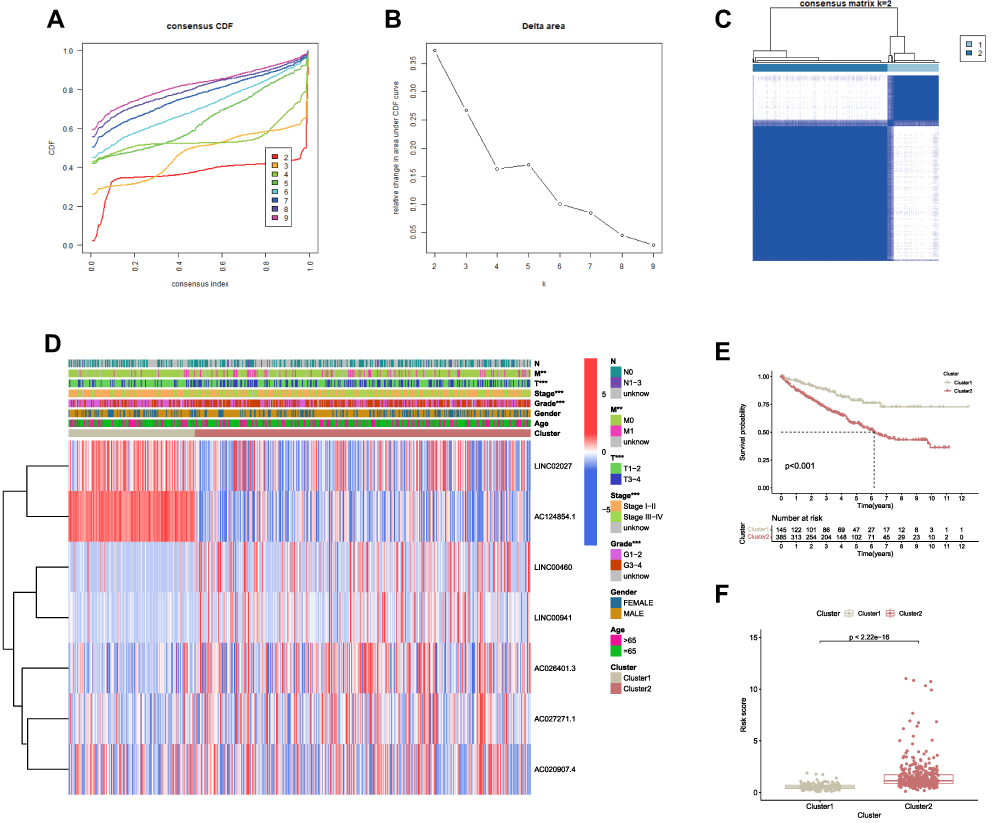 |
Figure 7 Differential clinicopathological features and survival of ccRCC in two clusters. (A) Consensus clustering cumulative distribution function (CDF) for k = 2–10. (B) Relative change in area under CDF curve for k = 2 to k = 10. (C) Consensus clustering matrix for k = 2. (D) Heatmap and clinicopathologic features of the two clusters (cluster 1 and cluster 2). (E) Kaplan-Meier curves of OS for patients with ccRCC in the two clusters. (F) Boxplot of risk score derived from the FRLs prognostic signature in the two clusters. **p < 0.01, ***p < 0.001. |
Exploring the Immune Characteristics of the Two ccRCC Clusters
It is also well-known about the existence of complicated interactive networks in tumor microenvironment that contain tumor‐infiltrating immune cells, and more significantly, profile of immune infiltration has profound effects on tumorigenesis and progression.34 Taking account of the vital biological functions, including the immune system regulated by ferroptosis during the tumorigenesis,35 ferroptosis might also have a close connection with immune infiltration signatures in tumors. Thus, we comprehensively investigated the discrepancy of immune profile between two ccRCC clusters. The CIBERSORT algorithm was applied to investigate the composition of tumor-infiltrating immune cells between two ccRCC clusters, and the violin plot was utilized to visualize the results (Figure 8A). The relatively higher infiltration levels of T cells follicular helper and T cells regulatory (denoted hereafter as Tregs), as well as the relatively lower proportion of Macrophages M1 and Macrophages M2 in cluster 2, were depicted in the boxplots (Figures 8B-E). Consistent with the outcomes of CIBERSORT algorithm, we also noticed that the expression of FOXP3 (Treg-specific marker) and LAG3 (deemed to be relevant to FOXP3+ Tregs36) were significantly upregulated in cluster 2 (*p < 0.05, ***p < 0.001) (Figures 8F and G). Meanwhile, the expression of Macrophage M2-marker CD163 was significantly downregulated in cluster 2 compared with cluster 1 (*p < 0.05) (Figure 8H).
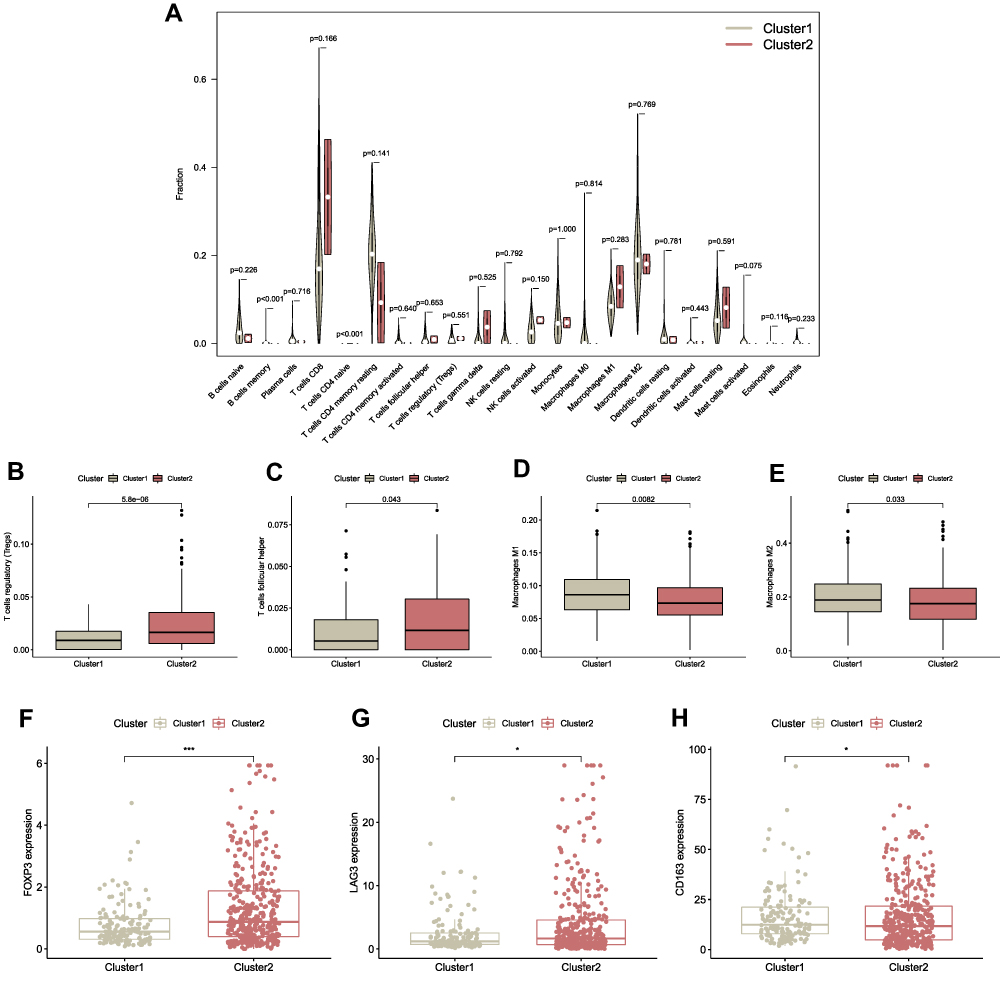 |
Figure 8 Comparison of immune signatures between the two ccRCC subgroups. (A) Comparison between two clusters of 22 immune cell proportions, visualized in the violin plots. (B–E) Comparison of several specific immune cells that had statistically significant differences of infiltration levels between the two clusters (Tregs, T cells follicular helper, Macrophages M1 and Macrophages M2). (F–H) The expression levels of marker gene of Tregs and Macrophages M2 (FOXP3 and LAG3: the marker of Tregs; CD163: the marker of Macrophages M2). *p < 0.05, ***p < 0.001. |
Notably, we observed that the OS of cluster 2 was the lower one, somewhat contradicting the results from the CIBERSORT algorithm which indicated the more significant decrease of immune-inhibitory signatures as Macrophages M2 in cluster 2. This inconformity led us to question whether cluster 2 had distinct tumor immune escape mechanisms. It is well-established that Tregs exert an essential function toward promoting tumor immune escape and significantly contribute to immunosuppressive tumor microenvironment.37 Our results showed that the abundance of Tregs infiltration abundance was significantly upregulated in cluster 2, which might contribute to tumor immune escape and eventually result in a poor prognosis. For further confirmation, we validated some classic and crucial inhibitor immune checkpoints such as PD-L1, CTLA-4 and TIGIT. The results demonstrated that all of them had statistically significant higher expression in cluster 2 (*p < 0.05, ***p < 0.001) (Figures S1A-C), which indicated an immunosuppressive status of cluster 2, in accordance with the previous assumption.
Gene Set Enrichment Analyses
Given the potential importance of ferroptosis during the tumorigenesis and the interesting results we found above, we decided to explore the role of FRLs prognostic signature in the pathogenesis of ccRCC. Gene set enrichment analyses (GSEA) was utilized to explore the potential biological mechanisms of the FRLs prognostic signature involved in ccRCC progression. The results indicated that glycerophospholipid metabolism, P53 signaling pathway, primary immunodeficiency, basal cell carcinoma and oxidative phosphorylation were activated by the high-risk group of the FRLs prognostic signature. While glycolysis gluconeogenesis, peroxisome, tryptophan metabolism, propanoate metabolism and valine leucine and isoleucine degradation were activated by the low-risk group (Figure 9). These results provided a hint of the underlying mechanism in the progression of pathogenesis of ccRCC.
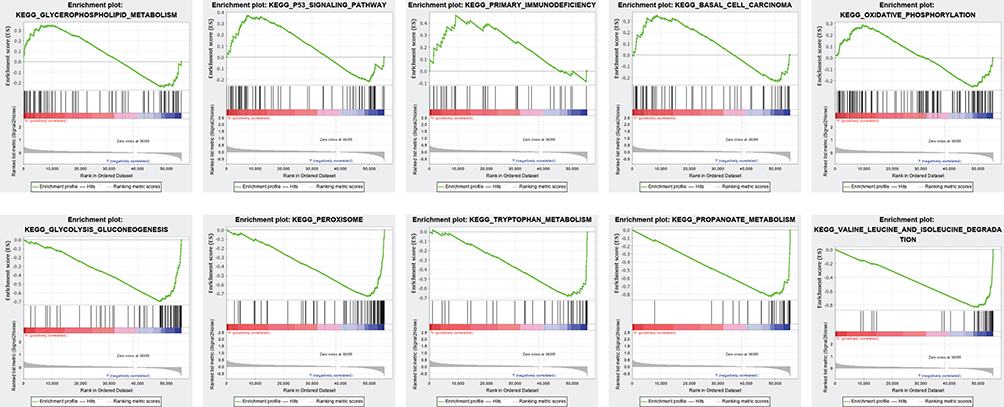 |
Figure 9 Gene set enrichment analysis. Significant level was p < 0.05 and FDR < 0.25. |
Immunity and Gene Expression
The heatmap of immune responses based upon TIMER, CIBERSORT, CIBERSORT−ABS, QuanTIseq, MCPcounter, xCell and EpiC is presented in Figure 10A. Analysis of the association between immune cell subsets and related functions derived from ssGSEA of TCGA-KIRC data suggested that MHC class I, T cell co-stimulation, Type I IFN Response and Type II IFN Response showed significant differences among the low- and high-risk groups (Figure 10B). Given the essentiality that immune checkpoint inhibitors attribute to immunotherapies, we further focused on the difference in the expression of immune checkpoints between the two groups. We identified a substantial difference in the expression of CD274 (PD-L1), PDCD1 (PD-1), CTLA4, LAG3, TIGIT among others, between the two groups of ccRCC (Figure 10C), being in line with our prior results. We then performed the ESTIMATE algorithm to accurately calculate the estimate score, immune score and stromal score. As indicated in Figures 10D-F, patients with a high-risk score presented a higher level of estimate score (p = 0.014) as well as immune score (p = 0.0031), but there was no statistical difference in stromal score (p > 0.05). Therefore, the risk score was significantly and positively correlated with the estimate score and immune score.
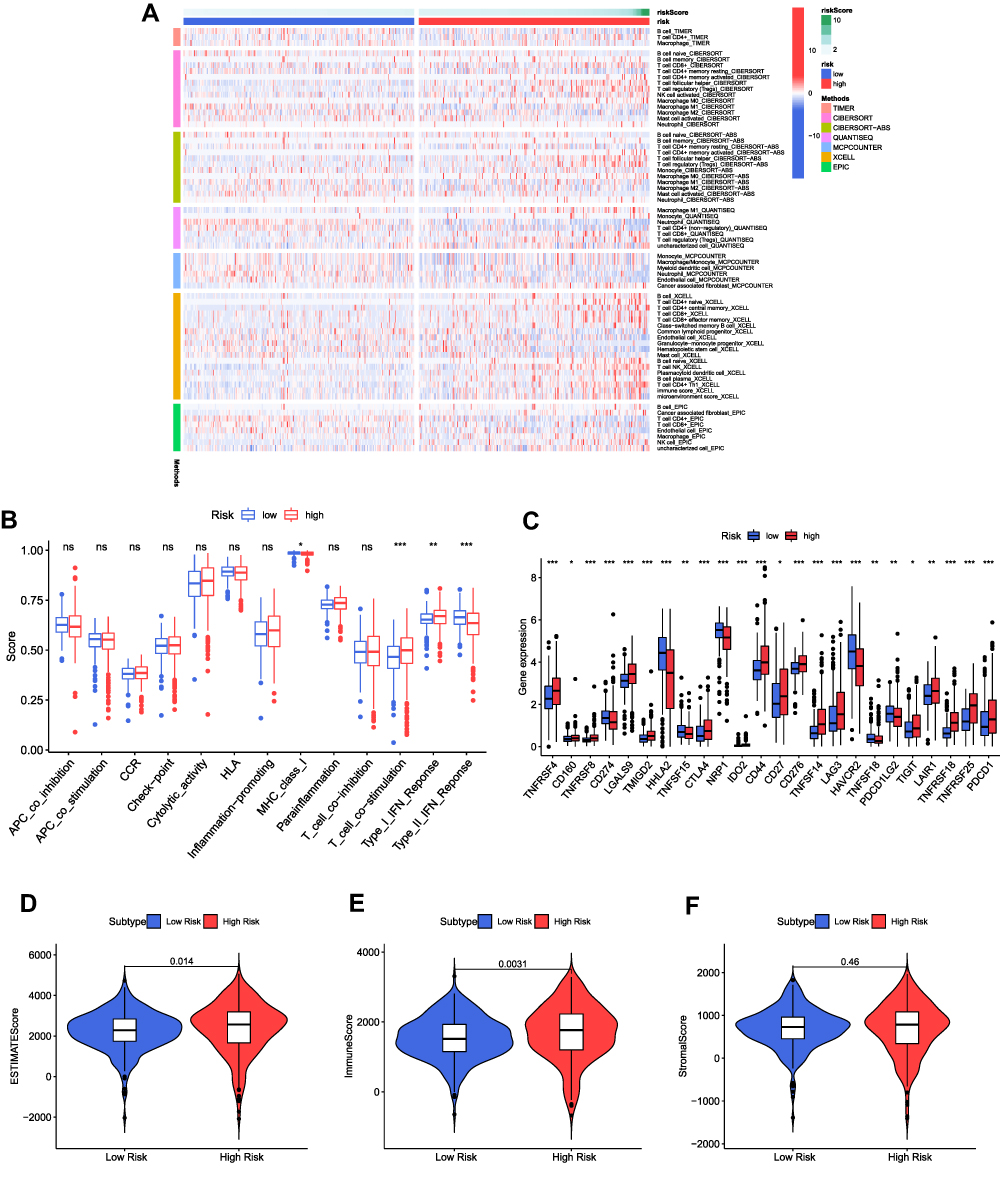 |
Figure 10 Immunity and gene expression. (A) Based on TIMER, CIBERSORT, CIBERSORT−ABS, QuanTIseq, MCPcounter, xCell and EpiC algorithms, heatmap of immune infiltration in the high- and low-risk groups. (B) ssGSEA for the association between immune cell subpopulations and related functions. (C) Expression of immune checkpoints among high- and low-risk groups. (D–F) ESTIMATE score, immune score and stromal score in the high- and low-risk groups. *p < 0.05, **p < 0.01, ***p < 0.001. |
To provide supporting evidence reinforcing the results ahead, we next correlated the expression of gene markers (FOXP3, LAG3 and CD163) of the corresponding immune cells (Tregs and Macrophages M2) with 7 FRLs, respectively. Consequently, we corroborated that the expression of Tregs markers (FOXP3 and LAG3; as immunosuppressive markers) were positively associated with the lncRNAs which served as unfavorable prognostic factors; meanwhile, they were negatively correlated with LINC02027 and AC124854.1 which were independent favorable prognostic factors (Figures 11A and B). In addition, Macrophages M2 marker (CD163) revealed a completely opposite trend (Figure 11C). These correlations were in line with previous outcomes about the poor prognosis and the immune characteristic in cluster 2, further suggesting that there were reasonable correlations between the risk score model and the immune phenotype.
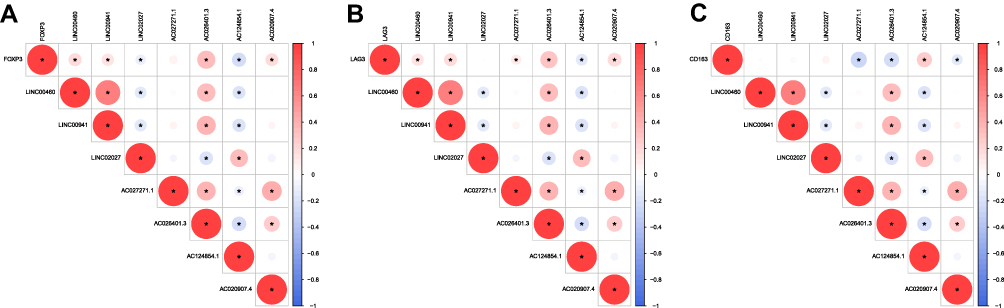 |
Figure 11 Relationship between immune characteristics and 7 FRLs from the prognostic model. (A–C) Correlations among FOXP3 (Tregs marker), LAG3 (Tregs marker), CD163 (Macrophages M2 marker) and 7 FRLs from the prognostic signature. Only correlations with a significant p < 0.05 were retained and presented. Positive correlations shown in red, negative correlations shown in blue. Color shade and circle size are proportional to the correlation coefficients. |
External Validation of FRLs as a Potential Biomarker
Next, KM survival analysis was used to validate the prognostic value of LINC00460, LINC00941 and LINC02027 in an external Kaplan-Meier Plotter dataset. The outcome indicated that LINC00460, as an adverse prognostic factor, was significantly associated with both OS (HR = 2.91 (2.16 − 3.92), Log-rank p = 2.3e−13) and RFS (HR = 5.34 (1.5 − 19.02), Log-rank p = 0.0039) (Figures 12A and B). LINC00941 serving as an indicator of poor prognosis was also significantly correlated with OS (HR = 2.29 (1.69 − 3.09), Log-rank p = 2.8e−08); however, although there was the same trend on RFS, statistical significance was not reached for that outcome (HR = 2.42 (0.55 − 10.77), Log-rank p = 0.23) (Figures 12C and D). The results also suggested that higher LINC02027 expression was significantly associated with shorter OS (HR = 0.4 (0.28 − 0.56), Log-rank p = 5.1e−08) but the differences on RFS did not achieve statistical significance (HR = 0.49 (0.18 − 1.39), Log-rank p = 0.17) (Figures 12E and F). According to online GEPIA2 database (based on TCGA and GTEx data), the same findings were obtained (Figures S2A-F). The results of survival analysis in external databases were consistent with our results.
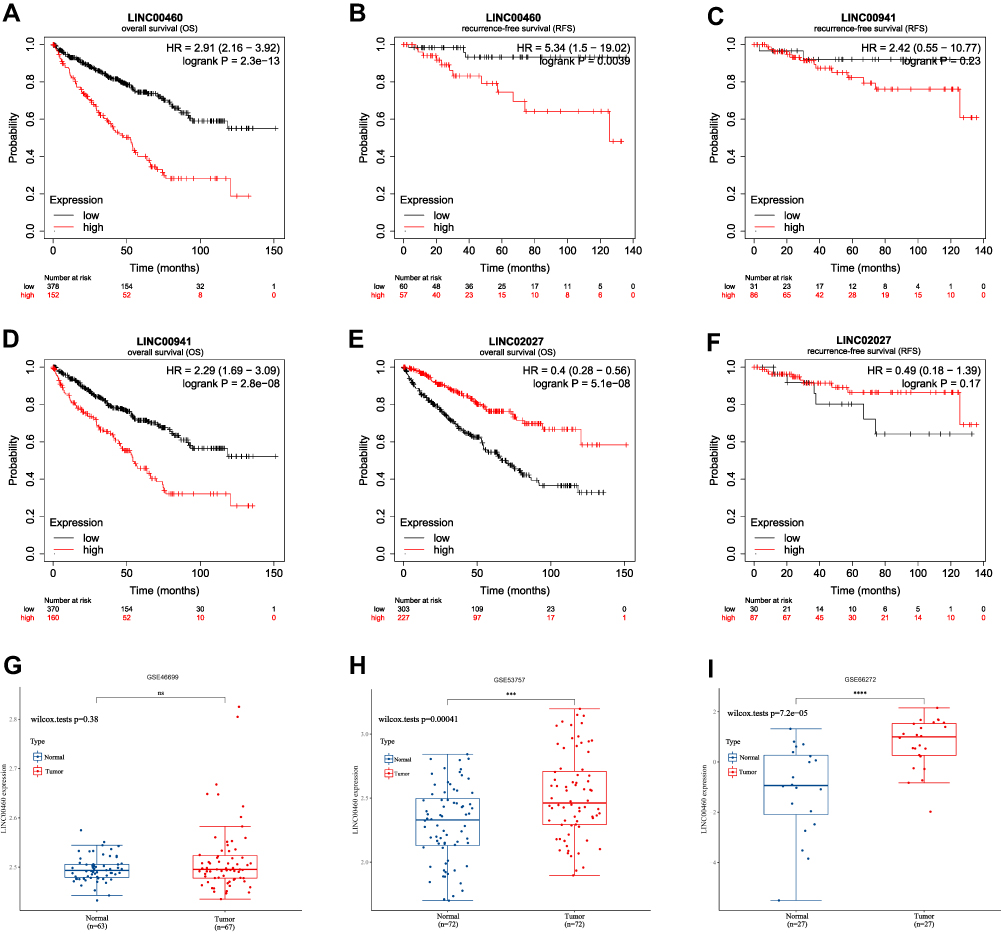 |
Figure 12 External Validation of FRLs as a Potential Biomarker. (A–F) OS and RFS analysis of LINC00460, LINC00941 and LINC02027 in Kaplan-Meier plotter dataset. (G–I) Box plot indicating higher expression of LINC00460 in ccRCC tissues than those in normal tissues using GEO cohort. ***p < 0.001, ****p < 0.0001. Abbreviation: ns, not significant. |
It has previously been reported that dysregulation of LINC00460 expression could affect cell proliferation and apoptosis and has been implicated in development and metastasis in various tumors as colorectal cancer,38 lung cancer39 and esophageal cancer.40 Therefore, LINC00460 was selected as the target to be validated in ccRCC cohorts from GEO database (GSE46699, GSE53757 and GSE66272). As shown in Figures 12G-I, the results of additional independent validation in GEO database are consistent with the expression trend of LINC00460 in our results. Compared with normal tissues, LINC00460 level was markedly elevated in ccRCC tumor tissues.
In vitro Experimental Validation of FRLs as a Potential Biomarker
In order to further verify the prognostic value of this FRLs-related model, in vitro experiments would be needed to elucidate the expression trend of the hub differentially expressed FRLs. The results of RT-qPCR showed that the overall trend in the expression levels of LINC00460 and LINC00941 increased in ccRCC cell lines (786-O, Caki-1, ACHN, OS-RC-2) compared to renal proximal tubule epithelial cells HK-2, but LINC02027 showed a reverse trend (Figures 13A-C), which corresponded with our previous results of bioinformatic analysis based on public databases.
 |
Figure 13 The expression levels of FRLs in vitro. (A–C) RT-qPCR was used to measure the mRNA level of LINC00460 (A), LINC00941 (B) and LINC02027 (C) in human renal proximal tubule epithelial cells HK-2 and renal clear cell carcinoma cell lines (786-O, Caki-1, ACHN and OS-RC-2). *p < 0.05, **p < 0.01, ***p < 0.001. |
Discussion
As stated previously, RCC is one of the most common malignant tumors in urinary system. Of the predominant RCC histological subtypes, ccRCC is the most aggressive subtype and accounts for almost 80% of RCC diagnoses.1 Although surgical resection remains optimal as a curative option for localized ccRCC, the treatment efficacy for advanced or metastatic ccRCC is still unsatisfactory.41 Thus, apart from conventional clinical risk factors, identifying new potential prognostic indicators for ccRCC appears increasingly necessary. Ferroptosis is described as non-apoptotic programmed cell death process that indicates the presence of metabolic abnormalities in cellular lipid peroxidation and lipoxygenase catalysis.42 More importantly, there is growing evidence suggesting that ferroptosis serves a pivotal function in tumorigenesis and progression.43 Ferroptosis combined with ICIs demonstrate a synergistic effect and enhance antitumor activity, even in ICI-resistance patients.44 Recently it has been shown that ferroptosis could induce immune-suppressed tumor microenvironment resulting in accelerated tumor growth by dysregulating cellular inflammatory response.45 Correspondingly, lncRNAs have also recently emerged as essential regulators in the immune system during tumorigenesis.20 Moreover, the integrative bioinformatic research had demonstrated that the dysregulation of ferroptosis-associated lncRNAs was in connection with tumor progression.15,17 These studies do not, however, highlight whether ferroptosis-related lncRNAs (FRLs) play a role in regulating immune phenotypes in ccRCC, which warrants further investigation.
In general, our analyses detected 186 ferroptosis-related DELs. KEGG pathway analysis further unraveled the DELs mainly involved in HIF−1 signaling pathway, MicroRNAs in cancer and Arachidonic acid metabolism. Regarding the enrichment results, we found recent research suggesting that HIF-2α activation further exacerbates oxidative cell death in colorectal cancers by leading to intracellular iron accumulation,46 which supported our result that HIF−1 signaling pathway might be involved in ferroptosis during tumor progression. Li et al also reported that FG-4592 (interfere with the effect of HIF-1) pretreatment could inhibit ferroptosis by activating Nrf2 through targeting Akt/GSK-3β.47 Furthermore, as a result of multivariate Cox regression, 7 FRLs (LINC00460, LINC00941, LINC02027, AC027271.1, AC026401.3, AC124854.1 and AC020907.4) that had independent prognostic value were screened out to construct the FRLs prognostic signature, with satisfactory efficacy in predicting the OS of ccRCC patients. To further verify the broad applicability of our prognostic model, stratification analysis was also performed by taking different clinicopathological parameters into account. The prognostic model could accurately distinguish ccRCC patients into low- and high-risk groups, and the two groups exhibited significant differences among clinical characteristics. Moreover, incorporating FRLs prognostic signature with Age, Gender, Grade and Stage, we constructed a nomogram that had potentially strong prediction capabilities of OS in ccRCC patients. Apart from that, we identified two subtypes of ccRCC according to the similarity of the expression patterns of the 7 FRLs mentioned above. The subtypes were referred to as cluster 1 and cluster 2, respectively. By applying CIBERSORT to calculate the proportions of 22 subpopulations of infiltrating immune cell in ccRCC, we figured out that two clusters had different tumor-infiltrating immune cell signature. The infiltration of immune cells as Tregs and T cells follicular helper was significantly increased while the infiltration of immune cells as Macrophages M1 and Macrophages M2 was significantly decreased in the highest-risk score group cluster 2 compared with the relatively low-risk score group cluster 1. The differences in the aspect of clinicopathological features and prognosis between cluster 1 and cluster 2 were partly due to the different tumor-infiltrating immune cell signature. In summary, these results demonstrate that a comprehensive evaluation of the FRLs prognostic signature as well as taking immune infiltration into consideration will contribute to developing more individualized novel therapies by assessing the clinical response to immunotherapy. The prognostic value of some hub FRLs in the risk model was also externally validated via three GEO datasets (GSE46699, GSE53757 and GSE66272) and online databases including Kaplan-Meier Plotter and GEPIA. Finally, the three FRLs with significant P-value in this prognostic signature (LINC00460, LINC00941 and LINC02027) were verified through in vitro experiments.
Among the lncRNAs in this FRLs prognostic signature, several have been recognized as being associated with immunity, ferroptosis, and malignancy. For instance, LINC00941, which was reported to promote pancreatic cancer progression through LIMK1/Cofilin-1 signaling,48 could also facilitate oral squamous cell carcinoma progression through canonical WNT/β-catenin signaling pathway.49 Recently, Cisneros-Villanueva et al found that LINC00460 expression is considerably enriched in the Basal-like 2 (BL2) TNBC subtype and potentially regulates the WNT differentiation pathway as well as immunogenic.50 It has previously been reported that dysregulation of LINC00460 expression could affect cell proliferation and apoptosis and has been implicated in development and metastasis in various tumors as colorectal cancer,38 lung cancer39 and esophageal cancer.40 Overall, the function of lncRNAs reported in the previous studies concurs with our findings of 7 FRLs acting as independent prognostic indicators. At present, a consensus has been achieved that not only tumor characteristics but also profiles of tumor immune microenvironment contribute to tumor development or metastasis.51 For instance, the mainstream viewpoint is that Tregs-mediated immunosuppression plays a crucial role in leading to immune evasion and tumor progression.52 Intra-tumoral high abundance of Tregs represents a substantial obstacle for cancer immunotherapy in multiple tumor types. Meanwhile, elevated expression of FOXP3, the most specific marker of Tregs, might lead to a decrease in CD8+ T cell infiltration and procession, recurrence, and migration of kinds of cancer such as gastric cancer,53 ovarian cancer54 and hepatocellular carcinoma.55 Lymphocyte-activation gene 3 (LAG3), belonging to the immunoglobulin superfamily, has been proposed as an inhibitory checkpoint receptor on activated T-cells and impairs antitumor activity of T cells,56 with well-defined as an immunosuppressive factor.57 Additionally, previous studies have also indicated that the presence of LAG3 could be important for FOXP3+ Treg functioning, as LAG3–/– Tregs exhibit functionally impaired immunosuppression.36 The results of our study, which indicated that the ccRCC patients in cluster 2 had the worse prognosis partly due to the higher level of infiltration of Tregs (showing upregulated expression of markers FOXP3 and LAG3), were in line with the previous studies mentioned above. Also, the poorer prognosis and higher risk score in cluster 2 presented an association with the higher expression levels of commonly used immune checkpoints related to immunosuppression (such as PD-L1, CTLA-4 and TIGIT). Therefore, the FRLs prognostic signature might serve as potential immunotherapy targets of ccRCC.
Ferroptosis can potentially provide efficacious solutions in tumor treatment; what is more, ferroptosis also suggests a novel perspective on tumor immune infiltration. Future research may elucidate the therapeutic direction of tumor immunotherapy by clarifying the regulation mechanisms between ferroptosis and non-coding RNA. Indeed, there are also some deficiencies in this study. First, this study was a bioinformatic analysis based on the public databases and was not verified by clinical examination. Second, the expression levels of the FRLs and their impact on immunophenotype were not compelling enough without in vitro and in vivo assays. But overall, our results might provide some evidence and clues for further investigation on the underlying mechanism about ferroptosis of lncRNAs and potential prognostic immune subtype in ccRCC patients.
Conclusion
In conclusion, we comprehensively demonstrated the expression, prognostic value, and potential modulation effect on tumor immune infiltration of the FRLs prognostic signature, including 7 independent prognostic lncRNAs, in ccRCC. This signature was correlated with immune infiltration and immune checkpoint blockade (ICB). We also correlated two distinct clusters with immune infiltration signature of ccRCC for the first time. We supposed that the FRLs prognostic signature is tightly correlated with the malignant clinicopathological features and immune signatures in ccRCC.
Abbreviations
ccRCC, clear cell renal cell carcinoma; RCC, renal cell carcinoma; TCGA, The Cancer Genome Atlas; KIRC, kidney renal clear cell carcinoma; LncRNAs, long non-coding RNAs; FRGs, ferroptosis-related genes; FRLs, ferroptosis-related lncRNAs; GO, Gene ontology; BP, biological processes; MF, molecular function; CC, cellular components; KEGG, Kyoto Encyclopedia of Genes and Genomes; GSEA, Gene set enrichment analyses; FDR, false discovery rate; ssGSEA, single-sample gene set enrichment analysis; ICIs, immune checkpoint inhibitors; OS, overall survival; Lasso, least absolute shrinkage and selection operator; ROC, receiver operating characteristic; AUC, area under the curve; DCA, decision curve analysis.
Data Sharing Statement
Raw data are available at TCGA (search term: TCGA-KIRC). TCGA belongs to public databases. The patients involved in the database have obtained ethical approval. Users can download relevant data for free for research and publish relevant articles.
Ethics Approval and Consent to Participate
Our study was approved by the medical ethics committee of Tongji Hospital, Huazhong University of Science and Technology (TJ-IRB20210522).
Acknowledgments
We acknowledge TCGA database for providing their platforms and contributors for uploading their meaningful datasets. The authors sincerely thank all participants involved in this study.
Author Contributions
All authors made a significant contribution to the work reported, whether that is in the conception, study design, execution, acquisition of data, analysis and interpretation, or in all these areas; took part in drafting, revising or critically reviewing the article; gave final approval of the version to be published; have agreed on the journal to which the article has been submitted; and agree to be accountable for all aspects of the work.
Funding
The work was supported by the National Natural Science Foundation of China (NO.81773360).
Disclosure
The authors declare that there is no conflict of interest. Our study is based on open-source data, so there are no ethical issues and other conflicts of interest.
References
1. Ljungberg B, Campbell SC, Choi HY, et al. The epidemiology of renal cell carcinoma. Eur Urol. 2011;60(4):615–621.
2. Ljungberg B, Bensalah K, Canfield S, et al. EAU guidelines on renal cell carcinoma: 2014 update. Eur Urol. 2015;67(5):913–924.
3. Motzer RJ, Penkov K, Haanen J, et al. Avelumab plus Axitinib versus Sunitinib for Advanced Renal-Cell Carcinoma. N Engl J Med. 2019;380(12):1103–1115.
4. Xie Y, Hou W, Song X, et al. Ferroptosis: process and function. Cell Death Differ. 2016;23(3):369–379.
5. Stockwell BR, Friedmann Angeli JP, Bayir H, et al. Ferroptosis: a Regulated Cell Death Nexus Linking Metabolism, Redox Biology, and Disease. Cell. 2017;171(2):273–285.
6. Torti SV, Torti FM. Ironing out cancer. Cancer Res. 2011;71(5):1511–1514.
7. Manz DH, Blanchette NL, Paul BT, Torti FM, Torti SV. Iron and cancer: recent insights. Ann N Y Acad Sci. 2016;1368(1):149–161.
8. Ding F, Zhang L, Chen H, Song H, Chen S, Xiao H. Enhancing the chemotherapeutic efficacy of platinum prodrug nanoparticles and inhibiting cancer metastasis by targeting iron homeostasis. Nanoscale Horiz. 2020;5(6):999–1015.
9. Hassannia B, Vandenabeele P, Vanden Berghe T. Targeting Ferroptosis to Iron Out Cancer. Cancer Cell. 2019;35(6):830–849.
10. Yang WH, Ding CC, Sun T, et al. The Hippo Pathway Effector TAZ Regulates Ferroptosis in Renal Cell Carcinoma. Cell Rep. 2019;28(10):2501–2508 e2504.
11. Markowitsch SD, Schupp P, Lauckner J, et al. Artesunate Inhibits Growth of Sunitinib-Resistant Renal Cell Carcinoma Cells through Cell Cycle Arrest and Induction of Ferroptosis. Cancers. 2020;12(11):427.
12. Guttman M, Rinn JL. Modular regulatory principles of large non-coding RNAs. Nature. 2012;482(7385):339–346.
13. Prensner JR, Chinnaiyan AM. The emergence of lncRNAs in cancer biology. Cancer Discov. 2011;1(5):391–407.
14. Martens-Uzunova ES, Bottcher R, Croce CM, Jenster G, Visakorpi T, Calin GA. Long noncoding RNA in prostate, bladder, and kidney cancer. Eur Urol. 2014;65(6):1140–1151.
15. Liang J, Zhi Y, Deng W, et al. Development and validation of ferroptosis-related lncRNAs signature for hepatocellular carcinoma. PeerJ. 2021;9:e11627.
16. Cai HJ, Zhuang ZC, Wu Y, et al. Development and validation of a ferroptosis-related lncRNAs prognosis signature in colon cancer. Bosn J Basic Med Sci. 2021;1:564.
17. Tang Y, Li C, Zhang YJ, Wu ZH. Ferroptosis-Related Long Non-Coding RNA signature predicts the prognosis of Head and neck squamous cell carcinoma. Int J Biol Sci. 2021;17(3):702–711.
18. Efimova I, Catanzaro E, Van der Meeren L, et al. Vaccination with early ferroptotic cancer cells induces efficient antitumor immunity. J Immunother Cancer. 2020;8(2):874.
19. Yang J, Ma S, Xu R, et al. Smart biomimetic metal organic frameworks based on ROS-ferroptosis-glycolysis regulation for enhanced tumor chemo-immunotherapy. J Control Release. 2021;334:21–33.
20. Chen YG, Satpathy AT, Chang HY. Gene regulation in the immune system by long noncoding RNAs. Nat Immunol. 2017;18(9):962–972.
21. Eckel-Passow JE, Serie DJ, Bot BM, Joseph RW, Cheville JC, Parker AS. ANKS1B is a smoking-related molecular alteration in clear cell renal cell carcinoma. BMC Urol. 2014;14:14.
22. Von roemeling CA, Radisky DC, Marlow LA, et al. Neuronal pentraxin 2 supports clear cell renal cell carcinoma by activating the AMPA-selective glutamate receptor-4. Cancer Res. 2014;74(17):4796–4810.
23. Wotschofsky Z, Gummlich L, Liep J, et al. Integrated microRNA and mRNA Signature Associated with the Transition from the Locally Confined to the Metastasized Clear Cell Renal Cell Carcinoma Exemplified by miR-146-5p. PLoS One. 2016;11(2):e0148746.
24. Zhou N, Bao J. FerrDb: a manually curated resource for regulators and markers of ferroptosis and ferroptosis-disease associations. Database (Oxford). 2020;2020:54.
25. Harrow J, Frankish A, Gonzalez JM, et al. GENCODE: the reference human genome annotation for The ENCODE Project. Genome Res. 2012;22(9):1760–1774.
26. Ritchie ME, Phipson B, Wu D, et al. limma powers differential expression analyses for RNA-sequencing and microarray studies. Nucleic Acids Res. 2015;43(7):e47.
27. Newman AM, Liu CL, Green MR, et al. Robust enumeration of cell subsets from tissue expression profiles. Nat Methods. 2015;12(5):453–457.
28. Yoshihara K, Shahmoradgoli M, Martinez E, et al. Inferring tumour purity and stromal and immune cell admixture from expression data. Nat Commun. 2013;4:2612.
29. Li T, Fan J, Wang B, et al. TIMER: a Web Server for Comprehensive Analysis of Tumor-Infiltrating Immune Cells. Cancer Res. 2017;77(21):e108–e110.
30. Finotello F, Mayer C, Plattner C, et al. Molecular and pharmacological modulators of the tumor immune contexture revealed by deconvolution of RNA-seq data. Genome Med. 2019;11(1):34.
31. Becht E, Giraldo NA, Lacroix L, et al. Estimating the population abundance of tissue-infiltrating immune and stromal cell populations using gene expression. Genome Biol. 2016;17(1):218.
32. Aran D, Hu Z, Butte AJ. xCell: digitally portraying the tissue cellular heterogeneity landscape. Genome Biol. 2017;18(1):220.
33. Seiler M, Huang CC, Szalma S, Bhanot G. ConsensusCluster: a software tool for unsupervised cluster discovery in numerical data. OMICS. 2010;14(1):109–113.
34. Smyth MJ, Ngiow SF, Ribas A, Teng MW. Combination cancer immunotherapies tailored to the tumour microenvironment. Nat Rev Clin Oncol. 2016;13(3):143–158.
35. Wang W, Green M, Choi JE, et al. CD8(+) T cells regulate tumour ferroptosis during cancer immunotherapy. Nature. 2019;569(7755):270–274.
36. Huang CT, Workman CJ, Flies D, et al. Role of LAG-3 in regulatory T cells. Immunity. 2004;21(4):503–513.
37. Takeuchi Y, Nishikawa H. Roles of regulatory T cells in cancer immunity. Int Immunol. 2016;28(8):401–409.
38. Lian Y, Yan C, Xu H, et al. A Novel lncRNA, LINC00460, Affects Cell Proliferation and Apoptosis by Regulating KLF2 and CUL4A Expression in Colorectal Cancer. Mol Ther Nucleic Acids. 2018;12:684–697.
39. Li K, Sun D, Gou Q, et al. Long non-coding RNA linc00460 promotes epithelial-mesenchymal transition and cell migration in lung cancer cells. Cancer Lett. 2018;420:80–90.
40. Liang Y, Wu Y, Chen X, et al. A novel long noncoding RNA linc00460 up-regulated by CBP/P300 promotes carcinogenesis in esophageal squamous cell carcinoma. Biosci Rep. 2017;37(5):984.
41. MacLennan S, Imamura M, Lapitan MC, et al. Systematic review of perioperative and quality-of-life outcomes following surgical management of localised renal cancer. Eur Urol. 2012;62(6):1097–1117.
42. Ye Z, Liu W, Zhuo Q, et al. Ferroptosis: final destination for cancer? Cell Prolif. 2020;53(3):e12761.
43. Chen JJ, Galluzzi L. Fighting Resilient Cancers with Iron. Trends Cell Biol. 2018;28(2):77–78.
44. Tang R, Xu J, Zhang B, et al. Ferroptosis, necroptosis, and pyroptosis in anticancer immunity. J Hematol Oncol. 2020;13(1):110.
45. Murao A, Aziz M, Wang H, Brenner M, Wang P. Release mechanisms of major DAMPs. Apoptosis. 2021;26(3–4):152–162.
46. Singhal R, Mitta SR, Das NK, et al. HIF-2alpha activation potentiates oxidative cell death in colorectal cancers by increasing cellular iron. J Clin Invest. 2021;131:12.
47. Li X, Zou Y, Xing J, et al. Pretreatment with Roxadustat (FG-4592) Attenuates Folic Acid-Induced Kidney Injury through Antiferroptosis via Akt/GSK-3beta/Nrf2 Pathway. Oxid Med Cell Longev. 2020;2020:6286984.
48. Wang J, He Z, Xu J, Chen P, Jiang J. Long noncoding RNA LINC00941 promotes pancreatic cancer progression by competitively binding miR-335-5p to regulate ROCK1-mediated LIMK1/Cofilin-1 signaling. Cell Death Dis. 2021;12(1):36.
49. Ai Y, Wu S, Zou C, Wei H. LINC00941 promotes oral squamous cell carcinoma progression via activating CAPRIN2 and canonical WNT/beta-catenin signaling pathway. J Cell Mol Med. 2020;24(18):10512–10524.
50. Cisneros-Villanueva M, Hidalgo-Perez L, Cedro-Tanda A, et al. LINC00460 Is a Dual Biomarker That Acts as a Predictor for Increased Prognosis in Basal-Like Breast Cancer and Potentially Regulates Immunogenic and Differentiation-Related Genes. Front Oncol. 2021;11:628027.
51. Grivennikov SI, Greten FR, Karin M. Immunity, inflammation, and cancer. Cell. 2010;140(6):883–899.
52. Wang HY, Lee DA, Peng G, et al. Tumor-specific human CD4+ regulatory T cells and their ligands: implications for immunotherapy. Immunity. 2004;20(1):107–118.
53. Yuan XL, Chen L, Li MX, et al. Elevated expression of Foxp3 in tumor-infiltrating Treg cells suppresses T-cell proliferation and contributes to gastric cancer progression in a COX-2-dependent manner. Clin Immunol. 2010;134(3):277–288.
54. Wolf D, Wolf AM, Rumpold H, et al. The expression of the regulatory T cell-specific forkhead box transcription factor FoxP3 is associated with poor prognosis in ovarian cancer. Clin Cancer Res. 2005;11(23):8326–8331.
55. Kobayashi N, Hiraoka N, Yamagami W, et al. FOXP3+ regulatory T cells affect the development and progression of hepatocarcinogenesis. Clin Cancer Res. 2007;13(3):902–911.
56. Speiser DE, Ho PC, Verdeil G. Regulatory circuits of T cell function in cancer. Nat Rev Immunol. 2016;16(10):599–611.
57. Graydon CG, Balasko AL, Fowke KR. Roles, function and relevance of LAG3 in HIV infection. PLoS Pathog. 2019;15(1):e1007429.
 © 2022 The Author(s). This work is published and licensed by Dove Medical Press Limited. The full terms of this license are available at https://www.dovepress.com/terms.php and incorporate the Creative Commons Attribution - Non Commercial (unported, v3.0) License.
By accessing the work you hereby accept the Terms. Non-commercial uses of the work are permitted without any further permission from Dove Medical Press Limited, provided the work is properly attributed. For permission for commercial use of this work, please see paragraphs 4.2 and 5 of our Terms.
© 2022 The Author(s). This work is published and licensed by Dove Medical Press Limited. The full terms of this license are available at https://www.dovepress.com/terms.php and incorporate the Creative Commons Attribution - Non Commercial (unported, v3.0) License.
By accessing the work you hereby accept the Terms. Non-commercial uses of the work are permitted without any further permission from Dove Medical Press Limited, provided the work is properly attributed. For permission for commercial use of this work, please see paragraphs 4.2 and 5 of our Terms.