")
Back to Journals » Neuropsychiatric Disease and Treatment » Volume 15
Analysis of correlation between cerebral perfusion and KIM score of white matter lesions in patients with Alzheimer’s disease
Authors Li RR , He YS, Liu M, Nie ZY, Huang LH, Lu Z, Jin LJ, Li YX
Received 27 February 2019
Accepted for publication 5 August 2019
Published 18 September 2019 Volume 2019:15 Pages 2705—2714
DOI https://doi.org/10.2147/NDT.S207069
Checked for plagiarism Yes
Review by Single anonymous peer review
Peer reviewer comments 2
Editor who approved publication: Dr Jun Chen
Ren-Ren Li,1,* Yu-Sheng He,1,* Meng Liu,1 Zhi-Yu Nie,1 Li-He Huang,2 Zheng Lu,3 Ling-Jing Jin,1 Yun-Xia Li1
1Department of Neurology, Tongji Hospital, Tongji University School of Medicine, Shanghai 200065, People’s Republic of China; 2School of Foreign Languages, Research Center for Ageing, Language and Care, Tongji University, Shanghai 200092, People’s Republic of China; 3Department of Psychiatry, Tongji Hospital, Tongji University School of Medicine, Shanghai 200065, People’s Republic of China
*These authors contributed equally to this work
Correspondence: Yun-Xia Li
Department of Neurology, Tongji Hospital, Tongji University School of Medicine, 389 Xincun Road, Shanghai 200065, People’s Republic of China
Email [email protected]
Purpose: This study aimed to characterize white matter lesions (WMLs) and regional cerebral perfusion, and evaluate their correlations with cognitive deficits in Alzheimer’s disease (AD) patients.
Patient and methods: One hundred and twenty-eight patients with AD (AD group) and 75 subjects without AD (control group) were recruited. The medical information was collected from each subject. Montreal cognitive assessment (MoCA) was employed for the assessment of cognition. Cranial MRI was performed, and the KIM scoring system was used to evaluate the white matter hyperintensity. The CT perfusion (CTP) imaging was employed to assess the whole cerebral perfusion, and the region of interest (ROI) was selected to determine the blood perfusion at different parts.
Results: The education level and MoCA score in AD group were significantly lower than in control group (P<0.001). The KIM score of juxtaventricular WML (JVWMLs) was significantly different between two groups (P<0.05) and AD group showed a higher incidence of severe JVWML and periventricular WML (PVWMLs); in AD group, the total KIM score and KIM scores of JVWMLs, PVWMLs and deep WML (DWMLs) showed negative relationships with the MoCA score (P<0.001). As compared to control group, the blood perfusion of either whole brain or different parts in the AD group reduced significantly (P<0.05). In the AD group, there was a negative correlations of blood perfusion at JVWM and PVWM with corresponding KIM scores (P<0.05 or 0.01). In the AD group, the blood perfusions of the whole brain, JVWMLs, PVWMLs and deep WML were negatively related to MoCA score (P<0.05).
Conclusion: In conclusion, the cognitive deficits in the AD patients are associated with the degree of WMLs, especially the JVWML, PVWML and DWML as well as with the reduced perfusion of JVWM, PVWM and deep WM.
Keywords: Alzheimer’s disease, cerebral blood flow, white matter lesion, KIM score
Introduction
Emerging studies have confirmed that cerebral perfusion and white matter lesions (WMLs) are closely related to the occurrence and development of Alzheimer's disease (AD).1–5 More than 50% of the elderly suffer from WMLs which are closely associated with cognitive impairment6–10 and may significantly increase the risk for dementia.11–13 However, it is controversial on the relationships between WMLs at different brain parts and cognitive impairment.14–18 There is evidence showing that the periventricular WMLs (PVWMLs), rather than the deep WMLs (DWMLs), are an important factor related to the pathogenesis of cognitive impairment,15,16 but other studies indicate DWML hyperintensity has a stronger relationship with the degree of cognitive impairment.17,18 This discrepancy may be ascribed to the difference in the WML scoring system used. In clinical practice, the scoring system reported by Fazekas et al19 is often used to assess the degree of WML, but its classification of WML is general and the definitions of various types of lesions are ambiguous based on this system, failing to reflect the complex pathology and etiology of WMLs. This may be one of the reasons for conflicting results about the etiology, pathology and clinical manifestations of WMLs. Based on the anatomical location, etiology and pathophysiology of WMLs, KIM et al20 classified WMLs into juxtacortical WMLs (JCWMLs), DWMLs, PVWMLs and juxtaventricular WMLs (JVWMLs). Compared with the traditional dichotomy, the KIM classification is intuitive, easy to understand and well defined, which helps to reduce the heterogeneity. In the majority of studies, the relationship between WMLs and cognitive function is investigated in only PVWMLs and DWMLs. In recent years, JCWMLs were reported to be related to the cognition impairment or the progression of dementia in the elderly.21,22 Therefore, it is necessary to further study the relationships of JCWML and JVWMLs with cognitive impairment. Currently, the pathogenesis of WMLs remains still unclear, and many studies have proposed it is related to the cerebral-reduced perfusion.1,5 The findings are mainly from the animal studies or autopsy studies, but few direct evidences come from clinical studies concerning cerebral perfusion. Therefore, KIM classification20 was employed to compare the distribution and severity of JVWML, PVWML, DWML and JCWML, characterize the cerebral perfusion in these regions and assess the relationship of WMLs and cerebral perfusion with cognitive impairment in AD patients.
Materials and methods
Subjects
Subjects were recruited from the Department of Neurology and the Department of Memory Clinic of Shanghai Tongji Hospital and divided into two groups: AD group and control group. Inclusion criteria were as follows: AD group (n=128): 1) AD was diagnosed based on the clinical diagnostic criteria for probable AD of NIA-AA (2011);23 2) the MoCA score was <24. Control group (n=75): 1) patients had no dementia; 2) the MoCA score was ≥24. Exclusion criteria were as follows: 1) there was a definite history of stroke; 2) there was definite history of other diseases of the central nervous system such as infection, demyelinating diseases and Parkinson’s disease; 3) there was a definite history of mental illnesses such as schizophrenia and major depressive disorder; 4) subjects had serious physical disease; 5) subjects had alcohol or drug addiction; 6) subjects were unable to cooperate with neuropsychological tests; 7) subjects had contraindications to MRI and 8) subjects were sensitive to iodine.
Medical record and findings of systematic neurological examination were collected, including the gender, age, education level, history of neurological and psychiatric diseases and history of major medical conditions (such as heart disease, hepatic insufficiency, renal insufficiency, thyroid dysfunction and cancer). The risk factors for cerebrovascular diseases (such as hypertension, diabetes, heart disease, hyperlipidemia, hyperhomocysteinemia, stroke), smoking and alcohol abuse and history of familial cerebrovascular disease were recorded.
The study was supported by the Ethics committee of Tongji Hospital (SHEN-KYSB-2016–99) and conducted in accordance with the Declaration of Helsinki. Written informed consent had been obtained from each patient.
Montreal cognitive assessment
All the subjects received neuropsychological assessment. In the present study, the Montreal Cognitive Assessment (MoCA) was used to evaluate the global cognition function and the Activity of Daily Living (ADL) Scale was employed to assess the basic functions of daily life. The assessments were performed by a clinician qualified with neuropsychological assessment.
MRI acquisition
MRI was performed with the 3.0T MR system (Magneton Verio, Siemens Medical Systems, Erlangen, Germany) with an orthonormal head coil. During the MRI scanning, all the subjects were asked to lay in a supine position and keep calm. The head was fixed with surrounding sponges. The fluid-attenuated inversion recovery (FLAIR) sequence MRI was done with the following parameters: time of repetition (TR), 5000 ms; time of echo (TE), 94 ms; time of inversion (TI), 1800 ms; slice thickness, 5 mm; slice interval, 1 mm; field of view (FOV), 230 mm. The AC-PC line served as a baseline, and a total of 23 slices were acquired.
WML grading
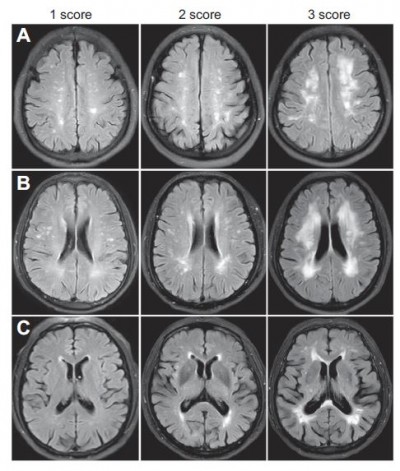
WML was evaluated on the axial FLAIR images on three classic layers of the brain which were selected by the investigator blind to the study. These layers included centrum semiovale layer (a layer above the corpus callosum), lateral ventricular body layer (a layer between the midpoints of top-bottom lines of bilateral ventricles) and basal ganglion layer (a layer between lower parts of antecornu and postcornu of lateral ventricles) according the classification system proposed by Kim et al.20 The KIM score of each WML ranges from 0 to 3. The WML was scored as follows (Figure 1): for JVWML: 0 – no WML, 1 – small cap or thin lining lesion, 2 – larger cap or smooth halo lesion, 3 – extending cap or irregular extended hyperintensity; for PVWML, DWML and JCWML: 0 – no WML, 1 – punctuated lesion, 2 – more punctuated lesion with confluence, 3 – lesion with massive confluence. The final KIM score was the sum of scores of bilateral white matters at different layers. Assessment of WML was done by two experienced physicians who were blind to the patients’ cognitive function. Before the assessment, the two raters received training for the assessment of brain layers, and the intra-rater consistence was high. If there was a discrepancy in the score between two raters, the score was determined after consultation.
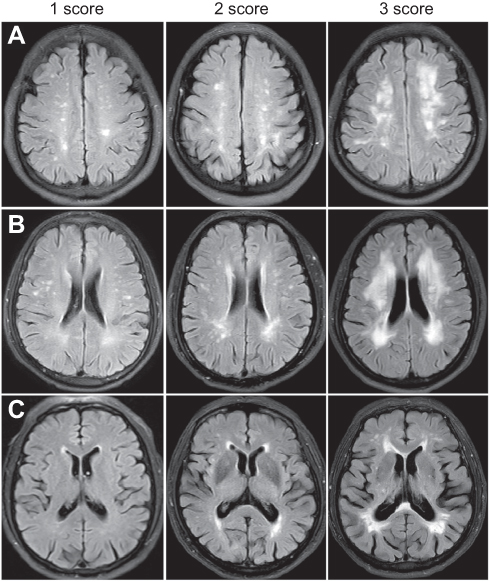 |
Figure 1 KIM score of white matter lesions. A, B, C, three layers of the brain (A=centrum semiovale, B=lateral ventricular body, C=basal ganglia); KIM score of each layer: 1 – small cap or thin lining lesion or punctuated lesion; 2 – larger cap or smooth halo lesion or more punctuated lesion with confluence; 3 – extending cap or irregular extended hyperintensity or lesion with massive confluence. |
CT perfusion scanning protocol
All the participants underwent whole-brain perfusion imaging with a 320-detector row system (Aquilion ONE; Toshiba Medical Systems, Tokyo, Japan). The volume scan parameters were as follows: 100 kV tube voltage, 150 mA tube current, 512×512 matrices, 220 mm FOV, 0.5 seconds rotation time, 0.5 mm slice thickness and 140 mm z-direction coverage. A total of 50 mL of nonionic contrast media (Iohexol, with an iodine content of 350 mg/mL) was administered at a flow rate of 5 mL/s through an antecubital vein. The first scanning was performed at 7th second after injection, the continuous intermittent scanning was done once every 2 seconds from the 12th second, and the enhancement effects peaked between 18th second and 28th second. Then, a 5-second interval was used in the venous phase between the 40th second and the 60th second. The lap rotation time was 0.5 seconds, and the total duration of scanning was 60 seconds. Finally, the 19 whole-brain volume data were acquired for every subject.
Acquisition of cerebral perfusion data
CTP image data were collected, and the quality of perfusion images was evaluated. Images with motion artifacts or dark skull base artifacts were excluded. All qualified CTP images were pre-processed with the perfusion mismatch analyzer (PMA, Ver. 5.0.0.0.) software (http://asist.umin.jp/index-e.htm) to calculate the perfusion maps of cerebral blood flow (CBF). The software automatically selects 10 arterial input functions (AIFs) in one slice with the Circle of Willis as a reference layer. The venous output function (VOF) was automatically chosen in the intracranial veins above the skull base. The perfusion maps were calculated with a delay-insensitive deconvolution algorithm, the block-circulant Singular Value Decomposition (bSVD).24 Calculations were performed with PMA, the parameters of which remained at default.
First, one well-placed CTA image with an average head diameter was selected as the template and the location of template brain was adjusted as follows: for axial images, the interhemispheric fissure was vertically on the middle line and the bilateral temporal poles were on the same horizontal plane; for coronal images, the superior sagittal sinus was vertically on the middle line and the tops of bilateral ventricles were on the same horizontal plane; for sagittal images, the line between the bottoms of bilateral ventricles was horizontal. Second, three layers are selected based on the positioning of sagittal images: centrum semiovale layer is the layer above the corpus callosum, lateral ventricular body layer is a layer between the midpoints of top-bottom lines of bilateral ventricles and basal ganglion layer is a layer between lower parts of antecornu and postcornu of lateral ventricles. Third, the region of interest (ROI) was delineated according to the definition of KIM’s classification20 (Figure 2). Forth, after the original ROI was determined, the CTA images of each patient were imported into Mango software; then, the template brain was loaded as an overlay for six-parameter adjustment and alignment of anatomical landmarks. Moreover, the contour of the brain and ventricle structure of all the patients were also adjusted in line with the template. The resultant parameters were stored and applied to the CTP images of each patient for the acquisition of normalized CTP images. Fifth, the original ROIs were loaded to the normalized CTP images and then ROIs were fine-tuned to avoid the sinuses and ventricles, aiming to reduce the measuring errors. The cerebral blood flow (CBF) of each ROI was obtained at each layer.
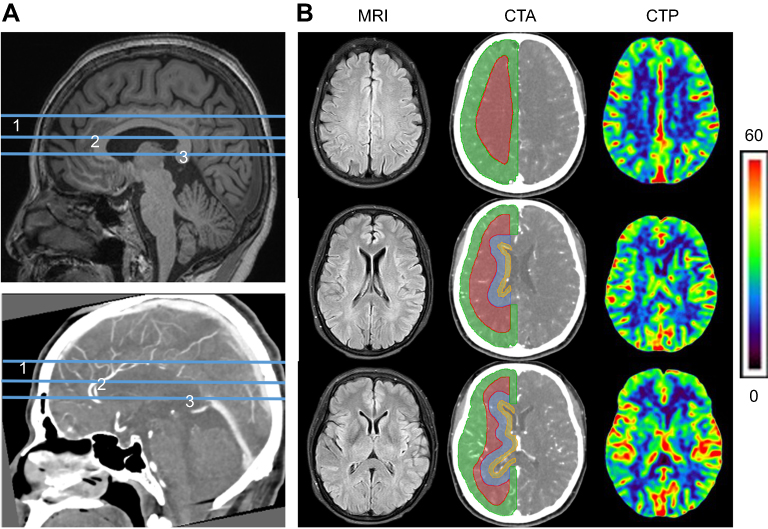 |
Figure 2 Reference lines and regions of interest for the assessment of cerebral blood flow. (A) Reference lines on the sagittal images. Line 1 – the tangent line at the top of the corpus callosum corresponding the layer of centrum semiovale; line 2 – the middle points of line 1 and line 3 corresponding the layer of lateral ventricular body; line 3 – the line that connects the antecornu and postcornu of the lateral ventricle the layer of basal ganglia. (B) ROIs for CBF assessment and corresponding KIM classification. 1, 2, 3 – three layers of the brain (1=centrum semiovale, 2=lateral ventricular body, 3=basal ganglia); green – JCWM; red – DWM; blue – PVWM; yellow – JVWM. Abbreviations: ROI, region of interest; CBF, cerebral blood flow. |
Statistical method
All statistical analyses were performed with the IBM SPSS Statistics version 23.0. A descriptive analysis was done to describe the characteristics of age, sex, education level, other clinical data and MoCA scores in two groups. The CBF between AD group and control group was compared using two independent sample t-test, and the KIM score with non-parametric test. The incidence of WMLs between two groups was compared with Chi-square test. The association was evaluated with Spearman correlation analysis. A value of two-sided P<0.05 was considered statistically significant.
Results
Clinical characteristics between AD group and control group
There were no significant differences between AD group and control group in the age, sex, family history, diabetes, heart disease, hyperlipidemia, hyperhomocysteinemia, smoking and alcohol use (P>0.05). Significant differences in the education level and MoCA score were found between two groups (P<0.001) (Table 1).
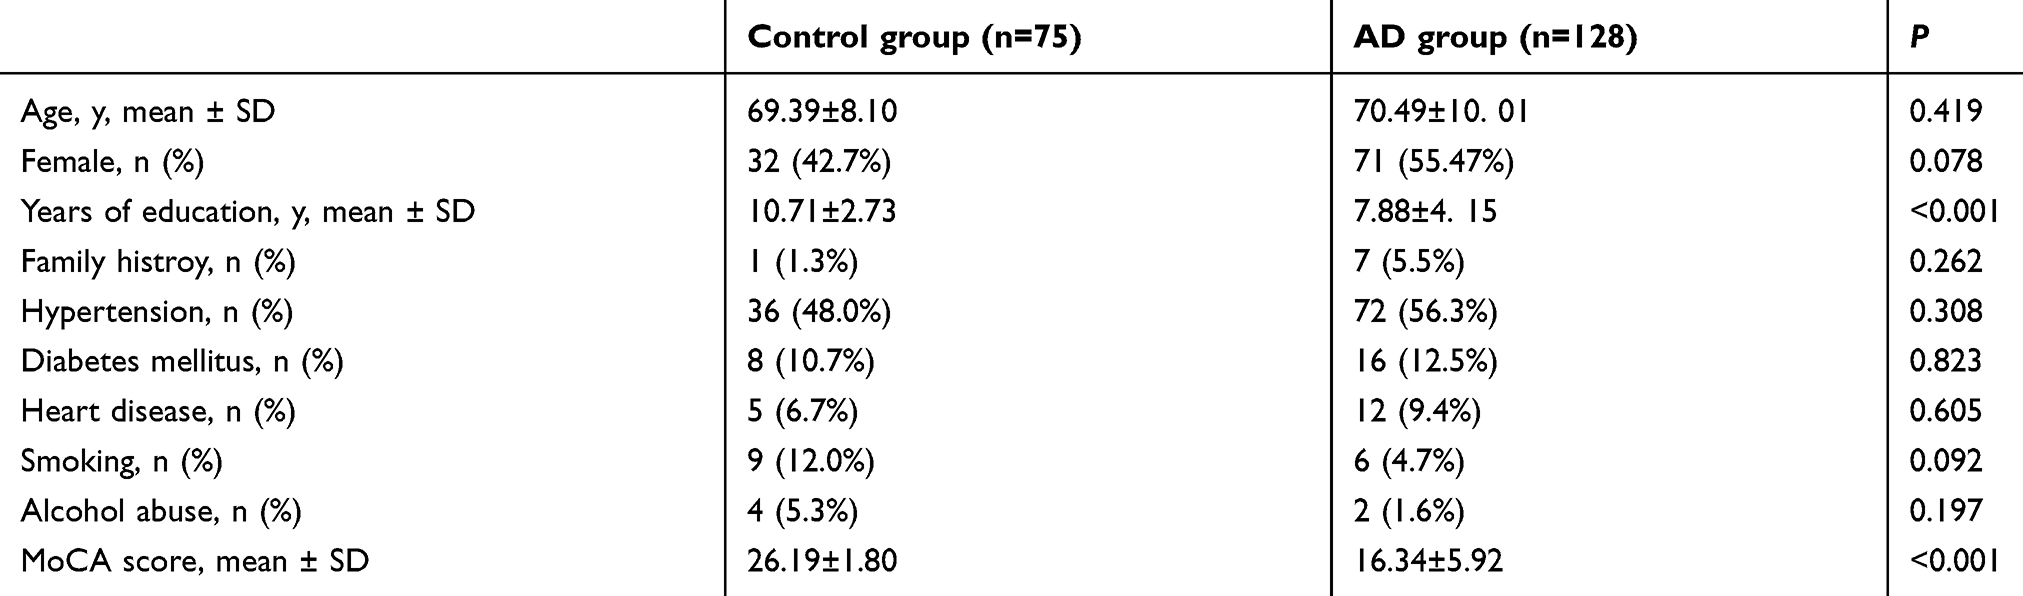 |
Table 1 Demographic and clinical characteristics of subjects in AD and control group |
KIM scores of WML and correlation with MoCA
Significant difference in the total KIM score was noted only in the JVWML between AD group and control group (P<0.05). In AD group, the incidence of severe WML (KIM score =3) in the PVW (29.7% vs 14.7%, P=0.017) and JVW (29.7% vs 12.0%, P=0.005) was significantly higher than in control group, but significant difference was not observed in the DWM and JCWM. In addition, the prevalence of WMLs of other grades (KIM score =2 or KIM score =1) has no significant difference between the two groups.
Correlation analysis showed the total KIM score and score of DWML, PVWML and JVWML were negatively related to MoCA score in AD group (r=−0.346, −0.375, −0.380, −0.323, P<0.001), but this relationship was not observed between KIM score of JCWML and MoCA score. In control group, MoCA score had no relationship with the above parameters (Figure 3).
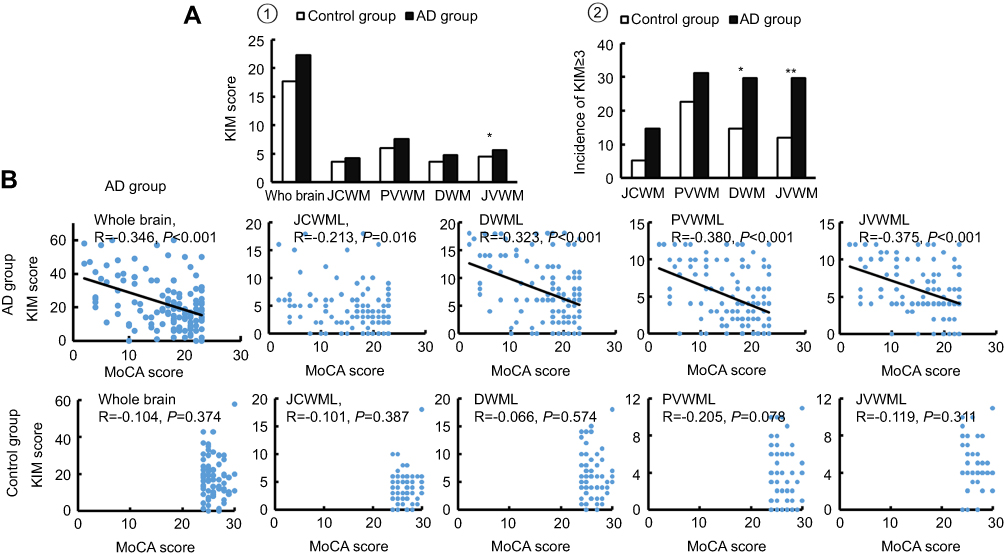 |
Figure 3 KIM score of different regions and their correlation with MoCA score. (A) KIM scores in the AD group and control group. (1) The non-parametric test for KIM scores between AD group and control group. The KIM score of JVWML was significantly different between two groups (P<0.05) while there was no marked difference in the KIM score of other regions between two groups. 2) Severe WMLs in AD group and control group. AD group had a higher prevalence of severe PVWML and JVWML. (B) Correlation between KIM score and MoCA score in the AD group and control group. For WML of different regions, there was no relationship between KIM score of JCWMLs and MoCA score; the KIM scores of DWMLs, PVWMLs and JVWMLs were negatively related to the MoCA score in the AD group, but this was not found in the control group. *P<0.05, **P<0.01. Abbreviations: KIM total, KIM total score; JCWML, juxtacortical white matter lesion; PVWML, periventricular white matter lesion; DWML, deep white matter lesion; JVWML, juxtaventricular white matter lesion; AD, Alzheimer’s disease. |
CBF and its relationships with KIM scores of WML
Compared with the control group, the total CBF and regional CBF in the AD group reduced to different extents. Significant differences were observed between two groups in the total CBF (26.98±10.48 vs 31.10±9.48, P=0.007), JVWM CBF (26.12±10.70 vs 30.70±9.05, P=0.001), PVWM CBF (21.52±8.86 vs24.70±8.18, P=0.012), DWM CBF (23.22±9.55 vs 26.71±8.58, P=0.010) and JCWM CBF (37.07±15.47 vs 42.29±13.13, P=0.011). Correlation analysis showed that there were negative correlations of KIM scores of JVWML and PVWML with the corresponding CBF in the AD group (r=−0.308 and −0.219, P<0.05), but CBF of the whole brain and of DWM or JCWM had no relationship with the KIM score of WML (P>0.05). In the control group, there was no significant correlation between CBF and KIM score (Figure 4).
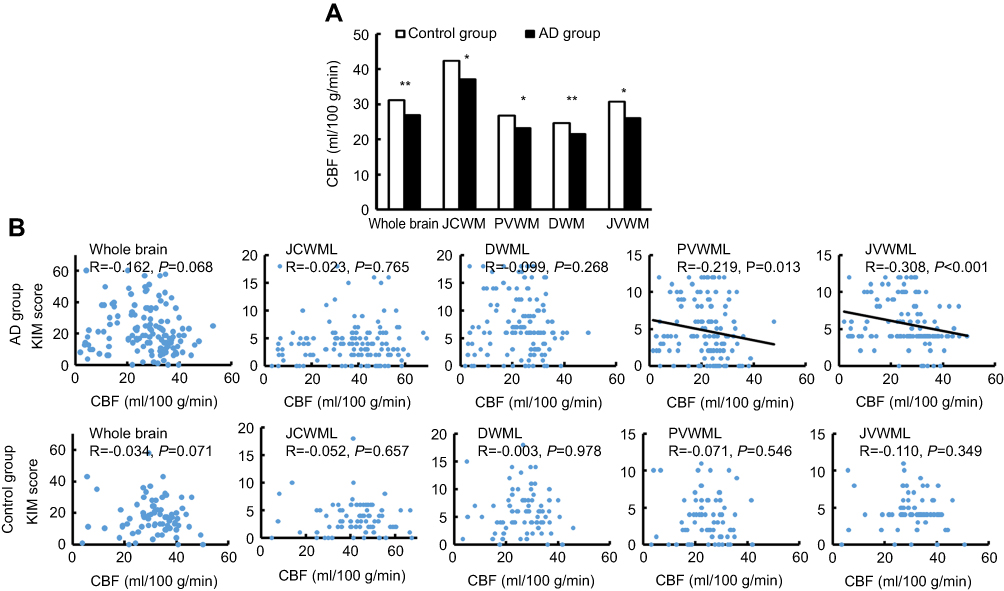 |
Figure 4 CBF and its correlation with KIM scores of WML. (A) CBF in the AD group and control group. *P<0.05, **P<0.01. Compared with the control group, the total CBF and regional CBF in the AD group reduced, and the mean CBF of the whole brain (26.98±10.48 vs 31.10±9.48, P=0.007), JVWM (26.12±10.70 vs 30.70±9.05, P=0.001), PVWM (21.52±8.86 vs 24.70±8.18, P=0.012), DWM (23.22±9.55 vs 26.71±8.58, P=0.010) and JCWM (37.07±15.47 vs 42.29±13.13, P=0.011) were significantly different between the two groups. (B) Correlation between CBF at different regions and KIM score. JVWMLs and PVWMLs (r=−0.308 and −0.219, P<0.05) had close relationships with corresponding CBF in the AD group, while the KIM scores of JCWMLs and DWMLs had no relationships with the CBF of corresponding brain regions. The relationship between KIM score and CBF at different regions was not observed in the control group. Abbreviations: Whole (brain), the whole brain; JCWM, juxtacortical white matter; PVWM, periventricular white matter; DWM, deep white matter; JVWM, juxtaventricular white matter; CBF, cerebral blood flow; AD, Alzheimer’s disease. |
Correlation between CBF and MoCA score
In the AD group, there was a positive correlation between CBF of the whole brain and total MoCA score (r=0.207, P=0.035). In addition, the CBF of the JVWM, PVWM and DWM was also positively related to the MoCA scores (r =0.236, 0.215 and 0.244, respectively, P<0.05), while there was no significant correlation between CBF of JCWM and MoCA score (P>0.05). In the control group, there was no relationship between CBF and KIM score (Figure 5).
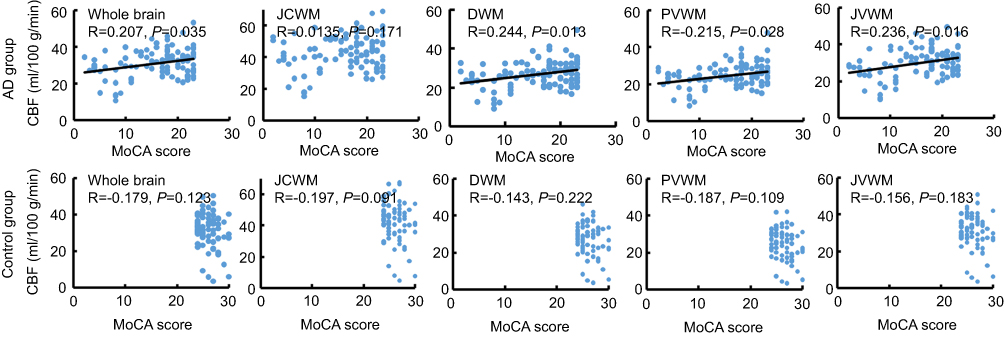 |
Figure 5 Correlation between CBF and MoCA score in the AD and control group. In the AD group, the CBF of the whole brain, DWM, PVWM and JVWM showed a positive relationship with the MoCA score (r=0.184, 0.141 and 0.155, P<0.05) while the CBF of JCWM had no relationship with MoCA score. There was no close correlation between CBF at different regions and MoCA score in the control group. Abbreviations: JCWM, juxtacortical white matter; PVWM, periventricular white matter; DWM, deep white matter; JVWM, juxtaventricular white matter; CBF, cerebral blood flow; AD, Alzheimer’s disease. |
Discussion
The white matter hyperintensity has been considered as the imaging marker of cerebrovascular disease and it is closely related to the occurrence of cerebrovascular disease and cognitive impairment.1,3–5,25 Studies have proposed that the cerebral cortex and neurons are the main targets affected by the AD. However, some studies have revealed that the prevalence of WML is as high as 28.9–100% in the AD patients.26,27 In recent years, the relationship between white matter hyperintensity and cognitive impairment in AD patients has attracted increasing attention of clinicians. However, few studies have focused on the characteristics of WML in AD patients, and there is no conclusion about the effects of white matter hyperintensity at different regions of the brain on the cognitive function in AD patients. It is also unclear whether there is a relationship between cerebral-reduced perfusion and white matter hyperintensity in AD patients. In the present study, KIM classification system was employed to assess WMLs including JVWML, PVWML, DWML and JCWML, and the characteristics of WMLs and the CBF of the corresponding regions were further explored in AD patients. Moreover, the relationships among WMLs, CBF and cognitive function were also evaluated in these patients as compared to controls.
Although a variety of studies on white matter hyperintensity have been conducted to investigate the relationship between WML and cognitive dysfunction in patients with cerebrovascular diseases,15–18 the findings are still conflicting. Some studies have suggested that PVWML is more related to cognitive function,15,16 and others indicate DWML is more associated with cognitive impairment.17,18 This discrepancy may be ascribed to some factors, among which the difference in the WML classification is an important one. In most of the studies, the Fazekas19 method was used to classify WML into PVWML and DWML, which is simple and practical, but has some disadvantages. For example, it is a general classification of WML because the nerve fibers at different regions receive different blood supplies and have distinct functions. It is imperative to develop a more practical tool for the clinical assessment of WML. At present, KIM20 classification is the most suitable one for this purpose. The KIM system divides WML into four types in terms of the location of the lesion and the artery responsible for the blood supply. Vascular risk factors also play an important role in the pathogenesis of AD.28 Therefore, it is necessary to explore the characteristics of WMLs at different regions based on the above classification. To our knowledge, this study for the first time classified the WML in AD patients according to the KIM system.
Our study showed that the total KIM score and KIM score of each region (JCWML, PVWML, DWML and JVWML) were comparable between AD group and control group. This suggests that the load of WMLs at different regions is comparable in controls and AD patients. Of note, the prevalence of severe WML at JVWML and PVWML in the AD group was significantly higher than in the control group. This indicates the JVWM and PVWM are more susceptible to severe damage in AD patients. Correlation analysis showed the higher the KIM score of PVWML, DWML and JVWML, the lower the MoCA score is. This indicates the higher the load of WML, the poorer the cognitive function is in AD patients. However, this was not found in the JCWML. These findings suggest the WMLs at PVWML, DWML and JVWML are related to the cognitive impairment in AD patients, but the JCWML has no relationship with the cognitive impairment. At present, there is no enough evidence supporting that the white matter fibers at different regions are involved in the composition of cerebral association fibers (callosum), junction fibers (arcuate fiber, uncinate fasciculus, cingulum fasciculus, etc.) and projection fibers. There is a white matter fiber connection among the cortical areas associated with cognitive function. When these fibers are damaged, the transfer of cognitive information will be influenced. The JVWML, PVWML and DWML may affect specific acetylcholine conductive pathways at certain regions of the brain, resulting in abnormal information transmission and finally the cognitive impairment.12,29 The JCWM is mainly composed of arcuate fibers and functions to connect the neurons in adjacent brain regions or different neurons in the same brain region. The functional impairment secondary to this short fiber damage depends on the local cortical function. For example, the motor dysfunction is secondary to the damage to the connected fiber in the motor cortex.30 Thus, the white matter damage in this region has little influence on the global cognitive function.
Clinical and animal studies have confirmed that AD and WMLs are associated with cerebral-reduced perfusion.1–5 However, few clinical studies focus on the WMLs at different brain regions and corresponding CBF in AD patients. In this study, KIM scoring system was used to investigate the CBF in 4 brain regions. Our study showed that the total CBF and regional CBF in the AD group reduced to different extents as compared to control group, suggesting that AD patients are more prone to reduced perfusion, which was consistent with previous findings.2,31,32 In most studies, reduced perfusion is mainly found in local areas such as the parietal and temporal lobes,33–36 and little is known about the CBF of WM in AD patients. In a study with small sample size,37 MR perfusion imaging technique was used for the assessment of CBF, and results showed the CBF of the PVWM reduced in asymptomatic WMLs patients as compared to normal controls, but further correlation analysis was not performed. In addition, some studies38,39 employ SPECT to investigate the CBF and WML in AD patients and asymptomatic old patients, and results showed the WMH regions were more prone to reduced perfusion, but the classification of WMLs and correlation analysis were not done in these studies.
Although the CBF of all the regions in the AD group was lower than in the control group, only PVWML and JVWML had relationship with corresponding reduced perfusion, and there was no association of DWML and JCWML with reduced perfusion. Thus, we speculate that the WMLs at different regions may depend on some factors such as the distribution of blood vessels and their permeability. Reduced perfusion may cause blood-brain barrier damage, plasma protein leakage and myelin sheath edema or demyelination, all of which may result in JVWML.40,41 The PVWM represents the border zone of ventricular and cortical blood supply; blood vessels in the regions have sparse connection with the superficial blood vessels of the brain; the collateral circulation is poor and thus this region is particularly sensitive to the reduction of CBF. However, the DWM is supplied by the medullary arteries arising from the cortical branches of middle cerebral arteries; the JCWM has dual blood supply systems including the long perforating branch nutrient arteries supplying the white matter and the short perforating branch nutrient arteries supplying the cortex, and thus it is relatively tolerant to the reduction of CBF.20
In addition, our study showed a positive correlation between CBF of the whole brain and total MoCA score in AD patients. A positive correlation was also found between the CBF of JVWM, PVWM and DWM and the MoCA score, but this was not noted between CBF of JCWML and MoCA. These results suggest that brain-reduced perfusion has a certain correlation with the overall cognition decline in AD patients, which was consistent with previously reported.42 Moreover, the reduced perfusion of JVWM, PVWM and DWM had a close relationship with the global cognitive impairment. Of note, the regions with reduced perfusion corresponded to those with lesions found above.
Based on these findings, we speculate that the cognitive impairment in AD patients is associated with the damage to the white matter pathway due to reduced perfusion (especially at PVWML and JVWML), which affects the information transmission and finally the cognitive function.
Conclusion
Cerebral reduced perfusion and white matter hyperintensity are involved in the occurrence and development of cognitive impairment in AD patients. The JVWM and PVWM are more susceptible to injury in AD patients and the JVWMLs and PVWMLs are closely related to the global cognitive impairment. The reduced perfusion at these regions may be important causes of white matter hyperintensity and cognitive impairment.
One limitation of this study was that visual scoring scale was used for the assessment of WMLs. In addition, this study was only a single-center cross-sectional study with small sample size, and the causal relationship among WML, CBF and cognitive impairment in AD patients cannot be determined. Thus, more longitudinal cohort studies with large sample size are needed to confirm our findings.
Acknowledgment
This work was supported by the National Key R&D Program of China (2018YFC1314700), the National Science Foundation of China (No. 81671307) and the Priority of Shanghai Key Discipline of Medicine (2017ZZ02020).
Disclosure
The authors report no conflicts of interest in this work.
References
1. Kitamura A, Saito S, Maki T, et al. Gradual cerebral hypoperfusion in spontaneously hypertensive rats induces slowly evolving white matter abnormalities and impairs working memory. J Cereb Blood Flow Metab. 2016;36:9. doi:10.1177/0271678X15606717
2. Lacalle-Aurioles M, Navas-Sanchez FJ, Aleman-Gomez Y, et al. The disconnection hypothesis in Alzheimer’s disease studied through multimodal magnetic resonance imaging: structural, perfusion, and diffusion tensor imaging. J Alzheimers Dis Rep. 2016;50(4):1051–1064. doi:10.3233/JAD-150288
3. Prins ND, van Dijk EJ, den Heijer T, et al. Cerebral white matter lesions and the risk of dementia. Arch Neurol. 2004;61(10):1531–1534. doi:10.1001/archneur.61.10.1531
4. Yoshita M, Fletcher E, Harvey D, et al. Extent and distribution of white matter hyperintensities in normal aging, MCI, and AD. Neurology. 2006;67(12):2192–2198. doi:10.1212/01.wnl.0000249119.95747.1f
5. Zupan M. Pathogenesis of Leukoaraiosis: A Review. 2016.
6. Benedictus MR, van Harten AC, Leeuwis AE, et al. White matter hyperintensities relate to clinical progression in subjective cognitive decline. Stroke. 2015;46(9):2661–2664. doi:10.1161/STROKEAHA.115.009475
7. Boyle PA, Yu L, Fleischman DA, et al. White matter hyperintensities, incident mild cognitive impairment, and cognitive decline in old age. Ann Clin Transl Neurol. 2016;3(10):791–800. doi:10.1002/acn3.343
8. Kloppenborg RP, Nederkoorn PJ, Geerlings MI, van den Berg E. Presence and progression of white matter hyperintensities and cognition: a meta-analysis. Neurology. 2014;82(23):2127–2138. doi:10.1212/WNL.0000000000000505
9. Tosto G, Zimmerman ME, Carmichael OT, Brickman AM. Predicting aggressive decline in mild cognitive impairment: the importance of white matter hyperintensities. JAMA Neurol. 2014;71(7):872–877. doi:10.1001/jamaneurol.2014.667
10. van den Berg E, Geerlings MI, Biessels GJ, Nederkoorn PJ, Kloppenborg RP. White matter hyperintensities and cognition in mild cognitive impairment and Alzheimer’s disease: a domain-specific meta-analysis. J Alzheimers Dis Rep. 2018;63(2):515–527. doi:10.3233/JAD-170573
11. Debette S, Markus HS. The clinical importance of white matter hyperintensities on brain magnetic resonance imaging: systematic review and meta-analysis. BMJ. 2010;341:c3666. doi:10.1136/bmj.c3666
12. Richter N, Michel A, Onur OA, et al. White matter lesions and the cholinergic deficit in aging and mild cognitive impairment. Neurobiol Aging. 2017;53:27–35. doi:10.1016/j.neurobiolaging.2017.01.012
13. van Straaten EC, Harvey D, Scheltens P, et al. Periventricular white matter hyperintensities increase the likelihood of progression from amnestic mild cognitive impairment to dementia. J Neurol. 2008;255(9):1302–1308. doi:10.1007/s00415-008-0874-y
14. Bracco L, Piccini C, Moretti M, et al. Alzheimer’s disease: role of size and location of white matter changes in determining cognitive deficits. Dement Geriatr Cogn Disord. 2005;20(6):358–366. doi:10.1159/000088562
15. De Groot JC, De Leeuw FE, Oudkerk M, et al. Periventricular cerebral white matter lesions predict rate of cognitive decline. Ann Neurol. 2002;52(3):335–341. doi:10.1002/ana.10294
16. Feng L, Ye N, Wang JF, Wang SN, Zhang YM. The relationship of white matter lesions location and cognitive function in leukoaraisosis patients. Chin J Behav Med Brain Sci. 2018;27(1):26–30.
17. Silbert LC, Nelson C, Howieson DB, Moore MM, Kaye JA. Impact of white matter hyperintensity volume progression on rate of cognitive and motor decline. Neurology. 2008;71(2):108–113. doi:10.1212/01.wnl.0000316799.86917.37
18. Soriano-Raya JJ, Miralbell J, Lopez-Cancio E, et al. Deep versus periventricular white matter lesions and cognitive function in a community sample of middle-aged participants. J Int Neuropsychol Soc. 2012;18(5):874–885. doi:10.1017/S1355617712000677
19. Fazekas F, Chawluk JB, Alavi A, Hurtig HI, Zimmerman RA. MR signal abnormalities at 1.5 T in Alzheimer’s dementia and normal aging. AJR Am J Roentgenol. 1987;149(2):351–356. doi:10.2214/ajr.149.2.351
20. Kim KW, MacFall JR, Payne ME. Classification of white matter lesions on magnetic resonance imaging in elderly persons. Biol Psychiatry. 2008;64(4):273–280. doi:10.1016/j.biopsych.2008.03.024
21. Gao J, Cheung RT, Chan YS, Chu LW, Mak HK, Lee TM. The relevance of short-range fibers to cognitive efficiency and brain activation in aging and dementia. PLoS One. 2014;9(4):e90307. doi:10.1371/journal.pone.0090307
22. Dadar M, Maranzano J, Ducharme S, Collins DL. White matter in different regions evolves differently during progression to dementia. Neurobiol Aging. 2019;76:71–79. doi:10.1016/j.neurobiolaging.2018.12.004
23. McKhann GM, Knopman DS, Chertkow H, et al. The diagnosis of dementia due to Alzheimer’s disease: recommendations from the National Institute on Aging–Alzheimer’s Association Workgroups on diagnostic guidelines for Alzheimer’s disease. Alzheimers Dement. 2011;7(3):263–269. doi:10.1016/j.jalz.2011.03.005
24. Wu O, Ostergaard L, Weisskoff RM, Benner T, Rosen BR, Sorensen AG. Tracer arrival timing-insensitive technique for estimating flow in MR perfusion-weighted imaging using singular value decomposition with a block-circulant deconvolution matrix. Magn Reson Med. 2003;50(1):164–174. doi:10.1002/mrm.10522
25. Staals J, Booth T, Morris Z, et al. Total MRI load of cerebral small vessel disease and cognitive ability in older people. Neurobiol Aging. 2015;36(10):2806–2811. doi:10.1016/j.neurobiolaging.2015.06.024
26. de la Torre JC. Alzheimer’s disease is a vasocognopathy: a new term to describe its nature. Neurol Res. 2004;26(5):517–524. doi:10.1179/016164104225016254
27. Moran C, Phan TG, Srikanth VK. Cerebral small vessel disease: a review of clinical, radiological, and histopathological phenotypes. Int J Stroke. 2012;7(1):36–46. doi:10.1111/j.1747-4949.2011.00725.x
28. Breteler MM. Vascular risk factors for Alzheimer’s disease: an epidemiologic perspective. Neurobiol Aging. 2000;21(2):153–160.
29. Chubykin AA, Roach EB, Bear MF, Shuler MG. A cholinergic mechanism for reward timing within primary visual cortex. Neuron. 2013;77(4):723–735. doi:10.1016/j.neuron.2012.12.039
30. de Groot JC, de Leeuw FE, Oudkerk M, Hofman A, Jolles J, Breteler MM. Cerebral white matter lesions and subjective cognitive dysfunction: the Rotterdam scan study. Neurology. 2001;56(11):1539–1545. doi:10.1212/wnl.56.11.1539
31. Dickstein DL, Walsh J, Brautigam H, Stockton SD
32. Mazza M, Marano G, Traversi G, Bria P, Mazza S. Primary cerebral blood flow deficiency and Alzheimer’s disease: shadows and lights. J Alzheimers Dis Rep. 2011;23(3):375–389. doi:10.3233/JAD-2010-090700
33. Lee YC, Liu RS, Liao YC, et al. Statistical parametric mapping of brain SPECT perfusion abnormalities in patients with Alzheimer’s disease. Eur Neurol. 2003;49(3):142–145. doi:10.1159/000069086
34. Ma HR, Pan PL, Sheng LQ, et al. Aberrant pattern of regional cerebral blood flow in Alzheimer’s disease: a voxel-wise meta-analysis of arterial spin labeling MR imaging studies. Oncotarget. 2017;8(54):93196–93208. doi:10.18632/oncotarget.21475
35. Nitrini R, Buchpiguel CA, Caramelli P, et al. SPECT in Alzheimer’s disease: features associated with bilateral parietotemporal hypoperfusion. Acta Neurol Scand. 2000;101(3):172–176.
36. Zhang N, Gordon ML, Goldberg TE. Cerebral blood flow measured by arterial spin labeling MRI at resting state in normal aging and Alzheimer’s disease. Neurosci Biobehav Rev. 2017;72:168–175. doi:10.1016/j.neubiorev.2016.11.023
37. OSullivan M, Lythgoe DJ, Pereira AC, et al. Patterns of cerebral blood flow reduction in patients with ischemic leukoaraiosis. Neurology. 2002;59(3):321–326. doi:10.1212/wnl.59.3.321
38. Holland CM, Smith EE, Csapo I, et al. Spatial distribution of white-matter hyperintensities in Alzheimer disease, cerebral amyloid angiopathy, and healthy aging. Stroke. 2008;39(4):1127–1133. doi:10.1161/STROKEAHA.107.497438
39. Makedonov I, Black SE, MacIntosh BJ. Cerebral small vessel disease in aging and Alzheimer’s disease: a comparative study using MRI and SPECT. Eur J Neurol. 2013;20(2):243–250. doi:10.1111/j.1468-1331.2012.03785.x
40. Bridges LR, Andoh J, Lawrence AJ, et al. Blood-brain barrier dysfunction and cerebral small vessel disease (arteriolosclerosis) in brains of older people. J Neuropathol Exp Neurol. 2014;73(11):1026–1033. doi:10.1097/NEN.0000000000000124
41. Huang J, Li J, Feng C, et al. Blood-brain barrier damage as the starting point of leukoaraiosis caused by cerebral chronic hypoperfusion and its involved mechanisms: effect of agrin and aquaporin-4. Biomed Res Int. 2018;2018:2321797. doi:10.1155/2018/2321797
42. Austin BP, Nair VA, Meier TB, et al. Effects of hypoperfusion in Alzheimer’s disease. J Alzheimers Dis Rep. 2011;26(Suppl 3):123–133. doi:10.3233/JAD-2011-0010
 © 2019 The Author(s). This work is published and licensed by Dove Medical Press Limited. The full terms of this license are available at https://www.dovepress.com/terms.php and incorporate the Creative Commons Attribution - Non Commercial (unported, v3.0) License.
By accessing the work you hereby accept the Terms. Non-commercial uses of the work are permitted without any further permission from Dove Medical Press Limited, provided the work is properly attributed. For permission for commercial use of this work, please see paragraphs 4.2 and 5 of our Terms.
© 2019 The Author(s). This work is published and licensed by Dove Medical Press Limited. The full terms of this license are available at https://www.dovepress.com/terms.php and incorporate the Creative Commons Attribution - Non Commercial (unported, v3.0) License.
By accessing the work you hereby accept the Terms. Non-commercial uses of the work are permitted without any further permission from Dove Medical Press Limited, provided the work is properly attributed. For permission for commercial use of this work, please see paragraphs 4.2 and 5 of our Terms.