")
Back to Journals » OncoTargets and Therapy » Volume 11
Analysis of change in microRNA expression profiles of lung cancer A549 cells treated with Radix tetrastigma hemsleyani flavonoids
Authors Liu P , Yang X, Zhang H, Pu J, Wei K
Received 1 February 2018
Accepted for publication 9 May 2018
Published 24 July 2018 Volume 2018:11 Pages 4283—4300
DOI https://doi.org/10.2147/OTT.S164276
Checked for plagiarism Yes
Review by Single anonymous peer review
Peer reviewer comments 4
Editor who approved publication: Dr Carlos E Vigil
Peigang Liu, Xu Yang, Hongjian Zhang, Jinbao Pu, Kemin Wei
Center for Medicinal Resources Research, Zhejiang Academy of Traditional Chinese Medicine, Hangzhou 310007, People’s Republic of China
Background: The aim of this study was to determine the inhibition effects of Radix tetrastigma hemsleyani (RTH) flavonoids on human lung adenocarcinoma A549 cells and the underlying molecular mechanism. RTH is an important Chinese traditional herb that has been widely used in cancer therapy. As an important type of active substance, RTH flavones (RTHF) have been shown to have good antiproliferative effects on various cancer cells. MicroRNAs (miRNAs) are small, noncoding RNA molecules that play important roles in cancer progression and prevention. However, the miRNA profile of RTHF-treated A549 cells has not yet been studied.
Materials and methods: The miRNA expression profile changes of A549 cell treated with RTHF were determined using the miRNA-seq analysis. Furthermore, Gene Ontology (GO) and Kyoto Encyclopedia of Genes and Genomes (KEGG) enrichment analyses of differentially expressed miRNAs′ (DE-miRNAs) target genes were carried out.
Results: In this study, we identified 162 miRNAs that displayed expression changes >1.2-fold in RTHF-treated A549 cells. GO analysis results showed that target genes of DE-miRNAs were significantly enriched in protein binding, binding, cell, cell part, intracellular, cellular process, single-organism process, and single-organism cellular process. Pathway analysis illustrated that target genes of DE-miRNAs are mainly involved in endocytosis, axon guidance, lysosome, melanogenesis, and acute myeloid leukemia pathway.
Conclusion: These results may assist in the better understanding of the anticancer effects of RTHF in A549 cells.
Keywords: miRNA expression, lung cancer, flavonoids, Radix tetrastigma hemsleyani
Introduction
Radix tetrastigma hemsleyani (RTH) is an important traditional Chinese herb that has detoxification, anti-inflammation, antivirus, and anticancer bioactivities and has a long history of use for the treatment of several diseases, such as infantile hyperpyretic convulsion, dysentery, bronchial pneumonia, pneumonia, venomous snake bite, and traumatic injuries.1 At the end of the 20th century, with the discovery of its effectiveness related to the suppression of various cancers, RTH was gradually widely used (combine with other Chinese herbs) in the clinical treatment of cancer patients after chemotherapy.2
Chinese herbal medicine is rich in many nutrients, trace elements, and active substances, and these active substances are the main foundation for disease treatment.3 Further analysis showed that RTH is rich in flavonoids, polysaccharides, triterpenes, steroids, and total polyphenols and it has been proved that flavonoids extracted from RTH (RTHF) can inhibit cell proliferation and induce apoptosis in various cancers both in vitro and in vivo, such as lung cancer, gastric cancer (GC), liver cancer, colon cancer, breast cancer, and lymphoma.4,5 The anticancer molecular mechanisms of RTHF have also been investigated in vitro and in vivo. Researches mainly focus on expression levels of some foregone factors related to cancer inhibition, including Caspase-3, Caspase-9, Bax, BcL-2, Bcl-XL, p-p38, p-ERK, p-JNK, TNF-α, INF-γ, vascular endothelial growth factor (VEGF), and Notch1.5,6 However, the mechanism underlying RTHF anticancer activity remains unclear.
Lung cancer is the most frequently diagnosed cancer among men, is the leading cause of cancer deaths, and is also the second leading cause of cancer deaths among women worldwide.7 Researchers reported that a number of Chinese herbs and their active ingredients are effective to inhibit cancer. To date, there also have been several studies about RTFH-mediated inhibition of cancer cells, particularly regarding the human non-small-cell lung carcinoma cell line A549. The results showed that RTHF had good inhibition effects on A549 cells, as it could inhibit cell growth, migration, and invasion and induce cell apoptosis.8,9 In addition, research on the mechanism underlying RTHF-mediated inhibition of A549 cells has been under taken on several common cancer-inhibiting factors present in RTHF, but the inhibitory mechanisms of RTHF remain unclear.
MicroRNAs (miRNAs) are small, noncoding RNA molecules that are known to be important regulators of almost all cellular signaling pathways including normal cell development and disease development.10 RNA sequencing (RNA-seq) is a next-generation sequencing (NGS) method for the analysis of differential gene expression.11 Using machine-learning algorithms, it is possible to improve the interpretation of the functional significance of miRNA in the analysis of RNA-seq data.
The mechanisms of RTHF-mediated inhibition of lung cancer are unclear, which has limited its clinical application, and no research has focused on the miRNA expression profiles associated with RTHF-mediated inhibition of lung cancer. In this study, the mechanisms of RTHF-mediated inhibition of lung cancer A549 cells were analyzed at the miRNA level by miRNA-seq analysis. Of note, the significance of this study is to help understand how miRNA regulates RTHF-mediated inhibition of lung cancer A549 cells.
Materials and methods
Plant material and extraction
RTH was a triennial artificial plant and obtained from Zhejiang Dou Dou Bao Traditional Chinese Medicine Research Co., Ltd. (Taizhou, People’s Republic of China), which was authenticated by JP (Zhejiang Academy of Traditional Chinese Medicine, Hangzhou, People’s Republic of China). RTHF was extracted from RTH using a reflux ethanol method after drying it using a vacuum freezing technique and then purified using a macroporous resin method at the Center for Medicinal Resources Research, Zhejiang Academy of Traditional Chinese Medicine, and 4.72 mg of RTHF samples were isolated from 1 g of RTH. The RTH and RTHF samples were stored at the Zhejiang Academy of Traditional Chinese Medicine. The A549 cell line was purchased from the Shanghai Institute of Biochemistry and Cell Biology, Chinese Academy of Sciences (Beijing, People’s Republic of China).
Cell culture and cell treatment
A549 cells were cultured in Roswell Park Memorial Institute (RPMI) (Hyclone, Logan, UT, USA) supplemented with 10% fetal bovine serum (Logan) in a humidified incubator containing 5% CO2 in air at 37°C, and subculture was carried out with 0.25% trypsin–0.02% ethylene diamine tetraacetic acid (EDTA) (Logan). The RTHF was dissolved in phosphate-buffered saline (PBS) and adjusted to a final concentration of 10 mg/mL.
First, A549 cells (1×10⁵ cells/mL) were treated with various concentrations of RTHF (0–64 μg/mL) for different time points (24, 48, and 72 h). The A549 cells were then treated with 3 μg/mL of RTHF for 48 h. All the cell samples were then harvested, fixed in 70% ethanol (Merck KGaA, Darmstadt, Germany) and stored at −20°C for 24 h until further analysis. Next, the cells were washed twice with ice-cold PBS and then incubated with RNase and propidium iodide (PI) (Sigma-Aldrich Co., St Louis, MO, USA) for 30 min.
The PI-stained cells were excited at a wavelength of 488 nm and emitted a maximum wavelength of 617 nm. Acquisition of 10,000 events was chosen to measure the distribution of cells in the different cell cycle phases using a Coulter XL Flow Cytometer (Beckman Coulter Inc, Brea, CA, USA). The distribution of cells in the different cell cycle phases shown in the DNA histograms was analyzed using the Becton Dickinson Cell Fit Software (BD, Franklin Lakes, NJ, USA).
RNA isolation and quality assessment
Total RNA was extracted from two A549 cell samples: after treatment with 3 μg/mL of RTHF for 48 h and before treatment using the TRIzol reagent (Thermo Fisher Scientific, Waltham, MA, USA). For each cell sample, three biological replicates were prepared. RNA degradation and contamination were monitored both on 1% agarose gels and by using an Agilent 2100 Bioanalyzer (Agilent Technologies, Santa Clara, CA, USA). The RNA purity was evaluated by the optical density (OD) of 260/280 ratio using a NanoDrop 2000 (Thermo Fisher Scientific). The RNA concentration was measured using a Qubit RNA Assay Kit in an Invitrogen Qubit Spectrophotometer (Thermo Fisher Scientific). The RNA integrity was assessed using the RNA Nano 6000 Assay Kit of the Agilent 2100 Bioanalyzer system.
Small RNA library construction and high-throughput sequencing
A total of 2 μg of RNA/sample was used as input material for the miRNA library. The miRNA sequencing libraries were generated using a TruSeq Small RNA Sample Preparation Kit (Illumina, Inc., San Diego, CA, USA), and index codes were added to attribute sequences to each sample. Briefly, an RNA 3′ adaptor was added to the total RNA and the mixture was incubated at 70°C for 2 min to break the RNA secondary structure and then immediately placed on ice. Then, RNA 3′ adaptor was specifically ligated to 3′ end of miRNA with T4 RNA Ligase 2 and T4 Rnl2 truncated at 28°C for 1 h. After the 3′ ligation reaction, the ligated fragment was ligated to an RNA 5′ adapter using T4RNA ligase at 28°C for 1 h. The first strand cDNA was then synthesized using SuperScript IV (SS IV) according to the manufacturer’ s instructions. Polymerase chain reaction (PCR) amplification was performed using 5× Phusion HF buffer, RNA PCR Primer (RP1), RNA PCR Primer Index (RPLX) primer, dNTP, and Phusion DNA polymerase.
The PCR products were purified on a 6% polyacrylamide gel. RNA fragments corresponding to 140–160 bp (the length of small noncoding RNA with the 3′ and 5′ adaptors) were recovered and dissolved in 8 μL of elution buffers. Finally, the library concentration was measured using a Qubit Spectrophotometer and the library quality was assessed using the Agilent 2100 Bioanalyzer system with a High Sensitivity DNA Kit (Agilent Technologies). The clustering of the index-coded samples was performed on an Illumina cBot cluster station using a TruSeq PE Cluster Kit v3-cBot-HS (Illumina) according to the manufacturer’s instructions. After cluster generation, the library preparations were sequenced on an Illumina HiSeq 2000 platform and 50 bp of single-end reads were generated for transcriptome analysis.
Known miRNAs’ expression profile generation, normalization, and clustering
The known mature miRNA expression profile was generated by using the quantifier module of the miRDeep2 package, which gives read counts for the known miRNAs. The raw reads’ expression profiles generated for all the replicates of the samples were subjected to trimmed mean of M-values’ (TMM) normalization using the Bioconductor package edgeR. The normalized expression profiles for all the replicates of all the samples were then subjected to hierarchical clustering and principal component analysis (PCA) clustering for quality control purpose and for finding the similarity among the samples.
The libraries were deeply sequenced using the Illumina HiSeq platform. The quality of the samples, experiment, and the analysis data were completed by the Genesky Biotechnologies Inc. (Shanghai, People’s Republic of China).
Novel miRNA prediction pipeline
The unannotated sequences left after the elimination pipeline were used for the prediction of the novel miRNA. For this purpose, the unannotated sequence files of the replicates of a particular tissue were combined and first mapped to the human genome using the mapper.pl module, and they were then subjected to the miRDeep2.pl module to obtain the novel miRNAs.
Quantification of miRNA expression levels and differentially expressed miRNA (DE-miRNA) analysis
The number of reads mapped to each miRNA was normalized with HTSeq v0.6.1. The expected number of fragments per kilobase of transcript sequence per millions base pairs sequenced (FPKM) of each miRNA was then calculated based on the length of the gene and the read count mapped to the miRNA. The FPKM, which reflects both the effect of sequencing depth and gene length for the read count, is a commonly used method for estimating miRNA expression levels. DE-miRNA analysis was performed using the DESeq2 R package. DESeq provides statistical routines for determining differential expression based on digital miRNA expression data using a model based on the negative binomial distribution. The resulting P-values were adjusted using the Benjamini and Hochberg approach for controlling the false discovery rate (FDR). miRNAs with an adjusted P-value of <0.05 (FDR <0.05) by DESeq and with a fold change of ≥2 (|log2 fold change| ≥1) after RTHF treatment were considered to be differentially expressed.
DE-miRNA target gene prediction
The potential target genes of all the known dysregulated miRNAs were predicted by two different algorithms, such as RNAhybrid and miRanda, and only the miRNA target genes identified by both algorithms were considered.
Validation of miRNAs’ expression using quantitative real-time PCR (qRT-PCR)
miRNA-specific primers were designed using the Primer 5.0 Software (Premier Biosoft International, Palo Alto, CA, USA), and U6 snRNA (U6) was used as the internal control. qRT-PCR was performed with the miRNA qPCR Assay Kits (ComWin Biotech Co., Ltd, Beijing, People’s Republic of China), and all the primers used for qRT-PCR are detailed in Table 1. The cycling conditions were as follows: 10 min at 95°C, followed by 40 cycles of 95°C for 15 s and 60°C for 1 min. The samples subjected to qRT-PCR were run in three biological replicates. The fold change of miRNA expression was calculated using the 2−ΔΔCT algorithm. The relative expression of miRNAs was normalized to the value at the time point with the lowest expression.
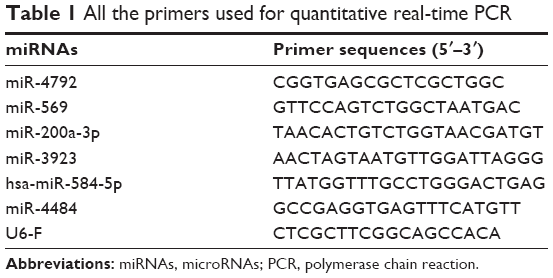 | Table 1 All the primers used for quantitative real-time PCR |
GO and Kyoto Encyclopedia of Genes and Genomes (KEGG) enrichment analyses of target genes
For GO mapping, the GO terms for DE-miRNA target genes based on homologies were extracted (GO; http://www.geneontology.org). The GO enrichment analysis of DE-miRNA target genes was implemented using the GOseq R package, which corrected for miRNA length bias. GO terms with corrected P-values <0.05 were considered to be significantly enriched. REVIGO was used for the analysis of the enriched GO terms (http://revigo.irb.hr/); this program removes redundant GO terms and attempts to reflect the similarity of given terms based on semantic space 34. The GO Biological Process (BP) category terms with the lowest P-values for enrichment in both the up- and downregulated miRNA in the RTH-treated A549 cells were analyzed by REVIGO.
KEGG pathways for the DE-miRNA target genes were retrieved form KEGG database (http://www.genome.jp/kegg/), and the KOBAS software was used to test the statistical significance of the enrichment of DE-miRNAs target genes in KEGG pathways. A pathway with an FDR of <0.05 was defined as an enrichment pathway.
Results
Main component of RTHF and substance structure
The RTHF used in this study was extracted from RTH using a reflux ethanol method and then purified using a macroporous resin method. After chemical composition analysis by high-performance liquid chromatography (HPLC)–mass spectrometry (MS) and HPLC–MS/MS, we found that the RTHF used in this study mainly include six foregone active substances, including kaempferol (286.24 kDa), kaempferol-3-O-neohesperidoside (594.24 kDa), malvidin-3-glucoside (528.92 kDa), myricitrin (464.38 kDa), baohuosid I (514.53 kDa), and isoschaftoside (564.94 kDa) and the chemical structures of these six active substances isolated from RTHF are showed in Figure 1.
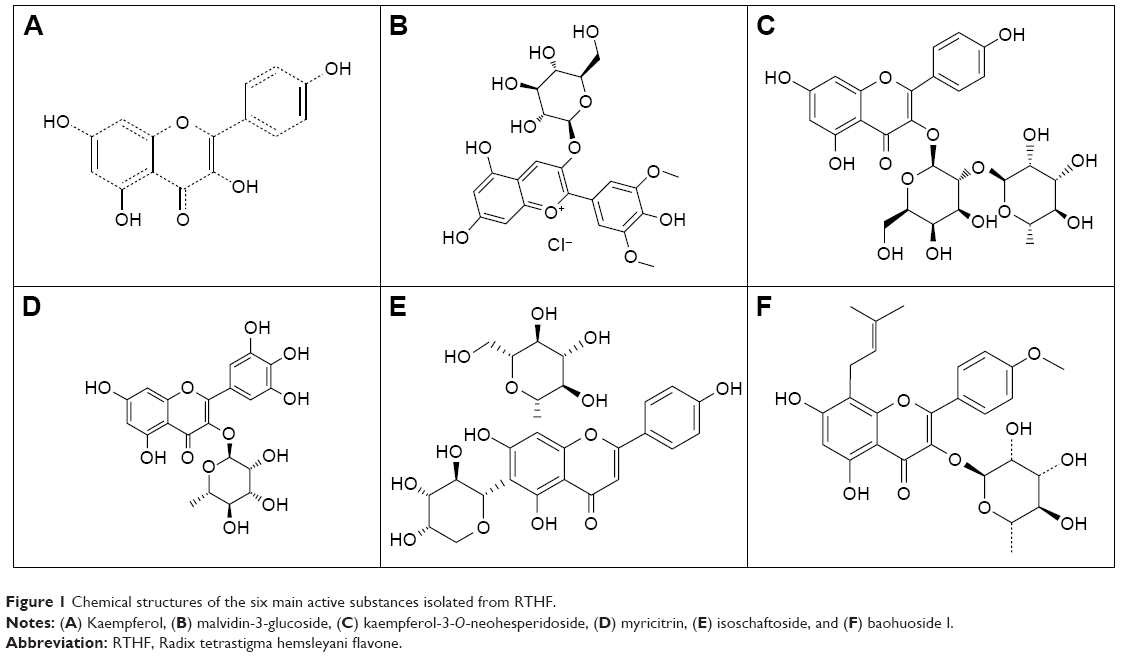 | Figure 1 Chemical structures of the six main active substances isolated from RTHF. |
Effects of RTHF on proliferation inhibition, invasion inhibition, and cell cycle arrest, apoptosis, and Ca2+ regulation in A549 cells
The proliferation rates of A549 cells after incubation with varying concentrations of RTHF and at different incubation times are shown in Figure 2A; the cell proliferation rate of A549 was decreased with an increase in the concentration of RTHF and treatment times. The results revealed that RTHF dramatically decreased cell proliferation in a dose-dependent manner and a time-dependent manner. Moreover, relevant morphological changes in A549 cells after treatment were noted at 48 h. As shown in Figure 2B and C, A549 cell morphology changed slowly after treatment with RTHF; in response to treatment, the A549 cells became elongated, exhibited and extended protrusions and change in cells’ morphology became more extensive with increasing concentration of RTHF.
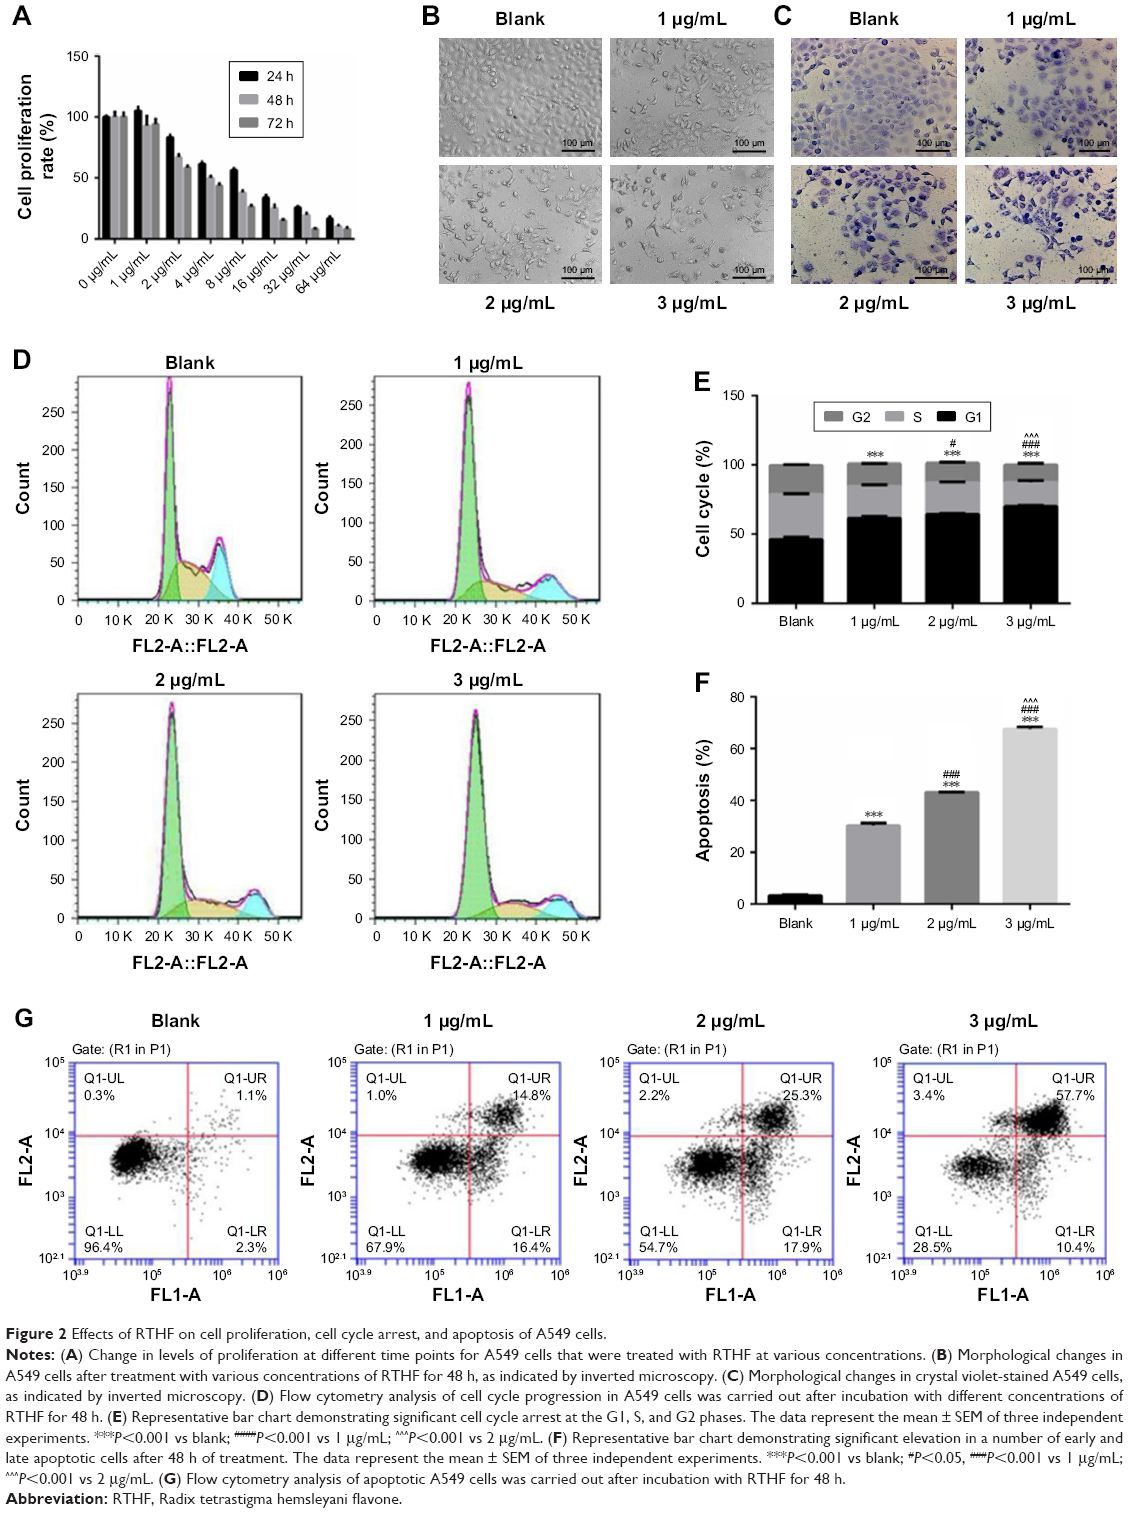 | Figure 2 Effects of RTHF on cell proliferation, cell cycle arrest, and apoptosis of A549 cells. |
The induction of cell cycle arrest in cancer cells is considered to be a crucial cancer treatment strategy. As shown in Figure 2D and E, it is very clear that with an increase in the concentration of RTHF, RTHF-treated A549 cells showed a marked decrease in G1/S phase and G2/M phase and they had a modest but a significant increase in G0/G1 phase. The results demonstrated that RTHF can induce G0/G1 phase cell cycle arrest in the A549 cells at different concentrations and it can arrest cell cycle progression at the G0/G1 phase of A549 cells in a concentration-dependent manner.
Flow cytometry analysis of stained cells can distinguish the cells into four categories, namely viable (Annexin-V negative and PI negative), early apoptosis (Annexin-V positive and PI negative), late apoptosis (Annexin-V positive and PI positive), and necrotic (Annexin-V negative and PI positive) cells (Figure 2G). As illustrated in Figure 2F and G, we found that early apoptotic, late apoptotic, and necrotic populations increased significantly with increasing the concentration of RTHF and early apoptotic cells increase first and then decrease, while late apoptotic and necrotic cells continue to increase. When 3 μg/mL of RTHF was used, the early and late apoptotic (combined) populations reached to 68.1%, with the late apoptotic populations peaking at 57.7%. The cell count results showed that RTHF can induce the apoptosis of A549 cells in a concentration-dependent manner.
Transwell assays were performed to determine the inhibition effects of RTHF on the invasion ability of A549 cells. As shown in Figure 3A and B, the invasive ability of A549 cells decreased significantly with the RTHF concentration and compared with the control group, when the concentration of RTHF to was 2 and 3 μg/mL, the inhibition of the invasive ability of A549 cells showed significant differences. These results demonstrated that RTHF could inhibit the invasive ability of the A549 cells in vitro in a dose-dependent manner.
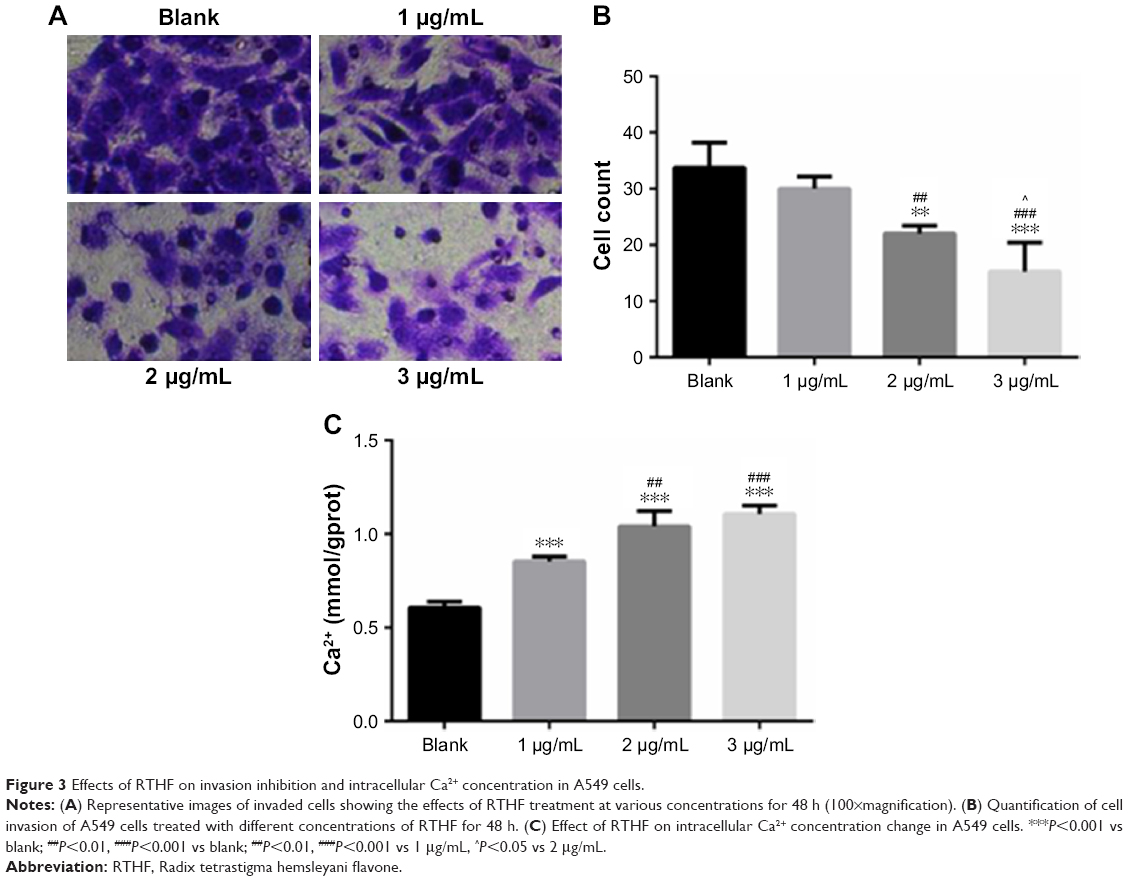 | Figure 3 Effects of RTHF on invasion inhibition and intracellular Ca2+ concentration in A549 cells. |
As an important secondary messenger for signal transduction, intracellular calcium concentration plays an important role in cell activities and it is regulated by release from endoplasmic reticulum stores or influx via various Ca2+ ion channels. The change in intracellular Ca2+ concentration in A549 cells was analyzed. As is clear from Figure 3C, compared with those in the control group, intracellular Ca2+ concentration of A549 cells increased significantly after treatment with RTHF and it is also found that cell intracellular Ca2+ concentration increased due to treatment with RTHF in a dose-dependent manner. This result illustrated that RTHF can upregulate the intracellular Ca2+ concentration in A549 cells by regulating Ca2+ ion channels of A549 cells to play a role in cell proliferation inhibition, cell cycle arrest, invasive inhibition, and apoptosis induction.
Analysis of DE-miRNAs
After investigating changes in miRNA expression profile using miRNA-seq techniques, we identified 162 miRNAs i A549 cells that displayed >1.2-fold i after treatment with 3 μg/mL of RTHF for 48 h. Among the 162 DE-miRNAs, 99 were known and 63 were novel. Among the 99 known DE-miRNAs, 45 were upregulated and 54 were downregulated, while 45 were upregulated and 18 were downregulated among the novel DE-miRNAs. The data on expression level, fold changes, sequences, and type of the known miRNAs are not shown in text and are shown on a web site (https://wenku.baidu.com/user/mydocs) to download free. miRNA family classification of the known DE-miRNAs was carried out using the web-based computational software TargetScan, and the classification results of the known DE-miRNAs are not shown in text and are shown on a web site (https://wenku.baidu.com/user/mydocs) to download it free.
Based on the negative binomial distribution, volcano plots were separately generated to show the expression levels of the known DE-miRNAs (Figure 4A) and novel DE-miRNAs (Figure 4C) and the result revealed that there were more upregulated miRNAs than downregulated miRNAs in the novel DE-miRNA group. Hierarchical cluster analysis was used to investigate the correlations between DE-miRNAs of two cell samples, and heatmaps of the known and novel DE-miRNAs are shown in Figure 4B and D, respectively. The results also showed that there were more upregulated miRNAs in the novel DE-miRNA groups than in the known DE-miRNA groups.
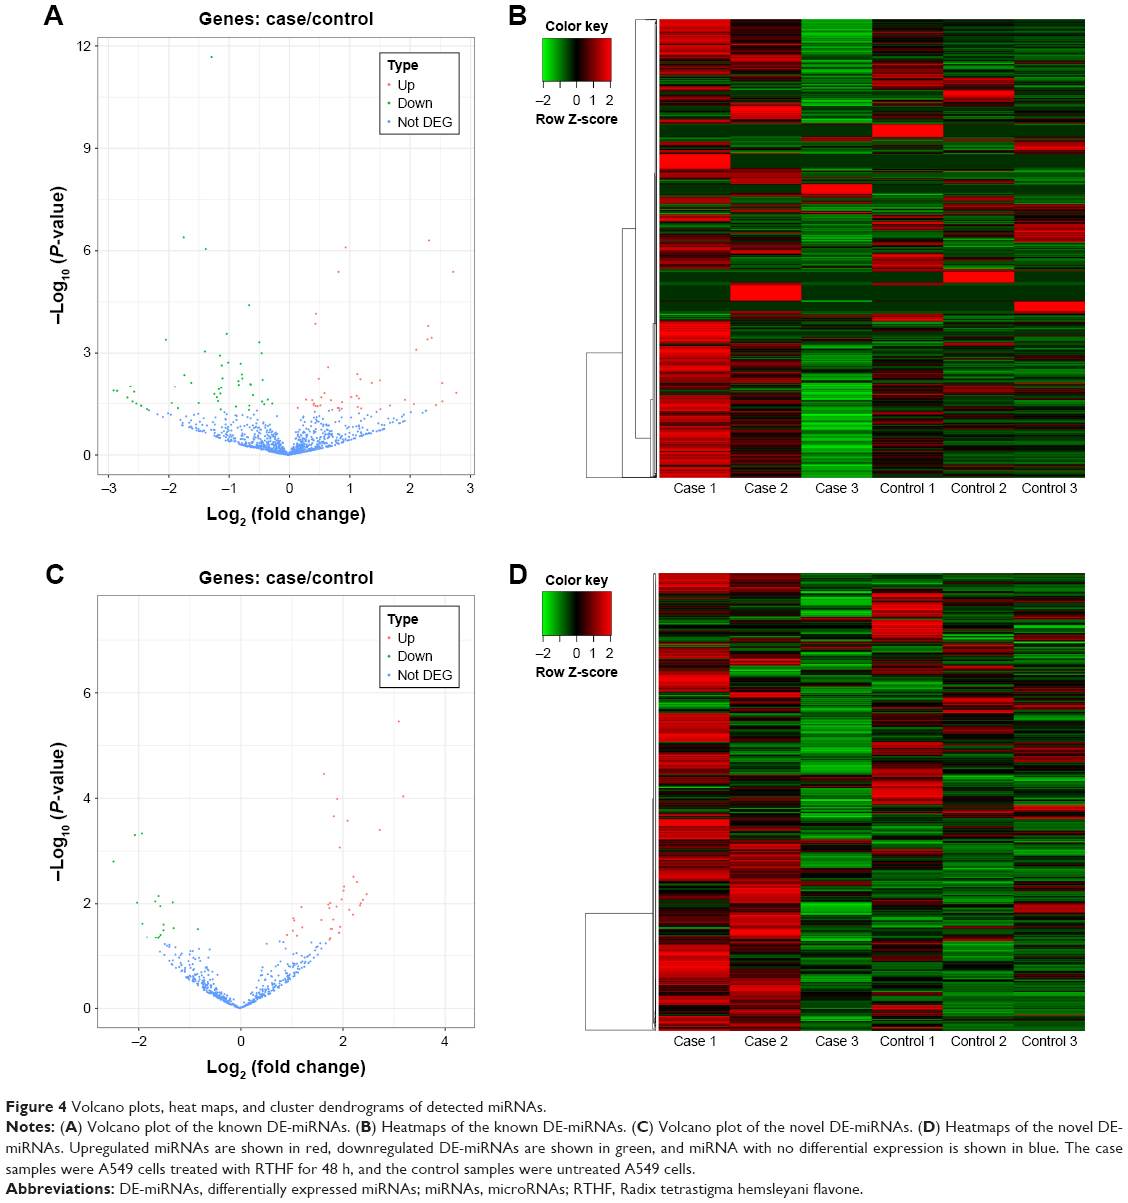 | Figure 4 Volcano plots, heat maps, and cluster dendrograms of detected miRNAs. |
Known DE-miRNA target gene prediction
miRNAs predominantly regulate the post-transcriptional stages of gene expression by interacting with multiple sequence-specific target. The potential target genes of the dysregulated miRNAs in this study were predicted by two algorithms, such as RNAhybrid and miRanda, and only the miRNA target genes identified by both algorithms were considered. Finally, a total of 9,982 transcripts of 89 known DE-miRNAs and 5,526 target genes were predicted. Detailed information on the target genes of the known DE-miRNAs is not shown in text and is shown on a web site (https://wenku.baidu.com/user/mydocs) to download it free.
Gene Ontology (GO) enrichment analysis of DE-miRNAs’ target genes
The distribution of the candidate DE-miRNAs target genes in the GO analysis clarified the main differences between A549 cells treated with RTHF and untreated controls. The results of the GO analysis of the DE-miRNAs target genes are shown in Figure 5A. The significantly enriched GO terms were mainly distributed in the Cellular Component (CC) and BP categories. In addition, a directed acyclic graph (DAG) was used to further display the detailed relationships of the enriched GO terms, with deeper color indicating more enrichment in the DAG dates. The GO enrichment information on the DE-miRNAs target genes is not shown in text and is shown on a web site (https://wenku.baidu.com/user/mydocs) to download it free.
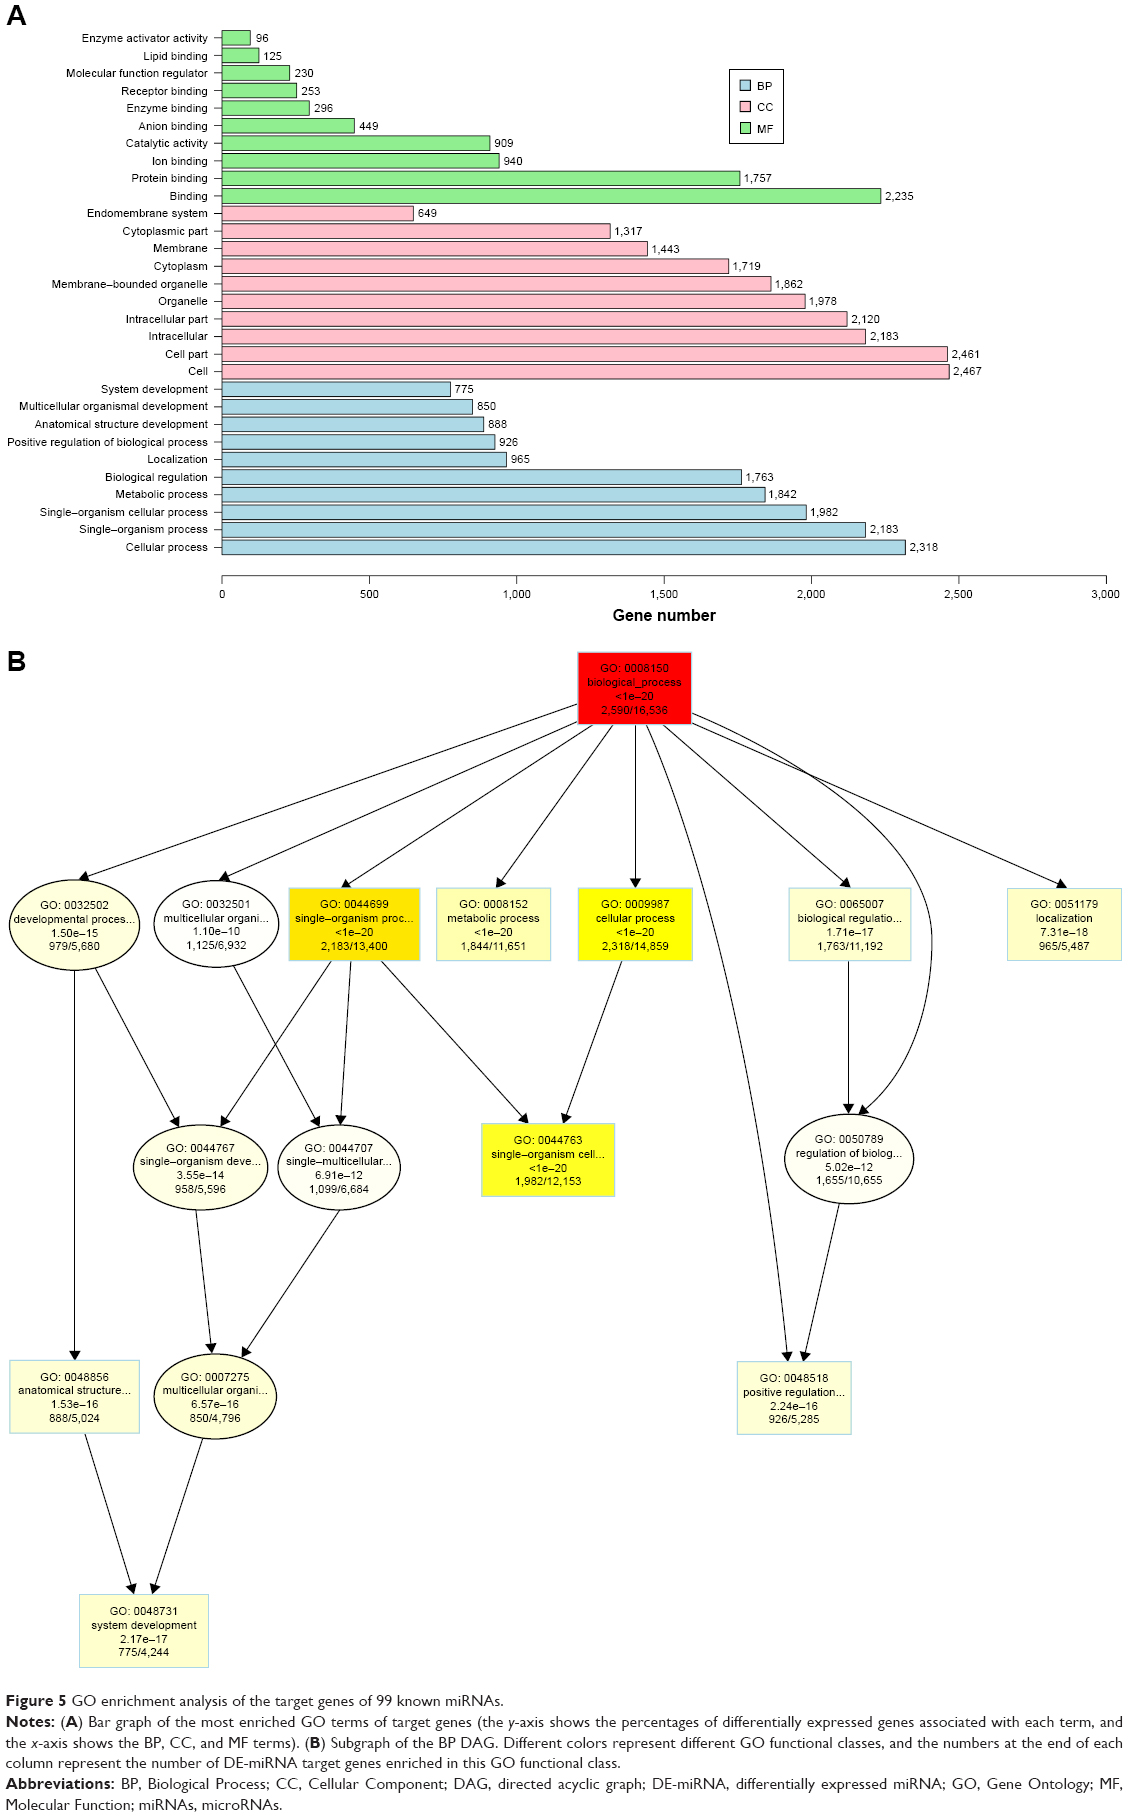 | Figure 5 GO enrichment analysis of the target genes of 99 known miRNAs. |
The target genes enriched in the BP category mainly involved the following terms: cellular process, single-organism process, single-organism cellular process metabolic process, metabolic process, and biological regulation. In the CCs, the main differences involved the following terms: cell, cell part, intracellular, intracellular part, organelle, membrane-bounded organelle, cytoplasm, and membrane. In the Molecular Function, the main difference involved the following terms: binding, protein binding, and ion protein binding. Figure 5B shows the BP DAG.
KEGG pathway enrichment analysis of DE-miRNA target genes
KEGG is the main database of pathway for understanding the high-level functions and utilities of biological system. In this study, KEGG pathway enrichment analyses were used to elucidate the biological pathways involved in the RTHF-treated inhibition of A549 cells. The KEGG pathway enrichment analyses showed that, in this study, 16 pathways changed significantly (P<0.05) after RTHF treatment. The top 10 statistically significant pathways are shown in Figure 6, and data on all the enrichment pathways are not shown in text and are shown on a web site (https://wenku.baidu.com/user/mydocs) to downloads it free.
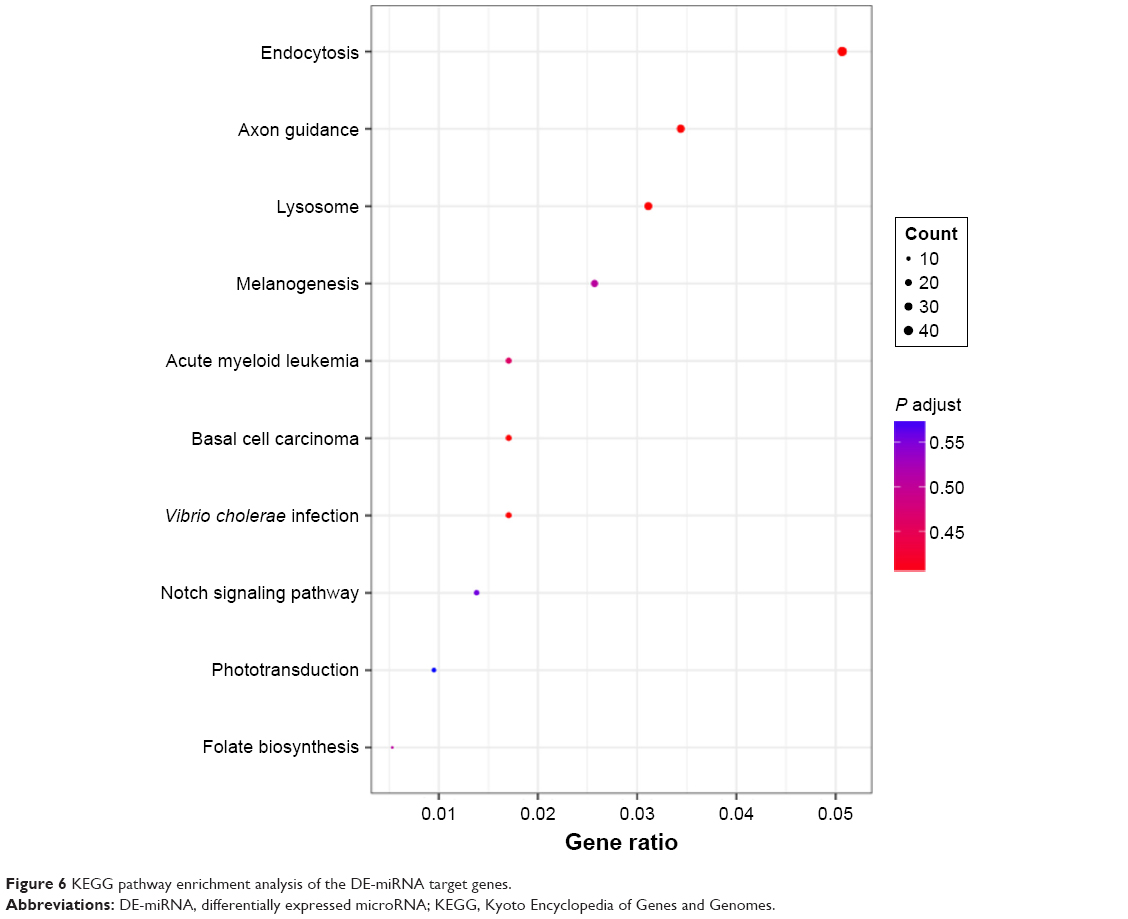 | Figure 6 KEGG pathway enrichment analysis of the DE-miRNA target genes. |
Among these statistically significant enrichment pathways, some have previously been found to be involved in multiple cancer cell processes, such as proliferation, invasion, tumor growth, and metastasis. As the most significantly enrichment pathway in this study, endocytosis is one such physiological process that is modified during cancer, as alterations to the endocytic pathway have been shown to occur during cancer by multiple stduies.12,13 The Notch signaling pathway has been found to play key roles in cell growth, migration, invasion, metastasis, and angiogenesis in various types of cancers,14,15 and numerous studies have indicated that activation of the mitogen-activated protein kinase (MAPK) signaling pathway can result in a multitude of physiological effects on cancer cells, including apoptosis, cell proliferation, mitosis, and the transcription of several classes of genes. The lysosomes pathway was found to participate in cancer cell apoptosis, which can be activated by death receptors, lipid mediators, and photo damage.16,17 Fructose and mannose metabolisms were also an important cancer-related pathways and were previously found to be upregulated in many cancer cells in several studies, such as breast, lung, and ovarian cancer cells.18–20 Axon guidance pathway genes has been found to have aberrations in pancreatic cancer, neuroblastoma (NB), breast cancer, lung cancer, prostate cancers, melanoma, and leukemia.21–23 Four important enrichment signaling pathways and their DE-miRNA target genes are shown in Figure 7.
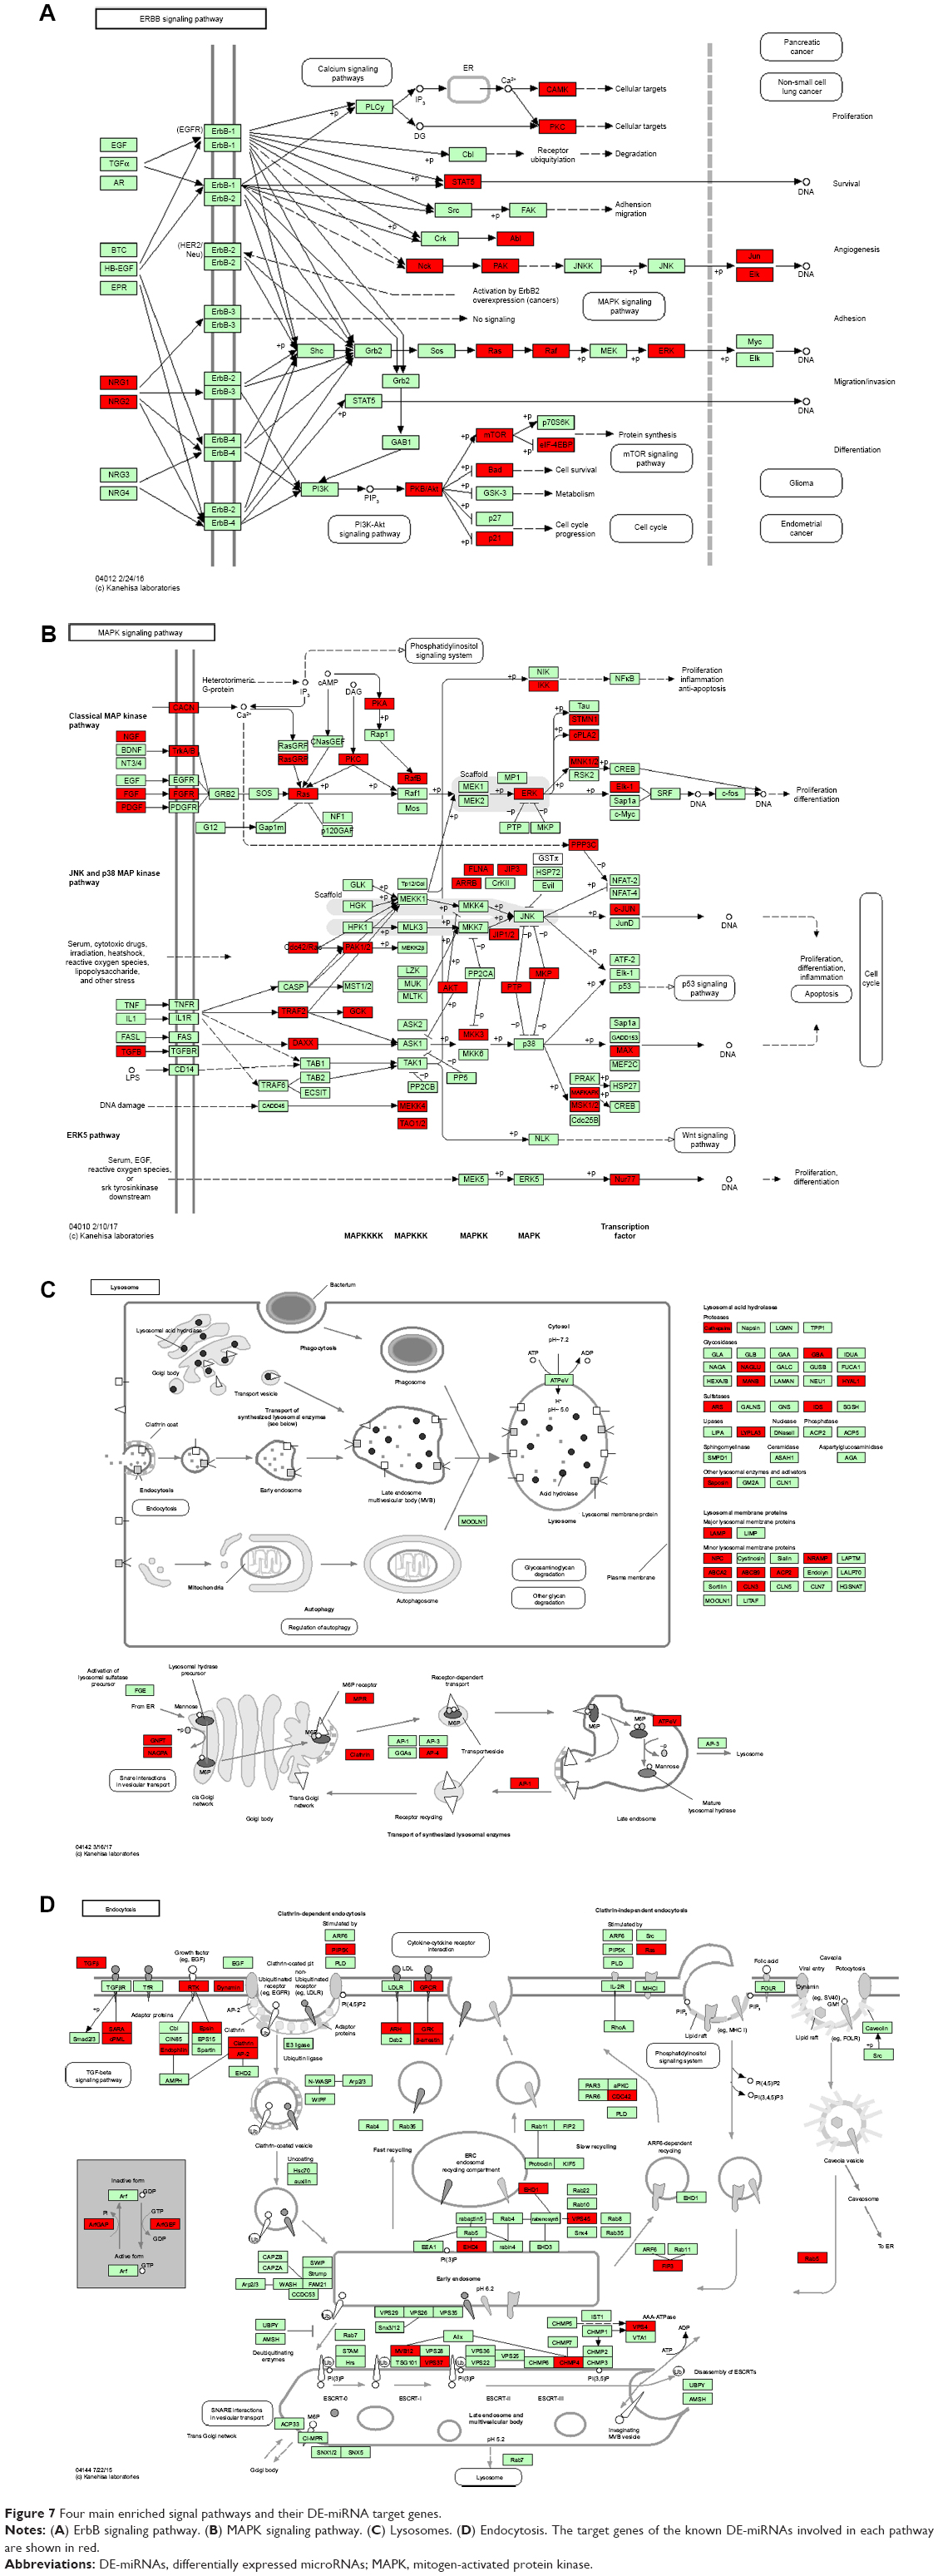 | Figure 7 Four main enriched signal pathways and their DE-miRNA target genes. |
qRT-PCR validation of significant DE-miRNAs
The expression profiles of six key DE-miRNAs were further validated using qRT-PCR, and a comparison of the six miRNA-seq and qRT-PCR results regarding the six miRNAs’ expression levels is shown in Figure 8. The qRT-PCR results revealed that most of these six miRNAs shared similar expression tendencies as shown by the miRNA-seq results (reads per kilobase million [RPKM]/reads-based expression values).
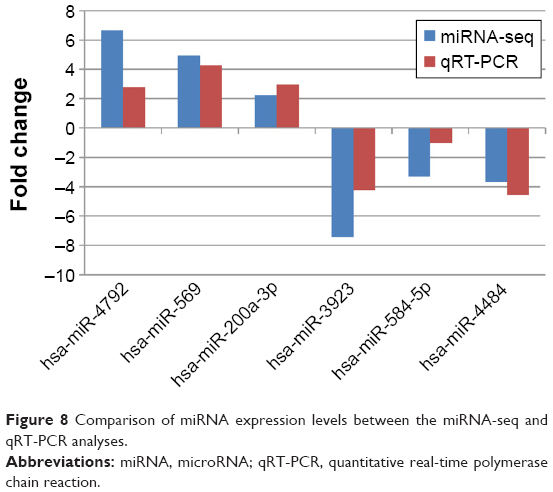 | Figure 8 Comparison of miRNA expression levels between the miRNA-seq and qRT-PCR analyses. |
Although there were some quantitative differences between the two analytical methods, the similarities between the RNA-seq and the qRT-PCR results suggest that the RNA-seq data in this study are reproducible and reliable.
Discussion
RTH is an important traditional Chinese anticancer herb, and flavone is an important type of anticancer component of RTH that may play anticancer roles in cancer cells in vitro and in vivo. In this study, we first investigated the mechanism of the RTHF antilung cancer effects on transcriptional level using the miRNA-seq technology. To our knowledge, this is the first study to investigate RTHF-mediated changes in miRNA profiles in the lung cancer cell line A549.
We investigated that the change in A549 cell miRNA expression brought about cancer induction by RTHF treatment after cancer induction. Totally, we isolated 162 miRNAs differentially expressed between untreated and treated A549 cells. The partial of these miRNAs has been identified as being associated with anticancer.
Among the upregulated miRNAs, some were proved to act as tumor suppressor miRNAs by targeting tumor suppressor genes (TSGs) and oncogenes (OGs). The most abundantly expressed known miRNA in RTHF-treated A549 cells was hsa-miR-146a-3p, which belongs to the miR-146a family; this family may inhibit cancer cell proliferation, invasion, and metastasis in some types of human cancers. miR-146a-3p has been reported to lower expression in several cancers and leads to predisposition to their cancers, such as small cell lung cancer, breast cancer, and papillary thyroid carcinoma, and inhibition of miR-146a-3p resulted in the restoration of RARB expression and decreased rates of proliferation of thyroid cancer cells and increased PTTG1 expression promoting bladder cancer migration, invasion, metastasis, and growth.24–26 Upregulation of miR-146a-3p may target some TSGs and inhibit OGs to inhibit the proliferation of A549 cells treated with RTHF. As tumor suppressor miRNA, hsa-miR-4792 downregulated in uterine leiomyoma, breast cancer, and nasopharyngeal carcinoma27–30 was the second most overexpressed miRNA in RTHF-treated A549 cells; it has been reported that overexpression of hsa-miR-4792 can inhibit epithelial–mesenchymal transition and invasion in nasopharyngeal carcinoma by inhibiting FOXC1, which is a critical mediator of EGFR function in human cancer.27 hsa-miR-4792 was most abundantly increased in glioblastoma multiforme (GBM) when GBM cells are exposed to necrotic cells31 and was most abundantly expressed in human adipose mesenchymal stem cell-derived conditioned medium (hAMSC-CM) treatment ovarian cancer cells and may be involved in the inhibitory influence of hAMSC-CM toward ovarian cancer cell.32 In RTHF-treated A549 cells, hsa-miR-4792 may be involved in the inhibition of cell transition and invasion by targeting some proteins, such as FOXC1.
In CHA3 human embryonic stem cells, hsa-miR-7641 was downregulated during the differentiation from human embryonic stem cells to endothelial cells by suppressing CXCL1, which promotes cell growth, colony formation, invasion, and migration in some types of cancers, and was upregulated in hematoporphyrin-induced cell apoptosis in glioma.33 miR-569 expression was consistently decreased in lung cancer cells, and its overexpression prevented cell proliferation and migration and inversely induced cell apoptosis34 and therefore demonstrated that miR-569 plays tumor suppressive role in lung cancer and in RTHF-treated A549 cells.
As a significantly upregulated miRNA in our research, has-miR-144-3p overexpression has been reported to have many functions, such as inducing cell cycle arrest and apoptosis in pancreatic cancer cells by targeting proline-rich protein 11 (PRR11) expression via the MAPK signaling pathway,35 suppressing cell migration, invasion, and proliferation of GC by inhibiting epithelial-mesenchymal transition (EMT) through targeting PBX3 and proliferation and migration of colorectal cancer cells through GSPT1,36 affecting radiotherapy sensitivity by promoting the proliferation, migration, and invasion of breast cancer cells,37 and reducing tumor cell proliferation and metastasis by targeting the MAP3K8 pathway in renal cell carcinoma.38
In CAL27 squamous cell carcinoma cells, ectopic expression of has-miR-483-3p was found to have a marked inhibitory effect and the ability to potentiate drug-induced apoptosis.39 It has also been found that miR-483-3p is overexpressed in Wilms’ tumors, colon cancer, breast cancer, and liver cancer. This miRNA could function as an antiapoptotic OG in various human cancers, and its upregulation could contribute to endothelial progenitor cells’ dysfunction in deep vein thrombosis patients by targeting serum response factor (SRF).40 has-miR-100 re-sensitizes resistant cisplatin-epithelial ovarian cancer to cisplatin probably by inhibiting cell proliferation, inducing apoptosis, arresting the cell cycle, and targeting the downregulation of mammalian target of rapamycin (mTOR) and polo-like kinase 1 (PLK1) expressions,41,42 and its overexpression can reduce the migration and invasion in A549 cells by targeting insulin-like growth factor 2 (IGF2), which stimulates cancer cell proliferation in an autocrine manner.43
There is growing evidence to suggest that miR-200 miRNAs are involved in cancer metastasis,44 and two members of them were found upregulated in our research, namely, miR-200a-3p and miR-200b-3p. miR-200a-3p has been found to be downregulated in human papillary thyroid carcinoma,45 and miRNA-200a-3p can suppress tumor proliferation and induce apoptosis by targeting sperm-associated antigen 9 (SPAG9) in renal cell carcinoma.46 In our study, has-miR-200a-3p was upregulated in A549 cells after treatment with RTHF and we believe that this phenomenon may be related to A549 cells’ proliferation suppression and apoptosis induction of A549 cells. miR-200b-3p suggested an indirect effect of miR-200b-3p on tissue inhibitor of metalloproteinase 4 (TIMP4), via negative regulators of TIMP4 expression in prostate cancer cells.47
has-miR-199a-5p has been reported to play an important role in the regulation of cellular processes in various cancer cells by targeting several genes. It has been found that it can regulate cell proliferation and survival by targeting frizzled class receptor 7 (FZD7) in hepatocellular carcinoma48 and β1 integrin through Ets-1 to suppress invasion in breast cancer.49 has-miR-410-3p acts as an OG or a tumor suppressor gene in various types of cancer. Zhang et al observed that overexpression of miR-410-3p can reduce cell growth, colony formation, and the number of 5-ethynyl-2′-deoxyuridine (EdU)-positive cells in MDA-MB-231 cells.50 Rak et al found that a reduced level of miR-410 in endometrial cancer corresponded to an increased expression of matrix metalloproteinase 14 (MMP14) and matrix metalloproteinase 16 (MMP16), which have been shown to promote cancer progression via various mechanisms.51,52 The increase in has-miR-410-3p in RTHF-treated A549 cells may play a role in A549 cell inhibition by downregulating the expression of MMP14 and MMP16.
Downregulation of has-miR-381 has been found to suppress the proliferation of oral squamous cell carcinoma cells by directly targeting fibroblast growth factor receptor 2 (FGFR2) and inhibit GC metastasis by targeting transmembrane protein 16A (TMEM16A) expression, has-miR-381 has been found to be significantly downregulated in human lung adenocarcinomas, and its overexpression can induce reduced inhibitor of differentiation-1 (ID1) expression and significantly decreased cell migration and invasion,53–55 suggesting that has-miR-381 may have potential roles as a tumor suppressor miRNA in RTHF-treated A549 cells.
has-miR-4532 was previously found to be mostly downregulated in esophageal squamous cell carcinoma,56 and it was previously found to be upregulated in xanthohumol-induced glioma cell and maybe involved in cell apoptotic death; therefore, we guessed that has-miR-4532 plays a role in cell apoptotic death in RTHF-treated A549 cells.57
The let-7 family is one of the earliest identified miRNA families, with significantly reduced expression in a large number of malignant tumors and the ability to attenuate lung cancer development.58,59 Two members of the let-7 family were found to be upregulated in RTHF-treated A549 cells, namely, hsa-miR-98-3p and hsa-let-7i-3p. hsa-let-7i was defined as associated with CRC metastasis by targeting eight genes.60 In addition, we found that most of the downregulated miRNA in RTHF-treated A549 cells have been shown to be overexpressed in some types of cancers. However, most of their roles in cancer have not yet been investigated and only a few of them have been reported to be associated with cancer inhibition.
miR-4484 was found to be significantly upregulated in breast cancer and cervical squamous cell carcinomas, and the expression of it is positively correlated with the proliferation of HT29 cells.61,62 Eukaryotic initiation factor 4E (EIF4E) was identified as a target of miR-4484, and previous study suggested that EIF4E silencing could reduce the invasiveness and metastatic capability of breast cancer cells.63 Therefore, downregulation of miR-4484 in RTHF-treated A549 cell may target some genes’ silencing for reducing the invasiveness and metastatic capability of A549 cells, such as EIF4E. It was found that miR-556-5p was overexpressed in patients with pulmonary diseases and expressed in metastatic melanoma and absent in nonmetastatic melanoma.64,65 A previous study showed that upregulation of miR-556-5p could promote prostate cancer cell proliferation by suppressing the expression of protein phosphatase 2 regulatory subunit 2A (PPP2R2A).66 Downregulation of miR-556-5p may be involved in the cancer cell proliferation and invasion inhibition of RTHF-treated A549 cells.
Previous studies found that miR-1303 was significantly overexpressed in GC cells and downregulation of it can inhibit proliferation, migration, and invasion of GC cells by targeting claudin-18 (CLDN18),67 and another study also suggested that miR-1303 promotes NB proliferation by targeting glycogen synthase kinase 3 beta (GSK3β) and secreted frizzled-related protein 1 (SFRP1);68 therefore, downregulation of miR-1303 in RTHF-treated A549 cells may play role in inhibiting the proliferation, migration, and invasion of cells by targeting some proteins, such as CLDN18, GSK3β, and SFRP1.
has-miR-573 has been recognized as a potential player in breast cancer susceptibility gene (BRCA)-related breast cancer angiogenesis, and it has a role in controlling BRCA 1/2-related angiogenesis by targeting key regulators of focal adhesion (FA), VEGF, and hypoxia inducible factor-1 (HIF-1) signaling pathways.69 The miR-92b family has been found to play a critical role in tumorigenesis by regulating the expression of its target genes. The inhibition of miR-92b has been found to suppress cells’ growth and motility by targeting reversion-inducing cysteine-rich protein with Kazal motifs (RECK) in non-small-cell lung cancer58 and it has been found to promote glioma cells’ (U251 and U87 cell) apoptosis by targeting dickkopf-related protein 3 (DKK3) and blocking the Wnt/beta-catenin signaling pathway in gliomas.70,71 miR-92b was also found to promote esophageal cancer metastasis by targeting Integrin a6.72 In our miRNA data, two members of miR-92b family, namely hsa-miR-92b-5p and hsa-miR-92b-3p, were upregulated in RTHF-treated A549 cells.
In our study, a significant 2.5-fold decrease in hsa-miR-516a-5p was observed in RTHF-treated A549 cells and it was previously found to be downregulated by more than threefold in A549 cells after ionizing radiation60 and by more than threefold in A549 cells treated with suberoylanilide hydroxamic acid (SAHA), which is a histone deacetylase inhibitor (HDACI) with antitumor effects.73,74
Watahiki et al observed that hsa-miR-1255a was overexpressed in metastatic prostate cancer compared to that in non-metastatic prostate cancer and maybe related to cancer metastasis and it was found to be upregulated in lung cancer patients.75,76 Therefore, we expect that the downregulation of hsa-miR-1255a in the RTHF-treated A549 cells may be related to the inhibition of lung cancer invasion.
Liao et al77 reported that overexpression of hsa-miR-760 can promote proliferation in ovarian cancer cells by the downregulation of PH domain leucine-rich repeat-containing protein phosphatase (PHLPP2) expression, and it has been also found that hsa-miR-760 was downregulated in A549 cells treated with resveratrol, which exhibits antitumor properties in several cancer types.78 It was significantly downregulated in chemo-resistance breast cancer tissues compared to chemo-sensitive tissues and plays a key role in drug resistance of breast cancer by targeting rho-related GTP-binding protein (RHOB), ANGOTL4, and ATP-binding cassette transporter (ABCA1).79 Therefore, downregulation of hsa-miR-760 in RTHF-treated A549 cells may be by decreasing the drug resistance of cells involved in the inhibition of cells’ proliferation by some target genes, such as PHLPP2, RHOB, ANGOTL4, and ABCA1.
hsa-miR-4717-3p has been found to be significantly overexpressed in early-stage nasopharyngeal carcinoma,80 while it has been found to be downregulated in metastatic colorectal cancer patients treated with bevacizumab in combination with folinic acid, fluorouracil, and oxaliplatin (FOLFOX),81 and it was also decreased in zinc depletion-induced apoptotic breast cancer MDA-MB-231 cells.82 hsa-miR-937-5p was downregulated in our RTHF-treated A549 cells, and it has been observed to be highly expressed in paclitaxel-resistant A549 cells.83
hsa-miR-1915-3p has been found to be downregulated in U87-MG glioma cell lines treated with VER155008, which inhibits both HSP70 and HSP90 in U87-MG glioma cells,84 and miR-1915-3P has also been found to be downregulated in BT474 cells with the intervention of HER-2, which act as a tumorigenesis, and could maintain and/or accelerate growth, invasion, and angiogenesis, also inhibit cell apoptosis, and damage the tissue barrier.85
Conclusion
We explored the changes in the miRNA expression of RTHF-treated A549 cells and untreated controls. Many miRNAs showed aberrant expression in RTHF-treated A549 cells than in the untreated controls. These results suggest that these dysregulated miRNAs play a crucial role in cancer inhibition, by regulating the expression of anticancer-related genes. Identification of these miRNAs and their targets provides new insight into the gene regulation mechanism of RTHF antilung cancer activity.
Acknowledgments
This study was supported by the Wei KeMin Famous Old Chinese Medicine Experts Inheritance Studio Project held by State Administration of Traditional Chinese Medicine, the Special funder for super experts of Zhejiang Province, People’s Republic of China. We greatly appreciate the scientists of Genesky Biotechnologic Inc., Shanghai, People’s Republic of China, for their kind assistance in the sequencing of DE-miRNA libraries.
Disclosure
The authors report no conflicts of interest in this work.
References
Xu S, Jin PF, Xu WF, Jiang WQ, He XR. Research advances in Chinese Herbal medicine Tetrastigmae hemsleyanum. Central South Phar. 2016;14(12):1336–1341. | ||
Wang J, Guo WL, Yang DF, Xue YD, Xu XH, Liang ZS. The research development of a rare medicinal plant: Tetrastigma hemsleyanum Diels et Gilg. Botanic Res. 2015;4:39–46. | ||
Zhang K, Pugliese M, Pugliese A, Passantino A. Biological active ingredients of traditional Chinese herb Astragalus membranaceus on treatment of diabetes: a systematic review. Mini Rev Med Chem. 2015;15(4):315–329. | ||
Wu ZT, Zhu LY, Wu XQ, Zhang SH, Cheng RB. Research progress in the chemical compositions and anti-tumor effect of Tetrastigma hemsleyanum Diels et Gilg. Central South Phar. 2017;15(3):319–324. | ||
Wei KM, Ding GQ, Pu JB, et al. Study on the anti-tumor mechanism and the clinical application of Tetrastigma Hemsleanum Diels et. Gilg. J Med Res. 2007;36(11):41–43. | ||
Feng ZQ, Hao WR, Lin XY, Fan DP, Zhou JH. Antitumor activity of total flavonoids from Tetrastigma hemsleyanum Diels et Gilg is associated with the inhibition of regulatory T cells in mice. Onco Targets Ther. 2014;7:947–956. | ||
Travis WD, Travis LB, Devesa SS. Lung cancer. Cancer. 2015;75(S1):191–202. | ||
Zhong LR, Chen X, Wei KM. Radix tetrastigma hemsleyani flavone induces apoptosis in human lung carcinoma a549 cells by modulating the MAPK pathway. Asian Pacific J Cancer Prev. 2013;14(10):5983–5987. | ||
Zhong LR, Zheng JX, Sun QQ, Wei KM, Hu YJ. Radix tetrastigma hemsleyani flavone inhibits proliferation, migration, and invasion of human lung carcinoma A549 cells. Onco Targets Ther. 2016;9:635–641. | ||
Vasudevan S. Posttranscriptional upregulation by microRNAs. Wiley Interdiscip Rev RNA. 2012;3(3):311–330. | ||
Zhou Y, Wang GC, Zhang J, Li H. A hypothesis testing based method for normalization and differential expression analysis of RNA-seq data. PLoS One. 2017;12(1):e0169594. | ||
Mellman I, Yarden Y. Endocytosis and cancer. Cold Spring Harb Perspect Biol. 2013;5:a016949. | ||
Mosesson Y, Mills GB, Yarden Y. Derailed endocytosis: an emerging feature of cancer. Nat Rev Cancer. 2008;8(11):835–850. | ||
Guo SC, Liu ML, Gonzalez–Perez RR. Role of Notch and its oncogenic signaling crosstalk in breast cancer. Biochim Biophys Acta. 2011;1815(2):197–213. | ||
Hu YY, Zheng MH, Zhang R, Liang YM, Han H. Notch signaling pathway and cancer metastasis. Adv Exp Med Biol. 2012;727:186–198. | ||
Lake D, Corrêa SAL, Müller J. Negative feedback regulation of the ERK1/2 MAPK pathway. Cell Mol Life Sci. 2016;73(23):4397–4413. | ||
Repnik U, Česen MH, Turk B. The endolysosomal system in cell death and survival. Cold Spring Harb Perspect Biol. 2013;5(1):a008755. | ||
Hadi NI, Jamal Q, Iqbal A, Shaikh F, Somroo S, Musharraf SG. Serum metabolomic profiles for breast cancer diagnosis, grading and staging by gas chromatography–mass spectrometry. Sci Rep. 2017;7(1):1715. | ||
Wang Y, Mei Q, Ai YQ, et al. Identification of lung cancer oncogenes based on the mRNA expression and single nucleotide polymorphism profile data. Neoplasma. 2015;62(6):966–973. | ||
Lee WC, Goh KL, Loke MF, Vadivelu J. Elucidation of the metabolic network of Helicobacter pylori J99 and Malaysian clinical strains by phenotype microarray. Helicobacter. 2017;22(1):e12321. | ||
Biankin AV, Waddell N, Kassahn KS, et al. Pancreatic cancer genomes reveal aberrations in axon guidance pathway genes. Nature. 2012;491(7424):399–405. | ||
Li YY, Ohira M, Zhou Y, et al. Genomic analysis-integrated whole–exome sequencing of neuroblastomas identifies genetic mutations in axon guidance pathway. Oncotarget. 2017;8(34):56684–56697. | ||
Mancino M, Ametller E, Gascón P, Almendro V. The neuronal influence on tumor progression. Biochim Biophys Acta. 2011;816:105–118. | ||
Jazdzewski K, Murray EL, Franssila K, Jarzab B, Schoenberg DR, de la Chapelle A. Common SNP in pre-miR-146a decreases mature miR expression and predisposes to papillary thyroid carcinoma. Proc Natl Acad Sci U S A. 2008;105(20):7269–7274. | ||
Yan CH, Shi XD, Wang QS, et al. Genome-wide identification and expression analysis of microRNA involved in small cell lung cancer via deep sequencing. Mol Med Rep. 2014;10(5):2633–2642. | ||
Xiang W, Wu XC, Huang C, et al. PTTG1 regulated by miR-146a-3p promotes bladder cancer migration, invasion, metastasis and growth. Oncotarget. 2016;8(1):664. | ||
Li Y, Chen XD. miR-4792 inhibits epithelial–mesenchymal transition and invasion in nasopharyngeal carcinoma by targeting FOXC1. Biochem Biophy Res Comm. 2015;468(4):863–869. | ||
Georgieva B, Milev I, Minkov I, Dimitrova I, Bradford AP, Baev V. Characterization of the uterine leiomyoma microRNAome by deep sequencing. Genomics. 2012;99(5):275–281. | ||
Plieskatt JL, Rinaldi G, Feng YJ, et al. Methods and matrices: approaches to identifying miRNAs for nasopharyngeal carcinoma. J Transl Med. 2014;12(1):3. | ||
Chen DJ, Liu L, Luo XG, et al. Effect of SMYD3 on the microRNA expression profile of MCF-7 breast cancer cells. Oncol Lett. 2017;14:1831–1840. | ||
Ahn SH, Ahn JH, Ryu DR, Lee J, Cho MS, Choi YH. Effect of necrosis on the miRNA-mRNA regulatory network in CRT-MG human astroglioma cells. Cancer Res Treat. 2018;50(2):382–387. | ||
Reza AMMT, Choi YJ, Yasuda H, Kim JK. Human adipose mesenchymal stem cell-derived exosomal-miRNAs are critical factors for inducing anti-proliferation signalling to A2780 and SKOV-3 ovarian cancer cells. Sci Rep. 2016;6:38498. | ||
Yoo JK, Jung HY, Kim CH, Son WS, Kim JK. miR-7641 modulates the expression of CXCL1 during endothelial differentiation derived from human embryonic stem cells. Arch Phar Res. 2013;36(3):353–358. | ||
Zheng YP, Wu LX, Gao J, Wang YF. Tumor suppressive role of miR-569 in lung cancer. Oncol Lett. 2018;15:4087–4092. | ||
Li J, Sun PS, Yue ZY, Zhang DZ, You K, Wang JG. miR-144-3p induces cell cycle arrest and apoptosis in pancreatic cancer cells by targeting proline-rich protein 11 expression via the mitogen-activated protein kinase signaling pathway. DNA Cell Biol. 2017;36(8):619–626. | ||
Li BT, Zhang SP, Shen H, Li CL. MicroRNA-144-3p suppresses gastric cancer progression by inhibiting epithelial-to-mesenchymal transition through targeting PBX3. Biochem Biophys Res Commun. 2017;484(2):241–247. | ||
Yu L, Yang YM, Hou JG, et al. MicroRNA-144 affects radiotherapy sensitivity by promoting proliferation, migration and invasion of breast cancer cells. Oncol Rep. 2015;34(4):1845–1852. | ||
Liu F, Chen N, Xiao RH, Wang WC, Pan ZY. miR-144-3p serves as a tumor suppressor for renal cell carcinoma and inhibits its invasion and metastasis by targeting MAP3K8. Biochem Biophys Res Commun. 2016;480(1):87–93. | ||
Bertero T, Bourget–Ponzio I, Puissant A, et al. Tumor suppressor function of miR-483-3p on squamous cell carcinomas due to its pro-apoptotic properties. Cell Cycle. 2013;12(14):2183–2193. | ||
Veronese A, Lupini L, Consiglio J, et al. Oncogenic role of miR-483-3p at the IGF2/483 locus. Cancer Res. 2010;70(8):3140–3149. | ||
Zhu Z, Wang CP, Zhang YF, Nie L. MicroRNA-100 resensitizes resistant chondrosarcoma cells to cisplatin through direct targeting of mTOR. Asian Pac J Cancer Prev. 2014;15(2):917–923. | ||
Guo P, Xiong XP, Zhang SN, Peng DX. miR-100 resensitizes resistant epithelial ovarian cancer to cisplatin. Oncol Rep. 2016;36(6):3552–3558. | ||
Ling DJ, Liao QD, Shi TS. IGF2-targeted regulation of miR-100 in migration and invasion of non-small-cell lung cancer A549 cells. China J Mod Med. 2015;25:1–5. | ||
Korpal M, Lee ES, Hu GH, Kang YB. The miR-200 family inhibits epithelial-mesenchymal transition and cancer cell migration by direct targeting of E-cadherin transcriptional repressors ZEB1 and ZEB2. J Biol Chem. 2008;283(22):14910–14914. | ||
Wang XS, Jiang FQ, Li X, Xian JH, Gu XQ. MicroRNA-200a-3p suppresses tumor proliferation and induces apoptosis by targeting SPAG9 in renal cell carcinoma. Biochem Biophys Res Commun. 2016;470(3):620–626. | ||
Janiak M, Paskal W, Rak B, et al. TIMP4 expression is regulated by miR-200b-3p in prostate cancer cells. APMIS. 2016;125(2):101–105. | ||
He MY, Liu Y, Deng XJ, et al. Down–regulation of miR-200b-3p by low p73 contributes to the androgen–independence of prostate cancer cells. Prostate. 2013;73(10):1048–1056. | ||
Song JG, Gao LC, Yang G, et al. MiR-199a regulates cell proliferation and survival by targeting FZD7. PLoS One. 2014;9(10):e110074. | ||
Li WT, Wang H, Zhang JB, Zhai LM, Chen WJ, Zhao CL. miR-199a-5p regulates β1 integrin through Ets-1 to suppress invasion in breast cancer. Cancer Sci. 2016;107(7):916–923. | ||
Zhang YF, Yu Y, Song WZ, et al. miR-410-3p suppresses breast cancer progression by targeting Snail. Oncol Rep. 2016;36(1):480–486. | ||
Rak B, Garbicz F, Paskal W, et al. The expression of MMP-14 and microRNA-410 in FFPE tissues of human endometrial adenocarcinoma. Histol Histopathol. 2016;31:911–920. | ||
Rak B, Mehlich D, Garbicz F, et al. Post-transcriptional regulation of MMP16 and TIMP2 expression via miR-382, miR-410 and miR-200b in endometrial cancer. Cancer Genomics Proteomics. 2017;4:389–401. | ||
Yang X, Ruan HB, Hu X, Cao AY, Song L. miR-381-3p suppresses the proliferation of oral squamous cell carcinoma cells by directly targeting FGFR2. Am J Cancer Res. 2017;7(4):913. | ||
Cao QH, Liu F, Ji KY, et al. MicroRNA-381 inhibits the metastasis of gastric cancer by targeting TMEM16A expression. J Exp Clin Cancer Res. 2017;36(1):29. | ||
Rothschild SI, Tschan MP, Jaggi R, Fey MF, Gugger M, Gautschi O. MicroRNA-381 represses ID1 and is deregulated in lung adenocarcinoma. J Thorac Oncol. 2012;7:1069–1077. | ||
Dai FQ, Mei LY, Meng SL, et al. The global expression profiling in esophageal squamous cell carcinoma. Genomics. 2017;109(3–4):241–250. | ||
Chen PH, Chang CK, Shih CM, et al. The miR-204-3p-targeted IGFBP2 pathway is involved in xanthohumol-induced glioma cell apoptotic death. Neuropharmacology. 2016;110:362–375. | ||
Trang P, Wiggins JF, Daige CL, et al. Systemic delivery of tumor suppressor microRNA mimics using a neutral lipid emulsion inhibits lung tumors in mice. Mol Ther. 2011;19:1116–1122. | ||
Zhao B, Han H, Chen J, et al. MicroRNA let-7c inhibits migration and invasion of human non-small cell lung cancer by targeting ITGB3 and MAP4K3. Cancer Lett. 2014;342:43–51. | ||
Zhang P, Ma YL, Wan F, et al. Comprehensive gene and microRNA expression profiling reveals the crucial role of hsa-let-7i and its target genes in colorectal cancer metastasis. Mol Biol Rep. 2012;39(2):1471–1478. | ||
Zhang K, Zhao S, Wang Q, Yang HS, Zhu J, Ma R. Identification of microRNAs in nipple discharge as potential diagnostic biomarkers for breast cancer. Ann Surg Oncol. 2015;22(3):1–9. | ||
Wang X, Geng WW, Bi DS. Expression and role of miR-4484 in p53 mutations in colorectal cancer. Shandong Med. 2015;55(34):70–71. | ||
Zhang K, Wang YW, Ma R. Bioinformatics analysis of dysregulated microRNAs in the nipple discharge of patients with breast cancer. Oncol Lett. 2017;13(5):3100–3108. | ||
Sinha A, Yadav AK, Chakraborty S, et al. Exosome-enclosed microRNAs in exhaled breath hold potential for biomarker discovery in patients with pulmonary diseases. J Allergy Clin Immun. 2013;132(1):219–222. | ||
Radhakrishnan A, Badhrinarayanan N, Biswas J, Krishnakumar S. Analysis of chromosomal aberration (1, 3, and 8) and association of microRNAs in uveal melanoma. Mol Vis. 2009;15(15):2146–2154. | ||
Zhao W, Cao LB, Zeng S, Qin HP, Men TY. Upregulation of miR-556-5p promoted prostate cancer cell proliferation by suppressing PPP2R2A expression. Biomed Pharmacother. 2015;75:142–147. | ||
Zhang SJ, Feng JF, Wang L, et al. miR-1303 targets claudin-18 gene to modulate proliferation and invasion of gastric cancer cells. Dig Dis Sci. 2014;59(8):1754–1763. | ||
Li ZQ, Xu Z, Xie QG, Gao WZ, Xie JT, Zhou L. miR-1303 promotes the proliferation of neuroblastoma cell SH-SY5Y by targeting GSK3β and SFRP1. Biomed Pharmacother. 2016;83:508–513. | ||
Danza K, De SS, Pinto R, et al. miR-578 and miR-573 as potential players in BRCA–related breast cancer angiogenesis. Oncotarget. 2015;6(1):471–483. | ||
Lei L, Huang Y, Gong W. Inhibition of miR-92b suppresses nonsmall cell lung cancer cells growth and motility by targeting RECK. Mol Cell Biochem. 2014;387(1–2):171–176. | ||
Li QF, Shen K, Zhao Y, Ma CK, Liu JW, Ma J. MiR-92b inhibitor promoted glioma cell apoptosis via targeting DKK3 and blocking the Wnt/beta-catenin signaling pathway. J Transl Med. 2013;11(1):302. | ||
Ma G, Jing C, Huang FR, Li XK, Cao XF, Liu ZH. Integrin α6 promotes esophageal cancer metastasis and is targeted by miR-92b. Oncotarget. 2017;8(4):6681–6690. | ||
Shin S, Cha HJ, Lee EM, et al. Alteration of miRNA profiles by ionizing radiation in A549 human non-small cell lung cancer cells. Int J Oncol. 2009;35(1):81–86. | ||
Lee EM, Shin S, Cha HJ, et al. Suberoylanilide hydroxamic acid (SAHA) changes microRNA expression profiles in A549 human non-small cell lung cancer cells. Int J Mol Med. 2009;24(1):45–50. | ||
Watahiki A, Wang Y, Morris J, et al. MicroRNAs associated with metastatic prostate cancer. PLoS One. 2011;6(9):e24950. | ||
Huang JK, Wu JJ, Li YQ, et al. Deregulation of serum microrna expression is associated with cigarette smoking and lung cancer. Biomed Res Int. 2014;2014:364316. | ||
Liao YB, Deng YL, Liu J, et al. MiR-760 overexpression promotes proliferation in ovarian cancer by downregulation of PHLPP2 expression. Gynecol Oncol. 2016;143(3):655–663. | ||
Bae S, Lee EM, Cha HJ, et al. Resveratrol alters microRNA expression profiles in A549 human non-small cell lung cancer cells. Mol Cells. 2011;32(3):243–249. | ||
Lv JX, Fu ZY, Shi M, et al. Systematic analysis of gene expression pattern in has-miR-760 overexpressed resistance of the MCF-7 human breast cancer cell to doxorubicin. Biomed Pharmacother. 2015;69:162–169. | ||
Li SN, Hang LH, Ma YM, Wu C. Distinctive microRNA expression in early stage nasopharyngeal carcinoma patients. J Cell Mol Med. 2016;20(12):2259–2268. | ||
Kiss I, Mlčochová J, Součková K, et al. MicroRNAs as outcome predictors in patients with metastatic colorectal cancer treated with bevacizumab in combination with FOLFOX. Oncol Lett. 2017;14(1):743–750. | ||
Bakker E. Zinc Depletion-Induced Apoptosis is Associated with Altered microRNA Expression in Human Breast Cancer MDA-MB-231 Cells. Vancouver: The University of British Columbia; 2013:120. | ||
Xu XJ, Jin S, Ma YF, et al. miR-30a-5p enhances paclitaxel sensitivity in non-small cell lung cancer through targeting BCL-2 expression. J Mol Med. 2017;95(8):1–11. | ||
Wang X, Jiang DR, Xu CC, Zhu GL, Wu ZS, Wu Q. Differential expression profile analysis of miRNAs with HER-2 overexpression and intervention in breast cancer cells. Int J Clin Exp Pathol. 2017;10(5):5039–5062. | ||
Song JQ, Gao LC, Yang G, et al. MiR-199a regulates cell proliferation and survival by targeting FZD7. PLoS One. 2014;9(10):e110074. |
 © 2018 The Author(s). This work is published and licensed by Dove Medical Press Limited. The full terms of this license are available at https://www.dovepress.com/terms.php and incorporate the Creative Commons Attribution - Non Commercial (unported, v3.0) License.
By accessing the work you hereby accept the Terms. Non-commercial uses of the work are permitted without any further permission from Dove Medical Press Limited, provided the work is properly attributed. For permission for commercial use of this work, please see paragraphs 4.2 and 5 of our Terms.
© 2018 The Author(s). This work is published and licensed by Dove Medical Press Limited. The full terms of this license are available at https://www.dovepress.com/terms.php and incorporate the Creative Commons Attribution - Non Commercial (unported, v3.0) License.
By accessing the work you hereby accept the Terms. Non-commercial uses of the work are permitted without any further permission from Dove Medical Press Limited, provided the work is properly attributed. For permission for commercial use of this work, please see paragraphs 4.2 and 5 of our Terms.