")
Back to Journals » International Journal of General Medicine » Volume 15
An Oxidative Stress-Related Genes Signature for Predicting Survival in Bladder Cancer: Based on TCGA Database and Bioinformatics
Authors Zhang M, Du G, Li Z, Li D, Li W , Li H, Gao X, Tang Z
Received 8 December 2021
Accepted for publication 23 February 2022
Published 8 March 2022 Volume 2022:15 Pages 2645—2667
DOI https://doi.org/10.2147/IJGM.S348945
Checked for plagiarism Yes
Review by Single anonymous peer review
Peer reviewer comments 2
Editor who approved publication: Dr Scott Fraser
Min Zhang,1,* Gang Du,2,* Zhengtian Li,2 Dehui Li,3 Weichao Li,2 Hening Li,4 Xingxin Gao,3 Zhanhong Tang1
1Department of Critical Care Medicine, The First Affiliated Hospital of Guangxi Medical University, Nanning, 530021, People’s Republic of China; 2Department of Bone and Joint Surgery, The First Affiliated Hospital of Guangxi Medical University, Nanning, 530021, People’s Republic of China; 3Department of Burns and Plastic, The First Affiliated Hospital of Guangxi Medical University, Nanning, 530021, People’s Republic of China; 4Guangxi Medical University, Nanning, 530021, People’s Republic of China
*These authors contributed equally to this work
Correspondence: Zhanhong Tang; Xingxin Gao, Email [email protected]; [email protected]
Background: Oxidative stress (OS) responses have been linked to oncogenesis and tumor progression and have recently been regarded as a potential strategy for tumor therapy. However, OS-related therapeutic targets have not been identified to date in the bladder cancer (BC).
Methods: The mRNA expression and clinical data of BC were downloaded from the public database. Prognostic risk score signature was constructed using LASSO Cox regression analysis. External validation was performed in GSE15307 cohort. ESTIMATE, CIBERSORT, and ssGSEA algorithm were used to analyze immune cell infiltration and immune microenvironment. Next, functional enrichment analysis was performed to elucidate the mechanism underlying the signature. Additionally, we performed a nomogram to forecast the survival rate of individual BC patients.
Results: An OS-related genes (OSRGs) signature was constructed. Overall survival was lower in the high-risk group than in the low-risk group, according to survival analyses. The area under the curve (AUC) of ROC curves further validated the prognostic signature’s strong prediction performance in these two cohorts. The risk score was verified as an independent risk factor for BC by independent prognostic analysis. Moreover, as compared to TNM stage alone, a nomogram that integrated the risk score with TNM stage showed a much superior predictive value. Immune infiltration and tumor microenvironment studies indicated that immune cells and functions may play a significant role in carcinogenesis and development. The levels of expression of prognostic genes were shown to be substantially linked with drug sensitivity.
Conclusion: We developed a novel OSRGs signature for predicting overall survival and impacting the immune status in patients with BC. New nomogram can help clinicians predict the survival rate of BC patients. These findings shed new light on the potential usage of OSRGs signature in BC patients.
Keywords: bladder cancer, oxidative stress, prognosis, risk signature, immune cell infiltration, drug sensitivity
Introduction
Bladder cancer is the tenth most prevalent kind of cancer globally, with a morbidity rate of 3.0% and a death rate of 2.1%.1 Approximately 75% of bladder cancer cases are classified as non-muscle invasive bladder cancer (NMIBC), and 25% are classified as muscle invasive bladder cancer (MIBC).2 Although NMIBC can be treated by surgery, it often relapses further after resection, and approximately 15% of cases deteriorate to MIBC, which is related to more aggressive characteristics and poor prognosis.3 The traditional pathological grade and clinical TNM stage are currently utilized to evaluate the prognosis of BC patients. BC with early metastasis is associated with poor prognosis and poor therapeutic outcomes owing to the lack of reliable screening techniques for early diagnosis. Some studies have reported that the mutation of tumor suppressor genes to oncogenes, such as HER-2, H-Ras and Bcl-2, promotes the occurrence of BC.4 In recent years, the advent of novel molecularly targeted medicines opens up new avenues for the treatment of advanced BC. Targeted molecular therapy has progressively emerged as a viable option in cancer treatment. Many research has concentrated on developing more effective prediction signatures that might better elucidate the variables that contribute to the prognosis and progression and even more specific immune landscape as well efficacy of immunotherapy of BC, with the goal of providing more evidence for individual molecular therapy methods. Although BC has been extensively studied, few validated biomarkers or screening tools general exist in clinical. Hence, there exists an urgency to develop a robust biomarker to predict prognosis and guide therapeutic treatment, particularly in the areas of targeted therapy and immunotherapy for BC patients.
Oxidative stress is a pathological phenomenon that occurs when the synthesis of oxidants and antioxidants is imbalanced, leading in the buildup of high levels of reactive oxygen species (ROS), which are a potentially critical component driving carcinogenesis and cancer development.5–7 ROS include oxygen ions, free radicals and peroxides.8 Previous research has been that when the scavenging capacity decreases, excessive ROS can injure the DNA, causing genotoxicity and eventually inducing genomic alterations that begin cancer.9–12 Modest ROS level might play a crucial role in tumor development by disrupting DNA sequences.13 Many key genes and gene products have been involved in this system and processes of oxidative stress. However, there has been no comprehensive investigation aiming at identifying particular oxidative stress-related genes (OSRGs) that connect with tumorigenesis, advance and prognosis of BC. During the last several years, database-based bioinformatic expression profile analysis has been frequently used to identify target biomarkers of diagnostic and prognostic significance in different tumors.14,15 Studies have shown that OSRGs can be used as a predictor of gastric cancer16 and pancreatic cancer.17 In urologic neoplasms, oxidative stress pathway genes were reported to be associated with the prognosis of prostate cancer.18 Nonetheless, the role of OSRGs in BC prognosis prediction remains mainly unclear, and the underlying processes need to be validated further.
This paper concentrates on exploring the possible roles of OSRGs in cancer development and progression as well tumor immunology in BC. Within those differentially expressed OS-related genes (DEOSGs), we identified eight hub OSRGs with non-negligible correlation with BC prognosis. Furthermore, we constructed a prognostic OSRGs signature and established a novel nomogram to better predict the overall survival of BC individuals. We also performed immune cell infiltration and tumor microenvironment analyses in different high- and low-risk group. In addition, ssGSEA analysis was used for immune function evaluation, and drug sensitivity analyses was also carried out. As far as we know, this is the first OS-associated risk signature for prognostic prediction in BC patient, and it may provide fresh insight into the pathophysiology of BC, allowing for more customized treatment and improving BC patients’ prognosis.
Materials and Methods
Data Acquisition and Differentially Expressed OS Genes (DEOSGs)
After downloading the data including RNA sequencing of 414 BC and 19 normal bladder tissues and the clinical information of BC patients from the Cancer Genome Atlas (TCGA) database (https://portal.gdc.cancer.gov/) on April 14, 2021. We extracted 1399 OS protein domains all of whose relevance scores were higher than 7 (Supplement File Table 1) from GeneCards (https://www.genecards.org) to identify DEOSGs. According to the numerous previous studies, this study defined those DEOSGs with log2 fold change (FC)|≥1 and false discovery rate (FDR)<0.05 as differently expressed one.19 Meanwhile, genes with an average count value of < 1 were eliminated. This yielded 379 DEOSGs for further analyses. Besides, we established a validation cohort (GSE15307) contained 165 patients with RNA sequencing and corresponding clinical data from GEO database (https://www.ncbi.nlm.nih.gov/geo/). All detailed patient characteristics are summarized in Table 1.
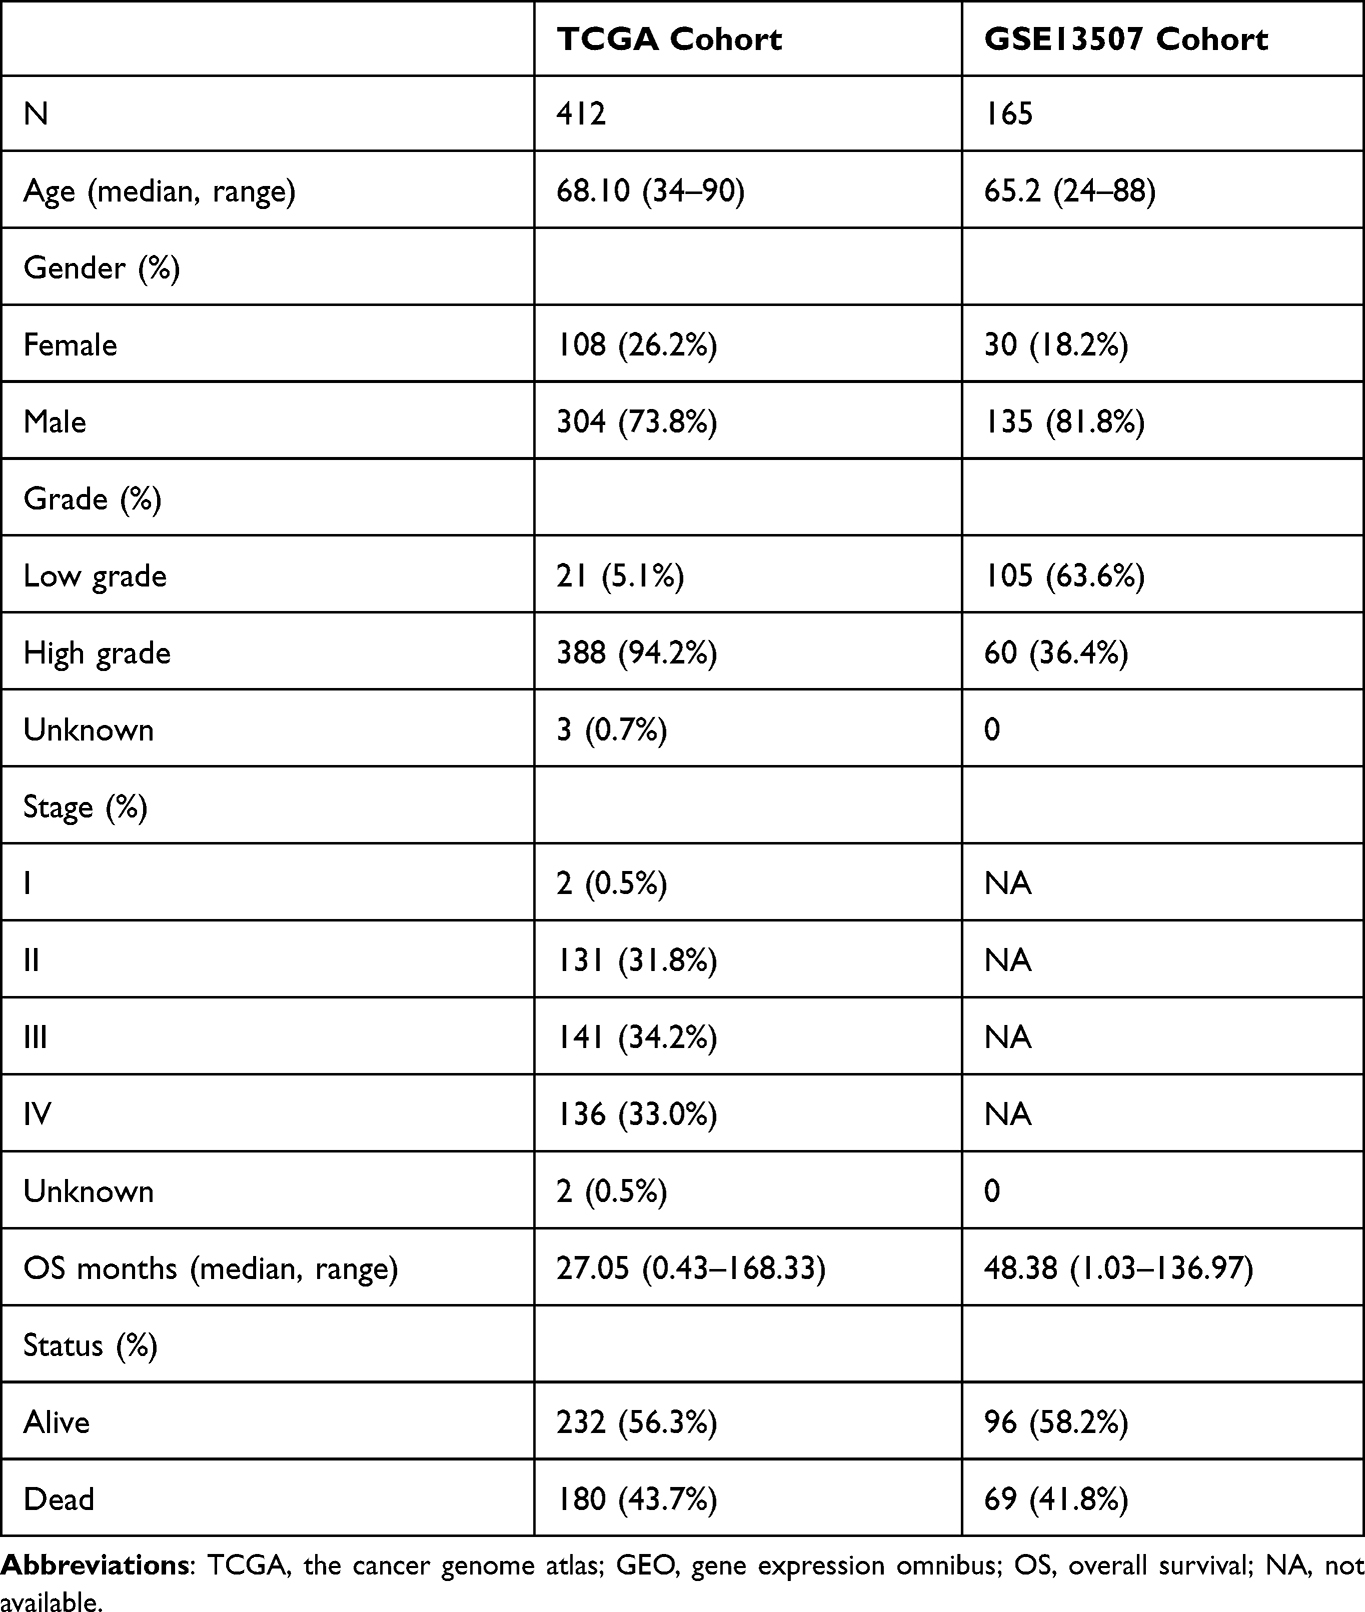 |
Table 1 Characteristics of Patients from TCGA and GSE13507 Cohort |
GO and KEGG Pathway Enrichment Analyses
GO enrichment and Kyoto encyclopedia of genes and genomes (KEGG) pathway analysis20–22 were perform to explore the effect of those identified DEOSGs with the help of several packages including “clusterProfiler”, “ ggplot2 ”, “enrichplot” and “ org.Hs.eg.db ”in R. P and FDR values < 0.05 represent statistically significant.
Protein–Protein Interaction (PPI) Network Construction and Critical Module Screening
To further explore the Interaction of all DEOSGs we constructed PPI network based on the STRING database (http://www.string-db.org/; medium confidence=0.400; hide disconnected nodes in the network),23 and subsequently, their interactions were imported into the Cytoscape 3.7.2 software to construct and visualize a PPI network. The Molecular Complex Detection (MCODE) plug-in was applied to identified those critical modules in the PPI network with both MCODE scores and node counts >5.24 P value were less than 0.05 indicating a significant difference.
Prognostic Signature Construction and Efficacy Evaluation
Via the survival R package, we integrated those selected DEOSGs in the PPI network into univariate Cox regression analysis to investigate their impact to patient’s survival outcome and survival time, and the candidate genes were identified as prognosis related DEOSGs (P<0.005). Subsequently, these candidate OS genes were added into the least absolute shrinkage and selection operator (LASSO) regression25 and multivariate Cox regression analyses together to identified the hub OS genes that were used to construct a risk score in BC. Patients were divided into two subgroups (low-risk group and high-risk one) according to the median risk score. Next, we performed Kaplan-Meier test and Log-Rank test to analyze the overall survival of two group. Additionally, using the Survival ROC and timeROC package, we carried out a receiver operating characteristic (ROC) curve analysis to evaluate the overall predictive performance of the model.26 We then applied univariate and multivariate Cox regression analysis to investigate the correlation and independence of clinical characteristics and risk score. At last, we developed a nomogram based on OS-associated risk signature as a prognostic tool for patients with BC.27 All above methods were also performance to the GSE15307 cohort to assess the prognostic discrimination and accuracy of this model.
Gene Set Enrichment Analyses
Via GSEA software (version 4.0.3; https://www.gsea-msigdb.org/gsea/), gene set enrichment analyses were performed to the high- and low-risk group to explore the enriched functional pathway of those selected genes to infer their impact. Gene sets with nominal P value < 0.05 and the FDR q value < 0.05 were taken as significant ones.
Hub Gene Evaluation
To clarify the differential expression of eight hub DEOSGs, all of them were verified in TCGA cohort. In addition, we observed differences in the expression levels of eight prognosis-associated hub OS genes between patients with different stages and grade included in the TCGA and GEO cohort. The survival analyses about these eight hub DEOSGs was assess by using GEPIA2 database (http://gepia2.cancer-pku.cn/#index).
Evaluation of Immune Cell Infiltration and Generation of Tumor Microenvironment (TME) Score
With the aid of CIBERSORT, a full-fledged immune cell estimating analysis method, we assessed the proportions of 22 immune cell subtypes based on TCGA cohort. To explore the degree of immune cell infiltration in different risk groups, ESTIMATE algorithm, of which R script was attained from the website (https://sourceforge.net/projects/estimateproject/) helped us to generate the estimate scores, immune scores, and stromal scores for further analyzing the TME.28 The results with P < 0.05 were used for further analyses. Spearman correlation was utilized to test the correlation between risk score and TME scores. The association between risk score and immune infiltration subtype was tested by 2-way ANOVA analyses.
Immune Checkpoint, m6A Genes and Single-Sample Gene Set Enrichment Analyses
ssGSEA helped quantify several tumor-infiltrating immune cell subcohorts between the two subgroups and assess their immune function. Potential immune checkpoint and m6A genes were also retrieved from previous literature, and were performed difference analyzing in the two risk groups. Applying “GSVA” R package, we performed ssGSEA analysis to acquire the infiltration scores of 16 immune cells and evaluate the activities of 13 immune-related pathways of both the high- and low-risk groups.
Tumor Stem Cell Analyses and Immune Subtype Analyses
We investigated the stem cell-like features of tumor by analyzing the tumor stem cell features of extracted TCGA tumor samples in both transcriptome and epigenetics.29 We performed Spearman correlation test to research the interrelationship of tumor stemness and risk score. In addition, immune subtype analyses including C1, C2, C3 and C4 subtype were also performed.
Chemotherapy Sensitivity Analyses
We explored the NCI-60 database (https://discover.nci.nih.gov/cellminer) which contained 60 different cancer cell lines of 9 different types of tumors using the Cell Miner interface. We carried out correlation analyses to potency of 216 selected drugs which attained confirmation of FDA or were in the stages of clinical testing. We also performed Pearson correlation analysis to research the interrelationship of expression levels of these hub OSRGs and drug susceptibility.
Results
Differential Expression Analyses and Functional Enrichment Analyses
The workflow of this study was showed in Figure 1. A total of 379 OS genes, comprising 166 downregulated and 213 upregulated genes, met the screening criteria and were identified as DEOSGs. The expression proportion of these DEOSGs was displayed in the volcano plot and heatmap (Figure 2A and B). We sought to further investigate the underlying molecular mechanisms by which these identified DEOSGs their functional effects on progression of BC using GO and KEGG analyses (Figures 3A and B; 4A and B). Enrichment analyses results revealed that these DEOSGs were mainly enriched in tumor-related pathways, such as the MAPK signaling pathway, TNF-signaling pathway, P13K-Akt signaling pathway and oxidative stress pathway.
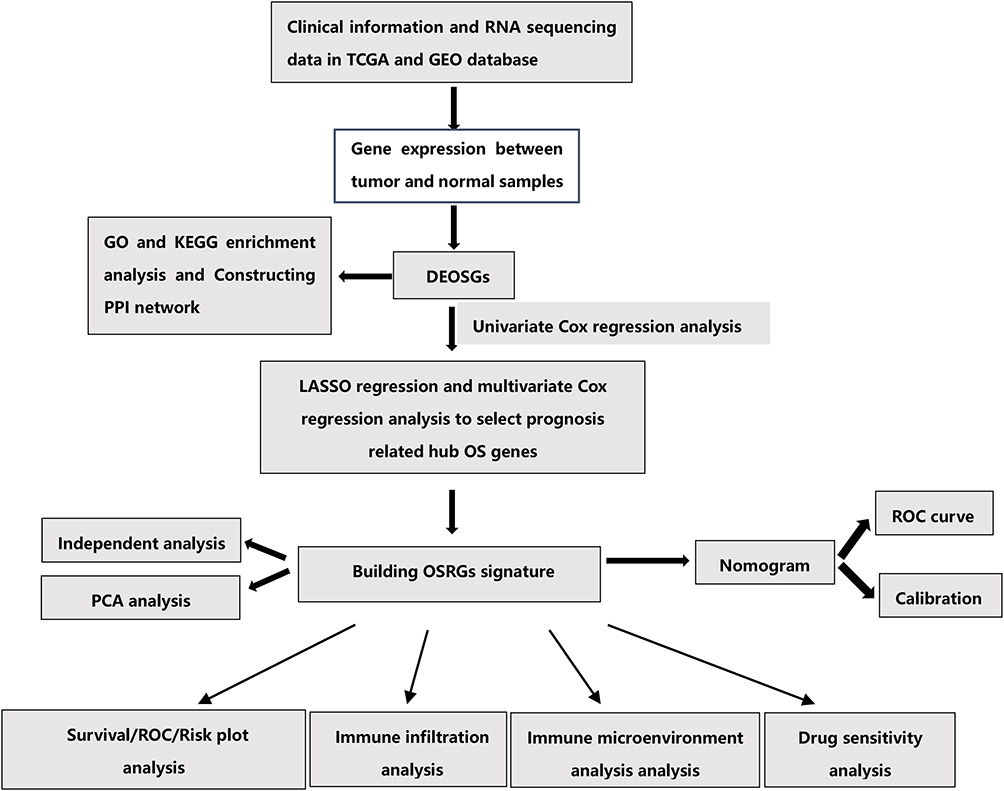 |
Figure 1 The flowchart of this study. |
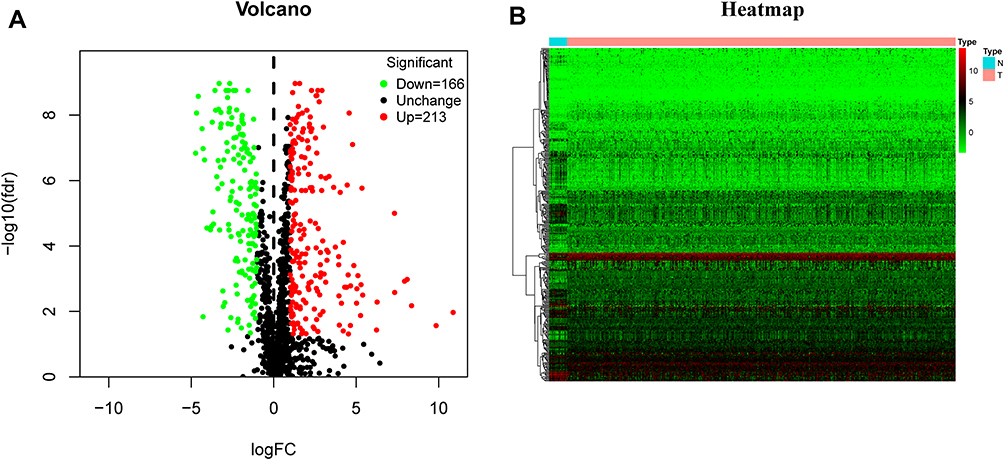 |
Figure 2 Identification of differently expressed oxidative stress genes (DEOSGs). (A) Volcano plot of DEOSGs between bladder cancer and normal bladder samples. Dots in green represent down-regulated genes, dots in red represent up-regulated genes, and dots in black represent unchanged genes. (B) Heatmap of DEOSGs. Abbreviations: N, normal; T, tumor. |
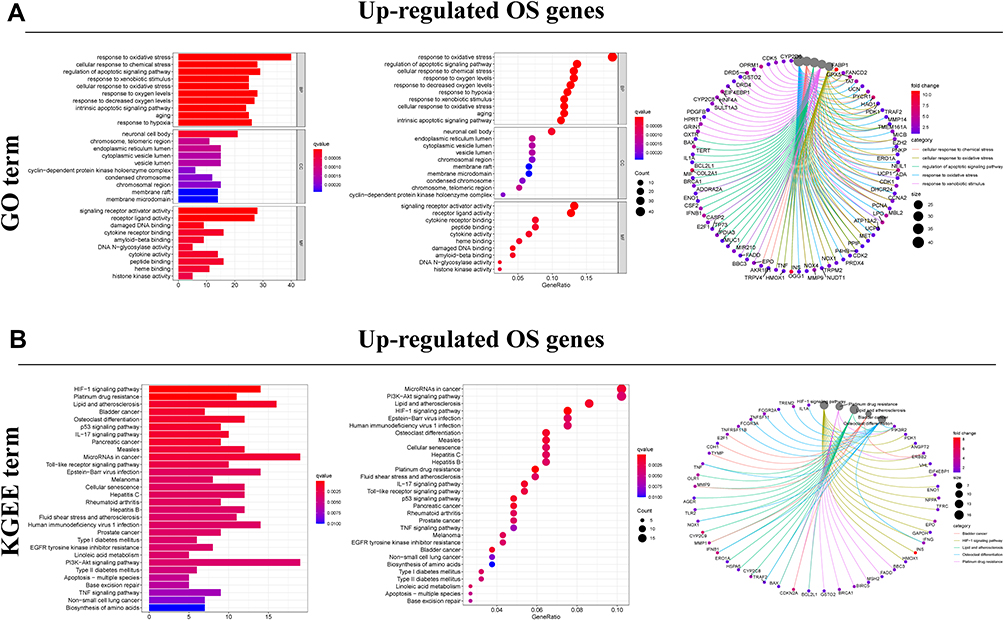 |
Figure 3 Functional enrichment analysis of up-regulated DEOSGs. (A) Top 10 classes of GO enrichment terms in biological process (BP), cellular component (CC), and molecular function (MF). Circle diagram which enriched in GO analysis. (B) Top 30 classes of KEGG enrichment terms. Circle diagram which enriched in KEGG analysis. |
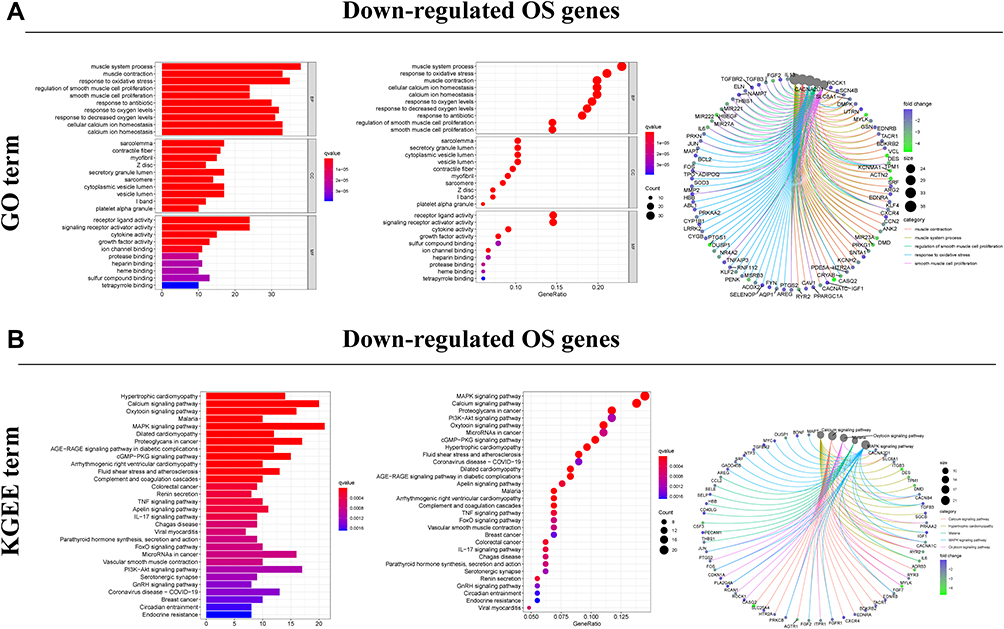 |
Figure 4 Functional enrichment analysis of down-regulated DEOSGs. (A) Top 10 classes of GO enrichment terms in biological process (BP), cellular component (CC), and molecular function (MF). Circle diagram which enriched in GO analysis. (B) Top 30 classes of KEGG enrichment terms. Circle diagram which enriched in KEGG analysis. |
Prognosis-Related Candidate Genes Screening and Construction of OSRGs Signature for BC
Using Cytoscape software and data from the STRING database, the PPI network and top 1 critical modules from PPI network were constructed (Figure 5A and B). A total of 26 genes were identified both in PPI network and univariate Cox regression analyses as candidate OS genes with P < 0.005 (Figure 6A). Subsequently, eight prognosis hub genes were selected by the LASSO analyses and multivariate Cox regression analyses (Figure 6B-E, Table 2). Significant variance between the two groups was shown in the PCA plot (Figure 6F). The risk score of this OSRGs signature was calculated using the following linear formula: Riskscore=∑Expgenei*βi, where Expgene represents the relative expression value of OS genes, and β represents the regression coefficient. Patients were categorized into low- and high-risk groups using the medium risk score.
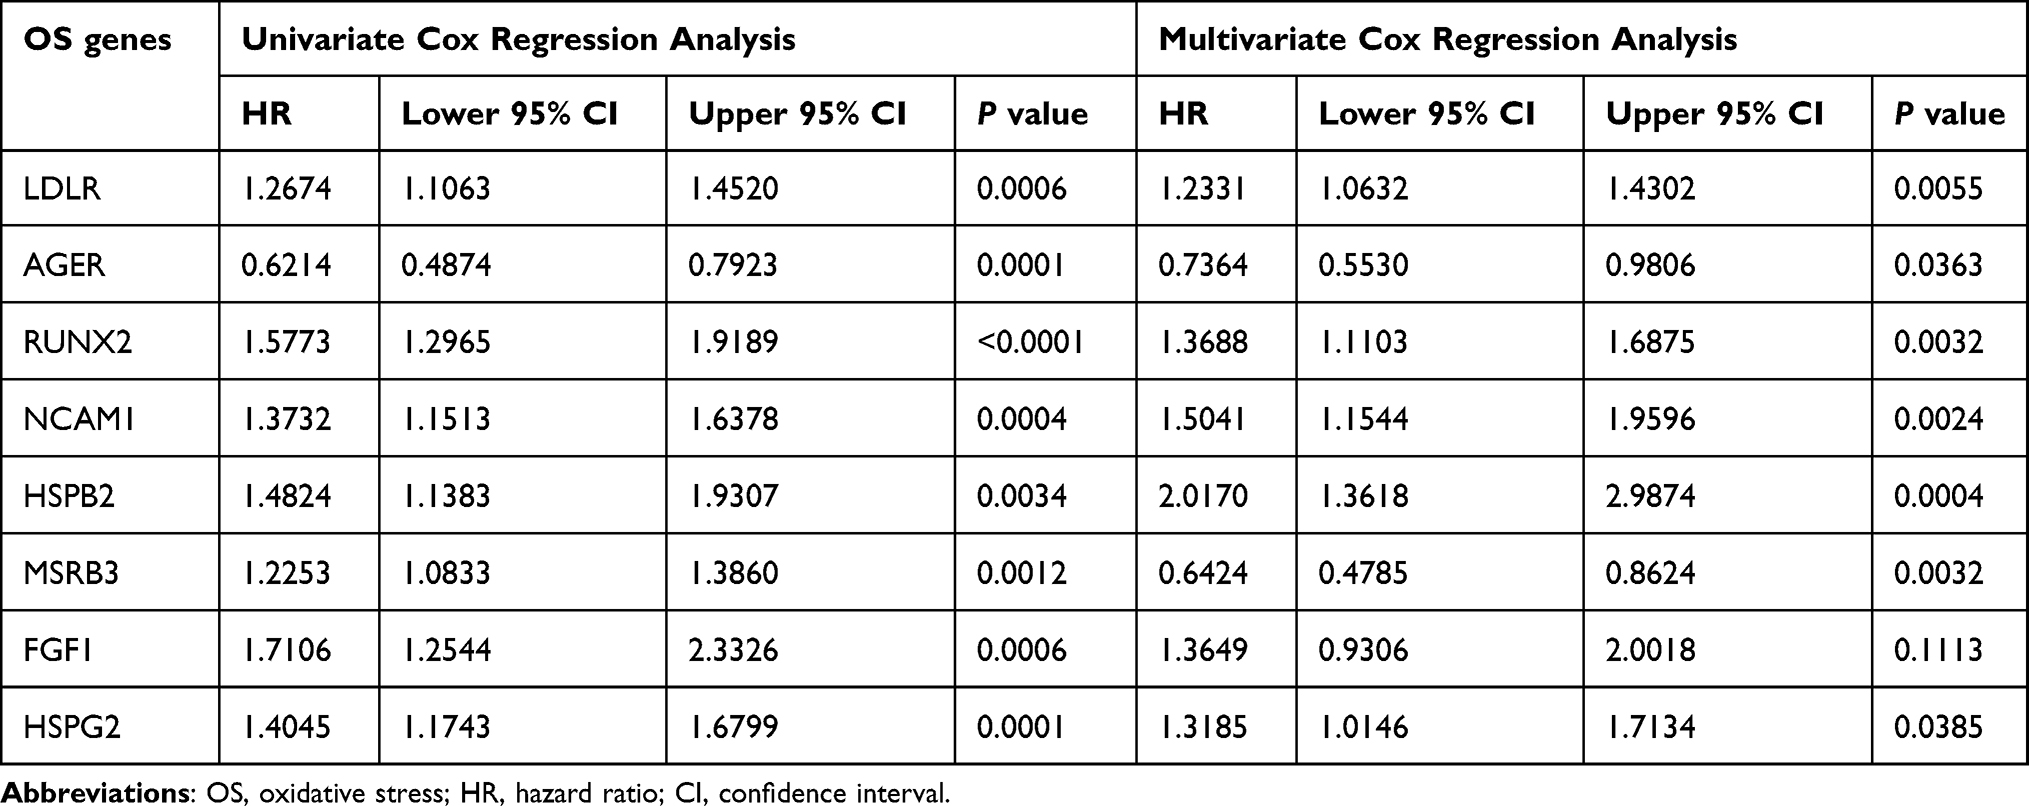 |
Table 2 Eight Prognosis-Associated Oxidative Stress Genes with BC in the TCGA Dataset Were Identified |
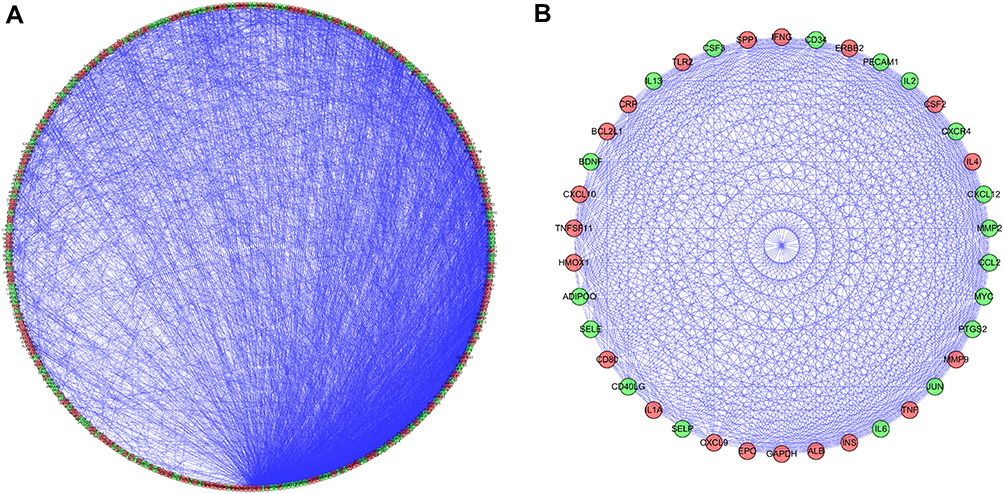 |
Figure 5 PPI network and modules screening. (A) PPI network of DEOSGs; (B) critical module from PPI network. Green circles represent down-regulated genes, and red circles represent up-regulated genes. |
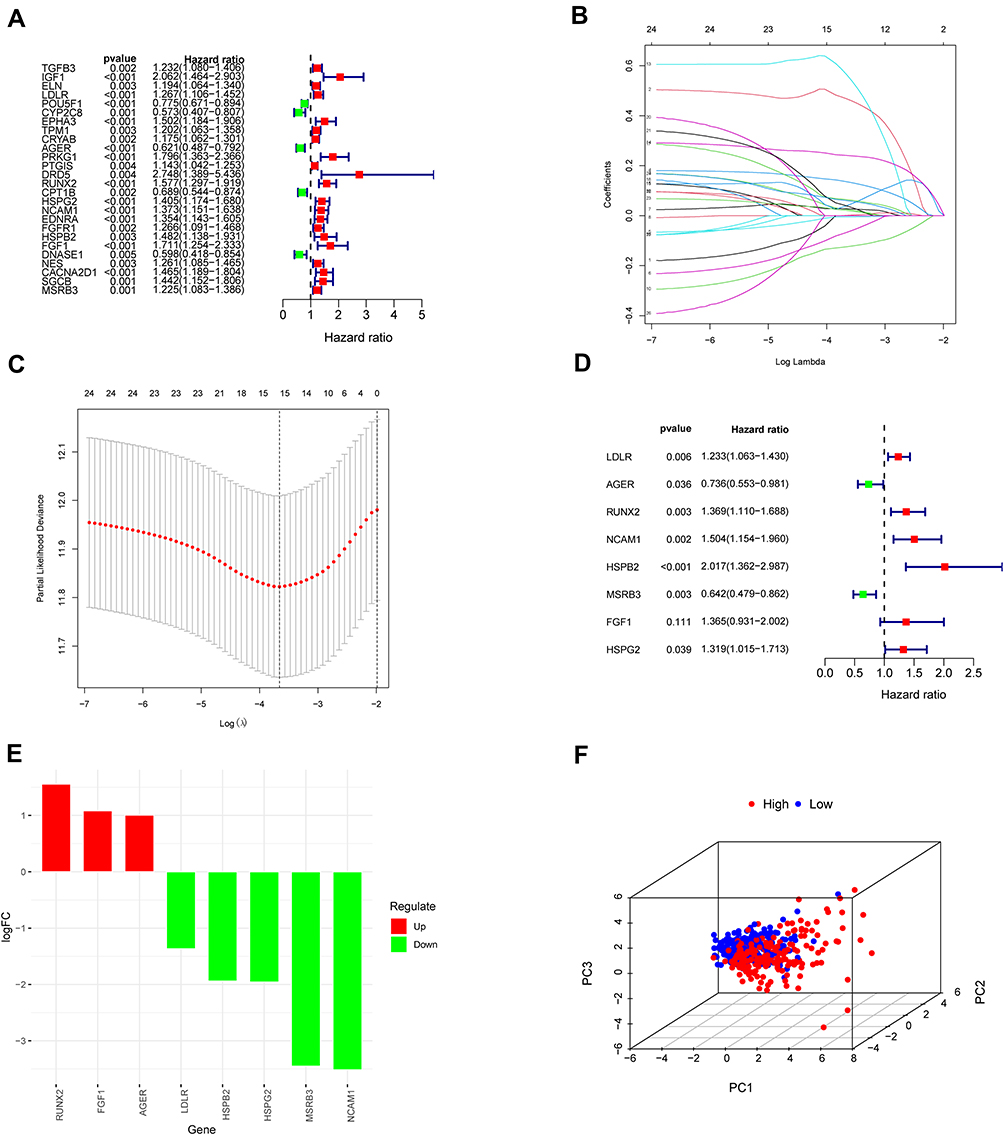 |
Figure 6 Construction of prognostic model in the TCGA and GSE13507 cohort. (A) Univariate Cox regression analysis for identification prognosis-associated OS genes. (B–D) LASSO analysis and multivariate Cox regression analysis of prognosis-associated OS genes together to constructing the prognosis prediction model. (E) Histogram of prognostic key genes. (F) Principal component analysis (PCA) of the total RNA expression profile of high group (red) and low group (blue). |
Hub Genes Evaluation Analyses
The boxplot analyses showed that all these eight OS genes were statistically different in BC and normal samples (Figure 7). In addition, the high expression of these genes was related to the poor prognosis of BC patients, except for AGER (Figure 8A-H). Expressive analyses revealed that LDLR and MSRB3 had higher expression in stage III–IV and high grade; and at the same time, RUNX2 was higher expression in stage III–IV, AGER was higher expression in Low grade, which mean AGER might be a good prognostic factor (Supplement File Figure S1A-C). Taken together, these hub OS genes might play a very important role in the diagnosis and prognosis of BC.
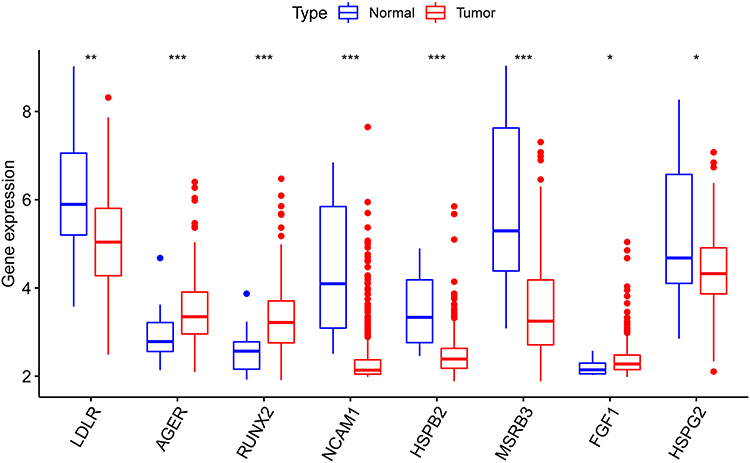 |
Figure 7 The mRNA expression pattern of oxidative stress-associated OS genes in TCGA cohort. (*p < 0.05; **p < 0.01; ***p < 0.001). |
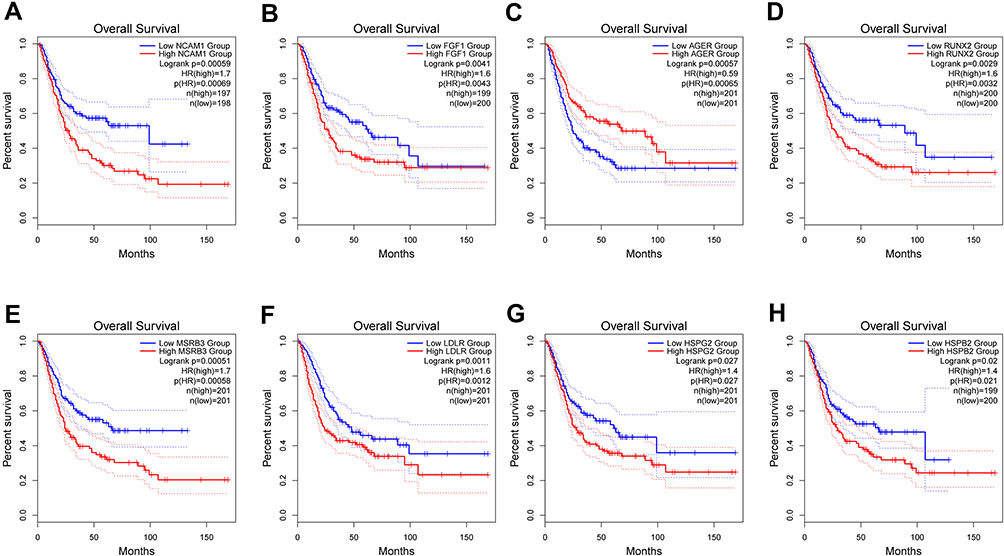 |
Figure 8 GEPIA Survival analysis of NCAM1 (A), FGF1 (B), AGER (C), RUNX2 (D), MSRB3 (E), LDLR (F), HSPG2 (G), HSPB2 (H). |
Evaluation and External Verification of Prognostic Risk Signature Performance
The risk chart shows that the survival rate and survival time of patients in the high-risk group are lower, while the survival rate and survival time of patients in the low-risk group are opposite (Figure 9A-J). Similar results were verified in GSE13507 cohort. These results further proved that our signature effectively distinguished between high- and low-risk patients. Survival curve results indicate that patients in the high-risk group had worse survival outcomes (Figure 10A and C). When time-dependent ROC curves were utilized to assess the risk signature’s discrimination, the risk signature demonstrated good accuracy in predicting 7-year overall survival (Figure 10B). Similar result was observed in the GSE13507 cohort by reaching an AUC of 0.695 at 7 years (Figure 10D), which indicated that this prognostic signature could achieve a more balanced sensitivity and specificity. In both the TCGA and GSE13507 cohorts, the risk score was found to be an independent predictive risk factor in multivariate Cox regression analysis (Figure 10E-H). The signature analyzed using the ROC curve over 5 years showed good predictability in the TCGA and GSE13507 cohort (Figure 10I and J). Moreover, the correlation between risk score and each clinicopathological characteristic was evaluated. We found that the risk score of high-grade tumor or tumor stage III–IV was significantly higher than that of low-grade tumor or tumor stage I–II. Patients with lower tumor grade had significantly superior survival rate than those with higher tumor grade in the TCGA and GSE13507 cohort (Figure 10K-M). The heatmap also revealed that the grade factors were significant differences in TCGA and GSE13507 cohort (Figure 10N and O). Taken together, the OSRGs signature exhibited a good predictive ability in different aspects and might be used as a new predictive tool for BC patients.
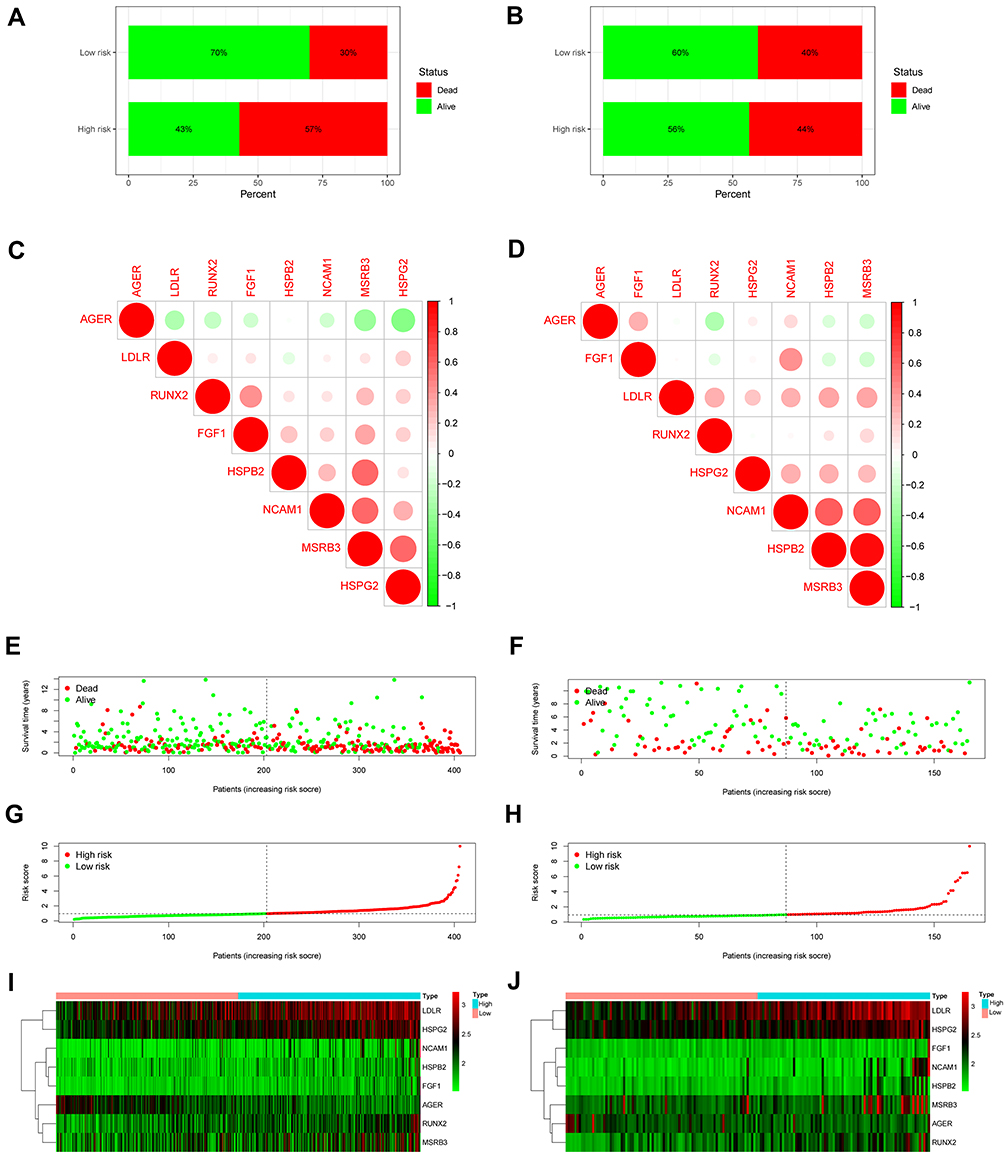 |
Figure 9 Prognostic significance of the oxidative stress-related genes (OSRGs) signature in bladder cancer. (A and B) Patient survival in TCGA and GSE13507 cohort. (C and D) Correlations between the prognostic key genes included in the risk model. Positive and negative correlations are indicated in red and green, respectively. (E and F) Survival time in the high- and low-risk patient groups in TCGA and GSE13507 cohort. (G and H) Patient risk scores in TCGA and GSE13507 cohort. (I and J) Heatmaps of gene expression levels in the risk model for the high- and low-risk groups in TCGA and GSE13507 cohort. |
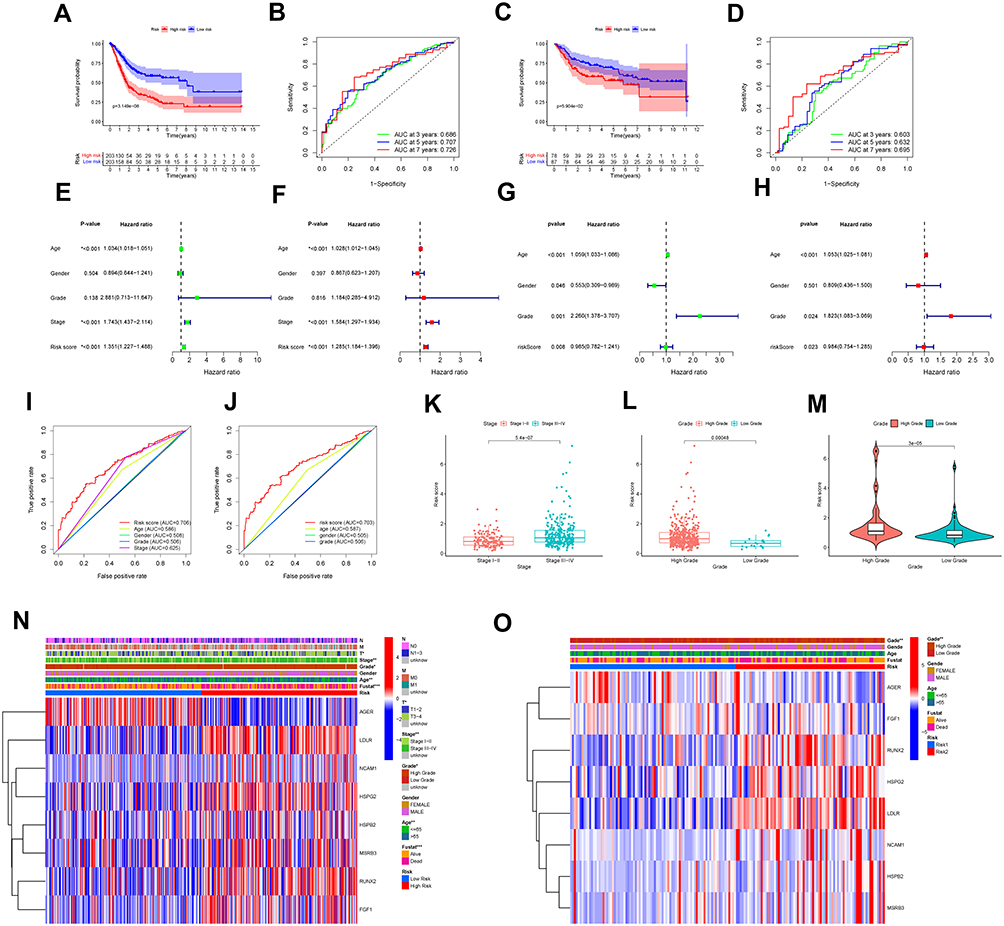 |
Figure 10 Efficacy evaluation of constructed prognostic model. (A) Survival curve of TCGA cohort. (B) TimeROC curves for forecasting overall survival in TCGA cohort. (C) Survival curve of validation cohort. (D) TimeROC curves for forecasting overall survival in validation cohort. Univariate (E) and multivariate (F) Cox regression analysis of the clinicopathological features in TCGA cohort. Univariate (G) and multivariate (H) Cox regression analysis of the clinicopathological features in GSE13507 cohort. ClinicalROC curves of five-years for forecasting overall survival in TCGA (I) and GSE13507 (J) cohort. (K and L) The relationship between the risk scores and different stage as well as different grade in TCGA cohort. The relationship between the risk scores and different grade (M) in GSE13507 cohort. The heatmap shows the distribution of clinicopathological features and OS genes expression in TCGA (N) and GSE13507 (O) set. Columns in blue represent down-regulated genes, columns in red represent up-regulated genes, and columns in white represent unchanged genes. (*p < 0.05; **p < 0.01; ***p < 0.001). |
Performance and Verification of Nomogram
A nomogram was constructed to predict 1-, 3- and 5-year BC overall survival by combining the results of the OSRGs signature with clinical attributes (Figure 11A and B). We assessed the prognostic value of this nomogram using time-dependent ROC analyses. The results demonstrated that the area under the ROC curve (AUC) for 5 years OS was 0.714 and 0.778, respectively (Figure 11C and D), which showed the nomogram plot was accuracy and convenient. From the calibration plots, good calibration was observed in both TCGA and GSE13507 cohorts (Figure 11E-H). The calibration curves and ROC curves demonstrated that the nomogram had great potential to be applied in clinical practice. Our analyses showed that the nomogram was well developed and showed a well accurate value for BC outcomes prediction through discrimination capability evaluation.
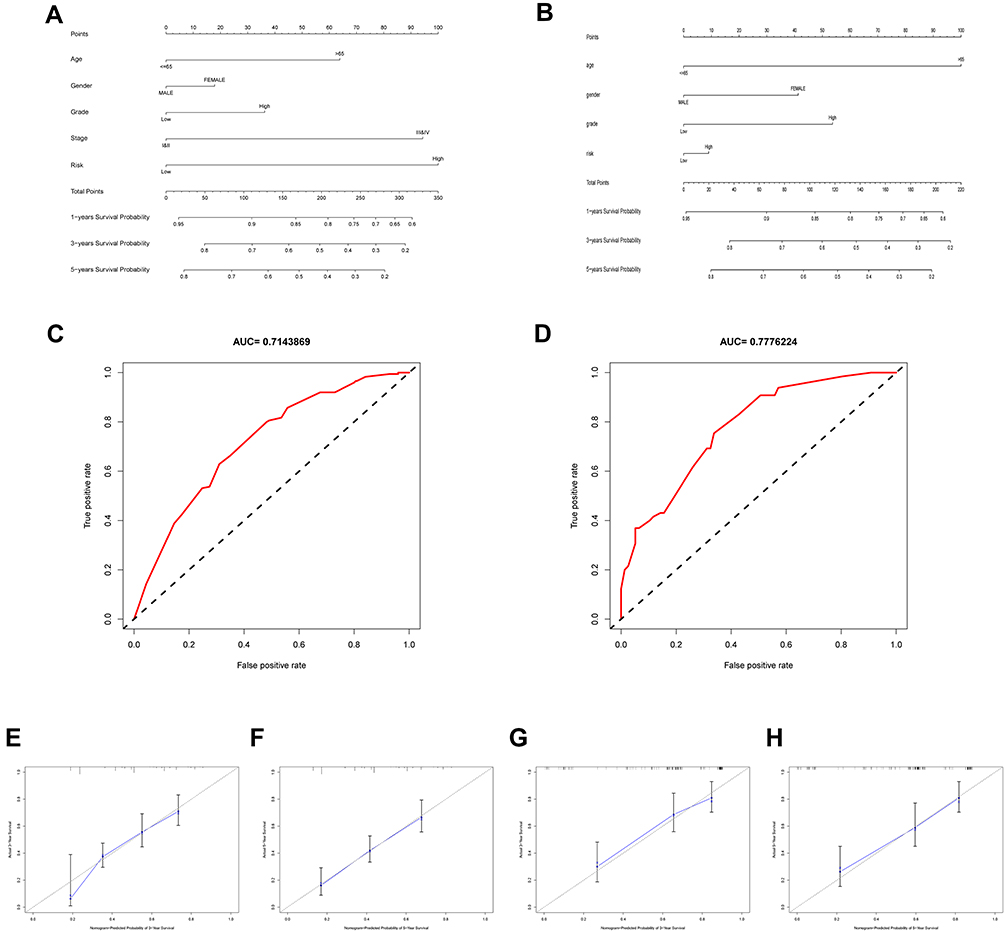 |
Figure 11 Construction of nomogram based on the expression of 8 hub OS genes. Nomogram of risk score and other clinical factors for predicting BC 1-, 3-, and 5-year overall survival in TCGA (A) and GSE13507 (B) cohort. ROC curves showed the predictive efficiency of the risk signature in TCGA (C) and GSE13507 (D) cohort. (E and F) The calibration plot of the nomogram in TCGA cohort. (G and H) The calibration plot of the nomogram in GSE13057 cohort. |
Immune Cell Infiltration and Tumor Microenvironment Analyses
The results of OS gene pathway enrichment analyses in the TCGA database show that inflammation, immunity and other factors related pathways are enriched. Based on these findings, we evaluated the rate of immune cell infiltration in different risk groups. The immune infiltration histogram showed that plasma cells, T cells regulatory (Tregs), macrophages M2 and neutrophils were significant differences in the high- and low-risk group (Figure 12A). Figures 12B-E showed the expression abundance of these four cell types in different groups and the correlation between these cell types and risk scores. Patients with high-risk scores had higher proportions of macrophages M2 and neutrophils, and patients with low-risk scores had lower proportions of plasma cells, T cells regulatory (Tregs), confirming the roles of oxidative stress-related mRNA in the regulation of tumor immune infiltration. Furthermore, the correlation analyses results suggest that both immune score and stromal score had a positive correlation with risk score, and their scores in the high-risk group were higher than those in the low-risk group, which might indicate that higher immune activity was in the high-risk group (Figure 13A-D). In summary, these outcomes revealed that OSRGs signature may significantly inhibit or enhance the expression of specific immune cell types, which may affect the response to immunotherapy.
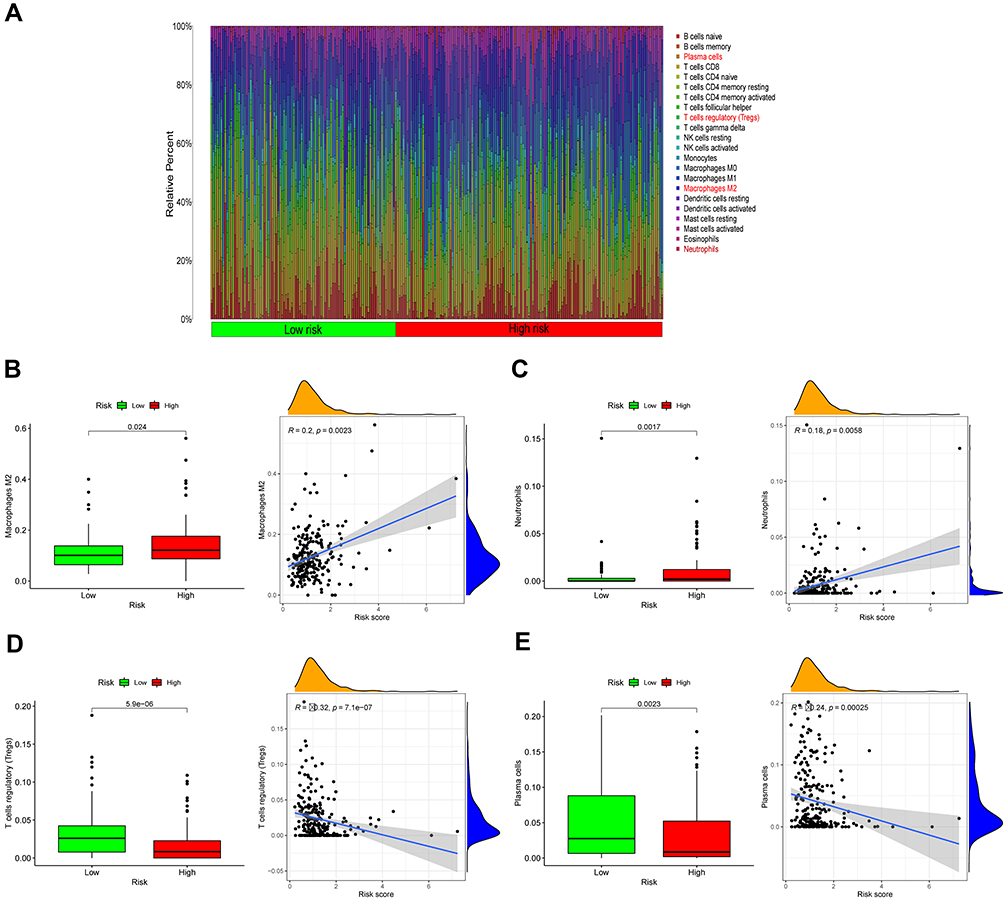 |
Figure 12 Infiltration of oxidative stress-related immune cells. (A) Heat map of oxidative stress risk and immune cell infiltration using in TCGA databases. (B–E) Scatter plots showing the correlations of the expression of eight genes from TCGA and GEO databases with immune cell regulation, showing differences in the expression levels between the different oxidative risk groups (p < 0.05). The blue line in each plot is a fitted linear model indicating the relationship between significantly Immune cells and the risk of oxidative. Pearson coefficients were used to assess the correlation between the two factors. The box plots show the Immune cells whose infiltration is significantly associated with the risk of oxidative (p < 0.05). |
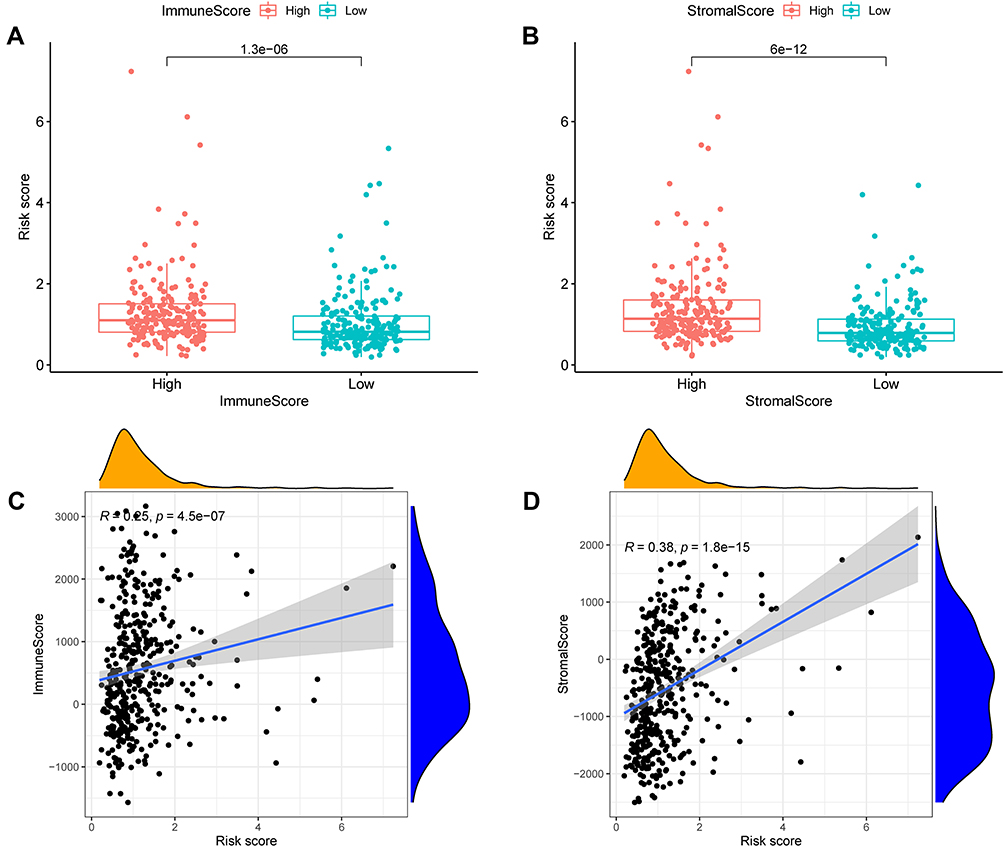 |
Figure 13 Analysis of immune microenvironment. The relationship between risk score of ORSGs signature and immune score (A and C) as well as stromal score (B and D). |
Immune Status, Tumor Stemness, Immune Checkpoint and m6A Genes Analyses
To investigate the correlation of risk scores and immune state. We implemented ssGSEA for the evaluation of enrichment scores of several immune cell subgroups, associated features, and pathways. We found that the content of adc, iDCs, pDCs, APC co-inhibition, APC co-stimulation, HLA and MHC class I antigen presentation process in the TCGA cohort was increased in the high-risk group. In addition, in comparison to the low-risk group, all of these immune cells, related functions and pathways were higher in high-risk group, except for type II IFN response, showing the differences in T cell regulation between high- and low-risk groups (Figure 14A and B). In view of significance immune checkpoint inhibitor-based immunotherapies, investigation of the differential expression of immune checkpoints between the high- and low-risk group were performed. We found a substantial difference in the expression of all these immune checkpoints in the different risk groups (Figure 14C). As expected, the expression levels of PD-L1, PD-1, CTLA4, and LAG3 were considerably greater in the high-risk group than in the low-risk group, as predicted, and the expression levels of these immunological checkpoints were positively associated with the risk score (Supplement File Figure S2A-H). In addition, we found the significant difference of m6A genes expression level of LRPPRC, METTL3, YTHDC1, RBMX, FTO ALKBH5, IGFBP3 and IGFBP2 in the two subgroups above (Figure 14D). Tumor stemness can be measured with RNA stemness score based on mRNA expression (RNAss) and DNA stemness based on DNA methylation pattern (DNAss).30 Spearman correlation analyses between risk score and tumor stem cells showed a risk score was considerable correlation of DNAss and RNAss (Figure 15A and B). We also examined the association between risk scores and immune infiltration to better understand the relationship between risk scores and immunological components. Six types of immune invasion have been identified in human tumors, corresponding to tumor promotion and tumor suppression,31 namely C1 (wound healing), C2 (INF-g dominant), C3 (inflammatory), C4 (lymphocyte depleted), C5 (immunologically quiet) and C6 (TGF-b dominant). Due to the number of BC samples were very small, we were not performed correlative analyses at C5 and C6 subtype. We analyzed the immune infiltration of BC in the TCGA cohort and correlated it with the risk score, showing that the high-risk score was significantly linked with C2 and the low-risk score with C3 (Figure 15C).
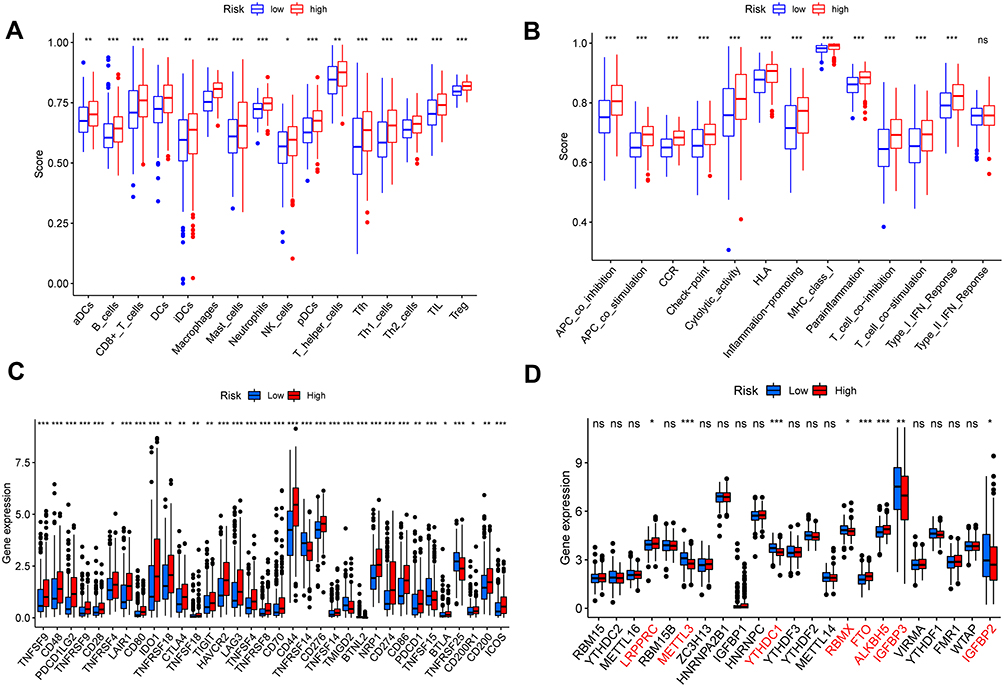 |
Figure 14 Immune status between different risk groups and the association between risk score and tumor microenvironment (A and B). (C) Expression of immune checkpoints among high and low BC risk groups. (D) The expression of m6A-related genes between high and low BC risk group. (*p < 0.05; **p < 0.01; ***p < 0.001). |
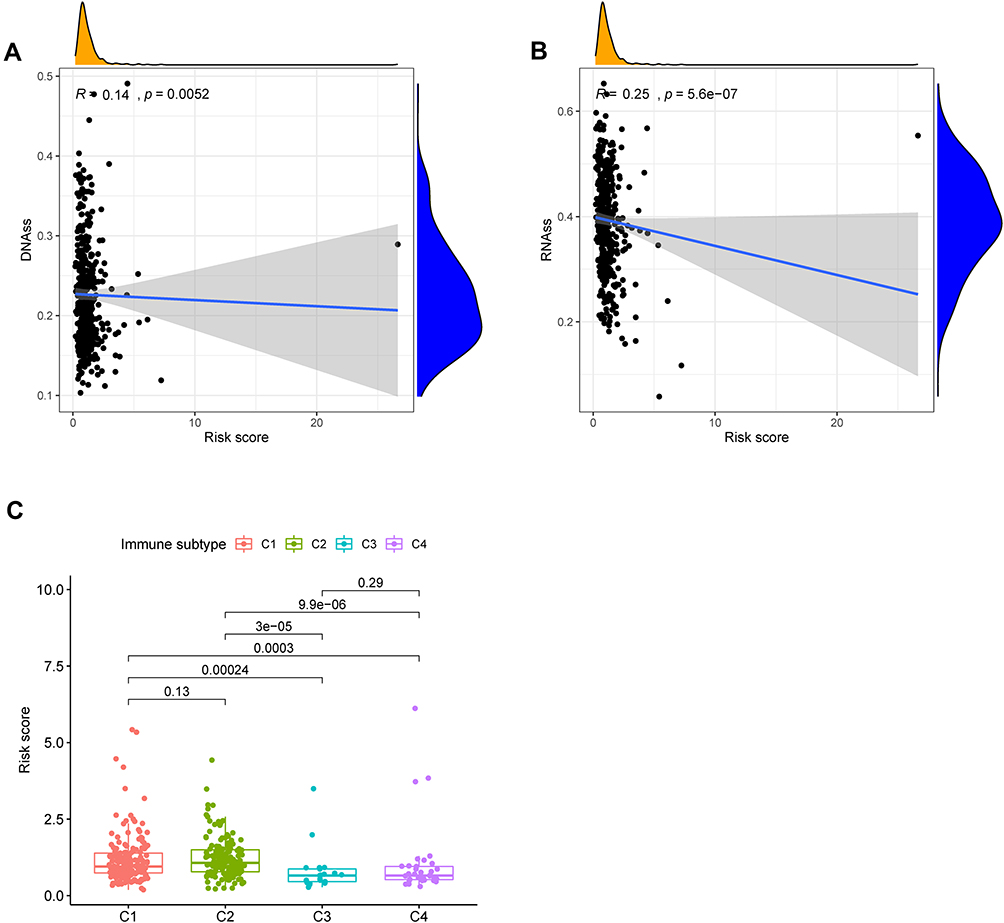 |
Figure 15 The relationship between risk score and DNAss (A), RNAss (B). Comparison of the risk score in different immune infiltration subtypes (C). |
Biological Function and Pathway Analyses
KEGG pathway enrichment analyses shows that the bladder cancer pathway is significantly enriched in the high-risk group. Besides, five GO functions were found to enrich in the high-risk group, the error detection rate < 0.05. GSEA using TCGA data of the Hallmarks gene sets indicated that hypoxia, inflammatory response and TNF-signaling pathway were statistically significant programs (Figure 16A-C).
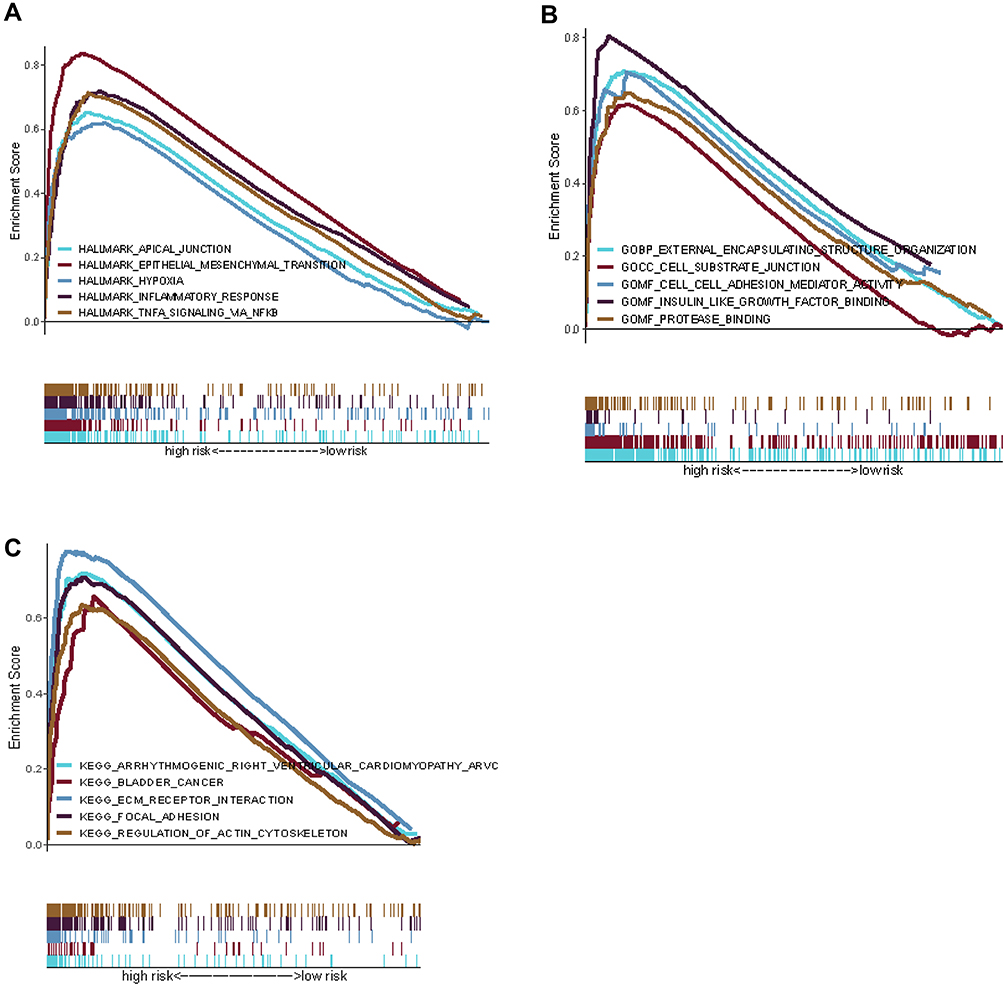 |
Figure 16 Gene set enrichment analysis of biological functions and pathways. (A) Hallmark gene set. (B) GO, Gene Ontology. (C) KEGG, Kyoto Encyclopedia of Genes and Genomes. |
Prognostic Gene Expression and Cancer Cell Sensitivity to Chemotherapy
We investigated the expression of the OS gene in the prognostic center of the NCI-60 cell line, as well as the connection between its level of expression and drug sensitivity. The finding showed that all prognostic genes are linked to the sensitivity of certain chemotherapeutic treatments (Figure 17 and Supplement File Table 2). For example, the increase in HSPG2, FGF1, LDLR and HSPB2 expression is correlated with tumor cells’ response to ifosfamide, oxaliplatin, dexazolidine, etoposide, Belinostat, oxaliplatin, actinomycin D, Mitriamycin, the resistance of methamphetamine, etoposide, etc. is related to the increase. Conversely, enhanced expression of AGER and FGI seems to contribute to the increased drug sensitivity of cancer cells to chemotherapeutic drugs such as Nelarabine, Dexamethasone Decadron, Fludarabine and Zoledronate. The above results suggested that the expression of hub OS genes might affect the sensitivity of tumors to chemotherapy drugs, which provided a new perspective on the treatment of chemotherapy drugs.
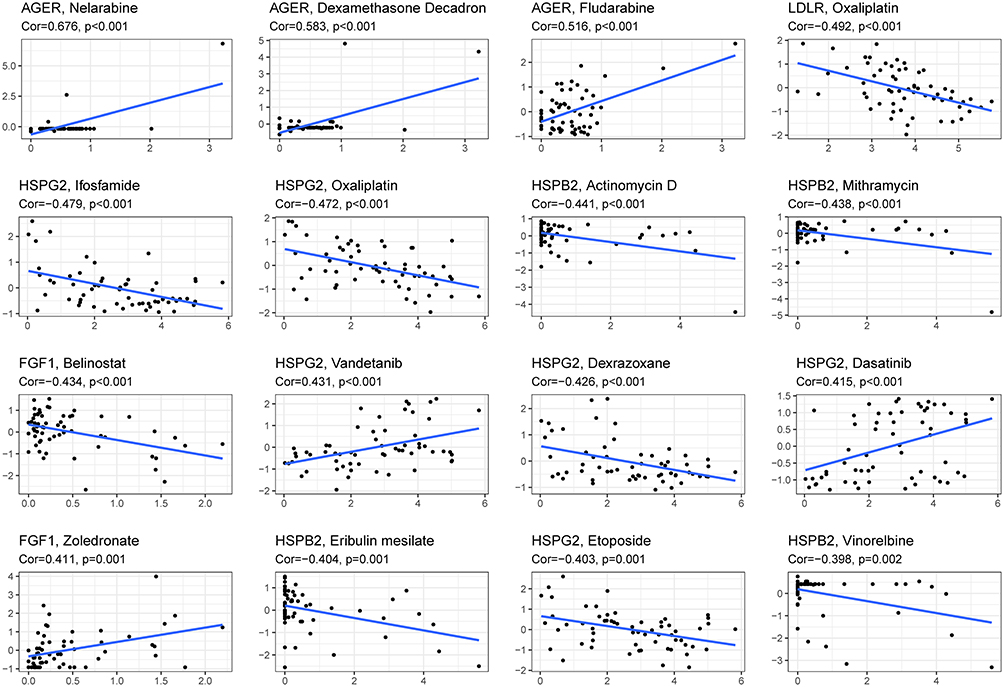 |
Figure 17 Scatter plot of relationship between prognostic hub OS gene expression and drug sensitivity. |
Discussion
With the advancement of high-throughput sequencing and bioinformatics, increasingly bioinformatics methods have been used to identify innovative biomarkers involved in tumor progression,32 survival33 or prognosis34 of malignancies, which might greatly aid the early diagnosis and evaluation of prognosis in malignant tumors. According to recent studies, OS plays an important function in several phases of carcinogenesis and cancer development.35,36 However, little is known regarding OS’s possible prognostic relevance in BC, and the OS gene signature has not been described as a prognostic marker for BC.
This research analyzed the expression of 1399 OS genes in BC and investigated their impact on the overall survival of patients. In total, 379 DEOSGs were discovered from the TCGA cohort, and related biological pathways and PPI networks for these genes were comprehensively identified. The KEGG pathway enrichment analyses revealed that our identified DEOSGs were not only highly related with bladder cancer prognosis, but also played a critical role in a variety of other tumors, including pancreatic cancer, breast cancer, prostate cancer, melanoma, and colorectal cancer, prompting us to investigate the potential role of OS genes in other tumors. Interestingly, KEGG analyses also indicated that the down-regulated DEGs were significantly related to COVID-19. Furthermore, these DEOSGs were found to be considerably enriched in cytokine activity, aging, hypoxia response, and oxidative stress response, among other biological processes. All of the biological processes identified in the enrichment analyses have been shown to be associated with carcinogenesis and progression. As a result, these genes were found to be significantly linked to BC progression and are crucial for a complete understanding of the mechanism of these DEOSGs. In addition, the prognosis-related DEOSGs were screened using univariate Cox, LASSO, and multivariate Cox regression analyses, and a total of seven hub OS genes: RUNX2, FGF1, LDLR, HSPB2, HSPG2, MSRB3, and NCAM1 have all been linked to a poor prognosis in BC patients with the exception of AGER. Using TCGA expression data, the expression patterns of these 8 hub OS genes on the mRNA level revealed that AGER, RUNX2, and FGF1 were overexpressed in BC tissues, while LDLR, NCAM1, HSPB2, HSPG2, and HSPB2 were downregulated. These results could be related to the previously described modulating effects of these genes on BC metastasis and growth. We found that differential expression of eight hub OSRGs is connected with patients’ overall survival and may play a role in the development of BC.
The PCA analyses revealed that these hub genes have good discriminative power. And then we discovered that being in the high-risk group was significantly associated with a poor outcome, being older, having a high grade, being in the advanced T stage, being in stage III–IV, and having a shorter overall survival period, which was consistent with clinical characteristics’ predictive implications on overall survival. Except for AGER, Kaplan-Meier analyses demonstrated that these hub OS genes were inversely related with overall survival in BC patients. This seemed to mean that the higher the overall expression level of these hub OS genes, the worse the patient’s prognosis. In terms of the relationship between risk score and clinical characteristics, a high-risk score was strongly correlated with tumor high grade or tumor stage III–IV, indicating that a high-risk score is unquestionably connected with a poor prognosis. The risk score obtained from this signature was found to be an independent prognostic factor for BC patients in both univariate and multivariate Cox models. Furthermore, time-dependent ROC curve tests demonstrated the risk score prognostic signature’s strong predictive potential as an independent prognostic factor. And the predictive nomogram based these eight OSRGs shows robust performance in the individual predicting PC prognosis compared with the clinical characteristics in BC. We also validated the applicability of the oxidative stress-related risk signature in the GSE13507 cohort. The bioinformatic analyses results showed that the risk signature constructed by eight OSRGs could be used for overall survival prognosis, with good prognostic value and provides new insights into the molecular mechanism of bladder cancer for follow-up studies.
Notably, the intricate interplay between tumor cells and the tumor microenvironment not only plays a critical role in tumor formation, but it also has a substantial impact on immunotherapeutic effectiveness and overall survival.37 Besides, the tumor microenvironment is crucial in the progression of cancer and its response to immunotherapy. Tumor microenvironment is becoming an increasingly popular topic and could affect tumor progression and recurrence.38 Tumor heterogeneity is dependent on cancer cells and the tumor microenvironment, which is made up of many cell types such as immune cells, mesenchymal stem cells, endothelial cells, and fibroblasts.39,40 In cancer progression, cancer cells generally induce an immunosuppressive microenvironment to fight against anticancer immunity and it is also the premise and guarantee of tumor immune escape. Cells and molecules in the tumor microenvironment are dynamic, reflecting the essence of tumor microenvironment evolution, with the end result being that a substantial percentage of immunosuppressive cells, such as myeloid-derived suppressor cells, aggregate in the tumor microenvironment to regulate immune escape, tumor growth, and metastasis, and to influence tumor outcome.28,41,42 A functional enrichment analysis revealed that OSRGs are predominantly engaged in immunological pathways in this research. The quantity of four immune cells, comprising macrophages M2, neutrophils, Tregs, and plasma cells, differed considerably between high- and low-risk groups, validating that OSRGs were contributory in regulating tumor immune infiltration. It is worth noting that Macrophages, a prominent component of the tumor microenvironment, contribute to carcinogenesis by increasing angiogenesis, immunosuppression, invasion, and metastasis.43,44 Previous research has linked an increase in tumor-associated macrophages, neutrophils, and Treg cells to a poor prognosis of patients with BC on account of their function in immunological invasion. In conclusion, the four survival-related cells discovered above have the potential to be key roles in immune infiltration as well as BC immunotherapy, validating the validity of the cell-based analyses of oxidative stress-related genes. Based on the GSEA analyses, tumor-related signal pathways such as Hypoxia, Inflammatory response and TNFα- signaling pathway were significantly enriched, providing new idea of therapy.
In order further explore the relationship between risk score and immune components, a relevant analysis was evaluated. Interestingly, we discovered a substantial correlation between high-risk score and C2 while a low-risk score was clearly related to C3, implying that C2 promotes tumor incidence and progression and C3 is a good preventive factor.
Immune checkpoint blockade (ICB), which includes anti-PD1/PD-L1 and anti-CTLA-4/LAG3 treatments, has proven to be extremely effective in the treatment of human malignancies, particularly solid tumors. Combining immune checkpoint inhibition with immunotherapies such as CTLA-4, LAG3, PD-1, and PD-L1 inhibitors is a potential strategy for treating a range of cancers, and an activated tumor immune microenvironment is associated with excellent immune checkpoint inhibitor treatment outcomes.45,46 Previous research has indicated that anti-PD1/PD-L1 antibody treatments are effective in malignancies with a high mutational load, such as Hodgkin’s lymphoma, melanoma, renal cell carcinoma, non-small lung cancer carcinoma, and urothelial bladder carcinoma.47–52 In our study, we observed enhanced expression of PD-L1 in in the high-risk group, suggesting that patients with high-risk scores may benefit from anti-PD-L1 immunotherapy, the same to other genes signatures and corresponding immune checkpoints. Furthermore, the expression levels of immune checkpoints in the high-risk cohort were substantially greater than those in the low-risk cohort, being agree with our discovery that the positive association between the risk score and the expression level of these four immune checkpoints. And it helps offer novel understanding of tumor immunotherapy. Therefore, the use of biomarkers from OS genes to guide treatment decisions along with development of immunotherapy may benefit the patient. Moreover, increased activities of 16 kinds of immune cells and 12 kinds of immune functions in the high-risk group indicated that patients in the high-risk group were in an immune-active state. As a result, it is fair to conclude that the high-risk group’s anti-tumor immunity is compromised, which may be a contributing factor to its poor prognosis. Researches focused on the N6-methyladenosine (m6A) RNA methylation level and its impact on tumor were increasingly reported over the last few years. In this research, analyzed the different expression level of m6A-related genes in high-risk groups and the low ones and the results indicated that LRPPRC, METTL3, YTHDC1, RBMX, FTO, ALKBH5, IGFBP3 and IGFBP2 were significance.
Cancer stem-like cells (CSCs) can develop from a variety of sources, including long-lived stem or progenitor cells or by dedifferentiation from non-stem cancer cells that convert to CSCs via dysregulation of associated signaling pathways.30 CSCs may possess capability for self-renewal and multipotent differentiation, which leads to drug resistance.53–55 In our study, the risk score was positively correlated with cancer stem-cell-like features (RNAss and DNAss), with the particular mechanism warranting further investigation. According to ESTIMATE algorithm, both immune score and stromal score were positively linked to the risk score, which suggested that the tumor tissue in the high-risk group is heavily invaded by immune cells.
We discovered that higher expression of certain prognostic genes was related with enhanced treatment resistance for a variety of FDA-approved chemotherapeutic medicines by analyzing data from NCI-60 cell lines. Up-regulated expression level of HSPG2, FGF1, LDLR and HSPB2 had been linked to increased drug resistance of cancer cells to Ifosfamide, Oxaliplatin, Dexrazoxane, Etoposide, Belinostat, Oxaliplatin, Actinomycin D, Mitriamycin, Eribulin mesylate, Etoposide, etc. The hub OS genes found for each drug were significantly diverse, suggesting that drug resistance genes are extremely drug-specific. These findings show that some prognostic genes can be utilized as therapeutic targets to overcome treatment resistance or adjuvant medication sensitivity.
The present study aimed to identify whether OSRGs play predictive roles in BC patients. Therefore, all pathologically confirmed bladder cancer samples were included in the analysis without distinguishing between MIBC and NMIBC. There were 165 bladder cancer samples with available clinical data in the GEO cohort, including 103 (62.4%) NMIBC samples and 62 (37.6%) MIBC samples. For the TCGA cohort, there were only four NMIBC samples (1%) in this study. If only MIBC or NMIBC samples were included in the analysis, the patient numbers would have been too small for reliable statistics. Therefore, larger-scale gene sequencing validation studies on NMIBC alone or MIBC alone are needed in the future. It is worth noting that the risk group in the present study was significantly correlated with MIBC or NMIBC status in both the GSE13507 (p = 0.001) and TCGA (p = 0.005) cohorts (Table 3).
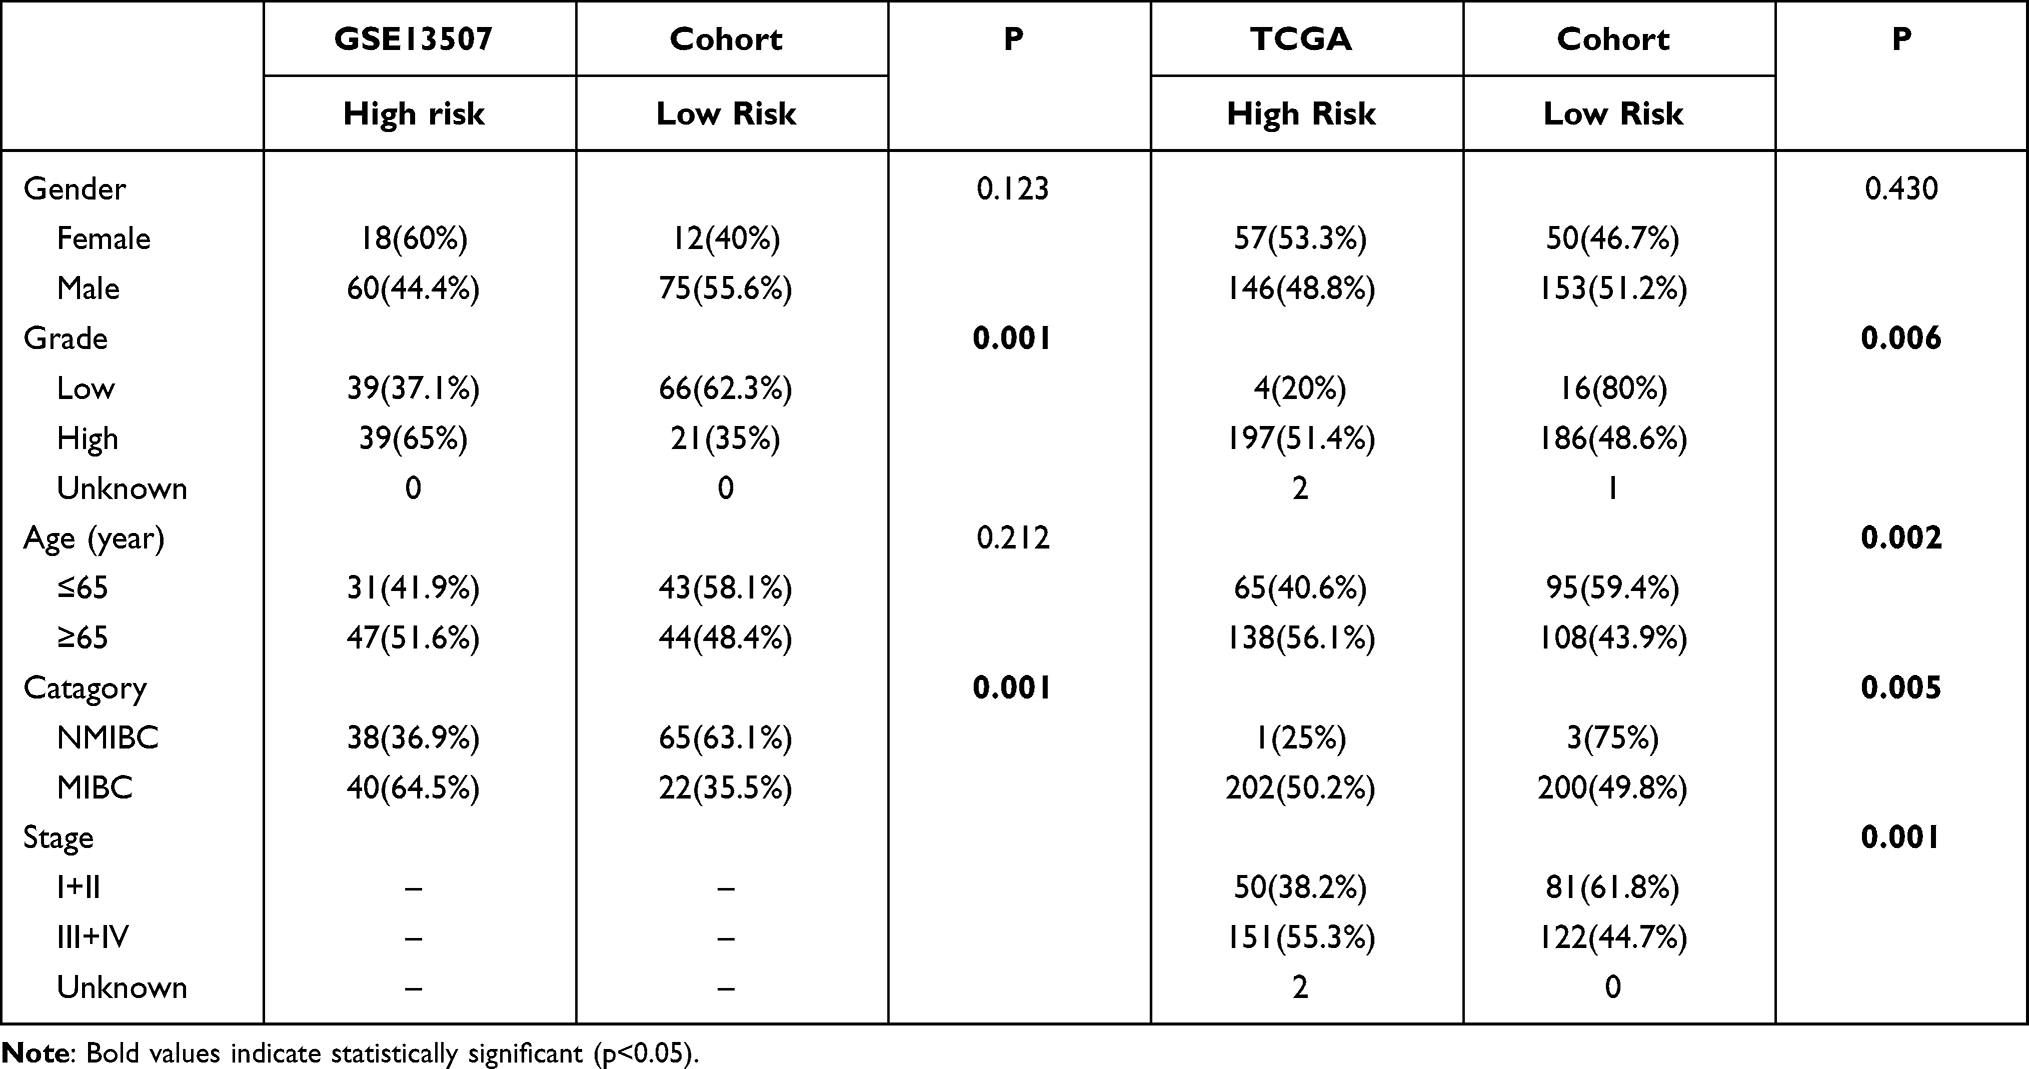 |
Table 3 Patient Characteristics in Different Risk Groups |
Nonetheless, this study has some limitations that should be noted. First, because this study was intended as a retrospective analysis, further prospective investigations should be conducted to validate these findings. Second, there is no in vitro or in vivo testing to corroborate the validity of the mechanistic analyses. Third, since we do not have our own clinical data of BC, although the results in this study have certain credible, they still need to be corroborated with our own clinical data. As a result, a variety of tests will be carried out in the future to establish the molecular links between these genes and BC development.
Conclusion
In summary, we constructed an OSRGs signature for BC to predict prognosis. We established an effective nomogram including eight hub OS genes. Importantly, the OSRGs signature generated in our study might be associated with immune infiltration levels, tumor microenvironment, drug sensitivity and even the efficacy of tumor immunotherapy.
Data Sharing Statement
The data used to support the findings of this study are available from the corresponding author upon request.
Ethics Approval and Informed Consent
All the data in this manuscript comes from public datasets, and the corresponding ethical review has been approved by the first affiliated hospital of Guangxi medical university.
Acknowledgments
The results of this study are based on data from TCGA (https://www.cancer.gov/tcga) and GEO (https://www.ncbi.nlm.nih.gov/geo/) database. We thank the authors who provided the data for this study.
Author Contributions
All authors made a significant contribution to the work reported, whether that is in the conception, study design, execution, acquisition of data, analysis and interpretation, or in all these areas; took part in drafting, revising or critically reviewing the article; have agreed on the journal to which the article has been submitted; and agree to be accountable for all aspects of the work. All authors reviewed the article.
Funding
This work was financially supported by the National Science Foundation of China (Grant No.81960342), the Natural Science Foundation of Guangxi (Grant No. AB19110030), and the Health Department Fund Project of Guangxi Province (No. z20201184).
Disclosure
The authors declare that they have no competing interests in this work.
References
1. Bray F, Ferlay J, Soerjomataram I, Siegel RL, Torre LA, Jemal A. Global cancer statistics 2018: GLOBOCAN estimates of incidence and mortality worldwide for 36 cancers in 185 countries. CA Cancer J Clin. 2018;68(6):394–424. doi:10.3322/caac.21492
2. Dy GW, Gore JL, Forouzanfar MH, Naghavi M, Fitzmaurice C. Global burden of urologic cancers, 1990-2013. Eur Urol. 2017;71(3):437–446.
3. Witjes JA, Bruins HM, Cathomas R, et al. European Association of urology guidelines on muscle-invasive and metastatic bladder cancer: summary of the 2020 Guidelines. Eur Urol. 2021;79(1):82–104.
4. Montie JE. CDC91L1 (PIG-U) is a newly discovered oncogene in human bladder cancer. J Urol. 2005;174(3):869–870.
5. Brown JM, Wilson WR. Exploiting tumour hypoxia in cancer treatment. Nat Rev Cancer. 2004;4(6):437–447.
6. Zhou F, Pan Y, Wei Y, et al. Jab1/Csn5-Thioredoxin Signaling in Relapsed Acute Monocytic Leukemia under Oxidative Stress. Clin Cancer Res. 2017;23(15):4450–4461.
7. Kangari P, Zarnoosheh Farahany T, Golchin A, et al. Enzymatic Antioxidant and Lipid Peroxidation Evaluation in the Newly Diagnosed Breast Cancer Patients in Iran. Asian Pacific j Cancer Prevention. 2018;19(12):3511–3515.
8. Lü JM, Lin PH, Yao Q, Chen C. Chemical and molecular mechanisms of antioxidants: experimental approaches and model systems. J Cell Mol Med. 2010;14(4):840–860.
9. Zhou F, Shen Q, Claret FX. Novel roles of reactive oxygen species in the pathogenesis of acute myeloid leukemia. J Leukoc Biol. 2013;94(3):423–429.
10. Wang JY, Liu GZ, Wilmott JS, et al. Skp2-Mediated Stabilization of MTH1 Promotes Survival of Melanoma Cells upon Oxidative Stress. Cancer Res. 2017;77(22):6226–6239.
11. Oates JC, Gilkeson GS. The biology of nitric oxide and other reactive intermediates in systemic lupus erythematosus. Clin Immunol. 2006;121(3):243–250.
12. Smith J, Tho LM, Xu N, Gillespie DA. The ATM-Chk2 and ATR-Chk1 pathways in DNA damage signaling and cancer. Adv Cancer Res. 2010;108:73–112.
13. Moloney JN, Cotter TG. ROS signalling in the biology of cancer. Semin Cell Dev Biol. 2018;80:50–64.
14. Haqq C, Nosrati M, Sudilovsky D, et al. The gene expression signatures of melanoma progression. Proc Natl Acad Sci U S A. 2005;102(17):6092–6097.
15. Qiu T, Wang H, Wang Y, Zhang Y, Hui Q, Tao K. Identification of genes associated with melanoma metastasis. Kaohsiung J Med Sci. 2015;31(11):553–561.
16. Wu Z, Wang L, Wen Z, Yao J. Integrated analysis identifies oxidative stress genes associated with progression and prognosis in gastric cancer. Sci Rep. 2021;11(1):3292.
17. Qiu X, Hou QH, Shi QY, Jiang HX, Qin SY. Identification of Hub Prognosis-Associated Oxidative Stress Genes in Pancreatic Cancer Using Integrated Bioinformatics Analysis. Front Genet. 2020;11:595361.
18. Zhang Z, Jiang D, Wang C, et al. Polymorphisms in oxidative stress pathway genes and prostate cancer risk. Cancer Causes Control. 2019;30(12):1365–1375.
19. Li W, Gao LN, Song PP, You CG. Development and validation of a RNA binding protein-associated prognostic model for lung adenocarcinoma. Aging. 2020;12(4):3558–3573.
20. Kanehisa M, Goto S. KEGG: Kyoto encyclopedia of genes and genomes. Nucleic Acids Res. 2000;28(1):27–30.
21. Kanehisa M. Toward understanding the origin and evolution of cellular organisms. Protein Sci. 2019;28(11):1947–1951.
22. Kanehisa M, Furumichi M, Sato Y, Ishiguro-Watanabe M, Tanabe M. KEGG: integrating viruses and cellular organisms. Nucleic Acids Res. 2021;49(D1):D545–d551.
23. Szklarczyk D, Gable AL, Lyon D, et al. STRING v11: protein-protein association networks with increased coverage, supporting functional discovery in genome-wide experimental datasets. Nucleic Acids Res. 2019;47(D1):D607–d613.
24. Bader GD, Hogue CW. An automated method for finding molecular complexes in large protein interaction networks. BMC Bioinform. 2003;4:2.
25. Jiang Y, Zhang Q, Hu Y, et al. ImmunoScore Signature: a Prognostic and Predictive Tool in Gastric Cancer. Ann Surg. 2018;267(3):504–513.
26. Heagerty PJ, Zheng Y. Survival model predictive accuracy and ROC curves. Biometrics. 2005;61(1):92–105.
27. Gu HY, Zhang C, Guo J, et al. Risk score based on expression of five novel genes predicts survival in soft tissue sarcoma. Aging. 2020;12(4):3807–3827.
28. Yoshihara K, Shahmoradgoli M, Martínez E, et al. Inferring tumour purity and stromal and immune cell admixture from expression data. Nat Commun. 2013;4:2612.
29. Dib L, San-Jose LM, Ducrest AL, Salamin N, Roulin A. Selection on the Major Color Gene Melanocortin-1-Receptor Shaped the Evolution of the Melanocortin System Genes. Int J Mol Sci. 2017;18:12.
30. Malta TM, Sokolov A, Gentles AJ, et al. Machine Learning Identifies Stemness Features Associated with Oncogenic Dedifferentiation. Cell. 2018;173(2):338–354.e315.
31. Tamborero D, Rubio-Perez C, Muiños F, et al. A Pan-cancer Landscape of Interactions between Solid Tumors and Infiltrating Immune Cell Populations. Clin Cancer Res. 2018;24(15):3717–3728.
32. Wu P, Liu JL, Pei SM, et al. Integrated genomic analysis identifies clinically relevant subtypes of renal clear cell carcinoma. BMC Cancer. 2018;18(1):287.
33. Li S, Liu X, Liu T, et al. Identification of Biomarkers Correlated with the TNM Staging and Overall Survival of Patients with Bladder Cancer. Front Physiol. 2017;8:947.
34. Zhu Z, Jin Z, Deng Y, et al. Co-expression Network Analysis Identifies Four Hub Genes Associated With Prognosis in Soft Tissue Sarcoma. Front Genet. 2019;10:37.
35. Reuter S, Gupta SC, Chaturvedi MM, Aggarwal BB. Oxidative stress, inflammation, and cancer: how are they linked? Free Radic Biol Med. 2010;49(11):1603–1616.
36. Hecht F, Pessoa CF, Gentile LB, Rosenthal D, Carvalho DP, Fortunato RS. The role of oxidative stress on breast cancer development and therapy. Tumour Biol. 2016;37(4):4281–4291.
37. Farkona S, Diamandis EP, Blasutig IM. Cancer immunotherapy: the beginning of the end of cancer? BMC Med. 2016;14:73.
38. Fidler IJ. The pathogenesis of cancer metastasis: the ‘seed and soil’ hypothesis revisited. Nat Rev Cancer. 2003;3(6):453–458.
39. Hanahan D, Coussens LM. Accessories to the crime: functions of cells recruited to the tumor microenvironment. Cancer Cell. 2012;21(3):309–322.
40. Chen DS, Mellman I. Oncology meets immunology: the cancer-immunity cycle. Immunity. 2013;39(1):1–10.
41. Şenbabaoğlu Y, Gejman RS, Winer AG, et al. Tumor immune microenvironment characterization in clear cell renal cell carcinoma identifies prognostic and immunotherapeutically relevant messenger RNA signatures. Genome Biol. 2016;17(1):231.
42. Cooper LA, Gutman DA, Chisolm C, et al. The tumor microenvironment strongly impacts master transcriptional regulators and gene expression class of glioblastoma. Am J Pathol. 2012;180(5):2108–2119.
43. Olingy CE, Dinh HQ, Hedrick CC. Monocyte heterogeneity and functions in cancer. J Leukoc Biol. 2019;106(2):309–322.
44. Poh AR, Ernst M. Targeting Macrophages in Cancer: from Bench to Bedside. Front Oncol. 2018;8:49.
45. Jang N, Kwon HJ, Park MH, Kang SH, Bae YK. Prognostic Value of Tumor-Infiltrating Lymphocyte Density Assessed Using a Standardized Method Based on Molecular Subtypes and Adjuvant Chemotherapy in Invasive Breast Cancer. Ann Surg Oncol. 2018;25(4):937–946.
46. Yang Y. Cancer immunotherapy: harnessing the immune system to battle cancer. J Clin Invest. 2015;125(9):3335–3337.
47. Chen L, Han X. Anti-PD-1/PD-L1 therapy of human cancer: past, present, and future. J Clin Invest. 2015;125(9):3384–3391.
48. Ansell SM, Lesokhin AM, Borrello I, et al. PD-1 blockade with nivolumab in relapsed or refractory Hodgkin’s lymphoma. N Engl J Med. 2015;372(4):311–319.
49. Robert C, Schachter J, Long GV, et al. Pembrolizumab versus Ipilimumab in Advanced Melanoma. N Engl J Med. 2015;372(26):2521–2532.
50. Garon EB, Rizvi NA, Hui R, et al. Pembrolizumab for the treatment of non-small-cell lung cancer. N Engl J Med. 2015;372(21):2018–2028.
51. Brahmer JR, Tykodi SS, Chow LQ, et al. Safety and activity of anti-PD-L1 antibody in patients with advanced cancer. N Engl J Med. 2012;366(26):2455–2465.
52. Powles T, Eder JP, Fine GD, et al. MPDL3280A (anti-PD-L1) treatment leads to clinical activity in metastatic bladder cancer. Nature. 2014;515(7528):558–562.
53. Bao S, Wu Q, McLendon RE, et al. Glioma stem cells promote radioresistance by preferential activation of the DNA damage response. Nature. 2006;444(7120):756–760.
54. Huang Z, Cheng L, Guryanova OA, Wu Q, Bao S. Cancer stem cells in glioblastoma–molecular signaling and therapeutic targeting. Protein Cell. 2010;1(7):638–655.
55. Schonberg DL, Lubelski D, Miller TE, Rich JN. Brain tumor stem cells: molecular characteristics and their impact on therapy. Mol Aspects Med. 2014;39:82–101.
 © 2022 The Author(s). This work is published and licensed by Dove Medical Press Limited. The full terms of this license are available at https://www.dovepress.com/terms.php and incorporate the Creative Commons Attribution - Non Commercial (unported, v3.0) License.
By accessing the work you hereby accept the Terms. Non-commercial uses of the work are permitted without any further permission from Dove Medical Press Limited, provided the work is properly attributed. For permission for commercial use of this work, please see paragraphs 4.2 and 5 of our Terms.
© 2022 The Author(s). This work is published and licensed by Dove Medical Press Limited. The full terms of this license are available at https://www.dovepress.com/terms.php and incorporate the Creative Commons Attribution - Non Commercial (unported, v3.0) License.
By accessing the work you hereby accept the Terms. Non-commercial uses of the work are permitted without any further permission from Dove Medical Press Limited, provided the work is properly attributed. For permission for commercial use of this work, please see paragraphs 4.2 and 5 of our Terms.