")
Back to Journals » International Journal of Nanomedicine » Volume 16
An Isolation System to Collect High Quality and Purity Extracellular Vesicles from Serum
Authors Yang J , Gao X, Xing X, Huang H, Tang Q, Ma S, Xu X, Liang C, Li M, Liao L, Tian W
Received 7 July 2021
Accepted for publication 7 September 2021
Published 29 September 2021 Volume 2021:16 Pages 6681—6692
DOI https://doi.org/10.2147/IJN.S328325
Checked for plagiarism Yes
Review by Single anonymous peer review
Peer reviewer comments 2
Editor who approved publication: Dr Yan Shen
Jian Yang,1,2 Xin Gao,1,2 Xiaotao Xing,1,2 Haisen Huang,1,2 Qi Tang,1,3 Shixing Ma,1,2 Xun Xu,1,2 Cheng Liang,1,2 Maojiao Li,1,2 Li Liao,1,2 Weidong Tian1,2
1State Key Laboratory of Oral Diseases & National Clinical Research Center for Oral Diseases & Engineering Research Center of Oral Translational Medicine, Ministry of Education & National Engineering Laboratory for Oral Regenerative Medicine, West China Hospital of Stomatology, Sichuan University, Chengdu, 610041, People’s Republic of China; 2Department of Oral and Maxillofacial Surgery, West China Hospital of Stomatology, Sichuan University, Chengdu, 610041, People’s Republic of China; 3West China School of Public Health & West China Fourth Hospital, Sichuan University, Chengdu, 610041, People’s Republic of China
Correspondence: Li Liao; Weidong Tian
State Key Laboratory of Oral Diseases & National Clinical Research Center for Oral Diseases & Engineering Research Center of Oral Translational Medicine, Ministry of Education & National Engineering Laboratory for Oral Regenerative Medicine, West China Hospital of Stomatology, Sichuan University, Chengdu, 610041, People’s Republic of China
Tel/ Fax +86-28-85503499
Email [email protected]; [email protected]
Purpose: Extracellular vesicles (EVs) are membrane-encapsulated nanoparticles that function as carriers and play a role in intercellular communication. There are a large number of EVs in the blood and serve as an indicator of pathophysiological conditions. Studies on the basics and application of EVs are hampered by the limitations of current protocols to isolate EVs from blood. However, current isolation methods are difficult to achieve a balance between yield and purity.
Methods: Firstly, we use Sepharose-4B to build a self-made size exclusion chromatography (SEC) column and perform separation and characteristics. Then, we use the SEC column to systematically compare the efficiency with the most common EV isolation methods: Ultracentrifugation (UC) and total exosomes isolation commercial kit (TEI). The EVs isolated through different methods were characterized the yield and size of EVs, analyzed their protein profiles, the morphology and purity were observed under the transmission electron microscope. To further improve the quality and purity, we combined SEC and UC methods and established a two-steps method to isolated EVs from serum.
Results: Self-made SEC column can well separate EVs from complex serum protein, and EVs enriched in the 8– 13 fractions with good morphology and yield. By systematically compare SEC with the commonly used UC and TEI kit, SEC is outstanding in all aspects and balances both isolation purity and yield. However, using the SEC method alone still has certain limitations and residual impurities. The SEC+UC combined method can cleverly solve the shortcomings of SEC and optimize the quality and purity of EVs from serum, which is much better than using one method alone.
Conclusion: Our study presents the combination of size-exclusion chromatography and ultracentrifugation as a feasible and time-saving method to isolate high-quality and purity extracellular vesicles from serum.
Keywords: extracellular vesicles, size-exclusion chromatography, ultracentrifugation, total exosomes isolation, combination methods
Introduction
Extracellular vesicles (EVs) are membrane-encapsulated nanoparticles that are released by all cell types into extracellular space and serving as multicomponent intercellular signaling devices in a diverse range of physiological and pathophysiological processes.1,2 EVs contain diverse cellular molecules such as nucleic acids (DNA, RNA, miRNA) and proteins, and the different states of cells will directly affect the changes in the contents of EVs. EVs are also found in all biological fluids and rendered them attractive as minimally invasive liquid biopsies.3–11 Moreover, the amount of EVs in blood plasma or serum has been estimated between 107 and 1012 EV/mL.12,13 Therefore, EVs presented in the blood have attracted the most interest as novel biomarkers for cancer, kidney, cardiovascular and neurodegenerative diseases.14–19
But a mass of evidence shows that there are a large number of contaminants in the blood including non-vesicles protein complexes and lipoproteins particles like HDL, LDL, and VLDL. And the total number of these contaminant particles is at least 105 fold higher than EVs.20 Due to the similar size, lipoproteins and protein aggregates are co-isolated with EVs.21,22 This may result in contamination in downstream experiments and affect the experimental results. Despite the existence of multiple reports which compare EVs isolation methods, there is currently no agreement on an optimal technique to yield high-purity EVs from blood.16,21,23–26
With the application of different technical methodologies, separation methods based on different principles have been proposed. Taking into account the convenient operation of each method, the easy availability of materials, and the dependence on special equipment, the current separation of blood-derived EVs mainly focuses on the following three methods: Ultracentrifugation (UC), polymer-based precipitation kits, and size-exclusion chromatography (SEC).26–28 UC separates EVs based on different gradients of centrifugal force and has always been the standard method for EVs separation. However, UC still has certain deficiencies in the separation yield and residual other non-vesicular protein complexes and apolipoprotein particles.16,21,29 The polymer-based precipitation method can quickly and conveniently precipitate EVs to obtain the maximum separation yield. However, for the complex components and physical and chemical properties of blood, the non-selective precipitation feature of this method will cause non-EVs serum or plasma protein impurities to be precipitated. Therefore, its separation purity has always been criticized.21,30 SEC has attracted much attention and application for the separation of EVs from blood. SEC does not require centrifugation and the addition of reagents and can quickly obtain high-quality EVs.21,22 However, since based on the principle of size, many apolipoprotein particles, cholesterol, or protein complexes similar in size to EVs are difficult to completely remove by the SEC method. Therefore, the purity of EVs obtained by the SEC is compromised.23,31,32 Due to the heterogeneity and overlapping characteristics with other constituents of biofluids, the separation of EVs with high purity and quality still has certain challenges.
Since it is difficult to balance the separation quality and purity by only one method, the strategy of combining different separation methods has been proposed and proved to be effective in improving separation efficiency and quality. Studies have reported that the combination of UC and the precipitation kit is compared with the precipitation kit alone, and the results show that the combined method significantly improves the separation efficiency.33 Similarly, using a combination of UC and SEC methods also showed better separation results.34,35 Not only limited to the combination of the two methods but a recent study also proposed a three-step protocol to achieve high yield and purity of EVs separation by sequentially using PEG precipitation, iohexol density gradients, and SEC.36 Some combination methods of new technologies and traditional technologies also show good separation performance. For example, the combined ultracentrifugation and Hollow-fiber flow field-flow fractionation (HF5) approach provides native separation of vesicle subtypes.37,38 More and more studies have shown that the combination of different methods can achieve better separation results. However, for clinical and translational application aspects, avoiding the use of complex equipment and tedious operating procedures, and using the combination of existing, easily accessible, and easy-to-operate methods to achieve efficient separation of extracellular vesicles is currently urgently needed.
Although combination methods can improve the isolation effect of EVs, the yield of EVs decreased with the increase of steps. How to simplify the isolation method and increase the yield is a major problem to the basis and application of EVs at present.28 How to effectively isolate EVs from small samples is also needed at present. In this study, we refer to the method of Boing et al39 to build an SEC column with Sepharose-4B. Then, we systematically compared recovery efficiency and purity with SEC, UC, and TEI. Finally, we further used an approach combining SEC and enrichment using UC or TEI, respectively, to optimize separation purity and recovery efficiency.
Materials and Methods
Materials
Sepharose-4B was purchased from Sigma Aldrich (4B200-100mL, CAS:9012-36-6). SEC disposable plastic columns were purchased from Thermo Scientific (29924). PBS was obtained from Servicebio Co., Ltd. (Ca2+-free, Mg2+-free, filtered by 0.1 μm filter membrane, Servicebio, China). MWCO 30 kDa Amicon Ultra Centrifugal Filters was obtained from Millipore (Merck, USA). Ultracentrifugation tubes (13 PA Tube 1.5×9.6 cm, 332901A) and equipment (P40ST swing rotor, himac CP 70MX) were obtained from HITACHI Co., Ltd. (Japan). Total Exosomes Isolation TEI kit was purchased from Invitrogen (from serum, 4478360, Invitrogen, Thermo Fisher Scientific). BCA protein assay kit was obtained from KeyGen BioTECH Co., Ltd. (KGP902, China).
Animals
Animals were obtained from Dashuo Experimental Animal Co. Ltd. (Chengdu, China). All animal experiments were performed according to protocols approved by the Institutional Animal Care and Use Committee (IACUC) at Sichuan University. This study was reviewed and approved by the Committee of Ethics of West China Hospital of Stomatology, Sichuan University. The approval number is NO. WCHSIRB-D-2018-100.
Preparation of Serum Samples
C57BL/6J mice (25–30 g) were anesthetized with 250 mg/kg pentobarbital. The retro-orbital blood collection route was used and can provide moderate to large amounts of blood. The use of retro-orbital bleeding is performed by well-trained personnel. Microhematocrit tubes that hold 50–75 microliters were used to minimize the risk of injury. Only one eye was sampled at any time. Alternate between left and right eyes per session and a maximum of 3 procedures were performed per eye (up to 6 collections total). If injury and/or rupture of the eye or surrounding tissues occurs, the animal was immediately euthanized. Each 25–30 g mouse could get 250–300ul blood per time. The blood was collected in a serum collection tube (367812, BD Vacutainer). Blood samples were centrifuged at 3,000 × g for 15 min at room temperature to remove cells and platelets. Then, the supernatant was collected to new Eppendorf tubes and re-centrifuged at 3,000 × g for 15 min. Finally, the cell-free serum was centrifuged at 10,000 × g for 30 min at room temperature to remove cell debris and large vesicles. Serum samples were used immediately or frozen at −80°C.
Isolation of Serum EVs Using SEC
Isolation of vesicles by SEC was performed as described by Boing et al39 with slight improvements. Succinctly, 10 mL of Sepharose CL-4B (Sigma Aldrich, St. Louis, MO, USA) was packed in 7.0 cm long columns with a diameter of 1.5 cm (29924, Disposable Plastic Columns from Thermo Scientific), and washing the column with 5 column volumes of PBS (Ca2+-free, Mg2+-free, filtered by 0.1 μm filter membrane, Servicebio, China), 5 mM EDTA. The packed chromatographic column needs to be checked for quality by checking whether there are bubbles inside the packed column and measuring the flow rate before each use. The flow rate should be controlled at 55–60s per 0.5mL (If the packing is correct, the flow rate will be within this range). After verification, the flushing eluent containing 1mg/mL BSA is used to pre-equilibrate the column, and then the filtered pure PBS is used to wash the column. After washing, 1 mL serum aliquot was loaded on the SEC column sample tank and immediately start collecting the eluent as Fraction1. 0.5 mL per fraction and a total of 24 fractions were collected as indicated (filtered PBS used as eluent buffer). After collection, flush the column with at least 1.5 column volumes of buffer. If storing the column for future use, the columns were flushed with buffer containing a bacteriostatic agent (0.05% w/v sodium azide), capped, and stored vertically at 4°C. For maximizing yield for comparison experiments and downstream step, EV fractions about 3 mL were pooled and concentrated using MWCO 30 kDa Amicon Ultra Centrifugal Filters (Millipore, Merck, USA).
Isolation of Serum EVs Using UC
1 mL (for characterization experiments) or 3 mL (for SDS-PAGE and Western Blot) platelets-free serum aliquot was diluted with PBS to 3 times the original volume and ultracentrifuged for 60 min at 120,000 × g, 4°C to pellet the EVs (13 PA Tube 1.5×9.6 cm, 332901A, HITACHI, Japan; P40ST swing rotor, himac CP 70MX, HITACHI) according to Théry et al40,41 The supernatant was discarded and EVs were resuspended in PBS for washing. A second UC run was performed for 60 min at 120,000 × g, 4°C. The EV-rich pellet was resuspended to a final volume of 100 μL with PBS and frozen at −80°C.
Isolation of Serum EVs Using TEI Kit
The isolation of EVs by Total Exosomes Isolation TEI (from serum, 4478360, Invitrogen, Thermo Fisher Scientific) was performed as the user guide provided with the product. 1 mL platelets-free serum was diluted with 1 mL PBS and then added 20% volumes of TEI reagent. Mix the serum and reagent mixture by vortexing until there is a homogeneous solution. Incubate the sample at 4°C for 30 min. After incubation, centrifuge the sample at 10,000 × g for 10 min at room temperature. Discard the supernatant and use 100 μL PBS to resuspend the pellets. Keep isolated EVs at −80°C for long-term storage.
SDS-PAGE, Western Blotting, and Protein Concentration Measurement
Protein concentrations were determined by BCA protein assay (KeyGen BioTECH, KGP902, China), according to the manufacturer’s instructions. For total protein analysis, 15 μL of each fraction was mixed with 5 μL fourfold-concentrated reducing sample buffer, boiled for 5 minutes, and loaded on a 10% gradient gel for SDS-PAGE. Proteins were stained with Bio-Safe Coomassie G-250 Stain and detected using a Bio-Rad ChemiDoc imager. A pre-stained protein marker (Bio-Rad) was used as a molecular weight standard.
For Western blotting, proteins were separated either by 10% SDS-PAGE and transferred by electrophoresis to PVDF membranes (Millipore, Billerica, MA). The blots were blocked for 1 h in PBS containing 0.1% Tween-20, and 5% non-fat milk powder, and incubated overnight with antigen-specific antibodies in the same buffer. CD9 was detected using rabbit anti-mouse CD9 (220642, Zen Bio, 1:1000); CD63 with rabbit anti-mouse CD63 (510953, Zen Bio, 1:1000); CD81 with rabbit anti-mouse CD81 (381296, Zen Bio, 1:1000); apoA1 with rabbit anti-mouse apoA1 (381145, Zen Bio, 1:1000); Albumin with rabbit anti-mouse Albumin (ab207327, Abcam, 1:1000). Primary antibodies were labeled for 1 h with HRP-conjugated goat anti-rabbit Ig (ab205718, Abcam, 1:10,000). HRP was detected with High-sig ECL Western Blotting Substrate (Tanon,180-501) using a Bio-Rad Chemidoc imager. Relative signal intensities were determined using Bio-Rad image lab 5.1 software. All antibodies used revealed specific protein signals as determined by appropriate molecular weights.
Nanoparticle Tracking Analysis (NTA)
The particle concentration and size distribution of extracellular vesicles were determined by NTA using Particle Metrix Zeta View® Nanoparticle Tracking Analysis (Particle Metrix, Germany). The experiment operation is as described in the manufacturer’s manual. The samples are diluted 1:100–1:10000 in ultrapure water. All samples were measured in duplicate and using the same instrument settings. The samples were measured for size and concentration in scatter mode (488 nm laser) and the resulting videos were analyzed with the Zeta View® software 8.05.11 (Particle Metrix, Germany).
Transmission Electron Microscopy (TEM)
For TEM, ~2 μL of each sample droplet was placed and adsorbed on Formvar-carbon electron microscopy grids, incubated for 10 min at room temperature to allow non-specific particle binding. Subsequently, the grids were washed with MilliQ water. After washing, the grids were transferred to a drop of uranyl acetate solution, pH 7 for ~3 min. Excess fluid was removed using filter paper and the grids were dried on air. Samples were imaged using a Jeol 1010 electron microscope (JEM-1400PLUS, Jeol Ltd, Peabody, USA).
Statistical Analysis
Experimental results were statistically analyzed using unpaired t-test. All the statistical analysis was performed using the software package GraphPad Prism 8.4.0 and values of α=0.05 were used for hypothesis testing as statistically significant levels. The data in the graphs are presented as mean±SD. *p≤0.05; **p≤0.01; ***p ≤ 0.001.
Results
SEC Column Efficiently Separate EVs from Serum Protein
The Schematic diagram shows the procedures of the SEC isolation method and downstream characteristics (Figure 1A). To determine the fractions of EV particles and verify that the SEC method can effectively isolate EVs from serum, we collected 24 eluent fractions, detected the particle concentration and protein concentration of each fraction by Nanoparticle Tracking Analysis (NTA) and BCA protein assay. The distribution of proteins and EV particles in all 24 fractions shows that EV particles can be well separated from serum proteins by SEC (Figure 1B). As seen from Figure 1B, EV particles are concentrated in 8–13 fractions and the protein concentration is relatively low. From the 14th fraction, the concentration of EV particles is reduced, and the protein concentration is significantly increased. To directly visualize the efficacy of SEC to separate vesicles from serum proteins, all collected fractions were loaded for gel electrophoresis. Proteins became detectable from 11 fractions, but the bulk of the protein elutes from fraction 15 onwards (Figure 1C), which is consistent with the protein distribution curve in Figure 1B. Furthermore, we identified the markers of EV and serum contaminations by Western Blot in 8–13 fractions and 14–24 fractions respectively. The EV markers CD9 and CD81 are highly expressed in 8–13 fractions, but low or undetected in 14–24 fractions. Conversely, apoA, as a contaminant marker for apolipoprotein particles in serum, and albumin was highly expressed in 14–24 fractions (Figure 1D). Transmission electron microscopy (TEM) was used to observe the collected EV fraction. As seen from Figure 1E, it can be observed that fractions 9–11 contained structures of EV, with a characteristic cup-shaped appearance (the white arrow indicated). Besides, homogeneously smaller solid spherical structures could be discerned, which are characteristic of lipoprotein particles. The protein highly enriched fraction 20 was also observed (Figure 1E). However, the image of fraction 20 shows a blurry and thick protein layer and it is difficult to find the existence of vesicles. Based on the above results, it can be concluded that the self-made SEC column can well separate EVs from complex serum protein, and EVs are enriched in the 8–13 fractions with good morphology.
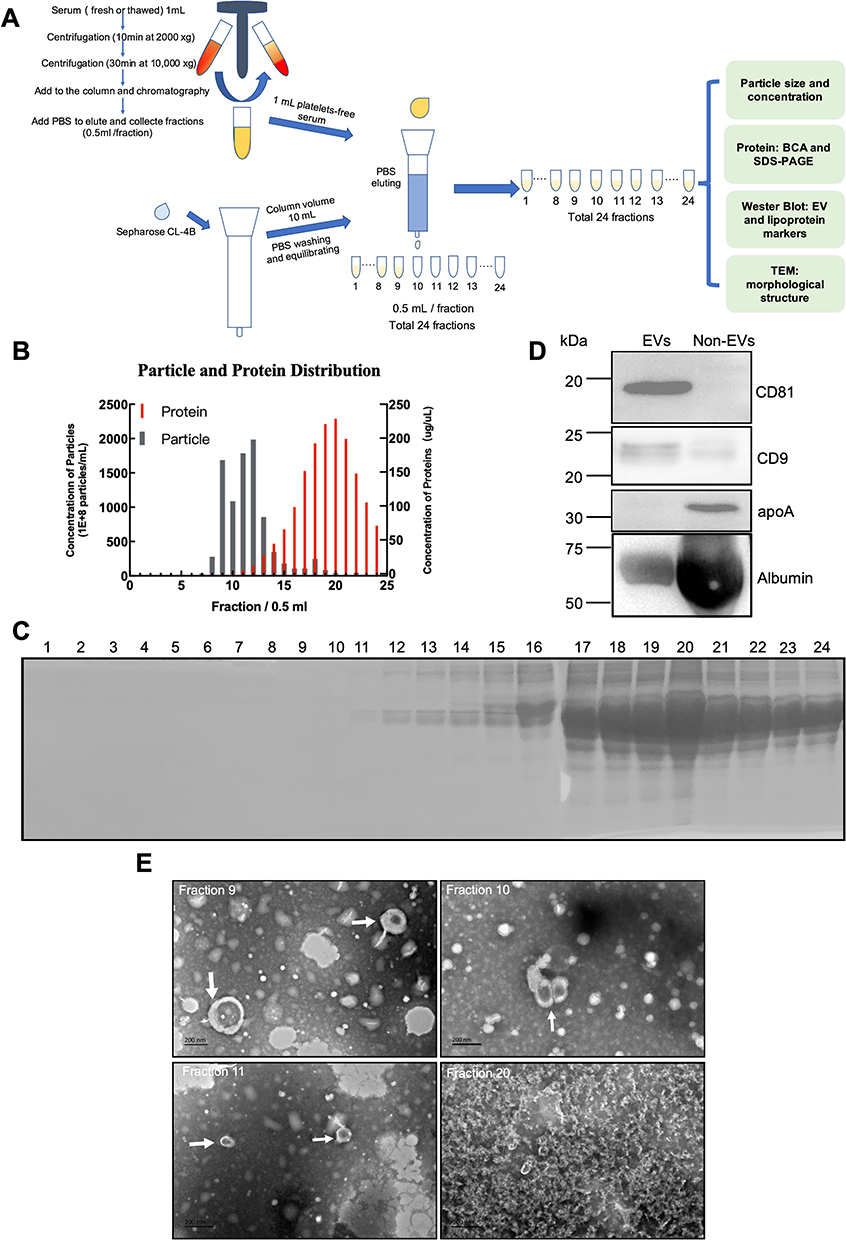 |
Figure 1 Procedures and characteristics of SEC for separating EVs from serum. (A) Schematic overview of the experimental workflow. (B) Concentrations of particles and proteins in the SEC fractions were determined with nanoparticle tracking analysis (gray) and BCA (red), respectively. Data shows all 24 fractions. (C) SDS-PAGE was used to determine to directly visualize the relative presence of proteins in the all collected fractions, 15 μL of each fraction was mixed with 5 μL 4-fold concentrated reducing sample buffer, boiled for 5 minutes, and loaded on a 10% gradient gel. (D) The presence of the vesicle marker CD9, CD81, and the serum contaminant protein albumin and apolipoprotein marker apoA were determined in pooled EVs concentrates of fractions 8–13 and pooled Non-EVs concentrates fractions 14–24 with Western blot. (E) Droplets of fractions 9–11 and 20 were loaded onto grids, negative stained, and evaluated with transmission electron microscopy (TEM). Examples of EV-like structures (cup-shaped) are indicated by white arrows. Scale bars are 200 nm. |
SEC Well Balance the Yield and Purity Compared with UC and TEI Methods
To analyze the yield and purity of different methods, we compare SEC with the commonly used ultracentrifugation and Total Exosomes Isolation (TEI) kit (Invitrogen by Thermo Fisher Scientific, USA). To systematically compare recovery efficiency, an equal initial volume of platelet-free serum was used for each isolation method and rendered a final volume of 100 μL (see Figure 2A for a schematic representation). The EVs pellets collected by UC were invisible by the naked eye and yielded only 0.05 ± 0.02 mg protein per mL serum, TEI-induced EVs pellets were visible and yielded as much as 2.6 ± 0.4 mg protein per mL serum. The yield of EVs protein obtained by SEC was 1.2 ± 0.01 mg protein per mL serum which is between UC and TEI (Figure 2B). UC, SEC and TEI yield 4.4 × 10¹⁰, 1.3 × 10¹², and 2.4×10¹² particles per mL serum, respectively, as determined by NTA (Figure 2C). Moreover, we compare the three methods with the ratio of particle to protein, and the results show that SEC has outstanding recovery efficiency (Figure 2D). According to the measurement by NTA, those particles may be in the range of 70–200 nm and may represent EV. SEC-EVs have the smallest particle size of 85 nm, and the particle sizes of UC-EVs and TEI-EVs were similar, at 112 and 117 nm, respectively (Figure 2E). The relative protein yield of these three methods was also confirmed by SDS-PAGE followed by staining with Bio-Safe Coomassie G-250 (Figure 2F). As seen from Figure 2F, the content of EV protein isolated from 1mL pallets-free serum by UC is very low, and the band is not distinct. So, to effectively compare, we tried to use 3 times the original volume of serum to isolate the same final volume of EVs by UC (Figure 2F). EV proteins yielded by UC and TEI have distinct bands, but the electrophoretic bands are uneven due to the residual contaminants such as carbohydrates and albumin in the SEC collected component (Figure 2F). Also, the EV markers CD9, CD63, and CD81 were highly expressed in SEC-EVs. The expression of EV markers isolated by UC from the initial serum volume of 1mL was very low or even unexpressed. The expression level was obvious after being isolated from 3 times the initial volume of serum, but the expression level in CD63 was still very low. The EVs yielded by TEI normally expressed CD9 and CD63, but CD81 was not detected (Figure 2G). Conversely, apolipoprotein particles marker apoA was collected more by TEI than UC and SEC. The serum marker albumin has obvious residues in TEI and SEC (Figure 2G). All these three methods yielded EVs contained structures reminiscent of EV, with a characteristic cup-shaped appearance (the white arrow indicated) (Figure 2H). However, the image of UC-EVs has a relatively clean background under electron microscopy, and the apolipoprotein is rare. The image of SEC-EVs has many vesicles similar in shape and size to EV may be apolipoprotein particles. The image of TEI-EVs has the most complex background, and there are a large number of solid particles, consistent with the biochemical data. (Figure 2H). Overall, TEI harvests a high yield of protein and particles. But based on TEM and biochemical results, TEI is difficult to remove apolipoproteins and albumin, so the separation purity of TEI is unsatisfactory. UC method has better separation purity, but low protein and particle yield is its shortage. By contrast, SEC is outstanding in all aspects and balance both isolation purity and yield.
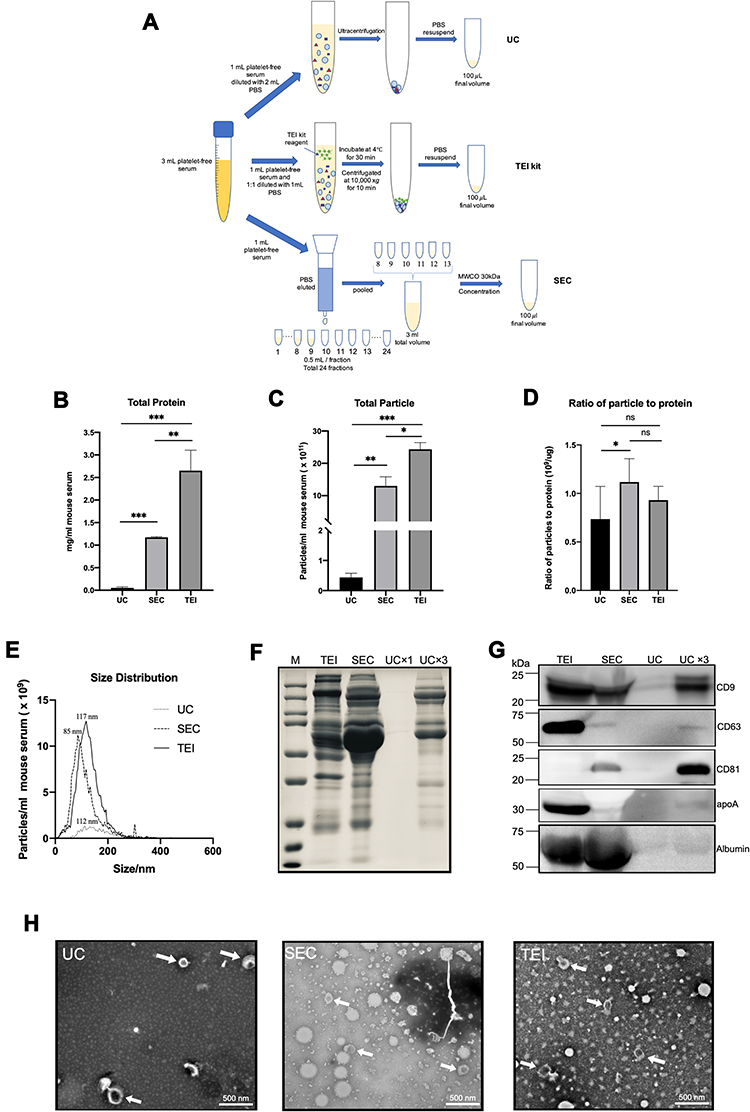 |
Figure 2 Systematically compare the separation efficiency of SEC, UC, and TEI. (A) Schematic overview of the experimental workflow. (B) total protein was determined by BCA (expressed as mg/mL originating serum; mean ± SD, n = 3). (C) the concentration of particles as detected by NTA (particles/mL originating serum; mean ± SD, n = 3). (D) the ratio of particle to protein for SEC, UC, and TEI. (E) size distribution of particles detected in C (representative for n = 3). The particle size at peak optimum is indicated. (F) samples were analyzed by SDS-PAGE followed by Bio-Safe Coomassie G-250. (G) the same samples were analyzed by Western blotting for the presence of the EV markers CD9, CD81, CD63, and the serum contaminant protein albumin and apolipoprotein marker apoA. The experiment shown is representative of 3 independent experiments. (F and G) SEC, TEI, and UC samples are all separated from equivalent volumes of 1mL originating serum, and the final volume is 100 μL. UCx3 samples were separated from 3mL originating serum, and the final volume is 100 μL. All samples were loaded on equal volumes for electrophoresis. (H) The whole amount of TEM images of particles collected by SEC, UC, or TEI. Examples of EV-like structures (cup-shaped) are indicated by white arrows. Scale bars are 500 nm. Data were used for comparative analysis and presented as columns with bars representing means ± SD. Marks: *p≤0.05; **p≤0.01; ***p≤0.001 and non-significant differences were indicated using ns symbol. |
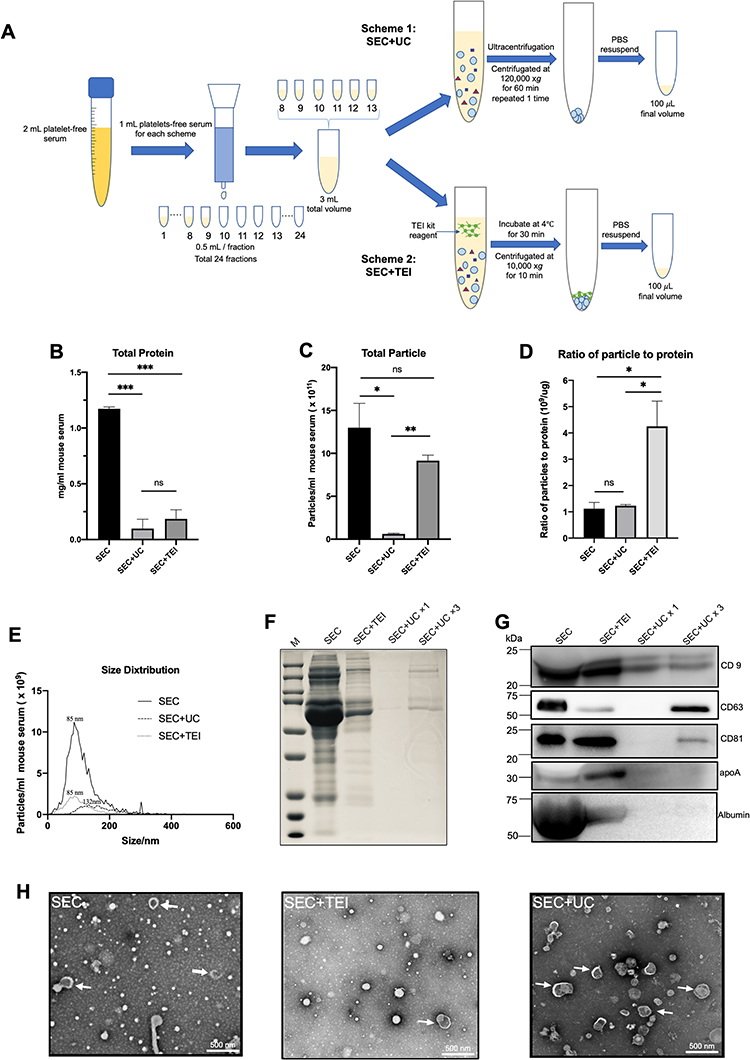 |
Figure 3 Comparison of two different combination methods and SEC. (A) Schematic overview of the experimental workflow. (B) total protein was determined by BCA (expressed as mg/mL originating serum; mean ± SD, n = 3). (C) the concentration of particles as detected by NTA (particles/mL originating serum; mean ± SD, n = 3). (D) the ratio of particle to protein for SEC, SEC+UC, and SEC+TEI. (E) size distribution of particles detected in C (representative for n = 3). The particle size at peak optimum is indicated. (F) samples were analyzed by SDS-PAGE followed by Bio-Safe Coomassie G-250. (G) the same samples were analyzed by Western blotting for the presence of the EV markers CD9, CD81, CD63, and the serum contaminant protein albumin and apolipoprotein marker apoA. The experiment shown is representative of 3 independent experiments. (F and G) SEC, SEC+UC, and SEC+TEI samples are all separated from equivalent volumes of 1mL originating serum, and the final volume is 100 μL. SEC+UCx3 samples were separated from 3mL originating serum, and the final volume is 100μL. All samples were loaded on equal volumes for electrophoresis. (H) The whole amount of TEM images of particles collected by SEC, SEC+UC, or SEC+TEI. Examples of EV-like structures (cup-shaped) are indicated by white arrows. Scale bars are 500 nm. Data were used for comparative analysis and presented as columns with bars representing means ± SD. Marks: *p≤0.05; **p≤0.01; ***p ≤ 0.001 and non-significant differences were indicated using ns symbol. |
SEC+UC Combined Method Achieves the Optimization of Quality and Purity
In the previous comparison, we found that the SEC method well balanced the purity and yield. But SEC still has some shortcomings that need to be improved. As seen from the biochemical results in Figure 2F and G that SEC is difficult to completely remove albumin and other impurities like carbohydrates in the serum. But UC can solve the shortcoming of SEC. Therefore, we consider combining these methods. First, SEC is used to separate vesicles from protein components, and then UC or TEI is used to enrich the EVs separated by SEC to solve optimize separation efficiency and purity (see Figure 3A for a schematic representation).
From the results, compared with using SEC alone, the amount of EVs protein obtained by SEC+UC and SEC+TEI was significantly reduced, which were 0.1 ± 0.07 and 0.19 ± 0.06 mg protein per mL serum, respectively. The results of particle concentration detection by NTA showed that SEC+UC obtained 6.1×10¹⁰ and SEC+TEI obtained 9.2×10¹¹ particles per mL serum, both of which were lower than SEC alone (Figure 3B and C). We can see from the result of SDS-PAGE electrophoresis that the combined method solves the problems of impurities residues that exist when SEC is alone, and the bands are distinct (Figure 3F). For the particle size distribution results, SEC+TEI and SEC alone have the same particle diameter of 85nm, while the particle diameter obtained by the SEC+UC method is 132nm (Figure 3E). Since the amount of EV protein obtained from 1 mL of platelet-free serum through the SEC+UC method is relatively low. We also expanded the serum sample volume by 3 times for the experiment. The results of the Western blot showed that SEC+UC and SEC+TEI both expressed EV markers CD9, CD63, and CD81. Unfortunately, seen from albumin and the apolipoprotein marker apoA, the combined method of SEC+TEI did not remove the contaminant proteins albumin and apolipoprotein particles. But the SEC+UC method has better performance (Figure 3G). Similarly, we observe the isolated EVs by TEM. Surprisingly, although the results of protein and particle content show that SEC+UC isolates the least yield of EVs from 1mL serum, abundant vesicle aggregation was observed under the electron microscope, and they all showed a characteristic cup-shaped appearance of EV. And compared with SEC alone, the background of SEC+UC is clean, and the number of vesicles under the same scale is also large. It may be due to the centrifugal force of ultracentrifugation that caused vesicles to aggregate. This also explains the result of NTA’s detection of particle size (Figure 3D) that the SEC+UC method has a relatively high particle diameter (Figure 3H). For the ratio of particle to protein, the separation efficiency of the SEC+UC method is higher than that of SEC alone. The ratio of the SEC+TEI method is significantly high, however, based on the analysis of Western Blot and TEM results, this method cannot remove the apolipoproteins, which leads to a high ratio of particle to protein. This also shows that this ratio is not a good indicator of purity (Figure 3D).
In summary, our results show that the SEC+UC combined method can separate EVs with high quality and purity from serum. The combination of the two methods can optimize the quality and purity of EVs, which is much better than using one method alone.
Discussion
How to effectively isolate extracellular vesicles and simplify the isolation process has always been a problem faced by the current research and application of EVs. In this report, SEC, UC, and TEI were compared for purifying EVs from blood serum. Table 1 summarizes and evaluates the results of all the above methods. Our comparison results show that SEC and TEI can obtain high-yield EVs, but the purity is inferior to UC. However, due to the limitations of NTA and BCA, EVs cannot be distinguished from other apolipoprotein particles, and the profile of measured particle number and protein concentration cannot be an accurate evaluation indicator for the purity and yield of EVs. By Western Blot analysis of apolipoprotein marker apoA, it was excess in the TEI-EVs. Through TEM observation, it was also found that non-vesicle impurity particles also existed in SEC-EVs. Our results in Figure 2F also showed that SEC-EVs contained some soluble impurities, which was consistent with the results of the published article by Baranyai et al.42 And these soluble factors are more in SEC-EVs than UC-EVs and TEI-EVs. This also further shows the advantages of the UC method over SEC for the separation of blood EVs. Due to its simplicity and commercial availability, the precipitation kit is quite popular. However, this technique is generally not recommended on account of the low purity achieved.
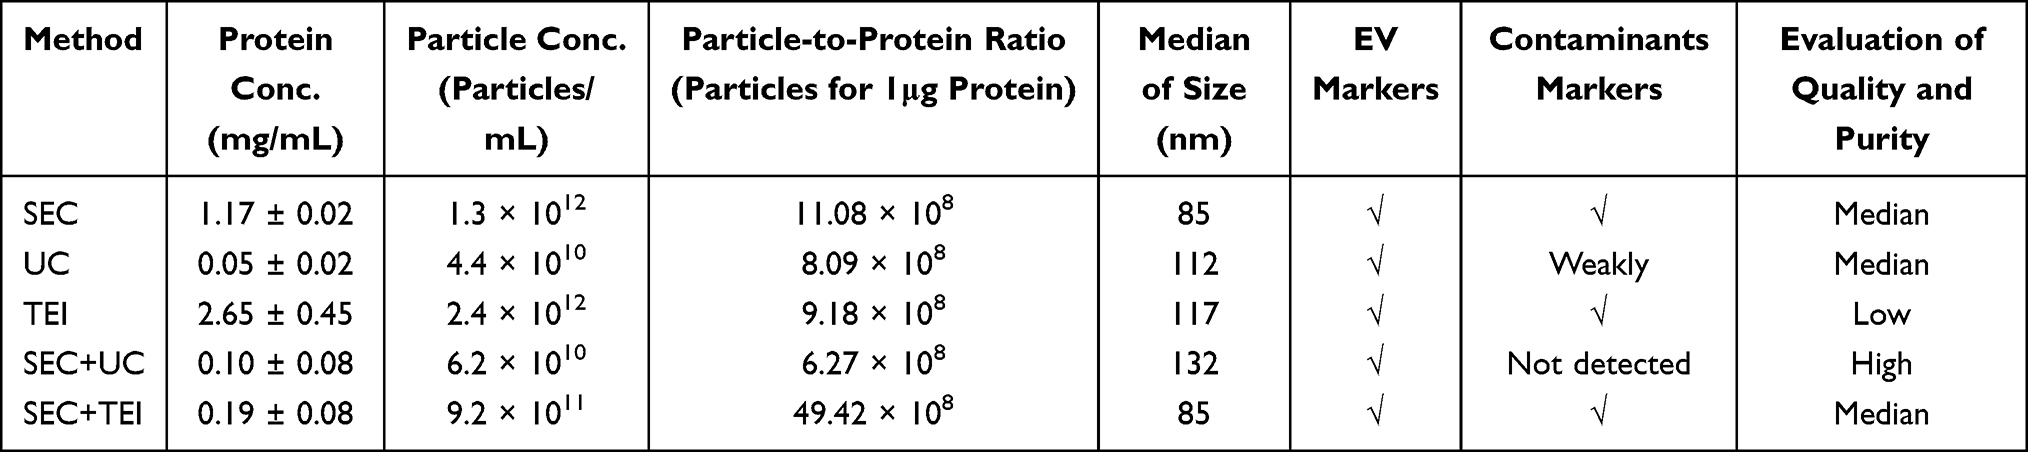 |
Table 1 Summarizes and Evaluates the Results of All the Above Methods |
May by the reason of the complex physical and chemical properties of blood make the isolation of EVs more difficult. Some newer techniques such as field flow fractionation and microfluidics have been reported to achieve isolation of EVs and appear promising, but require expensive, specialized equipment, and are relatively low output limited the use. Some other studies have suggested that the combined use of multiple different methods can effectively improve the separation purity of EVs. However, it is not difficult to consider that as the combined operation steps of the method increase, it will inevitably lead to a decrease in the amount of EVs obtained. Therefore, how to simplify the isolation operation steps and effectively improve the recovery efficiency is a problem that needs to be solved at present.
In the evaluation of separation methods, which of quantity and quality is the more important factor. We believe that purity and yield are inherently contradictory, and it is difficult for the existing technology to achieve perfect yield and purity. For this reason, the purpose of our research is to find a way to balance yield and purity, ensuring that there is a certain amount while optimizing purity. Refer to the information in Minimal information for studies of extracellular vesicles 2018 (MISEV2018), which recommends that the SEC method can achieve intermediate recovery and specificity.28 Therefore, we choose SEC as candidate acceptable In our comparison results, SEC has the best separation efficiency and balances yield and purity. However, it is necessary to solve the problems of the apolipoprotein particles and soluble impurities. Interestingly, comparing UC and SEC, we found that UC can solve the shortcomings of SEC. Therefore, we chose to use the combination of SEC and UC to solve the shortcomings of SEC. To compare the separation effect of the combined method more intuitively, we have made two combined methods of SEC+UC and SEC+TEI. At the same time, to keep the operation steps consistent and reduce the reduction in yield caused by the increase in steps, we did not use the 30kDa filter for concentration in the combined method. However, we found from Figure 3G that the apolipoprotein residue used by SEC alone is less than that of the SEC+TEI combination. This shows that the 30kDa filter used in SEC alone can remove some apolipoprotein particles. But also, it can be found that the 30kDa filter does not reduce the content of albumin (~60kDa). Our results show that the combination method SEC+UC will inevitably cause a decrease in the amount of protein and particles. Although the increase in steps will lead to a decrease in the quantity, the purity can be optimized and the number of vesicles is within the acceptable range, and the ratio of particle to protein shows that SEC+UC has a better recovery efficiency than the method using SEC alone. At present, blood-derived extracellular vesicles have good application prospects in clinical applications such as liquid biopsy and detection of markers for various diseases.43,44 The application of disease marker detection has higher requirements for the purity of the isolated extracellular vesicles than the quantity. Therefore, SEC+UC combined method can not only meet the requirements of high purity but also provide a considerable amount, which has a good application prospect.
Meanwhile, we also found in the comparison that there are certain problems with the comparison method of the particle to protein ratio. We found that although the particle-to-protein ratio of SEC+TEI is much higher than that of SEC+UC and SEC, it can be seen from the results of Western Blot and TEM that there are still apolipoprotein particles in EVs obtained by SEC+TEI. This shows that the ratio of particle to protein is not a good indicator of the purity of the obtained EVs. This view is consistent with the results of the research done by Takov et al.16 Additionally, our study has the advantage of using equal serum volumes from the same animal for each method biological replicate while maintaining the same final volume, which allowed us to systematically compare contaminating factors in the same experiment. Intriguingly, EVs separated from 1mL of serum by the SEC+UC method have a low total number of particles measured by NTA, but the number of vesicles observed by TEM under the same multiple fields of view is more than any other method. This also confirmed that, as previously reported by others, NTA can only detect the size of particles but cannot distinguish lipoprotein particles and protein aggregates that have a similar size to EVs. The presence of lipoproteins particles and protein aggregates will cause the particle concentration detected by NTA to be inaccurate. Therefore, NTA and protein amount are not desirable parameters for evaluating the amount of EV, there is no obvious correlation between particle and protein.
Conclusion
We have successfully demonstrated that high quality and purity serum-derived EVs can be separated by two consecutive simple steps: SEC and UC. This two-step protocol is convenient and fast, which only takes about a maximum of half a working day. Moreover, the materials and equipment required are the most commonly used, and no additional complicated equipment is required. Our results could serve as a universally applied standard method for EV-related research and clinical application.
Abbreviations
EVs, extracellular vesicles; SEC, Size Exclusion Chromatography; UC, ultracentrifugation; TEI, Total Exosomes Isolation; NTA, Nanoparticle Tracking Analysis; TEM, Transmission Electron Microscopy; PBS, Phosphate Buffered Saline.
Data Sharing Statement
All data generated or analyzed during this study are included in this published article.
Ethics Approval and Informed Consent
All animal experiments were performed according to protocols approved by the Institutional Animal Care and Use Committee (IACUC) at Sichuan University. This study was reviewed and approved by the Committee of Ethics of West China Hospital of Stomatology, Sichuan University (NO. WCHSIRB-D-2018-100).
Consent for Publication
The manuscript does not contain individual person’s data. The consent for publication does not apply.
Author Contributions
All authors made a significant contribution to the work reported, whether that is in the conception, study design, execution, acquisition of data, analysis and interpretation, or in all these areas; took part in drafting, revising or critically reviewing the article; gave final approval of the version to be published; have agreed on the journal to which the article has been submitted; and agree to be accountable for all aspects of the work.
Funding
This work was supported by grants from the National Key Research and Development Program of China (2017YFA0104800), the Nature Science Foundation of China (82071092, 31601113), the Fundamental Research Funds for the Central Universities (YJ201878), Key Project of Sichuan province (2019YFS0311, 2019YFS0515), and Technology Innovation Research and Development Project of Chengdu (2019-YF05-00705-SN).
Disclosure
The authors declare that they have no competing interests.
References
1. Kalluri R, LeBleu VS. The biology, function, and biomedical applications of exosomes. Science. 2020;367:6478.
2. Doyle LM, Wang MZ. Overview of extracellular vesicles, their origin, composition, purpose, and methods for exosome isolation and analysis. Cells. 2019;8:7.
3. Grenier-Pleau I, Tyryshkin K, Le TD, et al. Blood extracellular vesicles from healthy individuals regulate hematopoietic stem cells as humans age. Aging Cell. 2020;19(11):e13245.
4. Oeyen E, Van Mol K, Baggerman G, et al. Ultrafiltration and size exclusion chromatography combined with asymmetrical-flow field-flow fractionation for the isolation and characterisation of extracellular vesicles from urine. J Extracell Vesicles. 2018;7(1):1490143.
5. Lapitz A, Arbelaiz A, O’Rourke CJ, et al. Patients with cholangiocarcinoma present specific RNA profiles in serum and urine extracellular vesicles mirroring the tumor expression: novel liquid biopsy biomarkers for disease diagnosis. Cells. 2020;9:3.
6. Blans K, Hansen MS, Sorensen LV, et al. Pellet-free isolation of human and bovine milk extracellular vesicles by size-exclusion chromatography. J Extracell Vesicles. 2017;6(1):1294340.
7. Foster BP, Balassa T, Benen TD, et al. Extracellular vesicles in blood, milk and body fluids of the female and male urogenital tract and with special regard to reproduction. Crit Rev Clin Lab Sci. 2016;53(6):379–395.
8. Welch JL, Kaddour H, Schlievert PM, Stapleton JT, Okeoma CM. Semen exosomes promote transcriptional silencing of HIV-1 by disrupting NF-kappaB/Sp1/Tat circuitry. J Virol. 2018;92:21.
9. Vojtech L, Woo S, Hughes S, et al. Exosomes in human semen carry a distinctive repertoire of small non-coding RNAs with potential regulatory functions. Nucleic Acids Res. 2014;42(11):7290–7304.
10. Iwai K, Yamamoto S, Yoshida M, Shiba K. Isolation of extracellular vesicles in saliva using density gradient ultracentrifugation. Methods Mol Biol. 2017;1660:343–350.
11. Milasan A, Tessandier N, Tan S, Brisson A, Boilard E, Martel C. Extracellular vesicles are present in mouse lymph and their level differs in atherosclerosis. J Extracell Vesicles. 2016;5:31427.
12. Arraud N, Linares R, Tan S, et al. Extracellular vesicles from blood plasma: determination of their morphology, size, phenotype and concentration. J Thromb Haemost. 2014;12(5):614–627.
13. Sódar BW, Kittel Á, Pálóczi K, et al. Low-density lipoprotein mimics blood plasma-derived exosomes and microvesicles during isolation and detection. Sci Rep. 2016;6:24316.
14. Borghesan M, Fafián-Labora J, Eleftheriadou O, et al. Small extracellular vesicles are key regulators of non-cell autonomous intercellular communication in senescence via the interferon protein IFITM3. Cell Rep. 2019;27(13):3956–3971.e3956.
15. Wang H, Zhang XH. Molecules in the blood of older people promote cancer spread. Nature. 2020;585(7824):187–188.
16. Takov K, Yellon DM, Davidson SM. Comparison of small extracellular vesicles isolated from plasma by ultracentrifugation or size-exclusion chromatography: yield, purity and functional potential. J Extracell Vesicles. 2019;8(1):1560809.
17. de Miguel Perez D, Rodriguez Martinez A, Ortigosa Palomo A, et al. Extracellular vesicle-miRNAs as liquid biopsy biomarkers for disease identification and prognosis in metastatic colorectal cancer patients. Sci Rep. 2020;10(1):3974.
18. LeBleu VS, Kalluri R. Exosomes as a multicomponent biomarker platform in cancer. Trends Cancer. 2020. doi:10.1016/j.trecan.2020.03.007
19. Quinn JF, Patel T, Wong D, et al. Extracellular RNAs: development as biomarkers of human disease. J Extracell Vesicles. 2015;4:27495.
20. Garvey WT, Kwon S, Zheng D, et al. Effects of insulin resistance and type 2 diabetes on lipoprotein subclass particle size and concentration determined by nuclear magnetic resonance. Diabetes. 2003;52(2):453–462.
21. Tian Y, Gong M, Hu Y, et al. Quality and efficiency assessment of six extracellular vesicle isolation methods by nano-flow cytometry. J Extracell Vesicles. 2020;9(1):1697028.
22. Karimi N, Cvjetkovic A, Jang SC, et al. Detailed analysis of the plasma extracellular vesicle proteome after separation from lipoproteins. Cell Mol Life Sci. 2018;75(15):2873–2886.
23. Stranska R, Gysbrechts L, Wouters J, et al. Comparison of membrane affinity-based method with size-exclusion chromatography for isolation of exosome-like vesicles from human plasma. J Transl Med. 2018;16(1):1.
24. Ding M, Wang C, Lu X, et al. Comparison of commercial exosome isolation kits for circulating exosomal microRNA profiling. Anal Bioanal Chem. 2018;410(16):3805–3814.
25. Andreu Z, Rivas E, Sanguino-Pascual A, et al. Comparative analysis of EV isolation procedures for miRNAs detection in serum samples. J Extracell Vesicles. 2016;5:31655.
26. Li P, Kaslan M, Lee SH, Yao J, Gao Z. Progress in exosome isolation techniques. Theranostics. 2017;7(3):789–804.
27. Gardiner C, Di Vizio D, Sahoo S, et al. Techniques used for the isolation and characterization of extracellular vesicles: results of a worldwide survey. J Extracell Vesicles. 2016;5:32945.
28. Thery C, Witwer KW, Aikawa E, et al. Minimal information for studies of extracellular vesicles 2018 (MISEV2018): a position statement of the International Society for Extracellular Vesicles and update of the MISEV2014 guidelines. J Extracell Vesicles. 2018;7(1):1535750.
29. Helwa I, Cai J, Drewry MD, et al. A comparative study of serum exosome isolation using differential ultracentrifugation and three commercial reagents. PLoS One. 2017;12(1):e0170628.
30. Serrano-Pertierra E, Oliveira-Rodriguez M, Rivas M, et al. Characterization of plasma-derived extracellular vesicles isolated by different methods: a comparison study. Bioengineering. 2019;6:1.
31. Gamez-Valero A, Monguio-Tortajada M, Carreras-Planella L, Franquesa M, Beyer K, Borras FE. Size-exclusion chromatography-based isolation minimally alters extracellular vesicles’ characteristics compared to precipitating agents. Sci Rep. 2016;6:33641.
32. Monguio-Tortajada M, Galvez-Monton C, Bayes-Genis A, Roura S, Borras FE. Extracellular vesicle isolation methods: rising impact of size-exclusion chromatography. Cell Mol Life Sci. 2019;76(12):2369–2382.
33. Ryu KJ, Lee JY, Park C, Cho D, Kim SJ. Isolation of small extracellular vesicles from human serum using a combination of ultracentrifugation with polymer-based precipitation. Ann Lab Med. 2020;40(3):253–258.
34. Koh YQ, Almughlliq FB, Vaswani K, Peiris HN, Mitchell MD. Exosome enrichment by ultracentrifugation and size exclusion chromatography. Front Biosci. 2018;23:865–874.
35. An M, Wu J, Zhu J, Lubman DM. Comparison of an optimized ultracentrifugation method versus size-exclusion chromatography for isolation of exosomes from human serum. J Proteome Res. 2018;17(10):3599–3605.
36. Zhang X, Borg EGF, Liaci AM, Vos HR, Stoorvogel W. A novel three step protocol to isolate extracellular vesicles from plasma or cell culture medium with both high yield and purity. J Extracell Vesicles. 2020;9(1):1791450.
37. Marassi V, Maggio S, Battistelli M, et al. An ultracentrifugation - hollow-fiber flow field-flow fractionation orthogonal approach for the purification and mapping of extracellular vesicle subtypes. J Chromatogr A. 2021;1638:461861.
38. Liangsupree T, Multia E, Riekkola ML. Modern isolation and separation techniques for extracellular vesicles. J Chromatogr A. 2021;1636:461773.
39. Boing AN, van der Pol E, Grootemaat AE, Coumans FA, Sturk A, Nieuwland R. Single-step isolation of extracellular vesicles by size-exclusion chromatography. J Extracell Vesicles. 2014;3:23430.
40. Momen-Heravi F. Isolation of extracellular vesicles by ultracentrifugation. Methods Mol Biol. 2017;1660:25–32.
41. Théry C, Amigorena S, Raposo G, Clayton A. Isolation and characterization of exosomes from cell culture supernatants and biological fluids. Curr Protoc Cell Biol. 2006;Chapter 3:
42. Baranyai T, Herczeg K, Onódi Z, et al. Isolation of exosomes from blood plasma: qualitative and quantitative comparison of ultracentrifugation and size exclusion chromatography methods. PLoS One. 2015;10(12):e0145686.
43. Ludwig N, Whiteside TL, Reichert TE. Challenges in exosome isolation and analysis in health and disease. Int J Mol Sci. 2019;20:19.
44. Giannopoulou L, Zavridou M, Kasimir-Bauer S, Lianidou ES. Liquid biopsy in ovarian cancer: the potential of circulating miRNAs and exosomes. Transl Res. 2019;205:77–91.
 © 2021 The Author(s). This work is published and licensed by Dove Medical Press Limited. The full terms of this license are available at https://www.dovepress.com/terms.php and incorporate the Creative Commons Attribution - Non Commercial (unported, v3.0) License.
By accessing the work you hereby accept the Terms. Non-commercial uses of the work are permitted without any further permission from Dove Medical Press Limited, provided the work is properly attributed. For permission for commercial use of this work, please see paragraphs 4.2 and 5 of our Terms.
© 2021 The Author(s). This work is published and licensed by Dove Medical Press Limited. The full terms of this license are available at https://www.dovepress.com/terms.php and incorporate the Creative Commons Attribution - Non Commercial (unported, v3.0) License.
By accessing the work you hereby accept the Terms. Non-commercial uses of the work are permitted without any further permission from Dove Medical Press Limited, provided the work is properly attributed. For permission for commercial use of this work, please see paragraphs 4.2 and 5 of our Terms.