")
Back to Journals » Journal of Pain Research » Volume 9
An investigation of completion times on the Screener and Opioid Assessment for Patients with Pain – revised (SOAPP-R)
Authors Finkelman MD , Kulich RJ , Butler SF , Jackson WC, Friedman FD, Smits N, Weiner SG
Received 29 September 2016
Accepted for publication 28 October 2016
Published 5 December 2016 Volume 2016:9 Pages 1163—1171
DOI https://doi.org/10.2147/JPR.S123454
Checked for plagiarism Yes
Review by Single anonymous peer review
Peer reviewer comments 2
Editor who approved publication: Dr Michael Schatman
Matthew D Finkelman,1 Ronald J Kulich,2,3 Stephen F Butler,4 William C Jackson,3 Franklin D Friedman,5 Niels Smits,6 Scott G Weiner7
1Department of Public Health and Community Service, Tufts University School of Dental Medicine, Boston, MA, USA; 2Craniofacial Pain and Headache Center, Tufts University School of Dental Medicine, Boston, MA, USA; 3Department of Anesthesia, Critical Care and Pain Medicine, Massachusetts General Hospital, 4Inflexxion Inc, Newton, MA, USA; 5Department of Emergency Medicine, Tufts Medical Center, Boston, MA, USA; 6Department of Methods and Statistics, Research Institute of Child Development and Education, University of Amsterdam, Amsterdam, the Netherlands; 7Department of Emergency Medicine, Brigham and Women’s Hospital, Boston, MA, USA
Background: Respondents’ scores to the Screener and Opioid Assessment for Patients with Pain – revised (SOAPP-R) have been shown to be predictive of aberrant drug-related behavior (ADB). However, research is lacking on whether an individual’s completion time (the amount of time that he/she takes to finish the screener) has utility in predicting ADB, despite the fact that response speed has been useful in predicting behavior in other fields. The purpose of this study was to evaluate the degree to which SOAPP-R completion time is predictive of ADB.
Materials and methods: This retrospective study analyzed completion-time data from 82 adult emergency department patients who completed the SOAPP-R on a tablet computer. The utility of SOAPP-R completion times in predicting ADB was assessed via logistic regression and the area under the curve (AUC) statistic. An external measure of ADB using Prescription Drug Monitoring Program data defined ADB to have occurred in individuals with at least four opioid prescriptions and at least four prescribers in 12 months.
Results: Although there was a slight trend for individuals with greater completion times to have greater odds of ADB (odds ratio 1.004 in simple logistic regression), the association between SOAPP-R completion time and ADB was not statistically significant in either simple logistic regression (P=0.307) or multiple logistic regression adjusting for SOAPP-R score (P=0.419). AUC values for the prediction of ADB using completion time alone, SOAPP-R score alone, and both completion time and SOAPP-R score were 0.63, 0.64, and 0.65, respectively.
Conclusion: There was no significant evidence that SOAPP-R completion times were predictive of ADB among emergency department patients. However, the AUC value for completion times was only slightly less than that for SOAPP-R total scores.
Keywords: chronic pain, substance abuse, risk stratification, aberrant drug-related behavior, response times, response latency
Introduction
It is estimated that 100 million US adults suffer from chronic pain.1 In 2012 alone, prescribers wrote 82.5 opioid prescriptions for every 100 of the population.2 However, opioid abuse has been demonstrated in 9% to as much as 41% of patients receiving chronic pain management.3 Due to the increase in opiate-related deaths (28,647 in 2014) and new prescribing regulations, the awareness of opioid misuse has grown.4 Nevertheless, use of Prescription Drug Monitoring Programs (PDMPs) and risk screening is still underutilized.5 With the volume of chronic pain patients, limited treatment options, high risk of misuse, and the public eye, development of time-sensitive and accurate technology for risk screening is essential for adequate care.
One approach to assisting providers with the prediction of aberrant drug-related behavior (ADB) among chronic pain patients is the use of validated screeners. The Screener and Opioid Assessment for Patients with Pain – revised (SOAPP-R) is a 24-item self-report questionnaire that has been well-studied for this purpose. A higher score on the SOAPP-R indicates greater risk of aberrance. In its initial validation study, the SOAPP-R exhibited sensitivity of 0.81 and specificity of 0.68 for predicting an external measure of ADB.6 The screener has since been cross-validated.7
One inherent limitation of self-report questionnaires is the possibility that a respondent will answer the items in an aberrant manner (not to be confused with exhibiting ADB). That is, a respondent may answer the items in a way that does not produce meaningful or useful information with respect to the intended purpose of the test. One type of such aberrance occurs when an individual uses deception in his/her responses, in order to promote a false impression of his/her status. In the present context, a respondent may seek to portray falsely a lower risk of ADB than he/she in fact has. The SOAPP-R was designed to contain more items that are “subtle” (ie, less transparent) in their scoring than the previous version of the questionnaire, the original SOAPP; nevertheless, the possibility of deception remains present for the SOAPP-R.7 Another type of aberrant responding occurs when an individual answers items without adequate thought as to the most appropriate answer choice. In this case, the individual is not intentionally attempting to distort the truth via his/her answers, but responds to the items in a haphazard manner, whether due to a lack of motivation, a lack of reading comprehension ability, or another reason.
An approach to investigating the aberrance of respondents’ answers that has been well studied and has been described as a critical element of such investigations8 involves the use of individuals’ response times.9–11 Indeed, the increasing popularity of computer-based testing facilitates the tracking of the time taken by a given respondent to complete each item and/or the time taken to finish the assessment as a whole (the latter of which may be referred to as the completion time).12 In the context of educational testing, van der Linden and van Krimpen-Stoop noted that an individual’s response times are distinct from his/her answers; therefore, the response times may provide additional information about an individual’s level of aberrant responding that cannot be gleaned from the answer choices themselves.11 In a general assessment context, unduly fast responses may signify aberrant response behavior, for example, that an individual is responding carelessly in an effort to complete the assessment as quickly as possible, or is mechanically “faking good” in his/her responses, without deep consideration of the most accurate answer, when it is a simple matter to do so.8,13–21 On the other hand, unduly slow responses may also signify aberrant response behavior, for example, an individual who takes an unduly long time to provide responses may be doing so because he/she is thoroughly assessing the answer choices to determine which is the most socially desirable, when making such a determination is not trivial.22–24 For questionnaires for which individuals’ times can be tracked (such as those that are administered via computer), suspicious times may be flagged for subsequent review. When using completion times to predict a specific behavior, such as ADB, it can be determined on an assessment-by-assessment basis whether unduly fast times, unduly slow times, or both are associated with the behavior in question.
Response times have been used in a variety of research settings, including (among other applications) the measurement of the accessibility of attitudes,25–30 the identification of poor, difficult, or emotionally arousing items,31–33 the evaluation of the feasibility of electronic assessment and/or the comparison of different modes of questionnaire administration,34–42 and the prediction of inconsistencies between voting intentions and voting behavior.43 Indeed, it has been established in the psychological literature for decades that the speed of a response may be predictive of behavior.26,27,43,44 To our knowledge, however, no previous research has investigated the degree to which SOAPP-R completion times are associated with ADB. If either fast completion or slow completion were found to be predictive of ADB, then an individual’s completion time could be used as a supplement to his/her SOAPP-R score in assessing the risk of ADB. A finding that completion times are not associated with ADB may also be of interest to providers who administer the SOAPP-R to their patients. Therefore, the primary aim of this research was to evaluate the utility of completion times in predicting ADB among a population of subjects who took a computer-based version of the SOAPP-R in an emergency department. The secondary aim was to assess the association between completion times and SOAPP-R total scores in this patient population.
Materials and methods
This retrospective study used data from subjects who had completed the SOAPP-R as part of previous research on the feasibility of an electronic version of the screener, and the concordance of the screener with PDMP data, in an emergency department population.42,45 The Institutional Review Board at Tufts Medical Center and Tufts University Health Sciences Campus granted exempt status for this study.
Participants
Patients were selected from one location, a level 1 trauma center in an inner-city teaching hospital, between May and August 2013. Using MedHost Emergency Department Information System electronic tracking, a trained researcher identified potential participants, each of whom had a diagnosis of a painful condition. Patients included in the study were at least 18 years old, understood English, had no physical disability preventing them from using a tablet, had no significant mental impairment, and were not currently prescribed any opioid medication. The treating clinician was approached to determine whether the patients identified were being considered for an opioid prescription. If the patient was being considered for opioid treatment, they were approached by the researcher, the study was described, and the patient was verbally consented.
The SOAPP-R
Each SOAPP-R item is scored on a scale from 0 to 4. Answer options for each item are “Never”, “Seldom”, “Sometimes”, “Often”, and “Very often”; see Table 1 for the wording of all items. No items are reverse-scored, and hence the same scoring rule is applied to each item (“Never” = 0, “Seldom” = 1, etc). The 24-item scores are added together to obtain the total score for an individual. A cutoff ≥18 was used in the screener’s original validation study6 and its cross-validation study;7 those respondents with total scores at or above the cutoff are considered to be at greater risk of ADB than respondents with total scores below the cutoff.
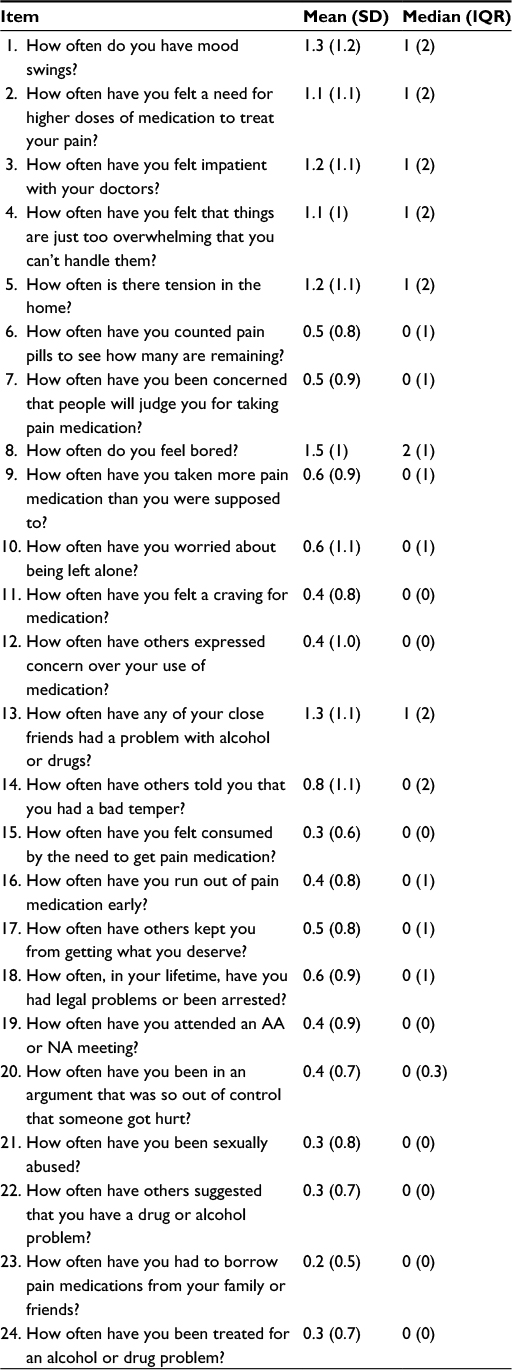 | Table 1 Descriptive statistics for each SOAPP-R item (n=82) Abbreviations: SOAPP-R, Screener and Opioid Assessment for Patients with Pain – revised; SD, standard deviation; IQR, interquartile range; AA, Alcoholics Anonymous; NA, Narcotics Anonymous. |
Questionnaire administration
Identified patients were given a tablet computer, consent was acknowledged electronically, and the first page on the tablet informed patients that their information would not be shared with the treating clinician and would not affect their treatment. A researcher was present at all times while the patient was completing the SOAPP-R. The researcher provided no assistance with completion of the screener and had no immediate knowledge of screener results. The time the patient took to complete the SOAPP-R was tracked in seconds by the computer.
Determination of ADB
ADB was determined with the use of the PDMP, which is a program aimed at reducing prescription-drug misuse by collecting electronically transmitted prescribing and dispensing data that have been submitted by prescribers and pharmacies. The information is provided to prescribing clinicians in an easily accessible online database.46 An external criterion for ADB based on the PDMP data was defined as follows: a given patient was considered to exhibit ADB only if he/she had four or more opioid prescriptions from four or more providers in a period of 12 months. This criterion had been employed in previous studies,47–49 and we believe it to make empiric sense. For example, a patient with chronic pain may have four or more prescriptions in a year, but such a patient following up with their primary physician or specialist(s) in an appropriate fashion should not, in most cases, have four or more providers.
Statistical analysis
Descriptive statistics were calculated, and graphic techniques are employed to display the results. The association between SOAPP-R completion time and SOAPP-R total score was assessed via the Spearman correlation. Associations between predictor variables (SOAPP-R completion time and SOAPP-R total score) and the outcome variable of interest (ADB status according to PDMP) were assessed in several ways. 1) A simple logistic regression was performed, with completion time defined as the predictor and ADB status defined as the outcome. 2) A multiple logistic regression was conducted including both completion time and SOAPP-R total score as predictors and ADB status as the outcome. For both logistic regression models, goodness of fit was assessed via the Hosmer–Lemeshow test. 3) Receiver-operating characteristic (ROC)-curve analyses were conducted, along with corresponding area under the curve (AUC) statistics, to evaluate predictive utility. In particular, AUC statistics were computed to quantify 1) the ability of SOAPP-R completion time alone to predict ADB and 2) the joint ability of SOAPP-R completion time and SOAPP-R total score to predict ADB based on the aforementioned multiple logistic regression model. Sensitivity and specificity were calculated separately for 1) and 2) directly above, using cutoff points on the completion-time scale and probability scale (the latter being appropriate for a multiple logistic regression model), respectively. The cutoff points were chosen to maximize the Youden J index (ie, in each analysis, the cutoff point maximizing the quantity of sensitivity + specificity – 1 was selected).50 The AUC for predicting ADB from SOAPP-R total score alone had previously been reported for this patient population and data set,45 as had the sensitivity and specificity when using the usual SOAPP-R cutoff point of ≥18, which will be detailed in a subsequent section.
These analyses tested the existence of a monotonic relationship between completion time and ADB. That is, they tested the presence of a trend for the risk of ADB to increase as completion time increased (a positive association), or a trend for the risk of ADB to decrease as completion time increased (a negative association). However, these analyses did not address the possibility that both unduly long completion times and unduly short completion times might be associated with a greater risk of ADB, in comparison with completion times near the mean value. To investigate the latter possibility, a transformation of the completion time variable was created. Specifically, the transformed value for each subject was obtained by taking the subject’s completion time, subtracting the mean completion time, then taking the absolute value. The resulting transformed value quantified the magnitude of the difference (regardless of the direction of the difference) between the subject’s completion time and the mean completion time. By using the transformed variable as a predictor of ADB in further logistic regression and ROC curve analyses, it was evaluated whether a larger discrepancy from the mean completion time in either direction (positive or negative) was associated with risk of ADB. All confidence intervals (CIs) were at the 95% level. SPSS version 22 was used in the analysis.
Results
Descriptive statistics about the sample have been provided in previous studies.42,45 A total of 43 of the 82 subjects (52%) were male, 23 (28%) were in the 46- to 55-year age group (this was the age group with the greatest representation), 51 subjects (62%) self-reported as white, 63 (77%) self-reported as having used opioids previously, and 62 (76%) self-reported as having used opioids recently (within the previous 7 days). The mean ± standard deviation total score on the SOAPP-R was 16±12.8, 55 subjects (67%) had a total score of <18 on the SOAPP-R, and 69 subjects (84%) were not identified by the PDMP as having had ADB (Table 2).
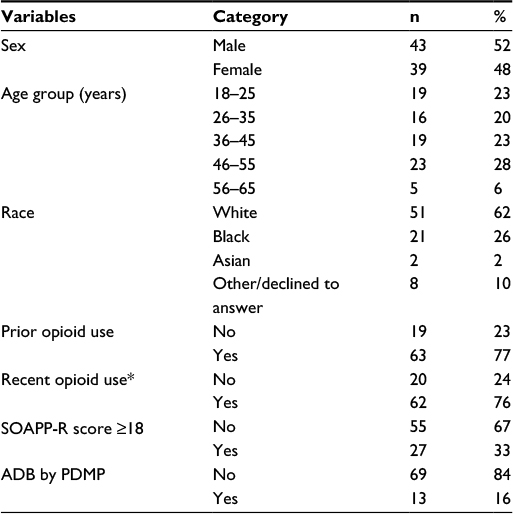 | Table 2 Descriptive statistics for the sample (n=82) Note: *Recent opioid use defined as within last 7 days. Abbreviations: SOAPP-R, Screener and Opioid Assessment for Patients with Pain – revised; ADB, aberrant drug-related behavior; PDMP, Prescription Drug Monitoring Program. |
Table 1 presents statistics for each individual SOAPP-R item. The items with the highest means were “How often do you feel bored?” (1.5), “How often do you have mood swings?” (1.3), and “How often have any of your close friends had a problem with alcohol or drugs?” (1.3). The item with the lowest mean was “How often have you had to borrow pain medications from your family or friends?” (0.2), with four other items following with a mean of 0.3. Item medians ranged from 0 to 2.
Figure 1 displays a histogram of subjects’ SOAPP-R completion times. The figure shows a peak between 100 and 200 seconds, as well as a positive skew. Mean ± standard deviation time spent on the screener was 164±74 seconds; median and interquartile range were 148 and 67 seconds, respectively. One subject (1.2%) completed the assessment in ≤1 minute, 24 (29.3%) completed it in ≤2 minutes, 61 (74.4%) completed it in ≤3 minutes, and 71 (86.6%) completed it in ≤4 minutes. The minimum and maximum completion times were 57 and 463 seconds, respectively.
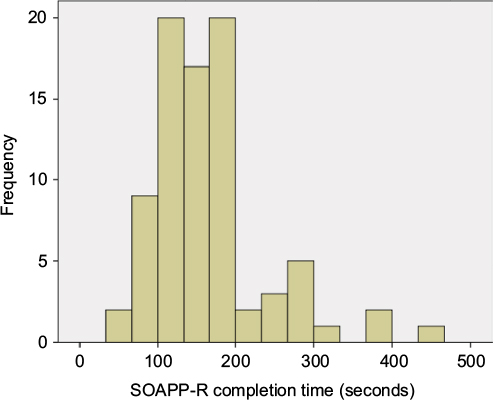 | Figure 1 Histogram of SOAPP-R completion times (n=82). Abbreviation: SOAPP-R, Screener and Opioid Assessment for Patients with Pain – revised. |
Figure 2 displays side-by-side box plots of SOAPP-R completion times, with one box plot for individuals who were identified by the PDMP results as having had ADB and one box plot for individuals who were not so identified. Although there was a slight tendency for individuals positive for ADB to have greater completion times, there was substantial overlap between the groups. Both groups had at least one high outlier, with the group negative for ADB having several. The simple logistic regression results in which ADB status according to PDMP was predicted from SOAPP-R completion time yielded an odds ratio of 1.004 (95% CI 0.997–1.011); the association between the two variables was not statistically significant (P=0.307). The result of the Hosmer–Lemeshow test did not indicate significant evidence of a lack of fit in the simple logistic regression model (P=0.115). In the multiple logistic regression model adjusting for SOAPP-R total score, the odds ratio for completion time was 1.003 (95% CI 0.996–1.010); the association between completion time and ADB was again not significant (P=0.419). The association between SOAPP-R total score and ADB was not significant either, based on the multiple logistic regression model (odds ratio 1.027, 95% CI 0.984–1.073; P=0.216). The Hosmer–Lemeshow test for this model showed no significant evidence of lack of fit (P=0.266).
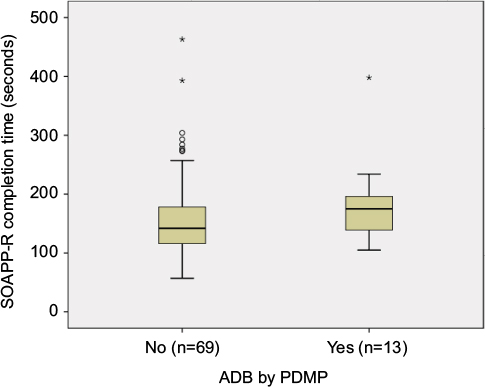 | Figure 2 Box plots of SOAPP-R completion times by ADB status according to PDMP results. Abbreviations: SOAPP-R, Screener and Opioid Assessment for Patients with Pain – revised; ADB, aberrant drug-related behavior; PDMP, Prescription Drug Monitoring Program. |
In the ROC-curve analysis of the prediction of ADB from completion time alone, the AUC statistic was 0.63 (95% CI 0.47–0.78). The Youden J index identified the cutoff point on the completion time scale to be ≥169 seconds; sensitivity and specificity corresponding to this cutoff point were 0.62 and 0.65, respectively. The AUC statistic for the prediction of ADB from SOAPP-R total score alone was 0.64 (95% CI 0.48–0.8), and sensitivity and specificity corresponding to the usual ≥18 cutoff point on the SOAPP-R total score scale were 0.54 and 0.71, respectively; these statistics, with the exception of the CI, have been reported in previous research.45 Finally, the AUC statistic for the prediction of ADB from both completion time and SOAPP-R total score was 0.65 (95% CI 0.51–0.79). The Youden J index identified the cutoff point on the probability scale to be ≥0.125 (ie, a “positive” result was obtained if the multiple logistic regression model estimated the probability of ADB to be ≥12.5%). Using this cutoff point, the sensitivity and specificity of the multiple logistic regression model including both completion time and SOAPP-R total score as predictors were 0.92 and 0.45, respectively.
In the logistic regression using the transformed completion time to predict ADB, the odds ratio was 0.999 (95% CI 0.987–1.011). The association between the transformed value and ADB was not statistically significant (P=0.826). The Hosmer–Lemeshow test did not indicate significant evidence of misfit (P=0.774). The AUC statistic predicting ADB from transformed completion time was 0.46 (95% CI 0.31–0.62).
Figure 3 shows a scatterplot of SOAPP-R completion times and SOAPP-R total scores. The plot does not indicate a strong tendency for the SOAPP-R total score to increase or decrease as SOAPP-R completion time increased. The Spearman correlation between SOAPP-R completion time and SOAPP-R total score was 0.17 (95% CI –0.06 to 0.38); this correlation was not statistically significant (P=0.135).
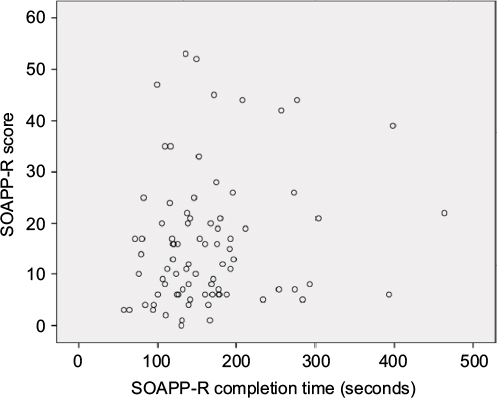 | Figure 3 Scatterplot of SOAPP-R completion times and SOAPP-R total scores (n=82). Abbreviation: SOAPP-R, Screener and Opioid Assessment for Patients with Pain – revised. |
Discussion
The use of response times to detect the aberrant answering of assessment items is well known.8–11,13–20,51–57 To our knowledge, no previous research has evaluated the utility of SOAPP-R completion times to predict ADB, despite the fact that respondent deception has been identified as a concern for this questionnaire.7 The methodology utilized in the current study can also be used for investigations of other screeners that assess risk of ADB.
Results of the study did not provide significant evidence of the utility of SOAPP-R completion time in the prediction of ADB defined by PDMP criteria. When prediction via raw completion times was conducted, although subjects with longer times had slightly higher odds of ADB, the association was not statistically significant. Furthermore, the AUC values obtained when predicting ADB from completion time alone (0.63) and from the combination of completion time and SOAPP-R total score (0.65) were modest. When transformed completion times were used, subjects with greater values actually exhibited a slightly lower chance of ADB (as expressed by an odds ratio just below 1). This association was not statistically significant either. These results could reflect that SOAPP-R completion times are inherently of limited utility in the prediction of ADB. However, it should be noted that the AUC value corresponding to the prediction of ADB from SOAPP-R total score alone for this data set (0.64) was also modest45 and was lower than AUC values for SOAPP-R total scores reported in other settings.6,7 Therefore, it is plausible that the low AUC values observed herein were due to a factor other than the fundamental inutility of the predictive variables. For instance, the use of PDMP data to identify ADB may have been imperfect, which could then have contributed to low AUC values. Additionally, all participants were patients at a single inner-city emergency department and knew that they were part of a study and that the results would not be shared with their treating clinicians; results do not necessarily generalize to other populations. Not only do AUC values vary from population to population, but optimal cutoff points do so as well; therefore, the cutoff point determined herein for the completion time scale (≥169 seconds) does not necessarily translate to other settings.
A limitation of the current study is its relatively small sample size, especially the small sample of individuals exhibiting ADB according to PDMP. The small sample size was reflected in the wide 95% CIs for AUC. The limited number of subjects in the highest age group (five subjects aged between 56 and 65 years) precluded the comparison of completion times of subjects in this group with those of younger subjects. Another limitation is that only total completion times were available, rather than item-level response times. If an individual became distracted at some point while taking the SOAPP-R, this would have artificially increased his/her total completion time, while not being detectable from the data at hand. Additionally, if a respondent spent a great deal of time at the beginning of the assessment, but then answered items unduly quickly at the end of the assessment, such a pattern (which could only be detected from item-level response times) could be useful in identifying potentially problematic answering. Indeed, item-level response times have been employed in identifying aberrant answering9–11 and would allow more diverse modeling approaches to be considered in the context of predicting ADB. Data on person-level confounding variables (eg, reading speed and cognitive skills) were unavailable; adjusting for these variables, as well as item-level variables (eg, item complexity and length), could also improve the signal-to-noise ratio of the data through a richer statistical model.28,52–56,58–61 Nevertheless, the direct use of the total amount of time taken on an assessment (ie, the raw completion time) had been found to have utility in previous work,12,37,62–65 including the identification of aberrant answering.8,21,57
Another consideration relevant to the methodology presented herein is that if respondents were to become aware that their completion times were used as part of the screening process, they might consciously alter their completion times in order to obtain a desired end. van der Linden discussed this type of issue in the context of educational assessment and concluded that information on speed nevertheless provides useful information.9 In the current context of screening for ADB, respondents could potentially make a conscious effort to provide answers more quickly if they learned that longer completion times were associated with greater perceived risk. However, this possibility is only a concern under the assumption that respondents would be aware of the role of completion times in the determination of risk and would actively attempt to provide deceptive completion times. Moreover, we note that the current scoring method of the SOAPP-R is equally prone, if not more prone, to deception than a more sophisticated approach involving both SOAPP-R total scores and completion times. Indeed, in the current scoring method of the SOAPP-R, no items are reverse-scored, and hence respondents with a desire to “fake good” can simply give the answer “Never” to every item (or nearly every item) in order to obtain a low score, which would suggest a low risk of ADB. The current scoring method of the SOAPP-R is publicly available, and the screener’s susceptibility to deception was acknowledged in both its initial validation study6 and its cross-validation study.7
It should be noted that response times are not the only way to assess aberrant responding. In particular, a previously studied approach to measuring a respondent’s tendency to give answers that he/she perceives as socially desirable is to administer such a scale as the Marlowe–Crowne Social Desirability Scale (MCSDS).66 A high score on the MCSDS may suggest a greater tendency toward giving responses that will be perceived as socially desirable. As a low score on the SOAPP-R suggests lower risk, a highly negative correlation between the SOAPP-R and the MCSDS would suggest that the former questionnaire is sensitive to social desirability. Prior work investigated the correlation between the SOAPP-R and the short form of the MCSDS and found that this correlation was only moderately negative (r=–0.47).6 This prior research also found empirically that the SOAPP-R predicts ADB beyond the information provided by the short form of the MCSDS.6
Recent research on the SOAPP-R has indicated an interest in and the feasibility of employing a computerized version of the screener.42,67 The regular use of a computer-based SOAPP-R would facilitate the collection of further response-time data, which would open the door to new methods of determining risk of ADB. The current research represents the first step toward studying the utility of such methods. The results presented herein did not find a statistically significant predictive relationship between SOAPP-R completion time and ADB; however, as noted earlier, the AUC value for completion time was approximately equal to that of SOAPP-R total score, which had been found to be predictive of ADB in previous research.6,7 Therefore, further research is needed. Future studies should investigate the utility of SOAPP-R completion times in diverse populations and with large data sets. Item-level response times should be collected, and different statistical models incorporating both scores and such response times should be examined. Each of these steps will advance our knowledge of how to assess the risk of ADB for patients with pain.
Conclusion
There was no evidence that SOAPP-R completion times are able to predict ADB among emergency department patients. Although respondents with greater SOAPP-R completion times tended to exhibit more ADB, this association was not statistically significant. In isolation, completion times were slightly less efficacious than SOAPP-R total scores in determining risk.
Acknowledgment
The authors would like to thank Ms Laura Pavlech for assisting with the literature review.
Disclosure
SFB is an employee of Inflexxion Inc. Inflexxion holds the copyright for the Screener and Opioid Assessment for Patients with Pain-Revised (SOAPP®-R). The other authors report no conflicts of interest in this work.
References
US Institute of Medicine Committee on Advancing Pain Research, Care, and Education. Relieving Pain in America: A Blueprint for Transforming Prevention, Care, Education, and Research. Washington: National Academies Press; 2011. | ||
Paulozzi LJ, Mack KA, Hockenberry JM. Vital signs: variation among states in prescribing of opioid pain relievers and benzodiazepines – United States, 2012. MMWR Morb Mortal Wkly Rep. 2014;63(26):563–568. | ||
Manchikanti L, Cash KA, Damron KS, Manchukonda R, Pampati V, McManus CD. Controlled substance abuse and illicit drug use in chronic pain patients: an evaluation of multiple variables. Pain Physician. 2006;9(3):215–225. | ||
Rudd RA, Aleshire N, Zibbell JE, Gladden RM. Increases in drug and opioid overdose deaths: United States, 2000-2014. MMWR Morb Mortal Wkly Rep. 2016;64(50-51):1378–1382. | ||
Feldman L, Williams KS, Coates J, Knox M. Awareness and utilization of a prescription monitoring program among physicians. J Pain Palliat Care Pharmacother. 2011;25(4):313–317. | ||
Butler SF, Fernandez K, Benoit C, Budman SH, Jamison RN. Validation of the Revised Screener and Opioid Assessment for Patients with Pain (SOAPP-R). J Pain. 2008;9(4):360–372. | ||
Butler SF, Budman SH, Fernandez KC, Fanciullo GJ, Jamison RN. Cross-validation of a screener to predict opioid misuse in chronic pain patients (SOAPP-R). J Addict Med. 2009;3(2):66–73. | ||
Montag C, Reuter M. Does speed in completing an online questionnaire have an influence on its reliability? Cyberpsychol Behav. 2008;11(6):719–721. | ||
van der Linden WJ. A bivariate lognormal response-time model for the detection of collusion between test takers. J Educ Behav Stat. 2009;34(3):378–394. | ||
van der Linden WJ, Guo F. Bayesian procedures for identifying aberrant response-time patterns in adaptive testing. Psychometrika. 2008;73(3):365–384. | ||
van der Linden WJ, van Krimpen-Stoop EM. Using response times to detect aberrant responses in computerized adaptive testing. Psychometrika. 2003;68(2):251–265. | ||
Furnham A, Hyde G, Trickey G. On-line questionnaire completion time and personality test scores. Pers Individ Diff. 2013;54(6):716–720. | ||
Curran PG. Methods for the detection of carelessly invalid responses in survey data. J Exp Soc Psychol. 2016;66:4–19. | ||
DeSimone JA, Harms PD, DeSimone AJ. Best practice recommendations for data screening. J Organ Behav. 2015;36(2):171–181. | ||
Godinho A, Kushnir V, Cunningham JA. Unfaithful findings: identifying careless responding in addictions research. Addiction. 2016;111(6):955–956. | ||
Hsu LM, Santelli J, Hsu JR. Faking detection validity and incremental validity of response latencies to MMPI subtle and obvious items. J Pers Assess. 1989;53(2):278–295. | ||
Huang JL, Bowling NA, Liu M, Li Y. Detecting insufficient effort responding with an infrequency scale: evaluating validity and participant reactions. J Bus Psychol. 2015;30(2):299–311. | ||
Huang JL, Curran PG, Keeney J, Poposki EM, DeShon RP. Detecting and deterring insufficient effort responding to surveys. J Bus Psychol. 2012;27(1):99–114. | ||
Malhotra N. Completion time and response order effects in web surveys. Public Opin Q. 2008;72(5):914–934. | ||
Niessen AS, Meijer RR, Tendeiro JN. Detecting careless respondents in web-based questionnaires: which method to use? J Res Pers. 2016;63:1–11. | ||
Ward MK, Pond SB. Using virtual presence and survey instructions to minimize careless responding on Internet-based surveys. Comput Hum Behav. 2015;48:554–568. | ||
Holtgraves T. Social desirability and self-reports: testing models of socially desirable responding. Pers Soc Psychol Bull. 2004;30(2):161–172. | ||
McDaniel MA, Timm HW. Lying takes time: predicting deception in biodata using response latency. Poster presented at: 98th Annual Convention of the American Psychological Association; August 10–14, 1990; Boston, MA. | ||
Ortner TM. Effects of changed item order: a cautionary note to practitioners on jumping to computerized adaptive testing for personality assessment. Int J Sel Assess. 2008;16(3):249–257. | ||
Fazio RH. A practical guide to the use of response latency in social psychological research. In: Hendrick C, Clark MS, editors. Research Methods in Personality and Social Psychology. Thousand Oaks (CA): Sage; 1990:74–97. | ||
Fazio RH, Chen JM, McDonel EC, Sherman SJ. Attitude accessibility, attitude-behavior consistency, and the strength of the object-evaluation association. J Exp Soc Psychol. 1982;18(4):339–357. | ||
Fazio RH, Williams CJ. Attitude accessibility as a moderator of the attitude-perception and attitude-behavior relations: an investigation of the 1984 presidential election. J Pers Soc Psychol. 1986;51(3):505–514. | ||
Johnson M. Timepieces: components of survey question response latencies. Polit Psychol. 2004;25(5):679–702. | ||
Stocké V. Attitudes toward surveys, attitude accessibility and the effect on respondents’ susceptibility to nonresponse. Qual Quant. 2006;40(2):259–288. | ||
Yan T, Tourangeau R. Fast times and easy questions: the effects of age, experience and question complexity on web survey response times. Appl Cognit Psychol. 2008;22(1):51–68. | ||
Bassili JN, Scott BS. Response latency as a signal to question problems in survey research. Public Opin Q. 1996;60(3):390–399. | ||
Kulas JT, Stachowski AA. Middle category endorsement in odd-numbered Likert response scales: associated item characteristics, cognitive demands, and preferred meanings. J Res Pers. 2009;43(3):489–493. | ||
Temple DE, Geisinger KF. Response latency to computer-administered inventory items as an indicator of emotional arousal. J Pers Assess. 1990;54(1):289–297. | ||
Bennett AV, Dueck AC, Mitchell SA, et al. Mode equivalence and acceptability of tablet computer-, interactive voice response system-, and paper-based administration of the U.S. National Cancer Institute’s Patient-Reported Outcomes version of the Common Terminology Criteria for Adverse Events (PRO-CTCAE). Health Qual Life Outcomes. 2016;14:24. | ||
Campbell N, Ali F, Finlay AY, Salek SS. Equivalence of electronic and paper-based patient-reported outcome measures. Qual Life Res. 2015;24(8):1949–1961. | ||
Chesser AK, Woods NK, Wipperman J, Wilson R, Dong F. Health literacy assessment of the STOFHLA: paper versus electronic administration continuation study. Health Educ Behav. 2014;41(1):19–24. | ||
Huff KC. The comparison of mobile devices to computers for web-based assessments. Comput Hum Behav. 2015;49:208–212. | ||
Kesterke N, Egeter J, Erhardt JB, Jost B, Giesinger K. Patient-reported outcome assessment after total joint replacement: comparison of questionnaire completion times on paper and tablet computer. Arch Orthop Trauma Surg. 2015;135(7):935–941. | ||
Salaffi F, Di Carlo M, Carotti M, Farah S, Gutierrez M. The Psoriatic Arthritis Impact of Disease 12-item questionnaire: equivalence, reliability, validity, and feasibility of the touch-screen administration versus the paper-and-pencil version. Ther Clin Risk Manag. 2016;12:631–642. | ||
Salaffi F, Gasparini S, Ciapetti A, Gutierrez M, Grassi W. Usability of an innovative and interactive electronic system for collection of patient-reported data in axial spondyloarthritis: comparison with the traditional paper-administered format. Rheumatology (Oxford). 2013;52(11):2062–2070. | ||
Tyser AR, Beckmann J, Weng C, O’Farrell A, Hung M. A randomized trial of the disabilities of the arm, shoulder, and hand administration: tablet computer versus paper and pencil. J Hand Surg Am. 2015;40(3):554–559. | ||
Weiner SG, Horton LC, Green TC, Butler SF. Feasibility of tablet computer screening for opioid abuse in the emergency department. West J Emerg Med. 2015;16(1):18–23. | ||
Bassili JN. Response latency versus certainty as indexes of the strength of voting intentions in a CATI survey. Public Opin Q. 1993;57(1):54–61. | ||
Fazio RH. Multiple processes by which attitudes guide behavior: the MODE model as an integrative framework. In: Zanna MP, editor. Advances in Experimental Social Psychology. New York: Academic Press; 1990:75–109. | ||
Weiner SG, Horton LC, Green TC, Butler SF. A comparison of an opioid abuse screening tool and prescription drug monitoring data in the emergency department. Drug Alcohol Depend. 2016;159:152–157. | ||
Prescription Drug Monitoring Program Training and Technical Assistance Center. Prescription drug monitoring frequently asked questions (FAQ). Available from: http://www.pdmpassist.org/content/prescription-drug-monitoring-frequently-asked-questions-faq. Accessed July 28, 2016. | ||
Weiner SG, Griggs CA, Mitchell PM, et al. Clinician impression versus prescription drug monitoring program criteria in the assessment of drug-seeking behavior in the emergency department. Ann Emerg Med. 2013;62(4):281–289. | ||
Weiner SG, Perrone J, Nelson LS. Centering the pendulum: the evolution of emergency medicine opioid prescribing guidelines. Ann Emerg Med. 2013;62(3):241–243. | ||
Weiner SG, Griggs CA, Langlois BK, et al. Characteristics of emergency department doctor shoppers. J Emerg Med. 2015;48(4):424–431. | ||
Youden WJ. Index for rating diagnostic tests. Cancer. 1950;3(1):32–35. | ||
Holden RR. Response latency detection of fakers on personnel tests. Can J Beh Sci. 1995;27(3):343–355. | ||
Holden RR. Detecting fakers on a personnel test: response latencies versus a standard validity scale. J Soc Behav Pers. 1998;13(2):387–398. | ||
Holden RR, Hibbs N. Incremental validity of response latencies for detecting fakers on a personality test. J Res Pers. 1995;29(3):362–372. | ||
Holden RR, Kroner DG. Relative efficacy of differential response latencies for detecting faking on a self-report measure of psychopathology. Psychol Assess. 1992;4(2):170–173. | ||
Holden RR, Kroner DG, Fekken GC, Popham SM. A model of personality test item response dissimulation. J Pers Soc Psychol. 1992;63(2):272–279. | ||
Holden RR, Lambert CE. Response latencies are alive and well for identifying fakers on a self-report personality inventory: a reconsideration of van Hooft and Born (2012). Behav Res Methods. 2015;47(4):1436–1442. | ||
McKibben WB, Silvia PJ. Evaluating the distorting effects of inattentive responding and social desirability on self-report scales in creativity and the arts. J Creat Behav. Epub 2015 Apr 30. | ||
Fekken GC, Holden RR. Response latency evidence for viewing personality traits as schema indicators. J Res Pers. 1992;26(2):103–120. | ||
Holden RR, Fekken GC. Can personality test item response latencies have construct validity? Issues of reliability and convergent and discriminant validity. Pers Individ Diff. 1993;15(3):243–248. | ||
Holden RR, Fekken GC, Cotton DH. Assessing psychopathology using structured test-item response latencies. Psychol Assess. 1991;3(1):111–118. | ||
Tetrick LE. An exploratory investigation of response latency in computerized administrations of the Marlowe-Crowne Social Desirability Scale. Pers Individ Diff. 1989;10(12):1281–1287. | ||
Furnham A, Forde L, Cotter T. Personality scores and test taking style. Pers Individ Diff. 1998;24(1):19–23. | ||
Furnham A, Forde L, Cotter T. Personality and intelligence. Pers Individ Diff. 1998;24(2):187–192. | ||
Furnham A, Forde L, Ferrari K. Personality and work motivation. Pers Individ Diff. 1999;26(6):1035–1043. | ||
Moltó J, Segarra P, Avila C. Impulsivity and total response speed to a personality questionnaire. Pers Individ Diff. 1993;15(1):97–98. | ||
Crowne DP, Marlowe D. A new scale of social desirability independent of psychopathology. J Consult Psychol. 1960;24(4):349–354. | ||
Finkelman MD, Kulich RJ, Zacharoff KL, et al. Shortening the Screener and Opioid Assessment for Patients with Pain-Revised (SOAPP-R): a proof-of-principle study for customized computer-based testing. Pain Med. 2015;16(12):2344–2356. |
 © 2016 The Author(s). This work is published and licensed by Dove Medical Press Limited. The full terms of this license are available at https://www.dovepress.com/terms.php and incorporate the Creative Commons Attribution - Non Commercial (unported, v3.0) License.
By accessing the work you hereby accept the Terms. Non-commercial uses of the work are permitted without any further permission from Dove Medical Press Limited, provided the work is properly attributed. For permission for commercial use of this work, please see paragraphs 4.2 and 5 of our Terms.
© 2016 The Author(s). This work is published and licensed by Dove Medical Press Limited. The full terms of this license are available at https://www.dovepress.com/terms.php and incorporate the Creative Commons Attribution - Non Commercial (unported, v3.0) License.
By accessing the work you hereby accept the Terms. Non-commercial uses of the work are permitted without any further permission from Dove Medical Press Limited, provided the work is properly attributed. For permission for commercial use of this work, please see paragraphs 4.2 and 5 of our Terms.