")
Back to Journals » International Journal of General Medicine » Volume 14
An Integrative Pan-Cancer Analysis of the Prognostic and Immunological Role of Casein Kinase 2 Alpha Protein 1 (CSNK2A1) in Human Cancers: A Study Based on Bioinformatics and Immunohistochemical Analysis
Authors Wu R , Tang W, Qiu K , Li P, Li Y , Li D, He Z
Received 21 July 2021
Accepted for publication 21 September 2021
Published 29 September 2021 Volume 2021:14 Pages 6215—6232
DOI https://doi.org/10.2147/IJGM.S330500
Checked for plagiarism Yes
Review by Single anonymous peer review
Peer reviewer comments 2
Editor who approved publication: Dr Scott Fraser
Ruohao Wu, 1, 2,* Wenting Tang, 3, 4,* Kunyin Qiu, 1, 2 Pinggan Li, 1, 2 Yu Li, 1, 2 Dongfang Li, 1, 2 Zhanwen He 1, 2
1Key Laboratory of Malignant Tumor Gene Regulation and Target Therapy of Guangdong High Education Institutes, Sun Yat-sen Memorial Hospital, Guangzhou, People’s Republic of China; 2Department of Pediatrics, Sun Yat-sen Memorial Hospital, Guangzhou, People’s Republic of China; 3State Key Laboratory of Oncology in South China, Collaborative Innovation Center for Cancer Medicine, Sun Yat-sen Cancer Center, Guangzhou, People’s Republic of China; 4Department of Molecular Diagnostics, Sun Yat-sen Cancer Center, Guangzhou, People’s Republic of China
*These authors contributed equally to this work
Correspondence: Zhanwen He; Dongfang Li
Key Laboratory of Malignant Tumor Gene Regulation and Target Therapy of Guangdong High Education Institutes, Sun Yat-sen Memorial Hospital, Guangzhou, People’s Republic of China
Email [email protected]; [email protected]
Background: Although emerging animal- or cell-based evidence supports the relationship between casein kinase 2 alpha protein 1 (CSNK2A1) and cancers, no pan-cancer analysis is available. Thus, this report aimed to display the prognostic landscape of CSNK2A1 in pan-cancer and investigate the relationship between CSNK2A1 and tumor immunity.
Methods: In the current study, we investigated the expression pattern, genetic alterations and survival analysis of CSNK2A1 in pan-cancer across multiple datasets and online platforms. The correlations between CSNK2A1 expression and tumor immunity were explored and visualized via Rlanguage software. Following this, immunohistochemical (IHC) staining and Kaplan–Meier survival analysis were conducted in clinical patients for proving the bioinformatic findings. Analysis of protein–protein interaction and gene functional enrichment was conducted using GeneMANIA platform and gene set enrichment analysis (GSEA), respectively.
Results: In TCGA, tumor tissue had ahigher expression level of CSNK2A1 compared with that in corresponding normal tissue. An increased expression level of CSNK2A1 was related to poor clinical prognosis in most types of cancer such as LIHC. The following expression and survival analysis in clinical liver hepatocellular carcinoma (LIHC) patients confirmed these TCGA findings. CSNK2A1 expression had significant positive correlations with pro-tumor-infiltrating immune cells (TIICs) like M1-macrophages and fibroblasts, and significant negative correlations with anti-tumor-TIICs like activated CD8+ Tcells and NK cells, suggesting specific interactions between CSNK2A1 and certain TIICs subtypes. Furthermore, CSNK2A1 expression had the most significant positive correlations with common markers of immune checkpoint including programmed death ligand-1 (PDL1) in LIHC. These findings were validated by an IHC analysis. GSEA analysis demonstrated that high expression of CSNK2A1 was related to cell signaling pathways and immunity-related activities.
Conclusion: These findings suggested that CSNK2A1 was not only related to poor clinical prognosis in cancer like LIHC but also anovel immunotherapy-related biomarker in cancers, especially in LIHC, shedding new light on anti-tumor strategy.
Keywords: casein kinase 2 alpha protein 1, pan-cancer, dataset, survival analysis, tumor immunity, tumor microenvironment
Introduction
For the complexity of tumorigenesis, it is necessary to perform a pan-cancer expression study of any gene of interest and explore its correlation with potential oncogenic mechanisms and clinical prognosis. The availability of public databases with large functional genomics data sets of different cancers, like the cancer genome atlas (TCGA) project and gene expression omnibus (GEO) dataset, bring us opportunities to perform a pan-cancer analysis.1–3
Casein kinase 2 (CK2) is a highly conserved and ubiquitous protein serine/threonine kinase with multifunction involving in the process of cell cycle regulation, cell proliferation and cell apoptosis.4 It is a tetramer complex consisting of two catalytic subunits (CK2α and/or CK2 α’) and two regulatory β subunits.5 CK2α, one of CK2 catalytic subunit, also known as casein kinase 2 alpha protein 1 (CSNK2A1), is encoded by CSNK2A1 gene and found to play an oncogenic role in the development and progression of various tumors.6 Up-regulation of CSNK2A1 has been reported in many malignant cancers, including lung cancer,7 hepatocellular carcinoma,8 ovarian cancer,9 prostate cancer,10 colorectal cancer,11 lymphomas12 and acute myeloid leukemia.13 Besides that, Over-expression of CSNK2A1 has also been shown to be an unfavorable factor to the poor prognosis of these tumor patients.8,9,14,15 Currently, CSNK2A1 has received considerable attention as a promising biomarker for various tumors; however, the relevance of CSNK2A1 function and molecular mechanism with the tumorigenesis is still unknown. Meanwhile, there is still no integrative analysis of the prognostic value of CSNK2A1 in cancers based on big clinical data.
Previous studies have indicated that tumor microenvironment (TME) plays an important role in the initiation and progression of human cancers.16 It contains a variety of cells, among which tumor-infiltrating immune cells (TIICs) account for a large proportion.17 The interactions between tumor cells and TIICs came into focus because almost all types of TIICs, including neutrophils, macrophages, T cells, B cells and natural killer (NK) cells were found to participate in the development of tumors.18 However, the molecular mechanisms of interactions between tumor cells and TIICs still remain unclear. Some studies assumed that TIICs helped resisting cancer cells in TME.16,18 In contrast, some publications indicated that TIICs in TME could provide a tactic for cancer cells to avoid being killed.19–21 On the other hand, immunotherapy targeting interactions between cancer cells and TIICs, as an alternative strategy to classic antitumoral treatments, has recently been developed to reactivate innate and adaptive immune systems and creates a effective antitumoral immune response.20,22 For example, anti-cytotoxic T cells associated antigen-4 (anti-CTLA-4), anti-programmed death-1 (anti-PD1) and anti-programmed death ligand-1 (anti-PDL1) agents were applied in treatments of cancers, such as lung carcinoma and malignant melanoma, and were found to achieve promising anticancer effects.23 However, only a limited proportion of cases with specific cancer types have favorable response to current immunotherapies. Meanwhile, the molecular characteristics of cancer patients showing optimal response to immunotherapy remain unclear. Thus, there is an urgent need to clarify the molecular mechanisms of tumor-immune interaction and explore the new potential therapeutic targets and immunotherapy-related biomarker in cancers.
In the current study, we comprehensively explored the expression of CSNK2A1 and its prognostic landscape in pan-cancer, and further analyzed its association with TIICs and related immunotherapy markers via data-mining analysis based on various datasets and online platforms. Then, we selected one of the most representative TCGA tumor to conduct a series of retrospective clinical studies including immunohistochemical (IHC) staining and Kaplan–Meier survival analysis for validating these bioinformatic findings based on data-mining analysis. This study was designed and conducted based on the flow diagram (Supplementary Figure 1). The findings from this study implied that CSNK2A1 influenced the prognosis of cancer patients, probably via its multiple interactions with TIICs. CSNK2A1 served as an oncogenic factor in pan-cancer, and up-regulated CSNK2A1 expression was unfavorable to the survival time of patients with cancers like LIHC. Taking these findings together, CSNK2A1 was not only a biomarker of poor prognosis but also a promising potential therapeutic target and immunotherapy-related biomarker for human cancers, especially in LIHC.
Methods
Raw Data Acquisition
TCGA gene expression (transcriptome RNA-seq) data of 33 different cancer types was downloaded from TCGA dataset (http://portal.gdc.cancer.gov/).1 Thirty-three tumor types were included: adrenocortical carcinoma (ACC), bladder urothelial carcinoma (BLCA), breast invasive carcinoma (BRCA), cervical squamous cell carcinoma and endocervical adenocarcinoma (CESC), cholangiocarcinoma (CHOL), colon adenocarcinoma (COAD), lymphoid neoplasm diffuse large B-cell lymphoma (DLBC), esophageal carcinoma (ESCA), glioblastoma multiforme (GBM), head and neck squamous cell carcinoma (HNSC), kidney chromophobe (KICH), kidney renal clear cell carcinoma (KIRC), kidney renal papillary cell carcinoma (KIRP), acute myeloid leukemia (LAML), brain lower grade glioma (LGG), liver hepatocellular carcinoma (LIHC), lung adenocarcinoma (LUAD), lung squamous cell carcinoma (LUSC), mesothelioma (MESO), ovarian serous cystadenocarcinoma (OV), pancreatic adenocarcinoma (PAAD), pheochromocytoma and paraganglioma (PCPG), prostate adenocarcinoma (PRAD), rectum adenocarcinoma (READ), sarcoma (SARC), skin cutaneous melanoma (SKCM), stomach adenocarcinoma (STAD), testicular germ cell tumors (TGCT), thyroid carcinoma (THCA), thymoma (THYM), uterine corpus endometrial carcinoma (UCEC), uterine carcinoma (UCS) and uveal melanoma (UVM).
Analysis of CSNK2A1 Expression in Normal Tissues and Cancers
The data on expression levels of CSNK2A1 in different normal tissues were extracted from projects of human protein atlas (HPA) (http://www.proteinatlas.org),24 genotype-tissue expression (GTEx)25 and function annotation of the mammalian genome 5 (FANTOM5).26 The information of differential expression of CSNK2A1 between tumors and corresponding normal tissues was from datasets of TCGA, GTEx and clinical proteomic tumor analysis consortium (CPTAC),27 and the analysis of this information was performed via TIMER2.0 online tool (http://timer.cistrome.org),28 GEPIA2.0 online tool (http://gepia2.cancer-pku.cn)29 and Ualcan online tool (http://ualcan.path.uab.edu/index.html).30
Analysis of Genetic Alteration of CSNK2A1 in Cancers
The analysis of genomic alteration of CSNK2A1 status in cancer cases was performed using the cBioPortal online tool (http://cbioportal.org).31 The three-dimensional (3-D) structure of mutated site information on CSNK2A1 was visualized via UCSF Chimera tools.32
Survival Analysis in Databases of GEPIA2.0, TCGA and Kaplan–Meier Plotter
In this section, the correlation between CSNK2A1 expression and survival in pan-cancer was firstly explored in GEPIA2.0 project. We used the “Survival Map” module of GEPIA2.0 to acquire the overall survival (OS) and disease-free survival (DFS) data of CSNK2A1 across all TCGA cancers and these data were displayed as heatmaps. The values of cutoff-high (50%) and cutoff-low (50%) were defined as the expression thresholds for spitting the high-expression and low-expression groups. The survival plot of a specific cancer with significant result was obtained and visualized via the “Survival Analysis” module of GEPIA2.0.
Then, the CSNK2A1 expression level was searched on TCGA dataset to determine its relationship with prognosis, including progression-free interval (PFI) and disease-specific survival (DSS). The threshold was set as a Cox P-value <0.05 and R language software [R-4.1.0, 64 bit] with the “forestplot” package was used to summarize and display a Cox regression survival analysis from TCGA. Finally, we used the Kaplan–Meier Plotter online platform (http://www.kmplot.com)33 to explore the relationship of CSNK2A1 expression with relapse-free survival (RFS), distant metastasis-free survival (DMFS), progression-free survival (PFS), first progression (FP), post-progression survival (PPS), disease-specific survival (DSS) and OS in breast cancer, ovarian cancer, gastric cancer and liver cancer.
Analysis of the Relationship Between CSNK2A1 Expression and Immunity
Emerging evidence showed that tumor immune microenvironment (TME) plays an important role in cancer development. In the current section, we first explored the relationship between the level of CSNK2A1 expression and the abundance of TIICs, including 22 kinds of immune cell subtypes, across diverse TCGA cancers, and further explored the significant differences of immune cell subtypes. These analyses were visualized with the R language software [R-4.1.0, 64 bit] with the “reshape2” package and the “RcolorBrewer” package. The 22 kinds of immune cell subtypes of TIIC were included neutrophils, eosinophils, activated mast cells, resting mast cells, activated dendritic cells, resting dendritic cells, macrophages M0-2, monocytes, activated NK cells, resting NK cells, γδ-T cells, regulatory T cells, follicular T helper cells, activated CD4+ T memory cells, resting CD4+ T memory cells, naive CD4+ T cells, CD8+ T cells, memory B cells and naive B cells. Furthermore, we also used the TIMER2.0 web server to explore the correlation between CSNK2A1 expression and the infiltrates of cancer-associated fibroblasts and endothelial cells across all TCGA cancers. The algorithms of EPIC, MCPCOUNTER and TIDE/XCELL were used for immune infiltration assessments. The correlation (cor) values and their corresponding P-values (P) were acquired via the purity-adjusted Spearman correlation test. The data were displayed as heatmaps and scatter plots.
In addition to the comprehensive analysis of correlations between CSNK2A1 expression and immunity, we also explored the relationships between CSNK2A1 expression and immune checkpoint marker sets, tumor mutation burden (TMB) and microsatellite instability (MSI) for analyzing the value of CSNK2A1 in the assessment of tumor immunotherapy effect. These immune checkpoint marker sets participated in the evasion of cancers34 and included TNFSF9, CD44, CD86, CD274, TIGIT, TNFSF15, TNFRSF18, CD40, TNFRSF4, VSIR, TNFRSF25, CD27, TNFRSF8, TNFSF9, CD70, BTNL2, TNFSF18, HHLA2, PDCD1LG2, IDO2, VTCN1, TIMGD2, ICOSLG, IDO2, TNFSF14, CD160, LGALS9, PDCD1, CD80, KIR3DL1, CD276, ADORA2A, HAVCR2, CD200R1, CD28, CD48, CTLA4, CD40LG, ICOS, LAG3, CD244, TNFSF4, LAIR1, NRP1, TNFRSF14, CD200 and BTLA. TMB is emerging as a novel and profound biomarker for assessing the effect of immunotherapy.35 MSI is a novel molecular tumor phenotype and defined as the spontaneous gain or loss of nucleotides from short tandem repeat DNA tracts.36 Analysis regarding the relationships between CSNK2A1 expression and immune checkpoint marker sets, TMB and MSI were performed and visualized via R language software [R-4.1.0, 64 bit] with the “reshape2” package and the “fmsb” package.
Immunohistochemistry and Evaluation of Expression Score for CSNK2A1 and PDL1
To further provide clinical validity to the results of prognostic and immunological role of CSNK2A1 in human cancers based on bioinformatic approaches and consider the outstanding findings in LIHC based on previous TCGA database analysis, we chose LIHC as the representative TCGA cancer for performing validation experiments. Fifty-three tissue samples (48 tumor tissue samples and 5 adjacent normal tissue samples) from 48 LIHC patients treated at Sun Yat-sen Cancer Center of Sun Yat-sen University during the period of December 2016 to June 2018 (SYSUCC cohort) were then collected to conduct Immunohistochemistry (IHC) experiments. The experiments were approved by the Ethical Committee of the Sun Yat-sen Cancer Center of Sun Yat-sen University, and written informed consent was signed by each patient. All 5 adjacent normal tissue samples was incubated with 1:300 diluted rabbit polyclonal anti-CSNK2A1 (catalog No:#40672-1, SAB™, Baltimore, USA) at 4°C overnight and all 48 tumor tissue samples were divided into two parts, one part of each sample was incubated with 1:300 diluted rabbit polyclonal anti-CSNK2A1 at 4°C overnight, and the other part was incubated with 1:200 diluted rabbit polyclonal anti-PDL1 (anti-CD274) antibody (catalog No:#48238-1, SAB™, Baltimore, USA) overnight at 4°C. After washing, all slides were counter-stained with diaminobenzidine (DAB) substrate (catalog No: GK500710, Gene Tech™, Shanghai, China) and then dehydrated. Two experienced pathologists unaware of the clinical data scored each immunostained slide independently based on the extent of IHC staining and IHC staining intensity of cancer cells. The IHC staining intensity of CSNK2A1 was scored as 0, no staining; 1, weak staining (light yellow); 2, moderate staining (yellow brown); 3, strong staining (brown). The IHC staining extent of CSNK2A1 was scored from 0 to 3 according to the percentage of staining tumor cells (<5%, negative; 5–25%, sporadic; 26–50%, focal; >50%, diffuse). The IHC protein expression (IHC-P) score of CSNK2A1 ranging from 0 to 9 was calculated as the value of the proportion of positive staining cells score × staining intensity score and was finally defined as the following: “-” (negative, score 0); “+” (weakly positive, score 1–3); “++” (positive, score 4–6) and “+++” (strong positive, score 7–9). Thus, 5 adjacent normal tissue samples and 48 tumor tissue samples from SYSUCC cohort were divided into normal liver tissue with CSNK2A1-expression group (CSNK2A1, “-” score 0), low CSNK2A1-expression tumor tissue group (CSNK2A1, “-” and “+”, score 0–3) and high CSNK2A1-expression tumor tissue group (CSNK2A1, “++” and “+++”, score 4–9) according to the IHC-P score of CSNK2A1 in their respective tissue samples. On the other hand, the IHC staining intensity of PDL1 was scored as 0, no staining; 1, weak staining (light yellow); 2, moderate staining (yellow brown) and 3, strong staining (brown). The IHC staining extent of PDL1 was scored from 0 to 4 according to the percentage of staining tumor cells (<5%, negative; 5–25%, sporadic; 26–50%, focal; 51–75%, diffuse and >75%, suffusive). The IHC-P score of PDL1 ranging from 0 to 12 was calculated as the value of the proportion of positive staining cells score × staining intensity score and was finally defined as the following: “-” (negative, score 0); “+” (weakly positive, score 1–4); “++” (positive, score 5–8) and “+++” (strong positive, score 9–12).
Survival Analysis in SYSUCC Cohort
A survival analysis was carried out for LIHC patients with high and low CSNK2A1-expression patterns from tumor tissues of SYSUCC cohort, and the last follow-up time was December 2020. We used the Kaplan–Meier survival analysis to validate the relationship between CSNK2A1 expression and overall survival (OS) in tumor patients based on previous bioinformatic findings.
CSNK2A1-Related Protein–Protein Interaction Network Construction and Gene Set Enrichment Analysis
In this section, GeneMANIA online platform (http://www.genemania.org)37 was utilized for protein–protein interaction (PPI) analysis of CSNK2A1. GeneMANIA is an ideal resource for constructing PPI network, which demonstrates hypotheses about gene function prediction.
In order to analyze the biological signaling pathway, gene set enrichment analysis (GSEA) was conducted in the high expression and low-expression cohorts compared with the median level of CSNK2A1 expression, respectively. The top five terms of Kyoto Encyclopedia of Genes and Genomes (KEGG) and Gene Ontology (GO) analysis were displayed. Gene sets with NOM p < 0.05 and FDR q <0.25 were considered to be significant enrichment.38
Statistical Analysis
Gene expression data from datasets of TCGA and GTEx were evaluated using Student’s t-test. The correlation of gene expression was analyzed using Spearman correlation. For survival analysis, we used the Log rank test to calculate the HR and log-rank P value in GEPIA2.0 and Kaplan–Meier curves, and the univariate Cox regression model to calculate the HR and Cox P value in Forest plots. The associations between CSNK2A1 expression and abundance biomarkers of immunity were evaluated by Spearman correlation analysis. All statistical analyses of validation experiments in the current study were carried out using IBM SPSS software version 22.0 (IBM™, NY, USA). Among them, analysis of CSNK2A1 and PDL1 expression patterns in LIHC and paracarcinoma tissue samples were performed via Mann–Whitney U-test and overall survival distributions in SYSUCC cohort were displayed by Kaplan–Meier curve and compared between high CSNK2A1-expression group and low CSNK2A1-expression group using Log rank test. Results with P value <0.05 were considered to be statistically significant, if not specifically noted.
Results
The Expression Level of CSNK2A1 in Normal Tissues and Cancers
In the current section, we aimed to explore the oncogenic roles of human CSNK2A1 (NM_ 177559.3 for mRNA and NP_808227.1 for protein). First, we analyzed the expression status of CSNK2A1 in different normal tissues. As shown in Supplementary Figure 2, based on datasets of HPA, GTEx and FANTOM5, CSNK2A1 showed the highest expression in the testis, followed by the cerebral cortex and the urinary bladder. However, CSNK2A1 could be expressed in all detected nontumor tissues (all consensus normalized expression values >1), showing low RNA tissue specificity.
We then applied the TIMER2.0 tool to evaluate the expression pattern of CSNK2A1 across various cancer types of TCGA. As shown in Figure 1A, the expression level of CSNK2A1 in the tumor tissues of BLCA, BRCA, CHOL, COAD, ESCA, HNSC, LIHC, LUAD, LUSC, STAD, THCA (all P<0.001) and CESC (P<0.05) was higher than the corresponding normal tissues.
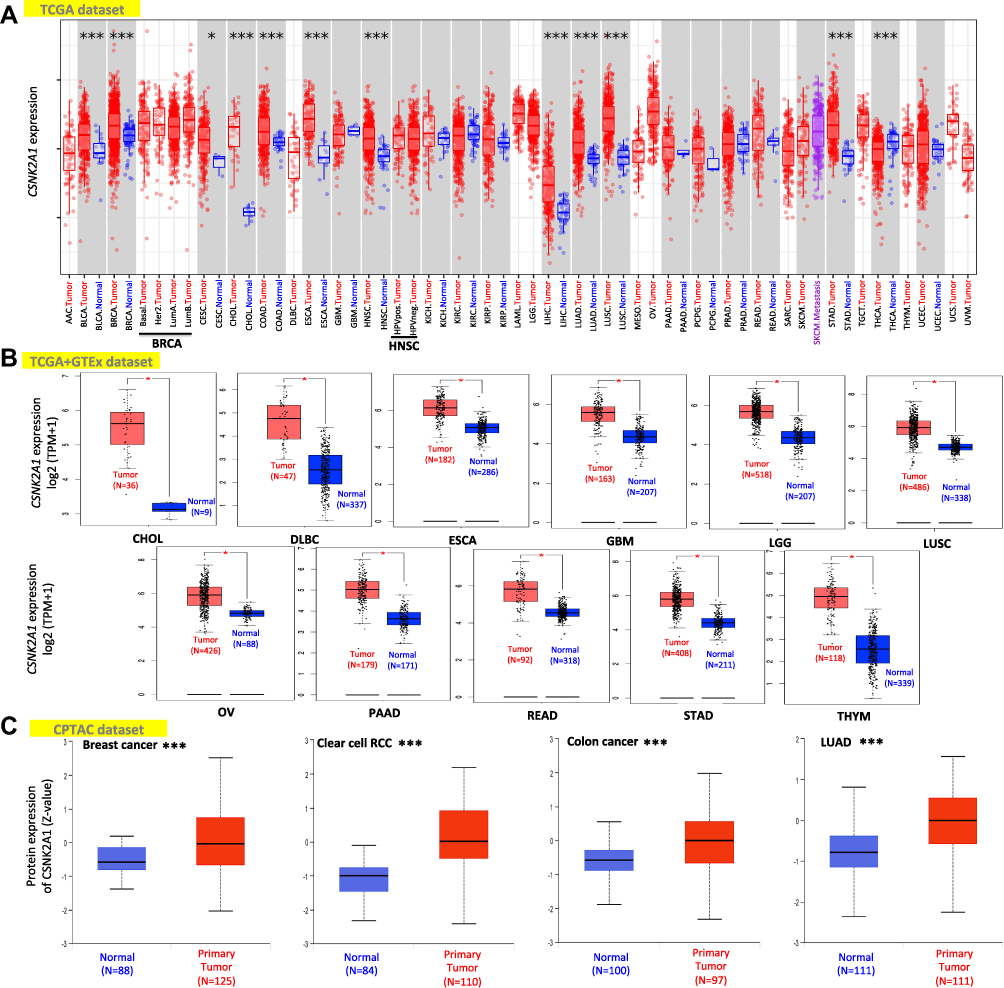 |
Figure 1 Expression level of CSNK2A1 in different cancers. (A) The expression level of the CSNK2A1 in different tumors or specific tumor subtypes was explored through TIMER2.0 tool. (B) For the type of CHOL, DLBC, ESCA, GBM, LGG, LUSC, OV, PAAD, READ, STAD and THYM in the TCGA project, the corresponding normal tissues of the GTEx dataset were included as normal controls. The data were displayed as box plots. (C) Based on the CPTAC database, the expression status of CSNK2A1 total protein between primary tissue of breast cancer, clear cell RCC, colon cancer and LUAD and their corresponding normal tissue were explored. Log2 (TPM+1) was applied for log-scale. *P<0.05; ***P<0.001. Abbreviations: CSNK2A1, casein kinase 2 alpha protein 1; CHOL, cholangiocarcinoma; DLBC, lymphoid neoplasm diffuse large B-cell lymphoma; ESCA, esophageal carcinoma; GBM, glioblastoma multiforme; LGG, brain lower grade glioma; LUSC, lung squamous cell carcinoma; OV, ovarian serous cystadenocarcinoma; PAAD, pancreatic adenocarcinoma; READ, rectum adenocarcinoma; STAD, stomach adenocarcinoma; THYM, thymoma; TCGA, the cancer genome atlas; GTEx, genotype-tissue expression; CPTAC, clinical proteomic tumor analysis consortium; RCC, renal clear cell carcinoma; LUAD, lung adenocarcinoma. |
We further analyzed the expression difference of CSNK2A1 between the tumor tissues and nontumor tissues from different datasets. As shown in Figure 1B, the expression level of CSNK2A1 in the tumor tissues from TCGA dataset, including CHOL, DLBC, ESCA, GBM, LGG, LUSC, OV, PAAD, READ, STAD and THYM, was significantly higher than the corresponding nontumor tissues from GTEx dataset (all P<0.05). Meanwhile, the results of the CPTAC dataset demonstrated higher expression of CSNK2A1 total protein in the primary tumor tissues of breast cancer, colon cancer, clear cell renal cell carcinoma and LUAD than in normal tissues (Figure 1C, all P<0.001).
Genetic Alteration Differences of CSNK2A1 in Cancers
It had been widely noticed that genetic alteration was closely associated with oncogenesis.39 To figure out genetic alteration of CSNK2A1 in human cancer, comparative analysis of CSNK2A1 was performed. We firstly analyzed the genetic alteration of CSNK2A1 genes in cancer cases using cBioPortal tools. As shown in Figure 2A, the genetic alteration profiling of CSNK2A1 showed that the highest alteration frequency of CSNK2A1 appeared for DLBC cases with “mutation” as the primary type (>6%). The “amplification” type of CNA was the primary type in the OV patients, which showed an alteration frequency of ~4%. It was worth noting that all ACC patients with genetic alteration had deep deletion of CSNK2A1 (>2% frequency). Then, the types, alteration sites and case number of the CSNK2A1 genetic alteration are further presented in Figure 2B. We observed that missense mutation of CSNK2A1 was the main type of genetic alteration, and R280* alteration in the Pkinase domain, which was found in 3 cases of UCEC and 1 case of HNSC, was able to induce a nonsense mutation at the 280 site of CSNK2A1 protein, causing the subsequent truncation, and the R280 site in the 3-D structure of CSNK2A1 protein is presented in Figure 2C using UCSF Chimera tools.
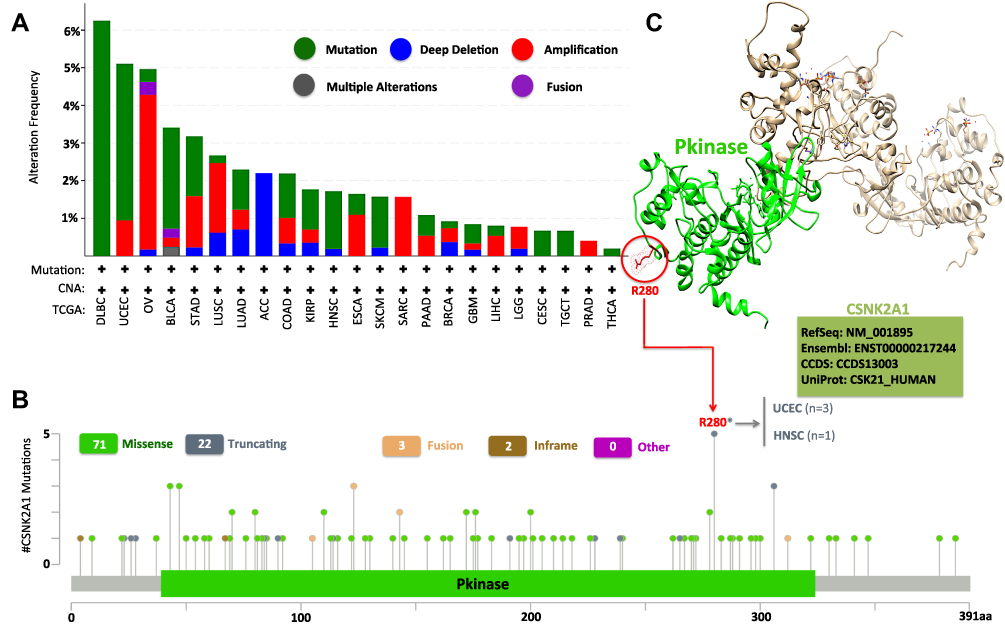 |
Figure 2 Mutation features of CSNK2A1 in different cancers of TCGA database. (A) The mutation type and (B) mutation site of alteration frequency was displayed using the cBioPortal tool. (C) The mutation site with the highest alteration frequency (R280*) in the 3D structure was displayed using UCSF Chimera tools. Abbreviations: CSNK2A1, casein kinase 2 alpha protein 1; TCGA, the cancer genome atlas; 3D, three dimensional; UCSF, University of California, San Francisco. |
Multifaceted Prognostic Value of CSNK2A1 in Cancers
Next, we explored the prognostic value of CSNK2A1 for pan-cancer. We splitted the tumors patients into high-expression and low-expression groups according to the expression levels of CSNK2A1 and analyzed the correlation of CSNK2A1 expression with the prognosis of patients with different cancers from the TCGA dataset using GEPIA2.0 tool. As shown in Figure 3, high expression level of CSNK2A1 was linked to poor prognosis of OS for tumor of LIHC (P=0.011), LUSC (P=0.035), MESO (P=0.026), PAAD (P=0.042) and SARC (P=0.037) (Figure 3A). Meanwhile, DFS analysis data showed a significant correlation between high CSNK2A1 expression and poor prognosis of DFS for cases of BLCA (P=0.004), MESO (P=0.015), PAAD (P=0.030) and UVM (P=0.034) (Figure 3B). In addition, the low expression level of CSNK2A1 was related to poor OS (Figure 3A, P=0.013) and DFS (Figure 3B, P=0.011) prognosis for KIRC.
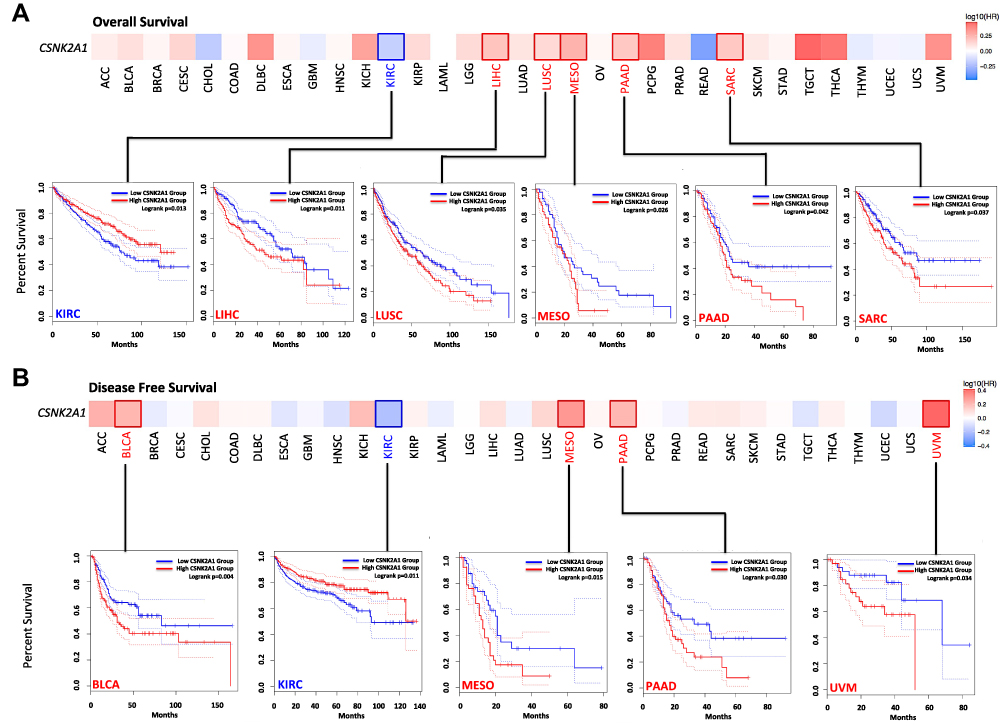 |
Figure 3 Survival maps and Kaplan–Meier survival curves comparing high and low expression of CSNK2A1 in different cancer types in TCGA. (A) Overall survival analysis and (B) disease free survival analysis in different TCGA cancer types with significant results of survival map and Kaplan–Meier survival curve were performed using GEPIA2.0 tool. Abbreviations: CSNK2A1, casein kinase 2 alpha protein 1; TCGA, the cancer genome atlas; GEPIA2.0, gene expression profiling interactive analysis version 2.0. |
We further investigated the relationships between CSNK2A1 expression and the PFI and the DSS of patients with different cancers in TCGA dataset using Forest Plot and Kaplan–Meier Plot. For PFI, CSNK2A1 played a detrimental role in patients with LIHC (HR=1.428, 95% CI from 1.146 to 1.780, P=0.002), MESO (HR=2.227, 95% CI from 1.117 to 4.442, P=0.023) and UVM (HR=5.302, 95% CI from 2.133 to 13.182, P<0.001), and a protective role in patients with LGG (HR=0.636, 95% CI from 0.412 to 0.981, P=0.041) (Figure 4A). For DSS, CSNK2A1 had a detrimental effect on cases with MESO (HR=2.654, 95% CI from 1.240 to 5.681, P=0.012), UCEC (HR=1.851, 95% CI from 1.116 to 3.073, P=0.017) and UVM (HR=3.698, 95% CI from 1.165 to 11.733, P=0.026), and a protective effect on cases with READ (HR=0.379, 95% CI from 0.157 to 0.917, P=0.031) (Figure 4B).
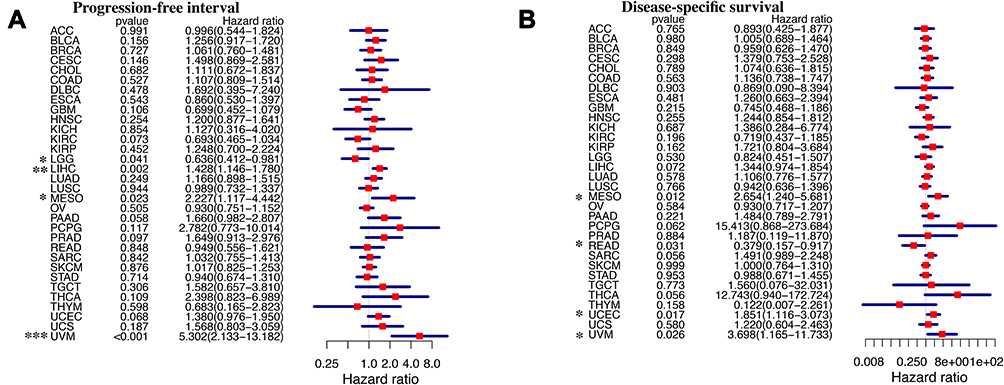 |
Figure 4 Forest plots comparing high and low expression of CSNK2A1 in different TCGA tumors. (A) Progression-free interval analysis and (B) disease-specific survival analysis in different TCGA tumors were displayed using forest plot. *P<0.05; **P<0.01; ***P<0.001. Abbreviations: CSNK2A1, casein kinase 2 alpha protein 1; TCGA, the cancer genome atlas. |
Investigations of the survival data using the Kaplan–Meier Plotter online tool showed a significant correlation between high CSNK2A1 expression and poor RFS (HR=1.31, P=2.1e-07), OS (HR=1.34, P=0.0024) and DMFS (HR=1.19, P=0.031) prognosis for breast cancer and poor PFS (HR=1.4, P=1.7e-07) and OS (HR=1.14, P=0.049) prognosis for ovarian cancer (Supplementary Figure 3A). Moreover, highly expressed CSNK2A1 was also significantly associated with poor OS (HR=1.28, P=0.0095), FP (HR=1.45, P=0.00046) and PPS (HR=1.47, P=0.0019) prognosis for gastric cancer and poor OS (HR=1.98, P=0.00011), RFS (HR=1.52, P=0.02), PFS (HR=1.84, P=9.5e-05) and DSS (HR=1.92, P=0.0046) prognosis for liver cancer (Supplementary Figure 3B). The above data indicated that the level of CSNK2A1 expression was a great factor affecting the survival of tumors and in most types of cancers, CSNK2A1 was more likely to be a unfavorable prognostic marker in TCGA cancers.
Correlation Between CSNK2A1 Expression and Immune Infiltration in Cancers
TIICs were a important part of the TME that regulated progression of diverse tumors and affected patients’ survival. The findings of the above survival analysis supported a multifaceted prognostic role of CSNK2A1 in pan-cancer. Hence, we explored the correlation between CSNK2A1 expression and immune infiltration. We determined whether CSNK2A1 expression was associated with the immune infiltration level based on TCGA database by exploring the coefficient of CSNK2A1 expression and infiltration of 22 kinds of immune cell subtypes (Figure 5A). By using heatmap plot, we found resting-memory CD4+ T cells, CD8+ T cells and M1-Macrophages were three immune cell types most strongly correlated with CSNK2A1 expression across 33 cancer types. Moreover, the results also showed that BRCA, PRAD and UCEC were three cancers strongly correlated with CSNK2A1 expression in immune infiltration level. In BRCA, the level of CSNK2A1 expression positively correlated with resting-memory CD4+ T cells (R=0.13, P=9.6e-06) and M1-Macrophages (R=0.18, P=4.7e-09), and negatively correlated with CD8+ T cells (R=−0.16, P=1.4e-07) and monocytes (R=−0.18, P=3.1e-09). In PRAD, the level of CSNK2A1 expression positively correlated with resting-memory CD4+ T cells (R=0.10, P=0.00016) and M1-Macrophages (R=0.29, P=6.3e-09), and negatively correlated with CD8+ T cells (R=−0.22, P=1.4e-05) and activated-NK cells (R=−0.19, P=0.00015). In UCEC, the level of CSNK2A1 expression positively correlated with resting-memory CD4+ T cells (R=0.15, P=0.0011) and M1-Macrophages (R=0.17, P=0.00018), and negatively correlated with CD8+ T cells (R=−0.15, P=0.00092) and plasma cells (R=−0.26, P=5.5e-09). (Figure 5B). Meanwhile, correlations between CSNK2A1 expression and infiltration levels of cancer-associated fibroblasts and endothelial cells across TCGA tumors were performed via TIMER2.0 online tool and the results showed that CSNK2A1 expression had significant positive correlation with infiltration levels of cancer-associated fibroblasts across diverse TCGA cancers (Supplementary Figure 4). Therefore, these findings strongly showed that CSNK2A1 expression was tightly correlated with the cell subtype and activity status of immune infiltration in tumors and could affect patients’ survival by interacting with immune infiltration in cancers.
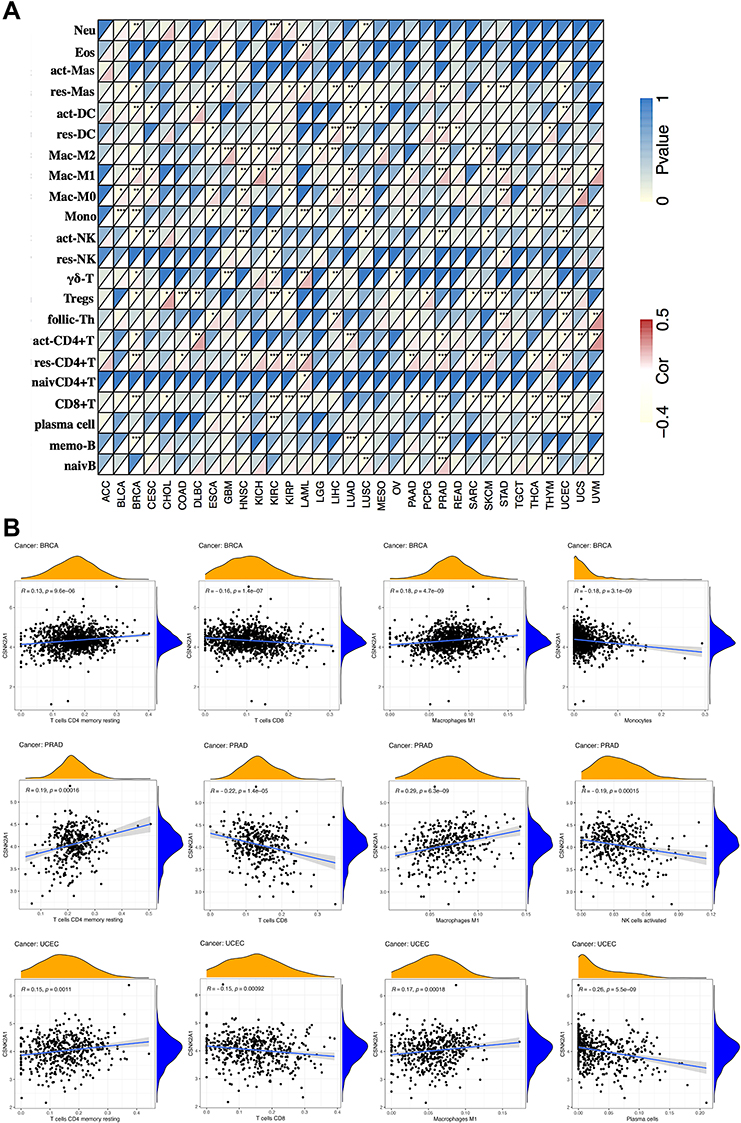 |
Figure 5 Correlation of CSNK2A1 expression with immune infiltration level in TCGA cancers. (A) Correlation of CSNK2A1 expression with infiltration level of 22 kinds of immune cell subtypes in TCGA. Immune cells positively correlating with CSNK2A1 expression in TCGA database were labeled in red, while immune cells negatively correlating with CSNK2A1 expression in TCGA database were labeled in yellow. (B) Correlation of CSNK2A1 expression with immune infiltration level in BRCA, PRAD and UCEC. CSNK2A1 expression had significant positive correlation with resting CD4+ T memory cells and M1-macrophages, and significant negative correlation with CD8+ T cells, monocytes, activated NK cells and plasma cells. *P<0.05; **P<0.01; ***P<0.001. Abbreviations: CSNK2A1, casein kinase 2 alpha protein 1; TCGA, the cancer genome atlas; Neu, neutrophils; Eos, eosinophils; act-Mas, activated mast cells; res-Mas, resting mast cells; act-DC, activated dendritic cells; res-DC, resting dendritic cells; Mac-M2, macrophages M2; Mac-M1, macrophages M1; Mac-M0, macrophages M0; Mono, monocytes; act-NK, activated NK cells; res-NK, resting NK cells; γδ-T, γδ-T cells; Tregs, regulatory T cells; follic-Th, follicular T helper cells; act-CD4+T, activated CD4+ T memory cells; res-CD4+T, resting CD4+ T memory cells; naivCD4+T, naive CD4+ T cells; CD8+T, CD8+ T cells; memo-B, memory B cells; naivB, naive B cells; BRCA, breast invasive carcinoma; PRAD, prostate adenocarcinoma; UCEC, uterine corpus endometrial carcinoma. |
Correlations Between CSNK2A1 Expression and Immune Checkpoint Marker Sets, TMB and MSI in Cancers
It was widely accepted that the immunosurveillance played an important role in determining the prognosis of diverse types of tumors. Cancer cells could evade immunosurveillance by taking advantage of immune checkpoint genes, such as CTLA4 and PDCD1. Our above analysis revealed that CSNK2A1 might serve as a potential vital biomarker for immune infiltration and an unfavorable prognostic marker in cancers. Hence, it would be meaningful to explore the association between CSNK2A1 expression and tumor immunotherapy biomarkers including immune checkpoint marker sets, TMB and MSI. Firstly, we determined whether CSNK2A1 expression was associated with the immune checkpoint marker sets based on TCGA dataset by exploring the coefficient of CSNK2A1 expression and expression of 47 kinds of immune checkpoint gene markers (Figure 6A). In LIHC, CSNK2A1 expression was positively correlated with the expressions of 39 kinds of immune checkpoint genes (all P<0.05). Meanwhile, In UVM, CSNK2A1 expression was positively correlated with the expressions of 33 kinds of immune checkpoint genes (all P<0.05). On the contrary, CSNK2A1 expression was negatively correlated with the expressions of 35 kinds of immune checkpoint genes In LUSC (all P<0.05). These findings suggested that the expression of CSNK2A1 probably played a vital role in mediating immune evasion in various types of cancer, although the relationship between CSNK2A1 expression and the expression of immune checkpoint marker sets may vary depending on cancer type. On the other hand, it was widely noticed that higher somatic TMB and MSI were correlated with favorable OS and an optimal response to immunotherapy in cancer patients. Therefore, we then analyzed the correlations between CSNK2A1 expression and TMB, MSI in cancers. As shown in Figure 6B, CSNK2A1 was positively correlated with TMB in BLCA (P<0.05), LAML (P<0.05), LGG (P<0.01), OV (P<0.05), PAAD (P<0.001), PRAD (P<0.01), STAD (P<0.001) and TGCT (P<0.05), and none of cancers with CSNK2A1 expression had significant negative correlation with TMB. In addition, CSNK2A1 was positively correlated with MSI in UCEC (P<0.05), STAD (P<0.01), READ (P<0.01) and LIHC (P<0.01), and negatively correlated with MSI in THCA (P<0.001), SKCM (P<0.05), LGG (P<0.001), HNSC (P<0.05) and DLBC (P<0.001) (Figure 6C). All these findings together showed that high CSNK2A1 expression was widely associated with immunity in cancers and some types of tumor like LIHC with high expression of CSNK2A1 potentially showed a favorable response to immunotherapy.
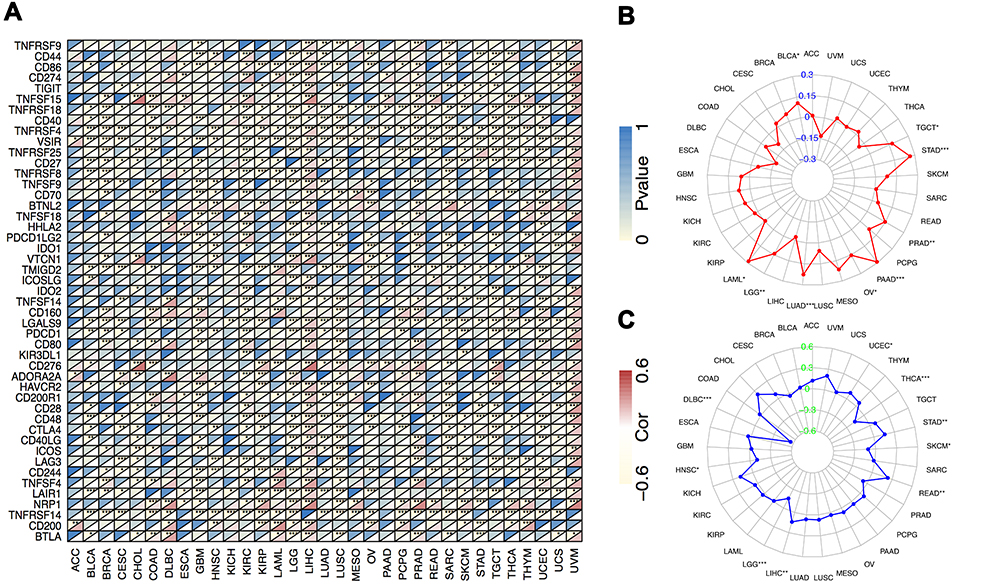 |
Figure 6 Correlations between CSNK2A1 expression and tumor immunotherapy biomarkers in TCGA cancers. (A) Correlation between CSNK2A1 expression and immune checkpoint marker sets. (B) Radar map of correlation between CSNK2A1 expression and TMB. (C) Radar map of correlation between CSNK2A1 expression and MSI. *P<0.05; **P<0.01; ***P<0.001. Abbreviations: CSNK2A1, casein kinase 2 alpha protein 1; TCGA, the cancer genome atlas; TMB, tumor mutational burden; MSI, microsatellite instability. |
Validation of the CSNK2A1 Expression Levels in Clinical Tissue Samples from LIHC Patients of SYSUCC Cohort
IHC staining comparison of CSNK2A1 expression status between tumor tissues and adjacent normal tissues from LIHC patients was performed to validate previous bioinformatic results. According to the results of IHC-P score of CSNK2A1 in tumor tissues from SYSUCC cohort, we could divide SYSUCC cohort (48 cases) into high CSNK2A1-expression tumor tissue group (35 cases) and low CSNK2A1-expression tumor tissue group (13 cases). The IHC results showed that CSNK2A1 were significantly overexpressed in the tumor tissues (both the high CSNK2A1-expression tumor tissue group [P < 0.001] and low CSNK2A1-expression tumor tissue group [P = 0.009]) than normal tissue, which was consistent with the results in TCGA database (Figures 7A and C).
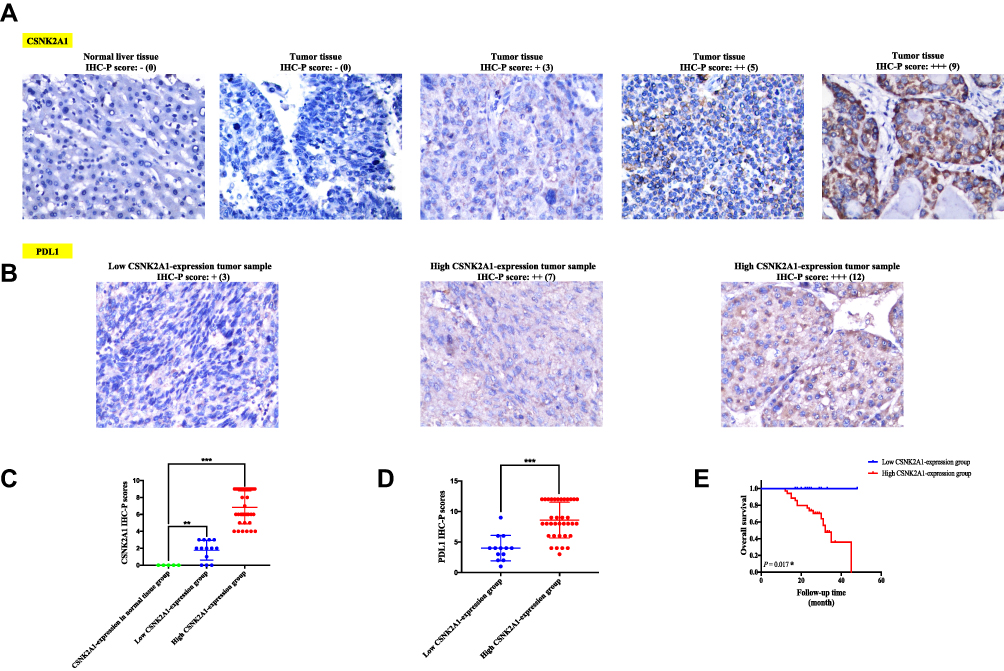 |
Figure 7 Validation analyses for confirming the immunological and prognostic role of CSNK2A1 in LIHC based on bioinformatic tools. (A) Representative photomicrographs of IHC staining of CSNK2A1 in normal liver tissue and LIHC tissues from high and low CSNK2A1-expression tumor tissue groups. (B) Representative photos of IHC staining of PDL1 in LIHC tissues from high and low CSNK2A1-expression tumor tissue groups. (C) The IHC-P scores of CSNK2A1 in normal liver tissue and LIHC tissues from high and low CSNK2A1-expression tumor tissue groups were compared using Mann–Whitney U-test. (D) The IHC-P scores of PDL1 in LIHC tissues from high and low CSNK2A1-expression tumor tissue groups were compared using Mann–Whitney U-test. (E) Kaplan–Meier curve of OS for clinical LIHC patients with high and low expression of CSNK2A1. ***P<0.001. Abbreviations: CSNK2A1, casein kinase 2 alpha protein 1; LIHC, liver hepatocellular carcinoma; PDL1, programmed death ligand-1; IHC, Immunohistochemistry; IHC-P, Immunohistochemistry protein expression; OS, overall survival. |
Validation of the Relationship Between CSNK2A1 Expression and Immune Checkpoint Gene (PDL1) Expression in Clinical Tissue Samples from LIHC Patients of SYSUCC Cohort
To confirm the reliability of previous bioinformatic findings that CSNK2A1 expression was positively correlated with the expressions of immune checkpoint markers in LIHC, we decided to detect protein expression of PDL1, one of the most representative immune checkpoint protein, in tumor tissues of the high and low CSNK2A1-expression tumor tissue groups from SYSUCC cohort using IHC staining. The results revealed that the IHC-P score of PDL1 was significantly higher in high CSNK2A1-expression tumor tissue group than those in low CSNK2A1-expression tumor tissue group (P<0.001). These results confirmed the above finding through a TCGA database analysis that high expression of CSNK2A1 had strong positive coefficients with the expression level of PDL1 in LIHC, providing clinical evidence on the conclusion that CSNK2A1 could be a novel immunotherapy-related biomarker in cancers, especially in LIHC (Figures 7B and D).
Survival Analysis to Confirm the Role of CSNK2A1 in LIHC Prognosis Prediction Based on TCGA Database
We have previously found that high expression level of CSNK2A1 was linked to poor prognosis of OS for LIHC in TCGA dataset. Following this, we performed a retrospective clinical study on our own patients to determine whether the expression level of CSNK2A1 could predict the prognosis of patients with LIHC. Survival analysis of the 48 clinical LIHC patients was conducted. As shown in Figure 7E, LIHC patients with high levels of protein expression of CSNK2A1 in tumor tissues had significantly shorter OS times compared to those with low expression levels of CSNK2A1 (P = 0.017), which was consistent with our previous bioinformatic results in LIHC cases from TCGA dataset.
PPI Network and Enrichment Analysis of CSNK2A1 in Cancers
Next, to explore the potential roles that CSNK2A1 took part in the carcinogensis of cancers, we used GeneMANIA online tool to obtain a PPI network for CSNK2A1. As vividly shown in Figure 8A, CSNK2A1 had strong co-localization with dishevelled 1 (DVL1), which had crucial roles in tumor progression and cancer metastasis.40 Both CSNK2A1 and DVL1 were tightly involved in Wnt signaling pathway, they played as regulators in activating Wnt signaling and promoting tumor progression, metastasis and chemoresistance in many cancers like lung cancer, hepatocellular carcinoma and prostate cancer.41 This happened to be consistent with the results of the co-localization. Then, GSEA was performed to explore the functional enrichment of high CSNK2A1 expression and low CSNK2A1 expression. KEGG enrichment term showed that high expression of CSNK2A1 was mostly associated with cell signaling pathways, most of them were involved in varieties of tumor biological activity, including JAK/STAT pathway, chemokine-related pathway and signaling pathways mediating by Toll-like receptor and Nod-like receptor. KEGG enrichment term also exhibited that low expression of CSNK2A1 was significantly associated with metabolic-related activities, including ascorbate/aldarate metabolism, drug metabolism cytochrome P450 and retinol metabolism (Figure 8B, upper). Meanwhile, GO enrichment term demonstrated that high expression of CSNK2A1 was mainly associated with immunity-related activities, including B cell-mediated immunity, humoral immune response, lymphocyte-mediated immunity and regulations of B cell activation and complement activation. Furthermore, GO enrichment term also revealed that low expression of CSNK2A1 was significantly related to the negative regulation of endothelial cell proliferation and mRNA-binding (Figure 8B, lower).
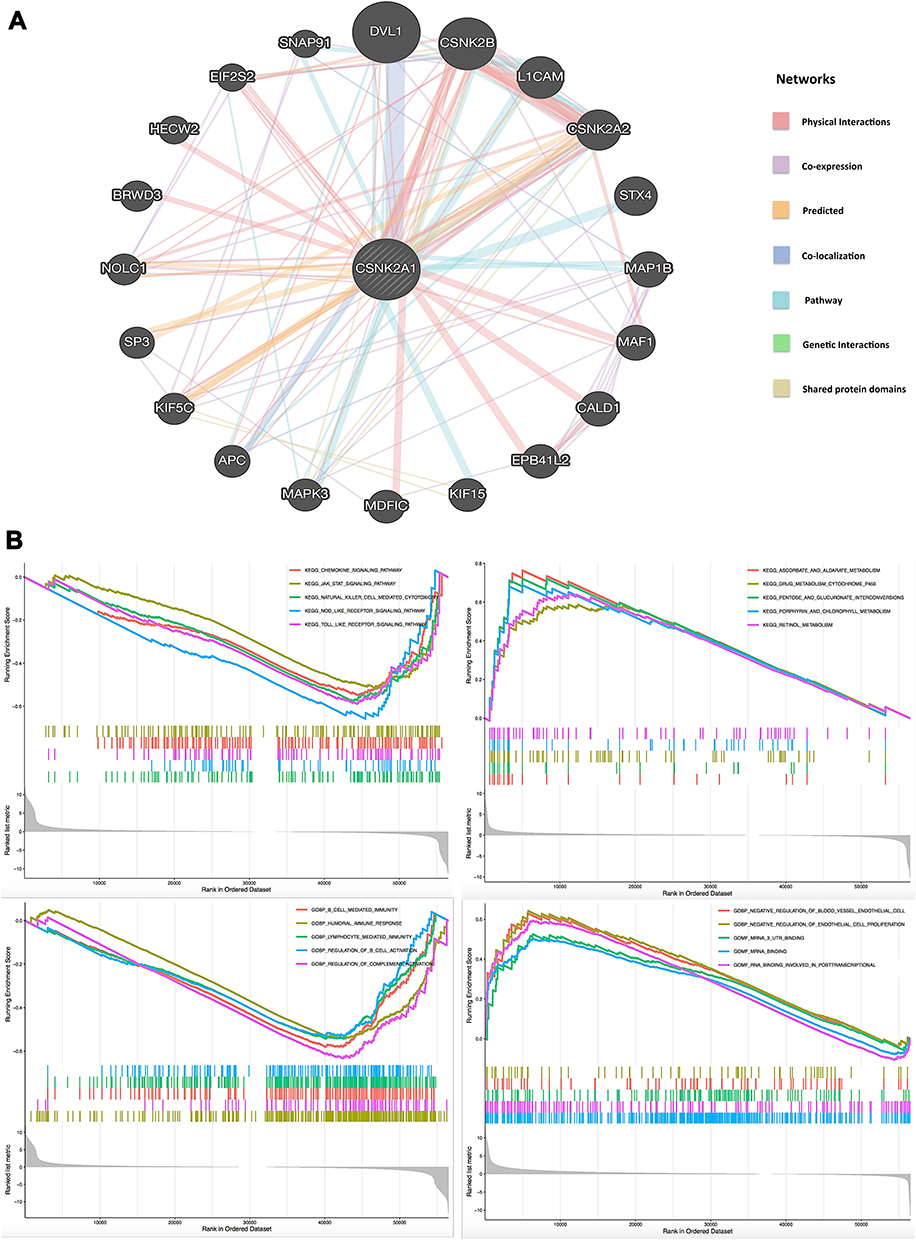 |
Figure 8 PPI network and GSEA of CSNK2A1 expression in TCGA cancers. (A) PPI network for CSNK2A1 was constructed using GeneMANIA tool. (B) The enriched gene sets in KEGG and GO collection by the high and low CSNK2A1 expression. Each line representing one specific gene set with unique color, and up-regulated genes gathered in the left of x-axis, while the down-regulated genes located in the right of x-axis. Only several leading gene sets with NOM p<0.05 and FDR q<0.25 were displayed in the plot. Abbreviations: CSNK2A1, casein kinase 2 alpha protein 1; TCGA, the cancer genome atlas; PPI, protein–protein interaction; GSEA, gene set enrichment analysis; KEGG, Kyoto Encyclopedia of Genes and Genomes; GO, Gene Ontology. |
Discussion
Emerging studies have indicated a function link between CSNK2A1 and clinical diseases, including neurodevelopmental disorders42 and various types of cancer.7–13 Whether CSNK2A1 could play roles in the oncogenesis of different cancers via certain common molecular mechanisms remains to be answered. By searching the literature, we failed to find any study with an integrative pan-cancer analysis of CSNK2A1 from the perspective of overall cancers. Therefore, we comprehensively explore the molecular features of CSNK2A1, especially the prognostic and immunological features, in a total of 33 different cancers based on various databases and online platforms.
Previous studies had proved that CSNK2A1 was highly expressed in most tumors. In this study, by integrating different independent datasets, including TCGA, GTEx and CPTAC databases, we identified the consistent results that CSNK2A1, compared with expression levels in normal adjacent tissues of cancer patients, was significantly highly expressed in tumor tissues in most types of cancers, including brain, bladder, breast, ovarian, cervical, pancreatic, prostate, colorectal, esophageal, hepatobiliary, lung, gastric, kidney and thyroid cancers, as well as thymoma, lymphoma and HNSC (Figure 1), which suggest that CSNK2A1 is probably a common vital biological factor involving in varieties of cancers. On the other hand, we used a wide range of prognostic indicators, including OS, DFS, PFI/PFS, DSS, RFS, DMFS, FP and PPS to thoroughly evaluate the prognostic value of CSNK2A1 expression in TCGA cancers across various platforms. The analysis of GEPIA2.0 revealed that up-regulated CSNK2A1 expression were correlated with a poor OS in LIHC, LUSC, MESO, PAAD and SARC, as well as a poor DFS in BLCA, MESO, PAAD and UVM. However, high expression of CSNK2A1 was only associated with favorable clinical outcomes of OS and DFS in KIRP (Figure 3). In addition, we also used R language software with the “forestplot” package to perform a Cox regression survival analysis of data on TCGA cancers and found that increased CSNK2A1 expression levels could be used as an independent risk factor for poor prognosis of PFI in LIHC, MESO and UVM, and poor prognosis of DSS in MESO, UCEC and UVM. In contrast, in LGG and READ, a high level of CSNK2A1 expression was shown to be related to an independent favorable factor for PFI and DSS, respectively (Figure 4). Meanwhile, we used another web server, Kaplan–Meier Plotter, to conduct a survival analysis for further exploring the relationships between CSNK2A1 expression and prognostic indicators in cancers, and observed that increased expression of CSNK2A1 was correlated with poor prognosis of RFS, OS and DMFS in breast cancer (BRCA), poor outcomes of OS and PFS in ovarian cancer (OV), poor outcomes of OS, FP and PPS in gastric cancer (STAD) and poor prognosis of OS, RFS, PFS and DSS in liver cancer (LIHC) (Figure S3). Moreover, the expression of CSNK2A1 and its prognostic prediction value were further validated in our clinical LIHC patients and their samples from SYSUCC cohort. The results of validation experiments demonstrated that CSNK2A1 was significantly overexpressed in LIHC tumor tissues compared with para-carcinoma normal tissues, and high expression of CSNK2A1 was related to poor prognosis for clinical LIHC patients, showing the same expression pattern and prognostic prediction as that obtained from public dataset analysis (Figure 7A, C and E). Taken together, these findings strongly indicate that CSNK2A1 can serve as a multifaceted prognostic biomarker in pan-cancer and high expression of CSNK2A1 seems to be linked to an unfavorable clinical prognosis in certain TCGA tumors, especially in LIHC.
Another major finding from the current study is that CSNK2A1 expression has close relationships with immunity in cancers. Under normal conditions, human immune system could recognize and eliminate cancer cells in TME at the early stage. Indeed, it is still acknowledged that activated CD4+/CD8+ T cells and NK cells could prevent the progression of cancer in the early stage by attacking tumor cells directly.16,18 However, once a cancer progresses past the early stage, more and more tumor cells survive and adopt different strategies provided by specific types of TIICs in TME to escape immunosurveillance and grow, making body’s immune system restrained eventually. For example, tumor-associated M1-macrophages could protect cancer cells via promoting cancer immune evasion, metastasis and tumor angiogenesis.43,44 Cancer-associated fibroblasts in TME may promote tumor angiogenesis and metastasis.45 Thus, the subtype and status of TIICs in TME have a important impact on patient’s outcome with diverse tumors. Here, we collected more than 20 common TIICs and analyzed the relationship between CSNK2A1 expression and infiltration levels of TIICs. The results demonstrated that CSNK2A1 expression correlated with diverse immune infiltration levels in TCGA cancers and resting-memory CD4+ T cells, CD8+ T cells and M1-Macrophages were three most common immune cell types correlated with CSNK2A1 expression in cancers, suggesting that specific interactions between CSNK2A1 and certain immune cell subtypes (Figure 5A). In particular, in BRCA, PRAD and UCEC, high expression of CSNK2A1 had positive coefficients with the infiltration level of resting-memory CD4+ T cells and M1-macrophages, and negative coefficient with the infiltration level of CD8+ T cells. Besides that, up-regulation of CSNK2A1 also had negative coefficients with the infiltration level of monocytes, activated-NK cells and plasma cells in BRCA, PRAD and UCEC, respectively (Figure 5B). In addition, we also found that high expression of CSNK2A1 had positive association with the infiltration level of cancer-associated fibroblasts in certain TCGA tumors (Supplementary Figure 4). Taken together, these findings suggest that CSNK2A1 may play an important role in the recruitment and regulation of TIICs in cancers and could promote tumor immune evasion, metastasis and angiogenesis via down-regulating the proportions of activated tumor infiltrating lymphocytes such as CD8+ T cells, plasma cells and NK cells, and recruiting the tumor-associated macrophages (M1), fibroblasts and inactivated tumor infiltrating lymphocytes like resting-memory CD4+ T cells, which may finally influence patient survival.
On the other hand, tumor immunotherapy could recover the normal anticancer immune response, including cancer vaccines and immune checkpoint inhibitors. Increased expression of immune checkpoint genes by TIICs like PD-1 or PD-L1 was associated with poor prognosis and favorable response to immunotherapy in patients with cancers.23 Investigating the correlations between the expression of immune checkpoint genes and the expression of interest gene could not only help predict the prognosis of cancer patients with high expression of interest gene, but also help determine the response to immunotherapy in these patients. Thus, we gathered more than 40 common immune checkpoint genes, extracted these gene markers, respectively, and analyzed the associations with the expression of CSNK2A1 (Figure 6A). The results revealed that in LIHC, CSNK2A1 expression was positively correlated with the expressions of more than 30 kinds of immune checkpoint genes. These findings can help explain other findings from this study indicating that high expression of CSNK2A1 is correlated with a worse prognosis in patients with LIHC. In addition, it is reasonable to surmise that LIHC patients with high expression of CSN2A1 have relatively favorable response to immunotherapy, this finding has been validated by our preliminary IHC study, which showed that CSNK2A1 expression was positively associated with PDL1 expression in clinical LIHC samples (Figures 7B and D). The other two immunotherapy-related biomarkers are TMB and MSI. TMB is a potential biomarker to predict the response to immune checkpoint inhibitors, and MSI is associated with a higher risk of tumor with specific clinicopathological features, including higher proportions of tumor-infiltrating lymphocytes and increased level of TMB. It is widely acknowledged that the higher levels of TMB/MSI, the better response to immunotherapy in cancer patients. In the current study, we presented evidences of the potential correlation between CSNK2A1 and TMB/MSI across all TCGA cancers (Figures 6B and C), and the results demonstrated that patients with PAAD and STAD had the most significant positive coefficients between TMB and the CSNK2A1 expression level (All P<0.001), and patients with STAD, READ and LIHC showed the most significant positive coefficients between MSI and the expression level of CSNK2A1 (All P<0.01), suggesting these tumors patients, especially LIHC patients, with up-regulated CSNK2A1 expression are more likely to show an optimal response to immunotherapy.
Taken these findings together, our study sheds light on understanding the potential role of CSNK2A1 in tumor immunity and its use as a new immunotherapy-related biomarker of cancers. Besides that, GO enrichment analysis showed that high expression of CSNK2A1 was mainly correlated with immunity-related activities (Figure 8B), further suggesting that CSNK2A1 is strongly and universally associated with tumor immunity.
Conclusions
In summary, the findings of the current report displayed the expression pattern, prognostic significance and immunological role of CSNK2A1 in multiple human tumors, and these main findings were validated in clinical LIHC patients and samples. The main findings and future perspectives of the study (Supplementary Figure 5) were summarized as follows: (1) CSNK2A1 could be considered as a vital prognostic biomarker in pan-cancer and a latent target for tumor therapy since it showed up-regulation in diverse cancers and associated with poor prognosis in certain TCGA tumors, especially in LIHC, these findings were validated by an IHC and survival analysis on clinical LIHC patients. (2) Besides that, to our knowledge, there were few published studies focusing on the immunological role of CSNK2A1 in cancers. Our data provided some new information in this respect. Through a data-mining analysis and following IHC validation experiments, we found for the first time that CSNK2A1 expression was strongly positively associated with the expression of PDL1 in LIHC, which indicated that CSNK2A1 could serve as a novel immunotherapy-related biomarker in LIHC. (3) On the other hand, even though the data-mining analysis and following IHC validation experiments supported us some valuable insights of CSNK2A1 in immune-based anti-tumor strategy in cancers, further mechanistic experiments at the cellular and molecular levels are still needed in future for elucidating the exact role of CSNK2A1 in cancer immunity. (4) Moreover, additional prospective clinical studies are also needed in future for evaluating its use as a novel tumor immunotherapy-related biomarker.
Data Sharing Statement
Publicly available datasets and platform were analyzed in this research. This data can be found here: The Cancer Genome Atlas (https://portal.gdc.cancer.gov/), TIMER2.0 (http://timer.cistrome.org), GEPIA2.0 (http://gepia2.cancer-pku.cn/#index), Ualcan (http://ualcan.path.uab.edu/index.html), cBioportal (http://cbioportal.org), GeneMANIA (http://www.genemania.org), The Human Protein Atlas (http://www.proteinatlas.org), Kaplan–Meier Plotter (http://www.kmplot.com).
Acknowledgments
We acknowledge Qiong Shao and Xu Zhang from Sun Yat-sen Cancer Center for helping us to perform validation experiments. We also thank Zhe Meng from Sun Yat-sen Memorial Hospital for the funding acquisition.
Funding
This study was supported jointly by the Hygiene Ministry Foundation of Guangdong Province, China (Grant No.4250012039) and the National Natural Science Foundation of China (Grant No.81800155).
Disclosure
The authors declare that they have no conflicts of interest in this work.
References
1. Blum A, Wang P, Zenklusen JC. SnapShot: TCGA-analyzed tumors. Cell. 2018;173(2):530. doi:10.1016/j.cell.2018.03.059
2. Tomczak K, Czerwińska P, Wiznerowicz M. The Cancer Genome Atlas (TCGA): an immeasurable source of knowledge. Contemp Oncol (Pozn). 2015;19(1a):A68–77. doi:10.5114/wo.2014.47136
3. Clough E, Barrett T. The Gene Expression Omnibus Database. Methods Mol Biol. 2016;1418:93–110. doi:10.1007/978-1-4939-3578-9_5
4. Guerra B, Issinger OG. Protein kinase CK2 and its role in cellular proliferation, development and pathology. Electrophoresis. 1999;20(2):391–408. doi:10.1002/(sici)1522-2683(19990201)20:2<391::Aid-elps391>3.0.Co;2-n
5. Borgo C, D’Amore C, Sarno S, Salvi M, Ruzzene M. Protein kinase CK2: a potential therapeutic target for diverse human diseases. Signal Transduct Target Ther. 2021;6(1):183. doi:10.1038/s41392-021-00567-7
6. Guerra B, Issinger OG. Protein kinase CK2 in human diseases. Curr Med Chem. 2008;15(19):1870–1886. doi:10.2174/092986708785132933
7. Hung MS, Lin YC, Mao JH, et al. Functional polymorphism of the CK2alpha intronless gene plays oncogenic roles in lung cancer. PLoS One. 2010;5(7):e11418. doi:10.1371/journal.pone.0011418
8. Zhang HX, Jiang SS, Zhang XF, et al. Protein kinase CK2α catalytic subunit is overexpressed and serves as an unfavorable prognostic marker in primary hepatocellular carcinoma. Oncotarget. 2015;6(33):34800–34817. doi:10.18632/oncotarget.5470
9. Ma Z, Wang X, He J, Xia J, Li Y. Increased expression of protein kinase CK2α correlates with poor patient prognosis in epithelial ovarian cancer. PLoS One. 2017;12(3):e0174037. doi:10.1371/journal.pone.0174037
10. Qaiser F, Trembley JH, Sadiq S, et al. Examination of CK2α and NF-κB p65 expression in human benign prostatic hyperplasia and prostate cancer tissues. Mol Cell Biochem. 2016;420(1–2):43–51. doi:10.1007/s11010-016-2765-3
11. Zou J, Luo H, Zeng Q, Dong Z, Wu D, Liu L. Protein kinase CK2α is overexpressed in colorectal cancer and modulates cell proliferation and invasion via regulating EMT-related genes. J Transl Med. 2011;9(1):97. doi:10.1186/1479-5876-9-97
12. Pizzi M, Piazza F, Agostinelli C, et al. Protein kinase CK2 is widely expressed in follicular, Burkitt and diffuse large B-cell lymphomas and propels malignant B-cell growth. Oncotarget. 2015;6(9):6544–6552. doi:10.18632/oncotarget.3446
13. Kim JS, Eom JI, Cheong J-W, et al. Protein kinase CK2α as an unfavorable prognostic marker and novel therapeutic target in acute myeloid leukemia. Clin Cancer Res. 2007;13(3):1019–1028. doi:10.1158/1078-0432.Ccr-06-1602
14. Li ZS, Deng CZ, Ye YL, et al. More precise prediction in Chinese patients with penile squamous cell carcinoma: protein kinase CK2α catalytic subunit (CK2α) as a poor prognosticator. Oncotarget. 2017;8(31):51542–51550. doi:10.18632/oncotarget.17935
15. Rabjerg M, Guerra B, Oliván-Viguera A, et al. Nuclear localization of the CK2α-subunit correlates with poor prognosis in clear cell renal cell carcinoma. Oncotarget. 2017;8(1):1613–1627. doi:10.18632/oncotarget.13693
16. Xu WX, Zhang J, Hua YT, Yang SJ, Wang DD, Tang JH. An integrative pan-cancer analysis revealing LCN2 as an oncogenic immune protein in tumor microenvironment. Front Oncol. 2020;10:605097. doi:10.3389/fonc.2020.605097
17. Bindea G, Mlecnik B, Tosolini M, et al. Spatiotemporal dynamics of intratumoral immune cells reveal the immune landscape in human cancer. Immunity. 2013;39(4):782–795. doi:10.1016/j.immuni.2013.10.003
18. Yuan Q, Sun N, Zheng J, et al. Prognostic and immunological role of FUN14 domain containing 1 in pan-cancer: friend or foe? Front Oncol. 2019;9:1502. doi:10.3389/fonc.2019.01502
19. Gajewski TF, Schreiber H, Fu YX. Innate and adaptive immune cells in the tumor microenvironment. Nat Immunol. 2013;14(10):1014–1022. doi:10.1038/ni.2703
20. Topalian SL, Drake CG, Pardoll DM. Immune checkpoint blockade: a common denominator approach to cancer therapy. Cancer Cell. 2015;27(4):450–461. doi:10.1016/j.ccell.2015.03.001
21. Quail DF, Joyce JA. Microenvironmental regulation of tumor progression and metastasis. Nat Med. 2013;19(11):1423–1437. doi:10.1038/nm.3394
22. Schumacher TN, Schreiber RD. Neoantigens in cancer immunotherapy. Science. 2015;348(6230):69–74. doi:10.1126/science.aaa4971
23. Becht E, Giraldo NA, Dieu-Nosjean MC, Sautès-Fridman C, Fridman WH. Cancer immune contexture and immunotherapy. Curr Opin Immunol. 2016;39:7–13. doi:10.1016/j.coi.2015.11.009
24. Colwill K, Gräslund S. A roadmap to generate renewable protein binders to the human proteome. Nat Methods. 2011;8(7):551–558. doi:10.1038/nmeth.1607
25. Carithers LJ, Moore HM. The Genotype-Tissue Expression (GTEx) project. Biopreserv Biobank. 2015;13(5):307–308. doi:10.1089/bio.2015.29031.hmm
26. Abugessaisa I, Noguchi S, Carninci P, The KT. FANTOM5 computation ecosystem: genomic information hub for promoters and active enhancers. Methods Mol Biol. 2017;1611:199–217. doi:10.1007/978-1-4939-7015-5_15
27. Rudnick PA, Markey SP, Roth J, et al. A description of the Clinical Proteomic Tumor Analysis Consortium (CPTAC) common data analysis pipeline. J Proteome Res. 2016;15(3):1023–1032. doi:10.1021/acs.jproteome.5b01091
28. Li T, Fu J, Zeng Z, et al. TIMER2.0 for analysis of tumor-infiltrating immune cells. Nucleic Acids Res. 2020;48(W1):W509–w514. doi:10.1093/nar/gkaa407
29. Wang F, Yuan C, Wu HZ, Liu B, Yang YF. Bioinformatics, molecular docking and experiments in vitro analyze the prognostic value of CXC chemokines in breast cancer. Front Oncol. 2021;11:665080. doi:10.3389/fonc.2021.665080
30. Chandrashekar DS, Bashel B, Balasubramanya SAH, et al. UALCAN: a portal for facilitating tumor subgroup gene expression and survival analyses. Neoplasia. 2017;19(8):649–658. doi:10.1016/j.neo.2017.05.002
31. Wu P, Heins ZJ, Muller JT, et al. Integration and analysis of CPTAC proteomics data in the context of cancer genomics in the cBioPortal. Mol Cell Proteomics. 2019;18(9):1893–1898. doi:10.1074/mcp.TIR119.001673
32. Pettersen EF, Goddard TD, Huang CC, et al. UCSF Chimera–a visualization system for exploratory research and analysis. J Comput Chem. 2004;25(13):1605–1612. doi:10.1002/jcc.20084
33. Nagy Á, Munkácsy G, Győrffy B. Pancancer survival analysis of cancer hallmark genes. Sci Rep. 2021;11(1):6047. doi:10.1038/s41598-021-84787-5
34. Darvin P, Toor SM, Sasidharan Nair V, Elkord E. Immune checkpoint inhibitors: recent progress and potential biomarkers. Exp Mol Med. 2018;50(12):1–11. doi:10.1038/s12276-018-0191-1
35. Hendriks LE, Rouleau E, Besse B. Clinical utility of tumor mutational burden in patients with non-small cell lung cancer treated with immunotherapy. Transl Lung Cancer Res. 2018;7(6):647–660. doi:10.21037/tlcr.2018.09.22
36. Hause RJ, Pritchard CC, Shendure J, Salipante SJ. Classification and characterization of microsatellite instability across 18 cancer types. Nat Med. 2016;22(11):1342–1350. doi:10.1038/nm.4191
37. Franz M, Rodriguez H, Lopes C, et al. GeneMANIA update 2018. Nucleic Acids Res. 2018;46(W1):W60–w64. doi:10.1093/nar/gky311
38. Subramanian A, Tamayo P, Mootha VK, et al. Gene set enrichment analysis: a knowledge-based approach for interpreting genome-wide expression profiles. Proc Natl Acad Sci USA. 2005;102(43):15545–15550. doi:10.1073/pnas.0506580102
39. Gao J, Aksoy BA, Dogrusoz U, et al. Integrative analysis of complex cancer genomics and clinical profiles using the cBioPortal. Sci Signal. 2013;6(269):pl1. doi:10.1126/scisignal.2004088
40. Kafka A, Tomas D, Beroš V, Pećina HI, Zeljko M, Pećina-šlaus N. Brain metastases from lung cancer show increased expression of DVL1, DVL3 and beta-catenin and down-regulation of E-cadherin. Int J Mol Sci. 2014;15(6):10635–10651. doi:10.3390/ijms150610635
41. Liao WY, Hsu CC, Chan TS, et al. Dishevelled 1-regulated superpotent cancer stem cells mediate Wnt heterogeneity and tumor progression in Hepatocellular carcinoma. Stem Cell Rep. 2020;14(3):462–477. doi:10.1016/j.stemcr.2020.02.003
42. Wu RH, Tang WT, Qiu KY, et al. Identification of novel CSNK2A1 variants and the genotype-phenotype relationship in patients with Okur-Chung neurodevelopmental syndrome: a case report and systematic literature review. J Int Med Res. 2021;49(5):3000605211017063. doi:10.1177/03000605211017063
43. Cancer: CM. Re-educating tumour-associated macrophages with nanoparticles. Nat Rev Drug Discov. 2018;17(7):468. doi:10.1038/nrd.2018.102
44. Goswami S, Sahai E, Wyckoff JB, et al. Macrophages promote the invasion of breast carcinoma cells via a colony-stimulating factor-1/epidermal growth factor paracrine loop. Cancer Res. 2005;65(12):5278–5283. doi:10.1158/0008-5472.Can-04-1853
45. Sahai E, Astsaturov I, Cukierman E, et al. A framework for advancing our understanding of cancer-associated fibroblasts. Nat Rev Cancer. 2020;20(3):174–186. doi:10.1038/s41568-019-0238-1
 © 2021 The Author(s). This work is published and licensed by Dove Medical Press Limited. The full terms of this license are available at https://www.dovepress.com/terms.php and incorporate the Creative Commons Attribution - Non Commercial (unported, v3.0) License.
By accessing the work you hereby accept the Terms. Non-commercial uses of the work are permitted without any further permission from Dove Medical Press Limited, provided the work is properly attributed. For permission for commercial use of this work, please see paragraphs 4.2 and 5 of our Terms.
© 2021 The Author(s). This work is published and licensed by Dove Medical Press Limited. The full terms of this license are available at https://www.dovepress.com/terms.php and incorporate the Creative Commons Attribution - Non Commercial (unported, v3.0) License.
By accessing the work you hereby accept the Terms. Non-commercial uses of the work are permitted without any further permission from Dove Medical Press Limited, provided the work is properly attributed. For permission for commercial use of this work, please see paragraphs 4.2 and 5 of our Terms.