")
Back to Journals » OncoTargets and Therapy » Volume 11
An integrated analysis of key microRNAs, regulatory pathways and clinical relevance in bladder cancer
Received 24 February 2018
Accepted for publication 9 April 2018
Published 24 May 2018 Volume 2018:11 Pages 3075—3085
DOI https://doi.org/10.2147/OTT.S166506
Checked for plagiarism Yes
Review by Single anonymous peer review
Peer reviewer comments 3
Editor who approved publication: Dr Samir Farghaly
Dongyang Li,1 Xuanyu Hao,2 Yongsheng Song1
1Department of Urology, Shengjing Hospital of China Medical University, Shenyang, Liaoning 110004, People’s Republic of China; 2Department of Rheumatology and Immunology, Shengjing Hospital of China Medical University, Shenyang, Liaoning 110022, People’s Republic of China
Objective: The aim of this study was to identify the key microRNAs (miRNAs) and their regulatory networks in bladder cancer (BC).
Materials and methods: Three miRNA and three gene expression microarray datasets were downloaded for analysis from Gene Expression Omnibus database. The differentially expressed miRNAs (DEMs) and differentially expressed genes (DEGs) were accessed by the use of GEO2R. Gene ontology process and Kyoto Encyclopedia of Genes and Genomes pathway enrichment analyses were performed by using the Database for Annotation, Visualization and Integrated Discovery program. Protein–protein interaction (PPI) and miRNA–mRNA regulatory networks were established by using the Search Tool for the Retrieval of Interacting Genes/Proteins and Cytoscape tool. Besides, the results and clinical significance were validated in The Cancer Genome Atlas (TCGA) dataset.
Results: A total of 18 significant DEMs, 121 upregulated DEGs and 199 downregulated DEGs were identified. Functional enrichment analysis showed that significant DEGs were related to cell cycle and MAPK pathway in BC. Key DEGs such as CDK1, CCNB1, VGL and PRKCA were found as the hub genes in PPI networks. TCGA analysis supported our results, and the miRNAs were correlated with the pathological stages and survival of BC patients.
Conclusion: In this study, we found 18 DEMs that may play key roles in the regulatory networks of BC. The higher expression of miR-99a, miR-100, miR-125b, miR-145, miR-214 and miR-487b or the lower expression of miR-138 and miR-200a can indicate poor survival in the prognosis of BC. Further experimental studies are required to test our results.
Keywords: microRNA, bladder cancer, bioinformatics, regulatory network
Introduction
Bladder cancer (BC) is the leading cause of death among urological cancers, with an estimated 81,190 new cancer cases and 17,240 deaths in the US in 2018.1
Approximately 70% of BC is non-muscle-invasive bladder cancer (NMIBC) at first diagnosis; however, roughly 20% of NMIBC will progress to muscle-invasive BC (MIBC).2 Owing to the aggressive metastasis and delayed diagnosis, the prognosis of MIBC is still poor.3 Although some conventional methods such as surgery and cytotoxic chemotherapy can be applied, the recurrence rate can be up to 70% within 2 years, which makes the treatment of BC unsatisfactory.4 The thorough understanding of molecular mechanism and biological markers can help in the early detection, risk stratification, appropriate therapeutic intervention and prognosis in patients with BC.
MicroRNA (miRNA) is a group of single-stranded short RNA molecules (generally 21 nucleotides) that take part in the posttranscriptional gene regulation.5 Emerging evidence reveals that miRNAs are involved in the various stages such as tumor initiation, proliferation, migration and invasion.6,7 MiRNAs can also functionally act as oncogene or tumor suppressors.8 The detection technique of miRNA in serum, urine and biopsy specimen is available; therefore, miRNA is an attractive source of noninvasive biomarkers.9 The quantitative reverse transcription polymerase chain reaction (qRT-PCR), small RNA sequencing and microarray are widely applied in BC researches in the past decade. In addition, the utility of miRNA as diagnosis or prognosis markers has generated a great interest. However, the results of different studies are inconclusive due to the heterogeneous ethnicity, sample size, different sample types and less clinical parameters.
To the best of our knowledge, few studies have reported the miRNAs and miRNA–mRNA regulatory networks by integrating multiple microarray datasets. Therefore, a comprehensive analysis was administrated in this study to further elucidate the key miRNAs, regulatory pathways and clinical significance in BC.
Materials and methods
Microarray data
Three miRNA expression profiles (GSE36121, GSE39093 and GSE68594) and three gene expression profiles (GSE27448, GSE40355 and GSE52519) were obtained by the search of the Gene Expression Omnibus (GEO, http://www.ncbi.nlm.nih.gov/geo). The profiles based on BC cell lines or xenograft models were excluded; thus, only BC patients and healthy controls were included in this study. Table S1 lists the detailed characteristics of the profiles. Every included dataset from the abovementioned profiles contains at least 10 BC samples and normal bladder tissues (Table 1).
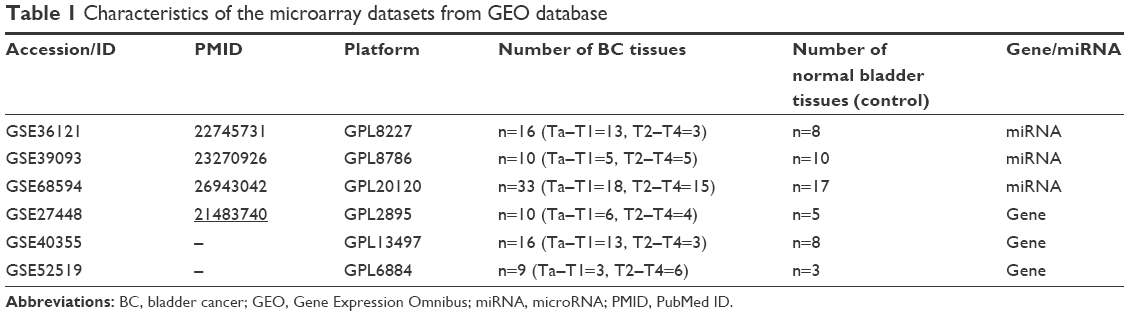 | Table 1 Characteristics of the microarray datasets from GEO database |
Data processing
We performed the comparison between the two groups of samples (BC versus normal prostate tissues) in each GEO dataset to identify differentially expressed genes (DEGs) and differentially expressed miRNAs (DEMs). The comparison was launched by a Limma R package based on online program, GEO2R (http://www.ncbi.nlm.nih.gov/geo/geo2r/). The adjusted P-value from the Benjamini–Hochberg method can correct the false-positive results, and the “adjusted P-value<0.05” and “|log FC|>1” parameters were chosen as primary cutoff criteria to test the results. Among the DEMs from the four datasets, only those involved in two or more datasets could be considered the statistically significant DEMs.
Identification of miRNA targets
The MiRWalk 2.0 database provides a large collection of predicted and experimentally verified information about the binding targets of miRNAs.10 We downloaded the data of the significant DEMs and their target mRNAs from the MiRwalk 2.0 retrieval system, which was based on experimental literature reports. Despite the fact that validated target genes were from various disease models, the expression of those genes in BC might not be in consistent with other diseases. Hence, it is important to select the genes from the intersection between the significant DEM–mRNA intersection data and the DEGs from the three GEO datasets. These genes were finally defined as the significant DEGs.
Functional enrichment analysis
The Database for Annotation, Visualization and Integrated Discovery (DAVID) is an online platform that offers the functional annotation and analysis of enormous quantity of genes derived from various genomic resources.11 We used the DAVID database to conduct gene ontology (GO) and Kyoto Encyclopedia of Genes and Genomes (KEGG) pathway analysis on significant DEGs. The species was limited to homo sapiens, and the “adjusted P-value (from the Benjamini–Hochberg method) <0.05” was considered statistically significant.
Interaction and regulatory network establishment
The protein–protein interaction (PPI) was visualized, and its network was constructed by the use of Search Tool for the Retrieval of Interacting Genes/Proteins (STRING), whose database can collect and predict the interaction information from genomic context predictions, high-throughput laboratory experiments, co-expression, automated text mining and previous knowledge in databases.12 The data annotated from high-throughput laboratory experiments and previous knowledge in databases were imposed to access the more objective and reliable results, and the minimum interaction value was set at medium confidence (0.400).
The Targetscan (http://www.targetscan.org/) is a famous miRNA prediction database by searching for the presence of conserved 8mer, 7mer and 6mer sites that match the seed region of each miRNA. The miRanda algorithm from the “microRNA.org-Targets and Expression” is freely available and can be applied to the whole genome sequences using identified miRNA sequences.13 The two programs mentioned earlier were used to predict target mRNAs of the significant DEMs. We note that two miRNAs shared a common target mRNA; they might exist in a similar regulatory pathway. The miRNA–mRNA regulatory network was visualized by using Cytoscape 3.6.0.14
Validation and survival analysis
The Cancer Genome Atlas (TCGA) database provides abundant clinical information from huge sample size. Therefore, the dataset “TCGA-BLCA (https://portal.gdc.cancer.gov/)” was used to find if the significant DEMs were in correlation with survival outcome. The dataset contains 412 patients who were diagnosed as having BC in the period of 1999–2013. Among them, 304 patients are male, while 108 are female. As for the race, 327 BC patients are white, 44 are Asian and 23 are black or African-American, and 23 were not reported. Among the 404 clinical outcome events available, 227 patients were living and 177 were dead when the follow-up ended. We examined the significant DEMs’ expression, relationship with BC stages and survival. The “independent two-sample Student’s t-test” was applied to check the expression level, while the chi-square test was used on different stages. The Kaplan–Meier plots were constructed using Oncolnc.15 The “P-value<0.05” was considered statistically significant.
Results
DEG/DEM identification
After compared with normal bladder tissues, the results of GEO2R analysis showed that there were totally 159 DEMs (Figure 1A), 4,013 upregulated DEGs (Figure 1B) and 4236 downregulated DEGs (Figure 1C). Among them, 18 DEMs appeared in the results of two datasets at least, so they could be identified as significant DEMs. Interestingly, miR-145 was the only DEM in all three datasets simultaneously. The following DEMs were found in every two different datasets: miR-429, miR-487b, miR-494, miR-222, miR-335, miR-202, miR-212, miR-200a, miR-125b, miR-210, miR-214, miR-182, miR-99a, miR-100 and miR-138. Subsequently, we further compared clinical stages T2–T4 versus Ta–T1 and high histological grade versus low grade to identify DEMs which might be related to aggressive BC. Interestingly, only miR-601 and hsa-let-7c appeared in two dataset intersections (Figure S1).
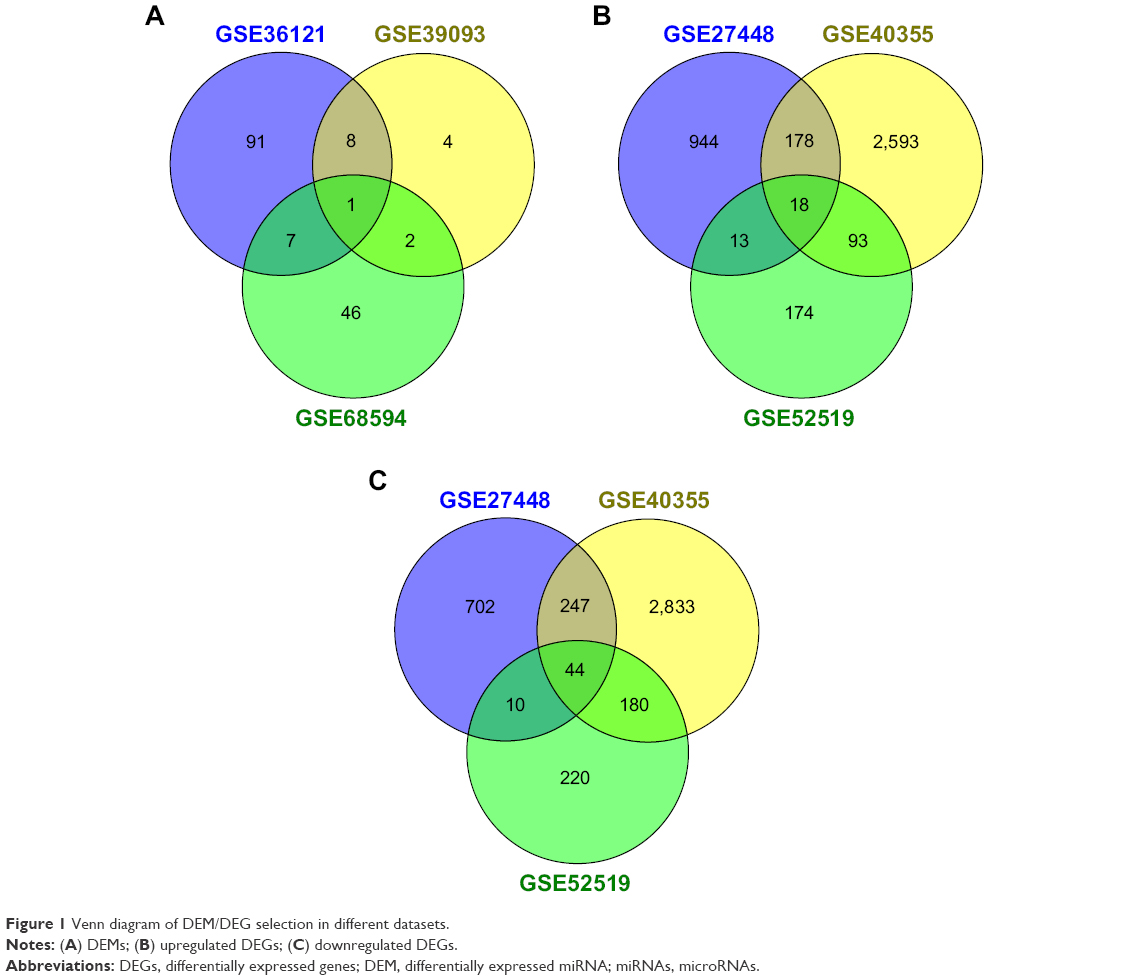 | Figure 1 Venn diagram of DEM/DEG selection in different datasets. |
Using the MiRWalk 2.0-validated-target miRNA-gene retrieval system, we got 9,053 candidate genes of the 18 significant DEMs. The intersection number of these candidate genes and the upregulated DEGs which appeared in two or more datasets was 121, while the intersection number of these candidate genes and the downregulated DEGs which appeared in two or more datasets was 199. Therefore, the 121 upregulated and the 199 downregulated genes were identified as the final sets of significant DEGs.
GO and pathway enrichment
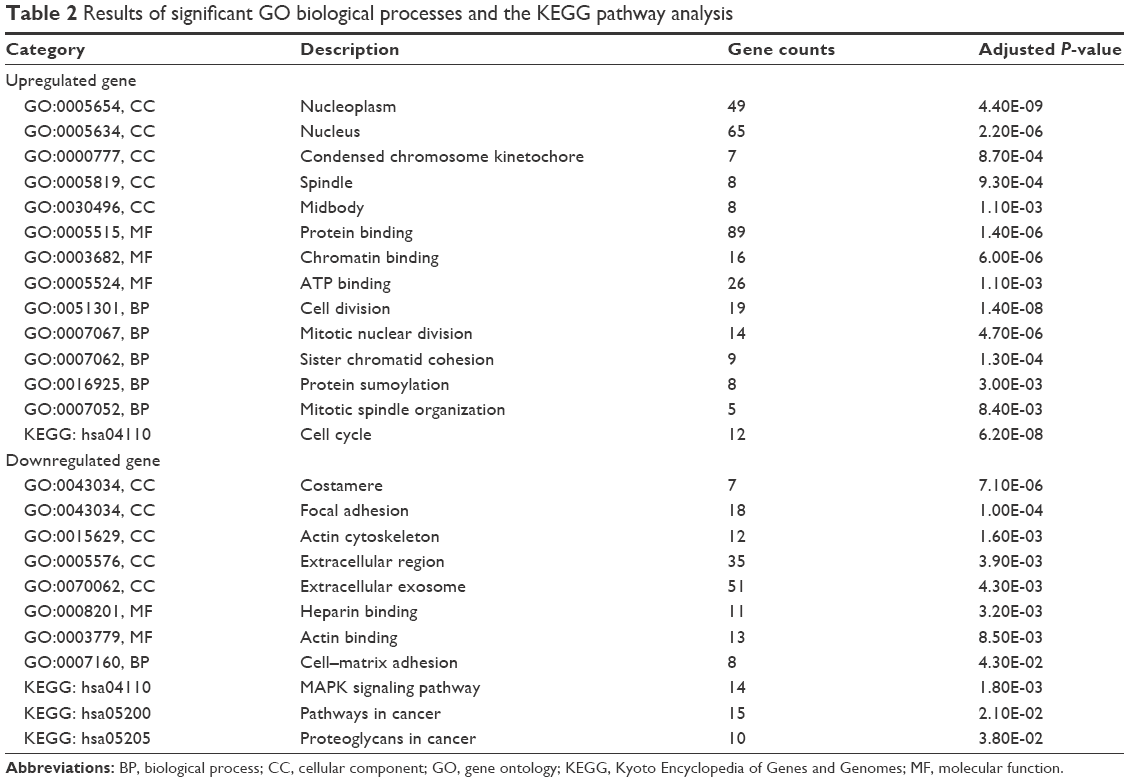
The GO ontology contains three terms: cellular component, molecular function and biological process. The three terms mentioned earlier were used to identify the key biological functions. The results demonstrated that the most significant GO terms for upregulated significant DEGs were “nucleoplasm,” “protein binding” and “cell division.” Whereas for the downregulated significant DEGs, the terms “costamere,” “heparin binding” and “cell–matrix adhesion” turned to be important (Table 2).
 | Table 2 Results of significant GO biological processes and the KEGG pathway analysis |
Furthermore, the KEGG pathway analysis indicated that “cell cycle,” “MAPK signaling pathway,” “pathways in cancer” and “proteoglycans in cancer” pathways played an essential role in BC pathogenesis (Table 2).
PPI network
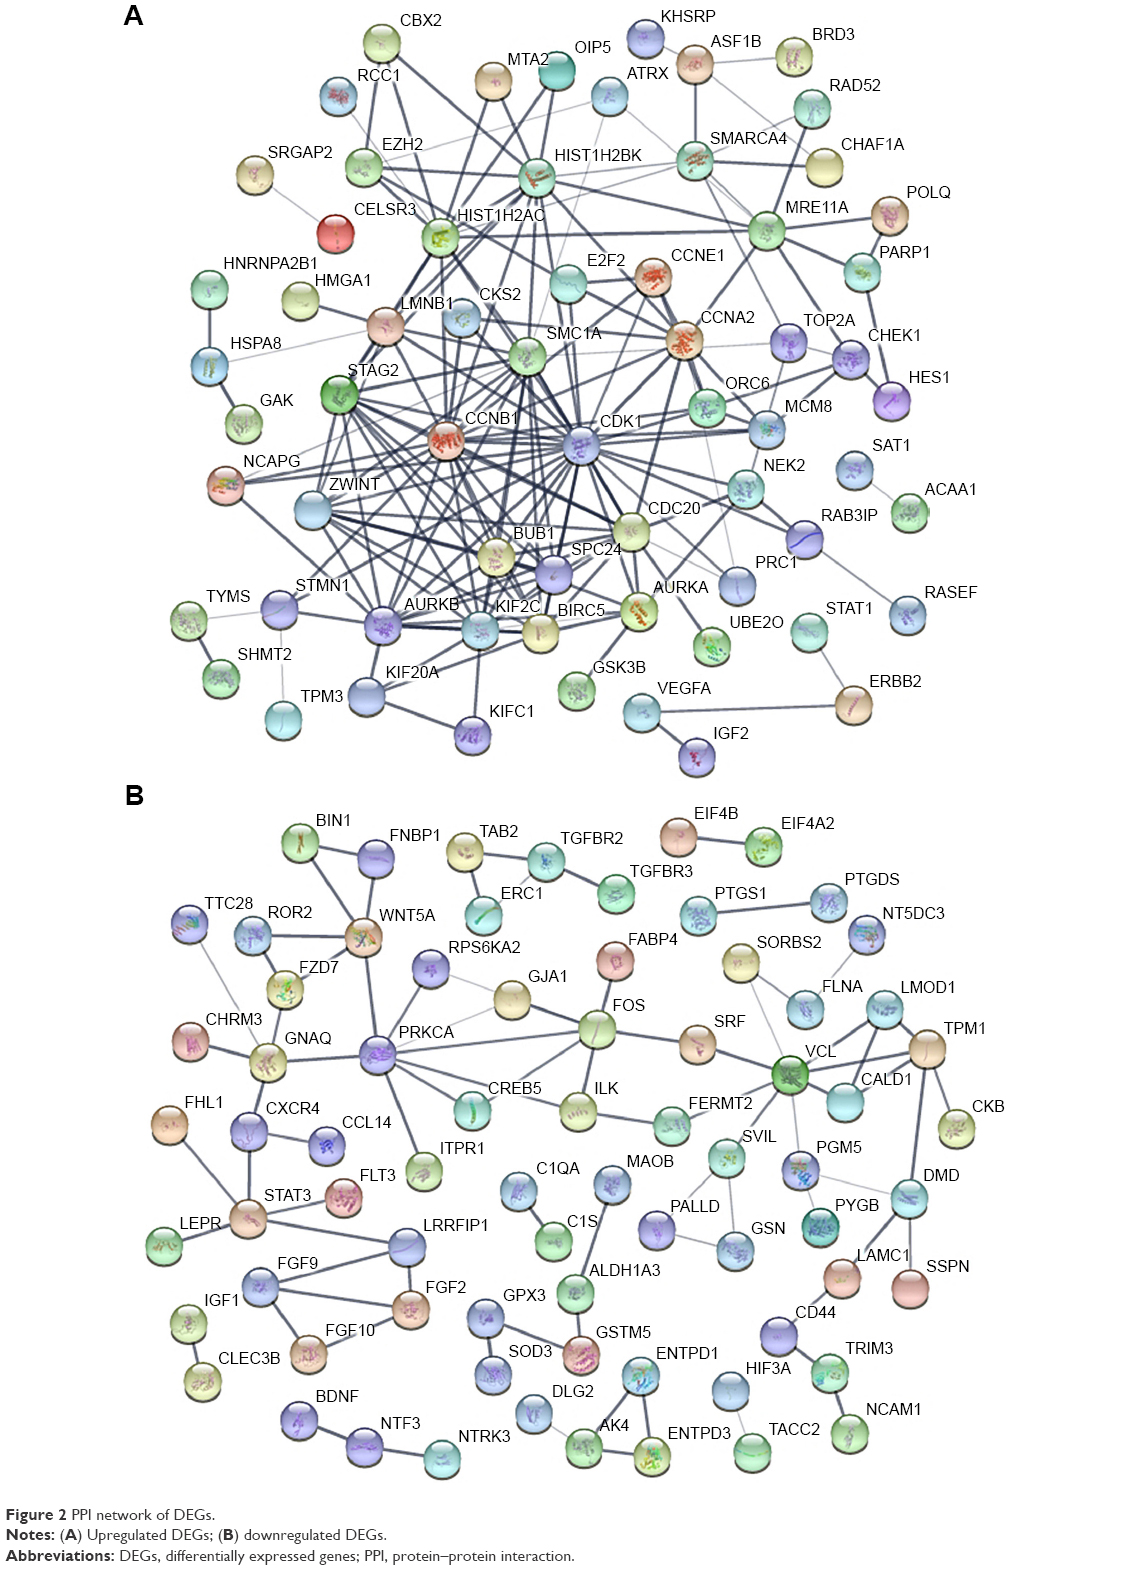
The PPI networks were established separately by the significant upregulated DEGs (Figure 2A) and significant downregulated DEGs (Figure 2B). As for the former, 64 nodes and 172 edges in total constituted the PPI network. As for the latter, the network was composed of 73 nodes and 80 edges.
 | Figure 2 PPI network of DEGs. |
In a single PPI network, the more edges a gene has, the more important role it plays (like a seed). We utilized the parameter “degree” to calculate edge counts of every single gene in a PPI network. The top 5% degree genes are listed in Table 3, which were assessed as the hub genes.
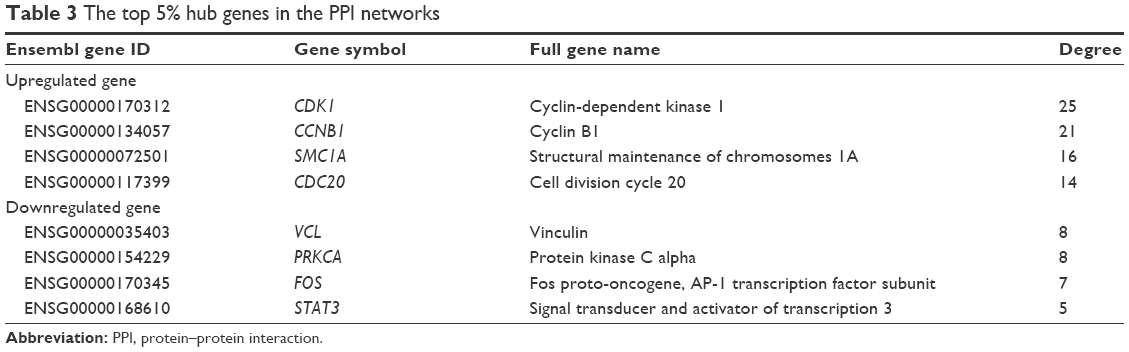 | Table 3 The top 5% hub genes in the PPI networks |
MiRNA–mRNA regulatory network
As illustrated in Figure 3, the target genes were predicted using miRanda and miRTarbase, among which two or more miRNAs might target the same mRNA. For instance, both miR-92a and miR-145 had the interactions with cyclin-dependent kinase 4 (CDK4). There were 12 mRNA nodes that might interact with at least two miRNAs.
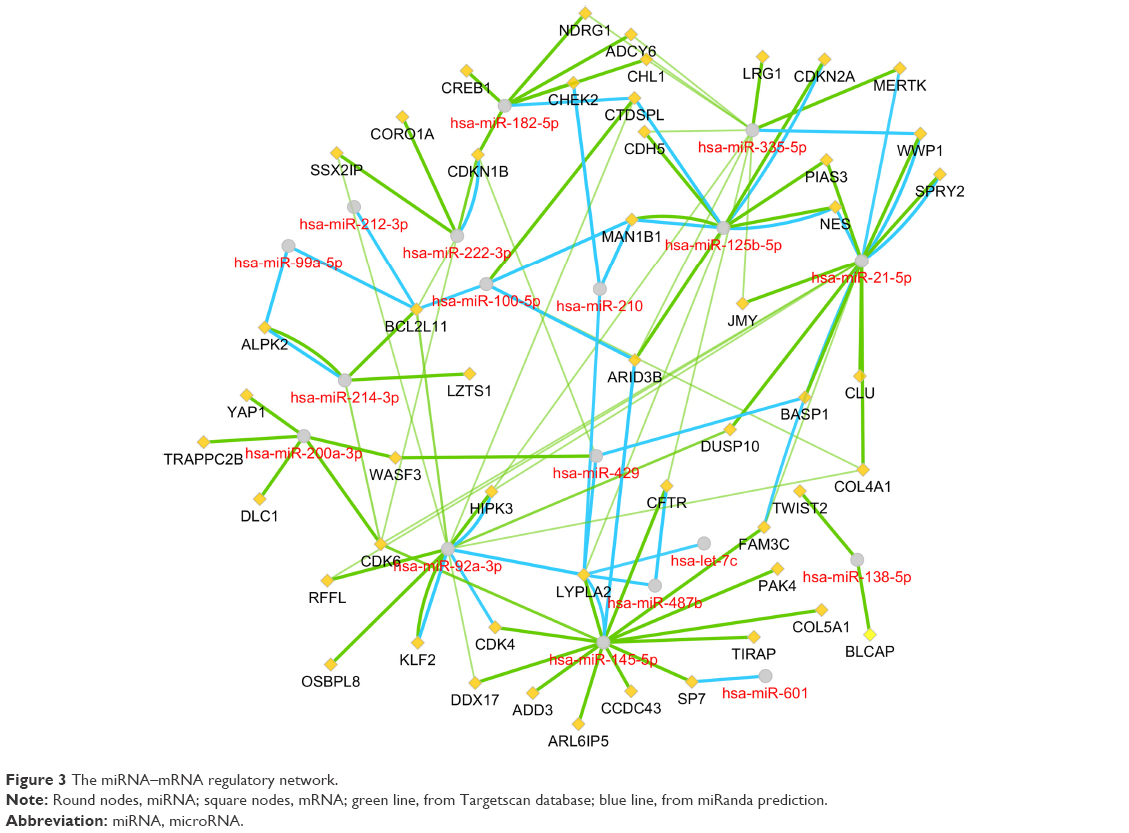 | Figure 3 The miRNA–mRNA regulatory network. |
Validation and Kaplan–Meier curves
After comparing the expression level of miRNAs in the TCGA dataset, we found that 13 among the 18 significant DEMs were according to the results in GEO databases. In contrast, the expression of miR-92, miR-494, miR-429, miR-202 and miR-212 was not significantly different between BC samples and normal control bladder tissues. The relationship between miRNAs and the clinical TNM stages was also tested in the TCGA dataset by using chi-square analysis. The results of the significant DEMs are summarized in Table 4.
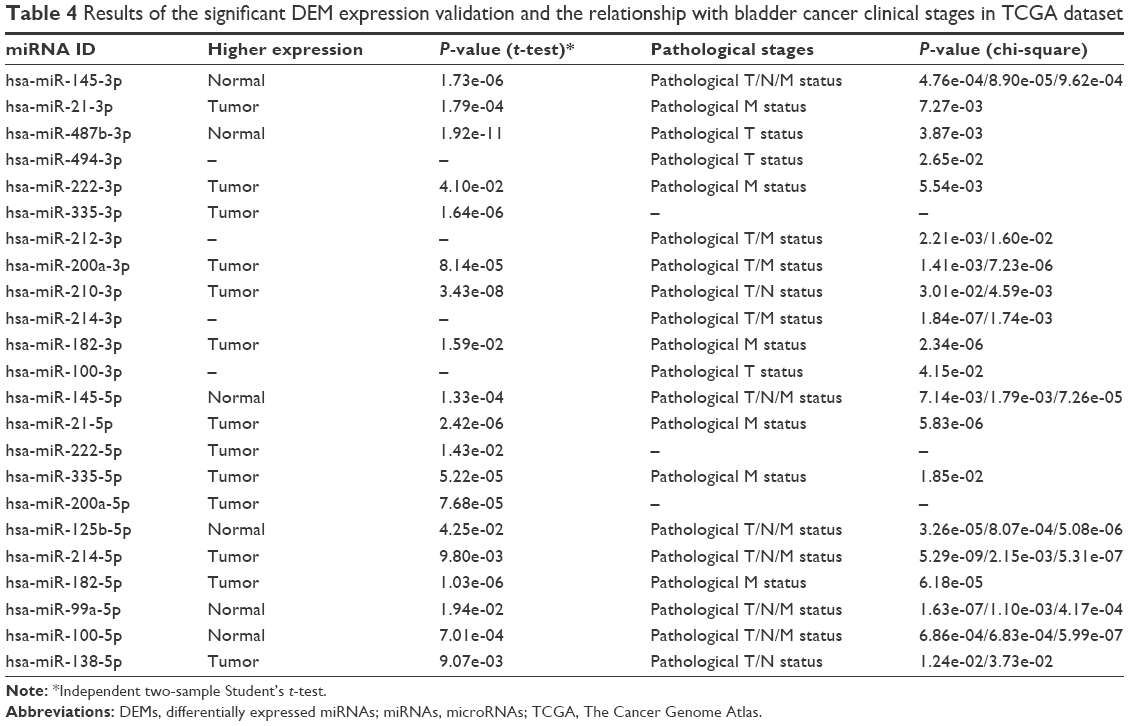 | Table 4 Results of the significant DEM expression validation and the relationship with bladder cancer clinical stages in TCGA dataset |
We subsequently drew Kaplan–Meier plots (Figure 4) based on the TCGA survival data. The plots indicated that eight significant DEMs, such as miR-99a, miR-100, miR-125b, miR-138, miR-145, miR-200, miR-214 and miR-487b, were found to be related to overall survival (OS) in BC patients. The higher expression of the abovementioned miRNAs meant the poor OS in patients with BC except miR-138 and miR-200a.
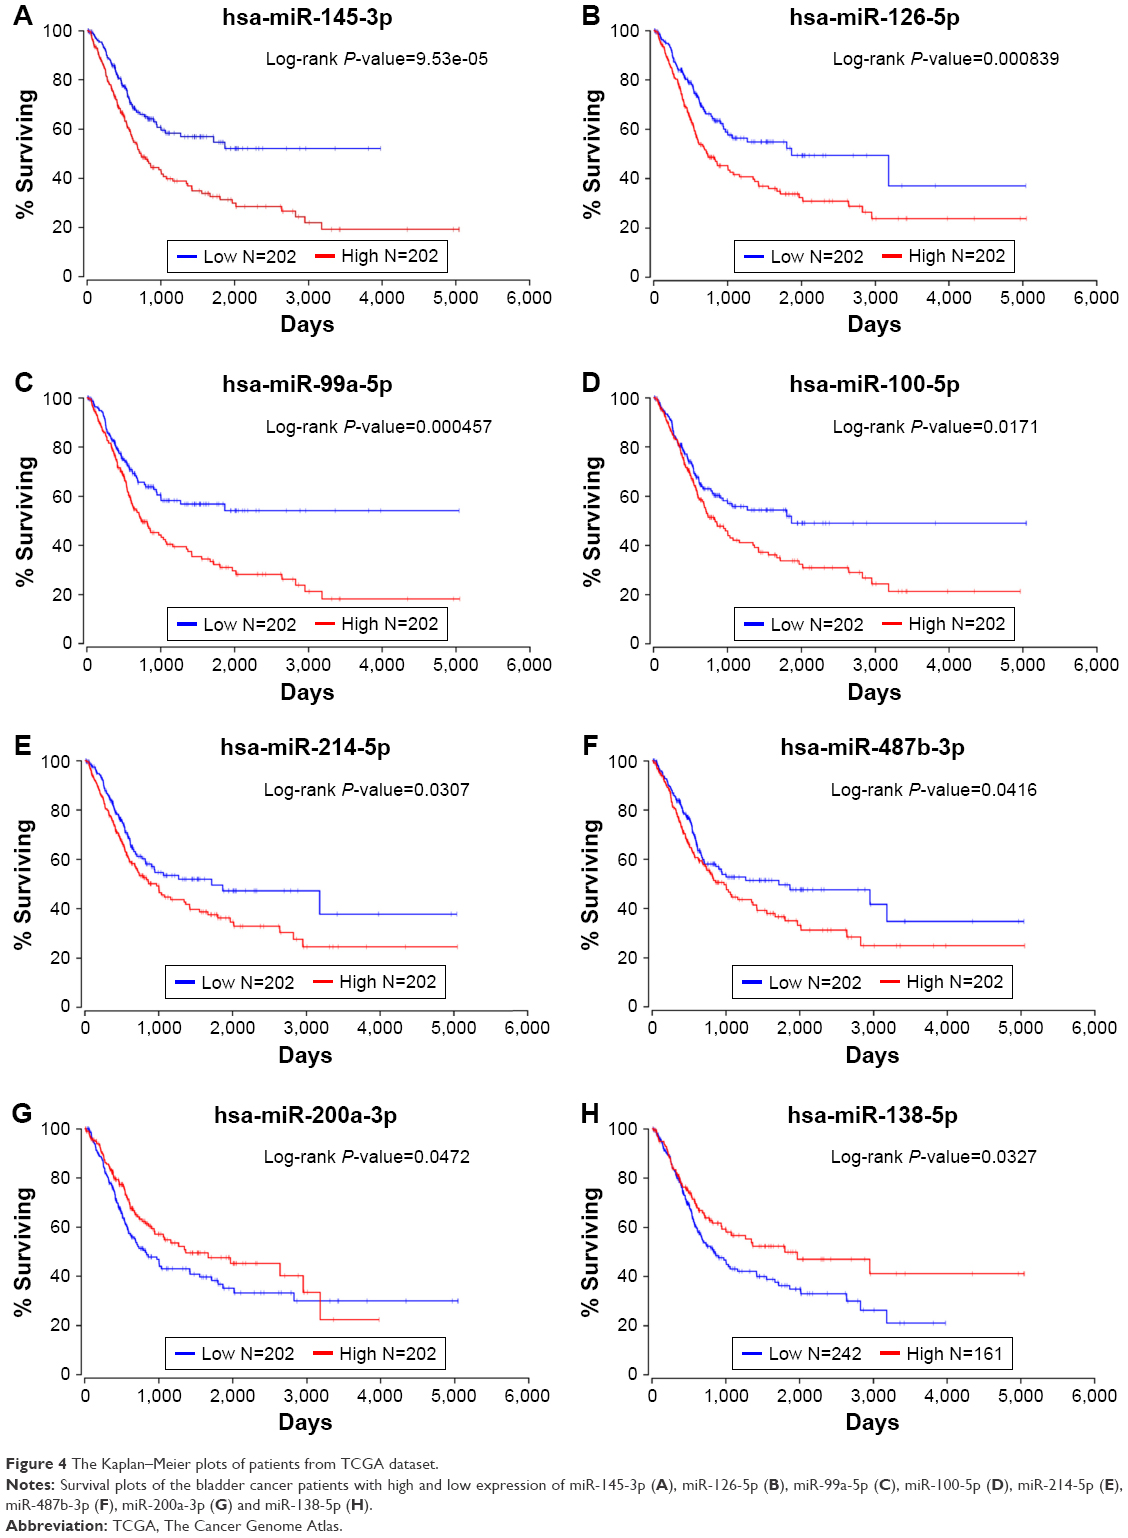 | Figure 4 The Kaplan–Meier plots of patients from TCGA dataset. |
Discussion
In the current study, 18 significant DEMs, 121 upregulated DEGs and 199 downregulated DEGs were identified after integrating and screening multiple datasets. The results of functional enrichment analysis indicated that the significant DEGs in BC were related to classical cancer pathways such as cell cycle and MAPK signaling pathways. The key DEGs such as CDK1, CCNB1, VCL and PRKCA were defined as the hub genes in the PPI networks. Significantly, most of the DEMs were correlated with tumor stages and OS in the TCGA datasets, which meant that the miRNAs have high clinical application value in the prognosis of BC.
BC shares many acknowledged pathways with other human cancers such as p53 and MAPK pathways. With the growing in-depth studies of BC, people have found a great deal of key molecules at gene, transcription regulation and protein interaction level. In these complicated processes, miRNAs nearly take part in all key cellular pathways because one miRNA can interact with many mRNAs and one mRNA can also interact with a lot of miRNAs. Intriguingly, miR-145 was the only one significant DEM that was identified in all three different datasets. We assumed that the source of heterogeneity might be ethnic and sample size. The expression level of miR-145 was higher in BC tissue and cell line than normal control.16,17 Minami et al18 reported that miR-145 could negatively regulate Warburg effect by silencing KLF4 and PTBP1. Long noncoding RNA (lncRNA) can also interact with miRNA in cancer pathways. LncRNA UCA-1 can promote BC cell migration and invasion by hsa-miR-145-ZEB1/2-FSCN1 pathway.19 miR-21 regulates cell proliferation and migration by targeting PTEN and p53 in BC.20 miR-202,21 miR-212,22 miR-222,23 miR-429,24 miR-200,25 miR-210,26 miR-214,27 miR-182,28 miR-99a,29 miR-10030 and miR-13831 were reported in BC studies, which were mostly dependent on cell lines. The studies on miRNA relationship with BC survival were insufficient. Urine is an ideal source of biomarkers due to the easily acquired and noninvasive property.32 Recently, it was reported that inflammation could drive tumor growth and progression.33,34 Mearini et al34 reported that although the expression of miR-145 in urine was higher in BC than in inflammation, and even higher in the high histological grade or high clinical stages, the results were not statistically significant. The expression of miR-145 was significantly higher in BC tissues in our results. It is assumed that the difference may be owing to low secretion amount or degradation. Therefore, we need the microarray studies concerning miRNAs in serum or urine as biomarkers in BC based on large sample sizes in the future.
Our studies may also provide hints for new target genes and pathways in the basic experiments of BC. Except for the previously reported miRNAs, there are also some miRNAs not reported in BC such as miR-335, miR-125b, miR-494 and miR-487b. We found that the higher miR-125b and miR487b expression suggested the poor survival based on 404 patients in TCGA. The mechanisms and in-depth pathways of these miRNAs should be investigated by experiments in the future.
By constructing the PPI network, we can recognize the key genes which miRNAs may interact with. Since the genes were filtered by the 18 significant DEMs’ potential targets, there were still 121 upregulated and 199 downregulated genes. Therefore, when it comes to all the 159 DEMs, the enormous and complicated miRNA–mRNA regulatory network can be imaginable. The hub genes of a network are always important like “seeds,” which connect the different signal pathways. In the current study, we identified several hub genes. Among the downregulated DEGs, the vinculin and protein kinase C alpha were identified. The vinculin was reported as a potential prognostic biomarker and the target for prostate cancer cell migration.35 Whereas in the upregulated DEGs, the hub gene CDK1 and cyclin B1 are associated with cell cycle and proliferation.36 Within the miRNA–mRNA network, we constructed that the key mRNAs such as CDK6 and CDK4 were cell-cycle-related modulators, while BCL2L11 was related to autophagy and apoptosis.37 In conclusion, the miRNA regulatory network may provide potential targets for new drug development and treatment.
Although this study first investigated miRNAs’ regulatory role in BC by integrating multiple microarray profiles, some limitations should be clarified. First, the gender, races of BC patients, tumor stages or grades were different in the included datasets, which may cause heterogeneity. Second, the source of microarray is only tissue. Body fluids such as serum, urine, may contain circulating miRNAs, which are noninvasive to be applied in the clinical practice. Third, although our results were validated in TCGA dataset, the integrating analysis results were not validated by the experiments such as qRT-PCR and functional experiments in vitro. Further studies are required to validate our results by the experiments on larger sample sizes and clinical follow-up in different ethnics.
Conclusion
In this study, we found a total of 18 DEMs which may play key roles in the pathways such as cell cycle and MAPK pathway in the regulatory networks of BC. The higher expression of miR-99a, miR-100, miR-125b, miR-145, miR-214 and miR-487b or the lower expression of miR-138 and miR-200a can indicate poor survival in the prognosis of BC. Further experimental studies are required to test our results.
Disclosure
The authors report no conflicts of interest in this work.
References
Siegel RL, Miller KD, Jemal A. Cancer statistics. CA Cancer J Clin. 2018;68(1):7–30. | ||
Park JC, Hahn NM. Bladder cancer: a disease ripe for major advances. Clin Adv Hematol Oncol. 2014;12(12):838–845. | ||
James ND, Hussain SA, Hall E, et al; BC2001 Investigators. Radiotherapy with or without chemotherapy in muscle-invasive bladder cancer. N Engl J Med. 2012;366(16):1477–1488. | ||
Goodison S, Rosser CJ, Urquidi V. Bladder cancer detection and monitoring: assessment of urine- and blood-based marker tests. Mol Diagn Ther. 2013;17(2):71–84. | ||
Bartel DP. MicroRNAs: genomics, biogenesis, mechanism, and function. Cell. 2004;116(2):281–297. | ||
Huang T, Alvarez A, Hu B, Cheng SY. Noncoding RNAs in cancer and cancer stem cells. Chin J Cancer. 2013;32(11):582–593. | ||
Shi Z, Wei Q, Zhang M, She J. MicroRNAs in bladder cancer: expression profiles, biological functions, regulation, and clinical implications. Crit Rev Eukaryot Gene Expr. 2014;24(1):55–75. | ||
Fabris L, Ceder Y, Chinnaiyan AM, et al. The potential of microRNAs as prostate cancer biomarkers. Eur Urol. 2016;70(2):312–322. | ||
Fendler A, Stephan C, Yousef GM, Kristiansen G, Jung K. The translational potential of microRNAs as biofluid markers of urological tumours. Nat Rev Urol. 2016;13(12):734–752. | ||
Dweep H, Gretz N. miRWalk2.0: a comprehensive atlas of microRNA-target interactions. Nat Methods. 2015;12(8):697. | ||
Huang da W, Sherman BT, Lempicki RA. Systematic and integrative analysis of large gene lists using DAVID bioinformatics resources. Nat Protoc. 2009;4(1):44–57. | ||
Szklarczyk D, Morris JH, Cook H, et al. The STRING database in 2017: quality-controlled protein-protein association networks, made broadly accessible. Nucleic Acids Res. 2017;45(Database issue):D362–D368. | ||
Betel D, Koppal A, Agius P, Sander C, Leslie C. Comprehensive modeling of microRNA targets predicts functional non-conserved and non-canonical sites. Genome Biol. 2010;11(8):R90. | ||
Shannon P, Markiel A, Ozier O, et al. Cytoscape: a software environment for integrated models of biomolecular interaction networks. Genome Res. 2003;13(11):2498–2504. | ||
Anaya J. OncoLnc: linking TCGA survival data to mRNAs, miRNAs, and lncRNAs. PeerJ Comput Sci. 2016;(2):e67. | ||
Fujii T, Shimada K, Tatsumi Y, et al. microRNA-145 promotes differentiation in human urothelial carcinoma through down-regulation of syndecan-1. BMC Cancer. 2015;15:818. | ||
Avgeris M, Mavridis K, Tokas T, Stravodimos K, Fragoulis EG, Scorilas A. Uncovering the clinical utility of miR-143, miR-145 and miR-224 for predicting the survival of bladder cancer patients following treatment. Carcinogenesis. 2015;36(5):528–537. | ||
Minami K, Taniguchi K, Sugito N, et al. MiR-145 negatively regulates Warburg effect by silencing KLF4 and PTBP1 in bladder cancer cells. Oncotarget. 2017;8(20):33064–33077. | ||
Xue M, Pang H, Li X, Li H, Pan J, Chen W. Long non-coding RNA urothelial cancer-associated 1 promotes bladder cancer cell migration and invasion by way of the hsa-miR-145-ZEB1/2-FSCN1 pathway. Cancer Sci. 2016;107(1):18–27. | ||
Lei M, Xie W, Sun E, et al. microRNA-21 regulates cell proliferation and migration and cross talk with PTEN and p53 in bladder cancer. DNA Cell Biol. 2015;34(10):626–632. | ||
Zhang L, Xu J, Yang G, Li H, Guo X. miR-202 inhibits cell proliferation, migration, and invasion by targeting EGFR in human bladder cancer. Oncol Res. Epub 2018 Jan 3. | ||
Zhang Q, Wang W, Xu W, et al. Genetic variations in the 3′-untranslated regions of genes involved in the cell cycle and apoptosis pathways affect bladder cancer risk. Cancer Genomics Proteomics. 2018;15(1):67–72. | ||
Zeng LP, Hu ZM, Li K, Xia K. miR-222 attenuates cisplatin-induced cell death by targeting the PPP2R2A/Akt/mTOR Axis in bladder cancer cells. J Cell Mol Med. 2016;20(3):559–567. | ||
Yang J, Liu Y, He A, et al. Hsa-miR-429 promotes bladder cancer cell proliferation via inhibiting CDKN2B. Oncotarget. 2017;8(40):68721–68729. | ||
Huang C, Zeng X, Jiang G, et al. XIAP BIR domain suppresses miR-200a expression and subsequently promotes EGFR protein translation and anchorage-independent growth of bladder cancer cell. J Hematol Oncol. 2017;10(1):6. | ||
Yang X, Shi L, Yi C, Yang Y, Chang L, Song D. MiR-210-3p inhibits the tumor growth and metastasis of bladder cancer via targeting fibroblast growth factor receptor-like 1. Am J Cancer Res. 2017;7(8):1738–1753. | ||
Wang J, Zhang X, Wang L, et al. MicroRNA-214 suppresses oncogenesis and exerts impact on prognosis by targeting PDRG1 in bladder cancer. PLoS One. 2015;10(2):e0118086. | ||
Papadopoulos EI, Scorilas A. Cisplatin and paclitaxel alter the expression pattern of miR-143/145 and miR-183/96/182 clusters in T24 bladder cancer cells. Clin Transl Sci. 2015;8(6):668–675. | ||
Tsai TF, Lin JF, Chou KY, Lin YC, Chen HE, Hwang TI. miR-99a-5p acts as tumor suppressor via targeting to mTOR and enhances RAD001-induced apoptosis in human urinary bladder urothelial carcinoma cells. Onco Targets Ther. 2018;11:239–252. | ||
Morais DR, Reis ST, Viana N, et al. The involvement of miR-100 in bladder urothelial carcinogenesis changing the expression levels of mRNA and proteins of genes related to cell proliferation, survival, apoptosis and chromosomal stability. Cancer Cell Int. 2014;14(1):119. | ||
Yang R, Liu M, Liang H, et al. miR-138-5p contributes to cell proliferation and invasion by targeting Survivin in bladder cancer cells. Mol Cancer. 2016;15(1):82. | ||
Li DY, Hao XY, Ma TM, Dai HX, Song YS. The prognostic value of platelet-to-lymphocyte ratio in urological cancers: a meta-analysis. Sci Rep. 2017;7:15387. | ||
Li D, Hao X, Li J, et al. Dose-response relation between dietary inflammatory index and human cancer risk: evidence from 44 epidemiologic studies involving 1,082,092 participants. Am J Clin Nutr. 2018;107(3):371–388. | ||
Mearini E, Poli G, Cochetti G, Boni A, Egidi MG, Brancorsini S. Expression of urinary miRNAs targeting NLRs inflammasomes in bladder cancer. Onco Targets Ther. 2017;10:2665–2673. | ||
Ai J, Jin T, Yang L, et al. Vinculin and filamin-C are two potential prognostic biomarkers and therapeutic targets for prostate cancer cell migration. Oncotarget. 2017;8(47):82430–82436. | ||
Harley ME, Allan LA, Sanderson HS, Clarke PR. Phosphorylation of Mcl-1 by CDK1-cyclin B1 initiates its Cdc20-dependent destruction during mitotic arrest. EMBO J. 2010;29(14):2407–2420. | ||
Dai Y, Grant S. BCL2L11/Bim as a dual-agent regulating autophagy and apoptosis in drug resistance. Autophagy. 2015;11(2):416–418. |
Supplementary materials
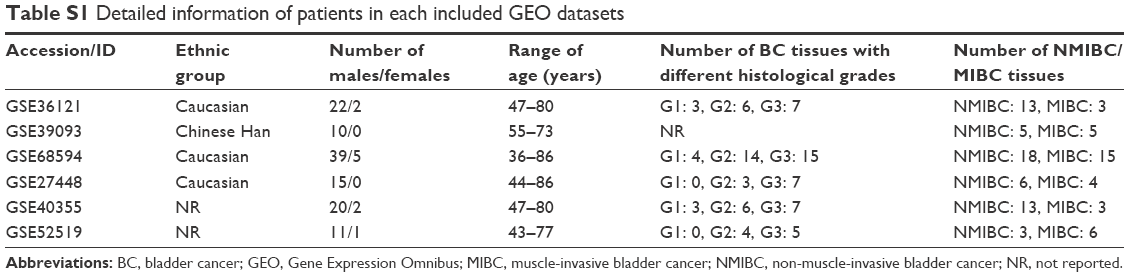 | Table S1 Detailed information of patients in each included GEO datasets |
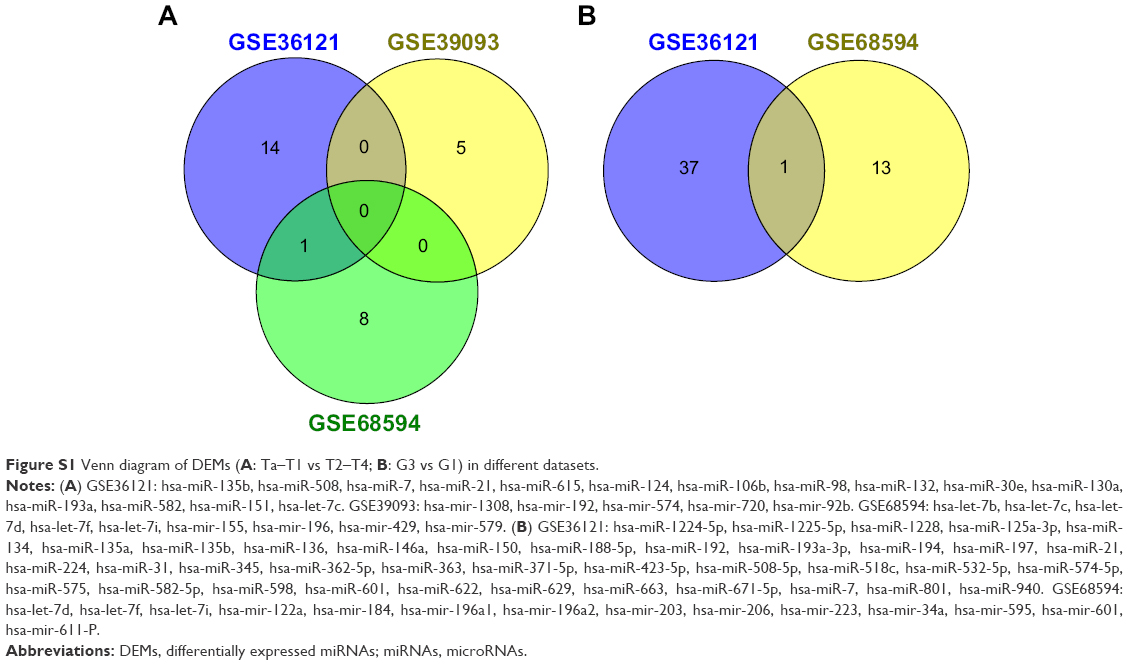 | Figure S1 Venn diagram of DEMs (A: Ta–T1 vs T2–T4; B: G3 vs G1) in different datasets. |
 © 2018 The Author(s). This work is published and licensed by Dove Medical Press Limited. The full terms of this license are available at https://www.dovepress.com/terms.php and incorporate the Creative Commons Attribution - Non Commercial (unported, v3.0) License.
By accessing the work you hereby accept the Terms. Non-commercial uses of the work are permitted without any further permission from Dove Medical Press Limited, provided the work is properly attributed. For permission for commercial use of this work, please see paragraphs 4.2 and 5 of our Terms.
© 2018 The Author(s). This work is published and licensed by Dove Medical Press Limited. The full terms of this license are available at https://www.dovepress.com/terms.php and incorporate the Creative Commons Attribution - Non Commercial (unported, v3.0) License.
By accessing the work you hereby accept the Terms. Non-commercial uses of the work are permitted without any further permission from Dove Medical Press Limited, provided the work is properly attributed. For permission for commercial use of this work, please see paragraphs 4.2 and 5 of our Terms.