")
Back to Journals » OncoTargets and Therapy » Volume 10
An integrated analysis for long noncoding RNAs and microRNAs with the mediated competing endogenous RNA network in papillary renal cell carcinoma
Authors Huang CG, Yuan NJ , Wu LY, Wang XF, Dai JQ, Song P, Li FX, Xu CB, Zhao XH
Received 17 May 2017
Accepted for publication 9 July 2017
Published 14 August 2017 Volume 2017:10 Pages 4037—4050
DOI https://doi.org/10.2147/OTT.S141951
Checked for plagiarism Yes
Review by Single anonymous peer review
Peer reviewer comments 2
Editor who approved publication: Dr XuYu Yang
Chuiguo Huang,1,* Naijun Yuan,2,* Liying Wu,3 Xiaofu Wang,1 Junqiang Dai,4 Pan Song,5 Fengxi Li,6 Changbao Xu,1 Xinghua Zhao1
1Department of Urology, The Second Affiliated Hospital of Zhengzhou University, Zhengzhou, 2College of Traditional Chinese Medicine of Jinan University, Institute of Integrated Traditional Chinese and Western Medicine of Jinan University, Guangzhou, 3Department of Nephrology, The Second Affiliated Hospital of Hainan Medical College, Hainan, 4Department of Neurosurgery, The Second Affiliated Hospital of Lanzhou University, Lanzhou, 5Department of Urology, The First Affiliated Hospital of Zhengzhou University, Zhengzhou, 6Department of General Surgery, The First Affiliated Hospital of Guangxi Medical University, Guangxi, People’s Republic of China
*These authors contributed equally to this work
Abstract: Papillary renal cell carcinoma (PRCC) is the second most common subtype of renal cell carcinoma, and it lacks effective therapeutic targets and prognostic molecular biomarkers. Attention has been increasingly focused on long noncoding RNAs (lncRNAs), which can act as competing endogenous RNA (ceRNA) to compete for shared microRNAs (miRNAs) in the tumorigenesis of human tumors. Therefore, to clarify the functional roles of lncRNAs with respect to the mediated ceRNA network in PRCC, we comprehensively integrated expression profiles, including data on mRNAs, lncRNAs and miRNAs obtained from 289 PRCC tissues and 32 normal tissues in The Cancer Genome Atlas. As a result, we identified 2,197 differentially expressed mRNAs (DEmRNAs) and 84 differentially expressed miRNAs (DEmiRNAs) using a threshold of |log2 (fold change)| >2.0 and an adjusted P-value <0.05. To determine the hub DEmRNAs that could be key target genes, a weighted gene co-expression network analysis was performed. A total of 28 hub DEmRNAs were identified as potential target genes. Seven dysregulated DEmiRNAs were identified that were significantly associated with the 28 hub potential target genes. In addition, we found that 16 differentially expressed lncRNAs were able to interact with the DEmiRNAs. Finally, we used Cytoscape software to visualize the ceRNA network with these differently expressed molecules. From these results, we believe that the identified ceRNA network plays a crucial role in the process of PRCC deterioration, and some of the identified genes are strongly related to clinical prognosis.
Keywords: papillary renal cell carcinoma, The Cancer Genome Atlas, weighted gene co-expression network analysis, long noncoding RNA, competing endogenous RNA network, survival prognosis
Introduction
Renal cell carcinoma (RCC) is a heterogeneous disease with varying histological abnormalities, cytogenetic aberrations, responses to therapy, and prognoses and accounts for 90% of renal malignancies in adults.1 The World Health Organization (WHO) stratified RCC into multiple distinct subtypes, including clear cell, papillary, and chromophobe neoplasms. Papillary renal cell carcinoma (PRCC), the second most common subtype, accounts for about 10%–15% of RCC.2 Within standard therapeutic protocols, malignant PRCC patients have a different pathological appearance and clinical outcome. Current treatment strategies of PRCC include surgery, radiation therapy, and chemotherapy, but a specialized, effective therapeutic remedy is still lacking.3 Moreover, relevant molecular targets for clinical therapy are deficient, and thus require further validation by more comprehensive clinical trials with a larger number of samples. Furthermore, molecular targets of drugs are subject to drug resistance and can cause toxicity leading to many restrictions in clinical application. Therefore, it is urgent and necessary that newly discovered treatments are found, based on the specific mechanisms of PRCC carcinogenesis, to improve treatment efficiency and avoid the adverse effects of conventional methods.
Advances in RNA sequencing technologies have brought to light the complexity of our genome. Noncoding RNAs (ncRNAs) account for the majority (98%) of the transcriptome, and different classes of regulative RNA with important biological functions are being continually discovered.4 Investigating the world of RNA is one of the most important challenges facing biologists today, and long noncoding RNAs (lncRNAs) represent potential new biomarkers and drug targets. Currently, a growing body of evidence has indicated that there are interactions between lncRNAs and microRNAs (miRNAs), the downstream target genes of which have been closely related to tumor pathogenesis. In 2011, Salmena et al presented a competing endogenous RNA (ceRNA) hypothesis, which described a complex posttranscriptional regulatory network, including lncRNAs, mRNAs, and other types of RNAs, which can act as natural miRNA sponges to suppress miRNA functions by sharing one or more miRNA response elements.5 Several experimental studies have also confirmed this hypothesis. For example, Cesana et al identified a muscle-specific lncRNA, known as long intergenic non-protein-coding RNA-muscle differentiation 1 (linc-MD1), which can mediate the time of muscle differentiation by acting as a ceRNA in human myoblasts.6 Furthermore, Poliseno et al showed that phosphatase and tensin homolog pseudogene 1 (PTENP1) can upregulate the gene expression of PTEN by acting as a molecular sponge, causing adsorption of miR-19 and miR-20a in prostate cancer, inhibiting tumor cell growth.7 However, to date, there is still little research on ceRNA-related lncRNAs involved in relevant regulatory mechanisms in PRCC.
Weighted gene co-expression network analysis (WGCNA) has been widely used in determining changes in transcriptome expression patterns in various diseases, finding clusters that include highly correlated genes, and summarizing these clusters by the module eigengenes.8,9 Correlation networks facilitate network-based gene screening methods that can be used to identify candidate biomarkers or therapeutic targets. These methods have been successfully applied in complex biological contexts and fields, including cancer, mouse genetics, yeast genetics, and analyzing brain imaging data.10 For example, carcinoembryonic antigen-related cell adhesion molecule 1 (CEACAM1), mitochondrial calcium uniporter, voltage-dependent anion channel 1 (VDAC1), and cytochrome C (CYC) have been identified as prognostic biomarkers in the development of pancreatic ductal adenocarcinoma eigengenes.11 Giulietti et al found that miR-302d-3p, miR-513c-5p, miR-3918, and miR-6076 could be candidate miRNA biomarkers for pancreatic ductal adenocarcinoma by targeting CYC.12 Tang et al showed that five novel lncRNAs (CYP4F26P, RP11-108M12.3, RP11-38M8.1, RP11-54H7.4, and ZNF503-AS1), based on the prognostic signature, could be therapeutic targets for lung squamous cell carcinoma patients.13 Consequently, focusing on the coherence function of network modules is a powerful systematic analysis method.14
The Cancer Genome Atlas (TCGA) project has provided a comprehensive way to improve our ability to diagnose, treat, and prevent tumor progression, through a better understanding of the genetic basis of cancer.15 By the end of 2015, TCGA contained 33 types of cancer and >11,000 patients with gene expression profiles and relevant clinical data. Such an enormous amount of data provides an ideal opportunity to identify the mechanism and prognostic molecular signatures of cancer in a comprehensive way. Therefore, our research was based on TCGA, which analyzed the integrated RNA expression profiles from 289 PRCC samples and 32 normal samples. We also used the WGCNA to analyze the hub differentially expressed mRNAs (DEmRNAs), which can be target genes. The databases, miRTarBase and miRcode, were used to screen the key differentially expressed lncRNAs (DElncRNAs) and differentially expressed microRNAs (DEmiRNAs), as well as DEmiRNAs–DEmRNAs interactions. Hereafter, we constructed a ceRNA network to elaborate the interactions and potential cross talk between the hub DElncRNAs, DEmiRNAs, and DEmRNAs. In addition, relevant survival analyses were performed to determine the prognostic genes that possess clinical traits.
Materials and methods
Study population
We manually searched TCGA database, and a total of 289 PRCC cases were enrolled for comprehensive integrated analysis. In addition, we used the Data Transfer Tool (provided by GDC Apps) to download the level 3 mRNASeq gene expression data, miRNASeq data of samples, and clinical information of these patients (https://tcga-data.nci.nih.gov/). The sequenced data were derived from Illumina HiSeq RNASeq and Illumina HiSeq miRNASeq platforms. Our research meets the publication guidelines provided by TCGA (http://cancergenome.nih.gov/publications/publicationguidelines).
Differentially expressed analysis
The PRCC mRNASeq and miRNASeq data were derived from 321 samples, including 289 renal carcinoma tissue samples (cohort Tumor) and 32 normal tissue samples that were extracted from adjacent tissues (cohort Normal), and they were downloaded from TCGA. In addition, we merged data from tumor samples and normal samples, and deleted expressed data close to zero. In order to compare the normal group with PRCC, we used the “DESeq” package in R software to identify the DEmRNAs and miRNAs with thresholds of |log2 (fold change [FC])| >2.0 and adjusted P-value <0.05.16
The GENECARDS database (http://www.genecards.org/) was used to define and annotate the DElncRNAs.17 In our study, we identified the DElncRNAs from differentially expressed RNAs, with the cutoff criteria of |log2FC| >2.0 and adjusted P-value <0.05.
Weighted correlation network analysis
WGCNA, a systematic biology method, describes the co-expression patterns between genes across microarray samples. WGCNA can be used for identifying modules of highly correlated genes, for summarizing these clusters using the module eigengene or an intramodular hub gene, for relating modules to one another and to external sample traits, and for calculating module membership measures. Co-expression networks facilitate network-based gene screening methods that can be used to identify candidate biomarkers or therapeutic targets.9 Therefore, to identify the interactions between the differentially expressed genes (DEGs), the WGCNA, which uses the topological overlapping measurement, was performed to identify co-expression modules, with a power cutoff threshold of 12 and a module size cutoff ≤50 in this study. In addition, for investigating the relation between modules and clinical trait information, we plotted the heatmaps of all clusters at two different conditions (survival time and survival status) and showed the relation cutoff and P-value of the modules.
Functional annotation and protein–protein interaction (PPI)
To identify Kyoto Encyclopedia of Genes and Genomes (KEGG) pathways of DEGs, the “clusterProfiler” package of bioconductor was performed for annotating the function of different module genes, with a threshold of a false discovery rate <0.05.18
In order to identify protein interactions between DEGs of different modules, we used the String (Search Tool for the Retrieval of Interacting Genes) online tools to construct a PPI network for DEGs (minimum required interaction score >0.4).19 In addition, the Cytoscape software was used to visualize the PPI networks.
Construct the ceRNA network
To clarify the roles of lncRNA and miRNA with the mediated ceRNA network, we constructed a co-expression network of DEGs, lncRNAs, and miRNAs and visualized this network using Cytoscape software. We selected the hub DEmRNA from WGCNA modules as the target genes and discovered miRNA–mRNA pairs by miRTarBase (http://mirtarbase.mbc.nctu.edu.tw/).20 The miRNA-targeted mRNAs were verified by various methods including the reporter assay, quantitative real-time PCR, Western blotting, microarrays, and next-generation sequencing experiments in miRTarBase. In addition, the lncRNA–miRNA interactions were determined based on the miRcode database, which is a comprehensive searchable online tool of putative miRNA target sites across the complete transcriptome annotation of Encyclopedia of DNA Elements (ENCODE), including >10,000 lncRNA genes in the current version (http://www.mircode.org/).21
Survival analysis
In order to identify the prognostic lncRNA and miRNA signature, by combining the clinical data of PRCC patients in TCGA, we established the life curves of these samples with hub miRNAs and some DElncRNAs. For the survival analysis for lncRNAs, we took advantage of a new and powerful web-based tool, Gene Expression Profiling Interactive Analysis (GEPIA), which can deliver fast and customizable functionalities based on TCGA and Genotype-Tissue Expression data.22 As our research was based on the complete samples of PRCC in TCGA, we analyzed lncRNA by selecting samples based on the database (TCGA) and the associated disease (PRCC) in GEPIA. However, the expression analysis functions of GEPIA have not yet covered miRNAs, so we constructed the life curves of hub miRNAs by the “survival” package in R software. This analysis is based on Kaplan–Meier univariate survival analysis.23 P-values of <0.05 were considered statistically significant.
Results
Identifying DEmRNAs, DEmiRNAs, and DElncRNAs
The expression profiles of PRCC patients and corresponding clinical information were downloaded from the Data Transfer Tool of TCGA database. After downloading TCGA data set, we found that the data were derived from 32 normal renal tissues and 289 PRCC tissues; the clinical data were derived from 291 PRCC patient samples. However, there were two cases without complete clinical information, and thus, we deleted these two samples. Finally, we used 289 PRCC patient samples for further analysis. By comparing the normal group with the PRCC group, we identified the significant DEmRNAs and DEmiRNAs using the “DESeq” package in R software. A total of 2,197 DEmRNAs and 84 DEmiRNAs were confirmed by the “DESeq” package in R software. As a result, there were 1,218 (55.44%) upregulated and 979 (44.56%) downregulated DEGs. Moreover, a total of 58 (69.05%) upregulated and 26 (30.95%) downregulated DEmiRNAs were identified. The highest ten mRNAs with |log2FC| >2.0 and miRNAs with |log2FC| >2.0 are shown in Table 1.
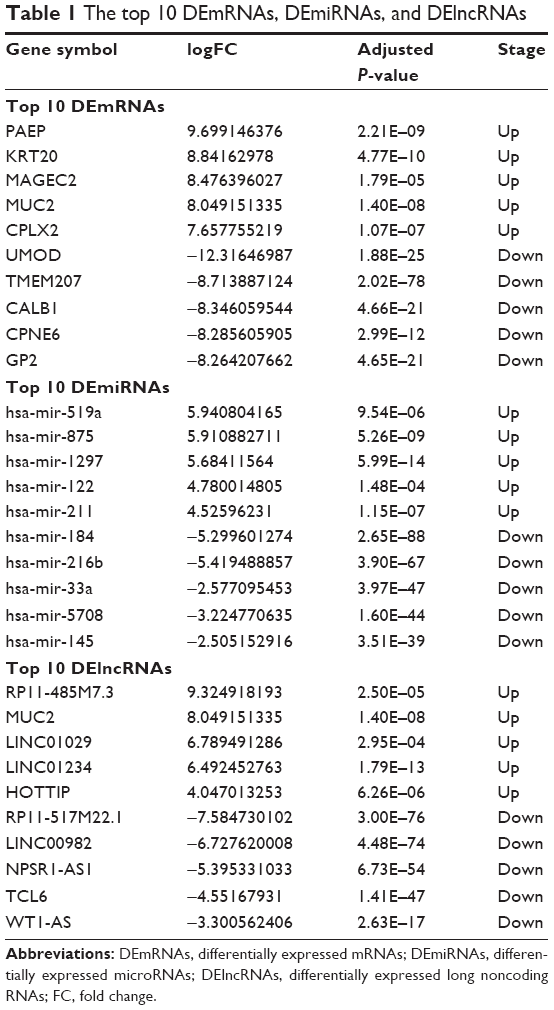 | Table 1 The top 10 DEmRNAs, DEmiRNAs, and DElncRNAs |
According to the GENECARDS annotation, we identified a total of 79 aberrantly expressed lncRNAs in PRCC tissues compared to normal tissues. The ten lncRNAs with the highest expression levels are listed in Table 1.
Construction of weighted gene co-expression modules
To find the functional clusters in PRCC patients, the gene co-expression network analysis of 2,197 DEGs was carried out by WGCNA. A total of four color modules (with the non-clustering DEmRNAs identified as gray) are shown in Figure 1. Moreover, we plotted the heatmap of module–trait relationships, which explored the relation between modules and two conditions (survival time and survival status). The heatmap is presented in Figure 2. We found that the gray module for survival time displayed the highest correlation coefficient of relational value (r)=0.45, P-value =0.01. The blue and turquoise modules were highly correlated to survival status (r=0.44, P=0.01), but the correlation with survival time was less pronounced. The yellow and brown modules show the correlation for survival status (yellow: r=0.39, P=0.02; brown: r=0.4, P=0.02).
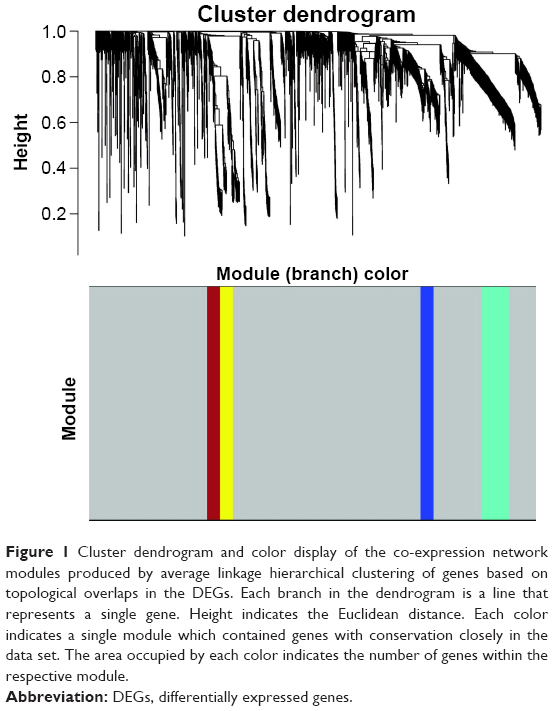 | Figure 1 Cluster dendrogram and color display of the co-expression network modules produced by average linkage hierarchical clustering of genes based on topological overlaps in the DEGs. Each branch in the dendrogram is a line that represents a single gene. Height indicates the Euclidean distance. Each color indicates a single module which contained genes with conservation closely in the data set. The area occupied by each color indicates the number of genes within the respective module. |
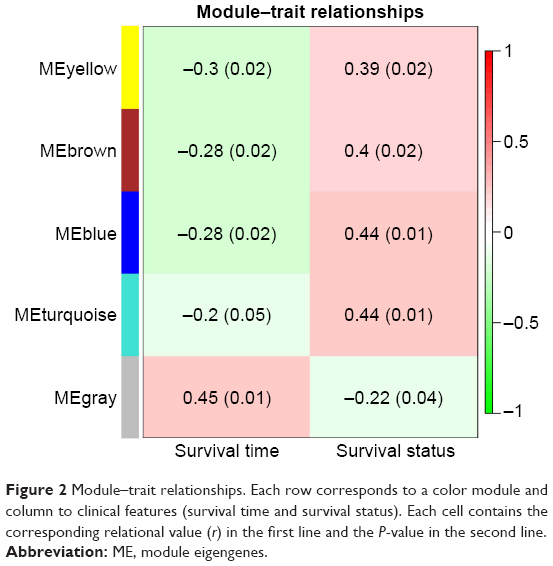 | Figure 2 Module–trait relationships. Each row corresponds to a color module and column to clinical features (survival time and survival status). Each cell contains the corresponding relational value (r) in the first line and the P-value in the second line. |
PPI and functional annotation for the modules
To better understand the function and PPI of DEGs in different modules, we used the “clusterProfiler” package to show the enriched KEGG pathways (Table 2), where the Cytoscape software was applied for visualizing the PPI network (Figure 3). The blue module had seven nodes and eight interactions. All genes were downregulated DEmRNAs in this module. We found that solute carrier family 9 member A3 (SLC9A3) was central to the network for the blue module. In addition, we identified three enriched pathways in the blue module, and SLC9A3 as the hub gene was related to “Proximal tubule bicarbonate reclamation”.
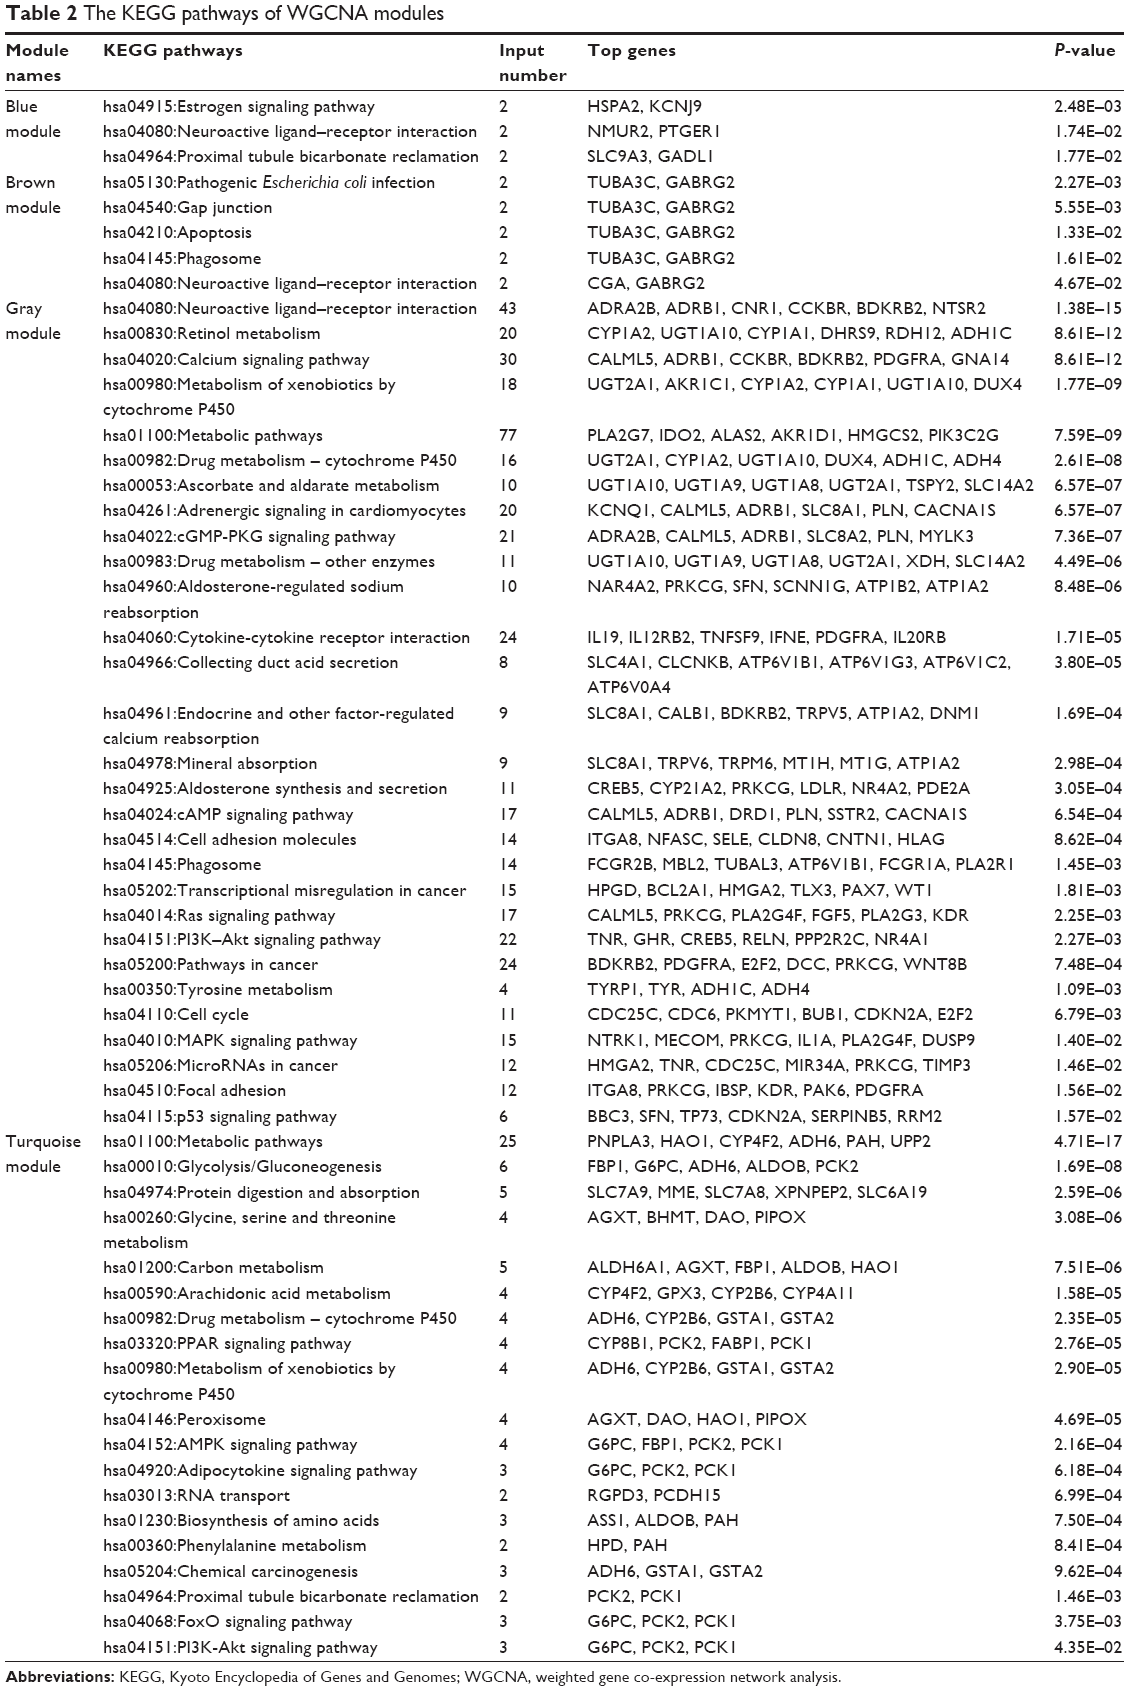 | Table 2 The KEGG pathways of WGCNA modules |
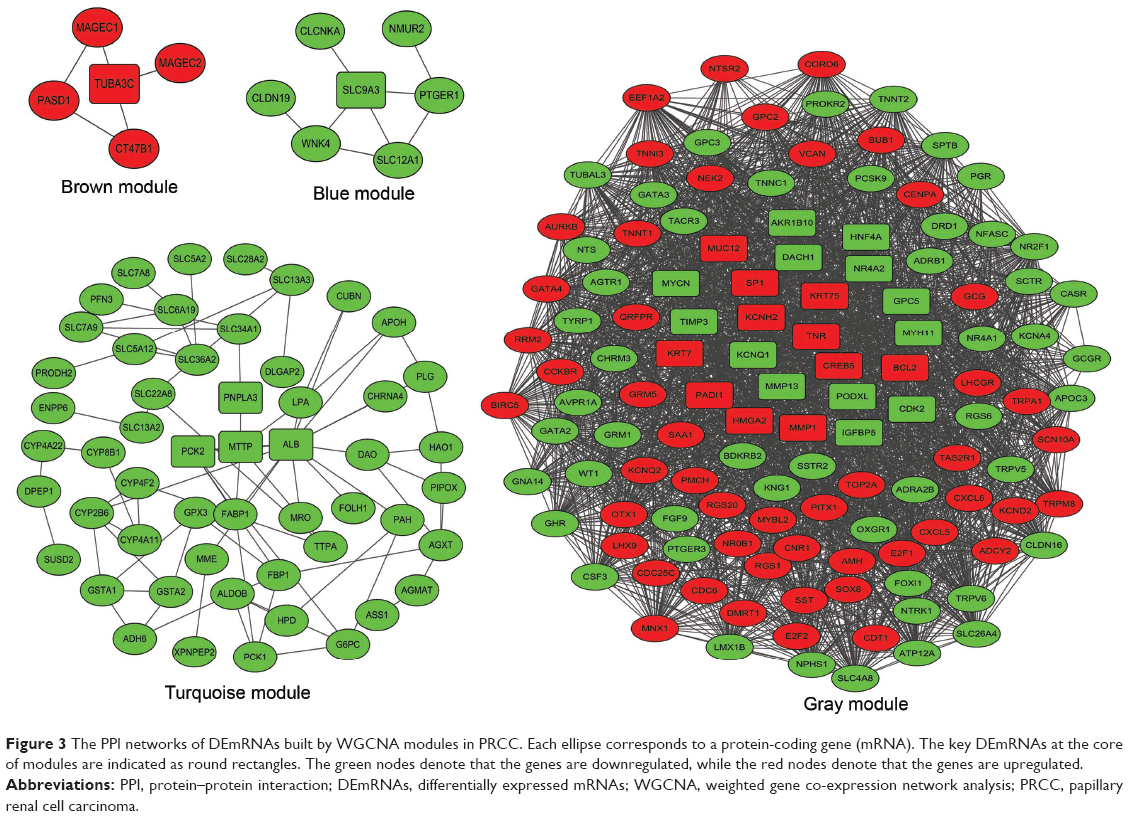 | Figure 3 The PPI networks of DEmRNAs built by WGCNA modules in PRCC. Each ellipse corresponds to a protein-coding gene (mRNA). The key DEmRNAs at the core of modules are indicated as round rectangles. The green nodes denote that the genes are downregulated, while the red nodes denote that the genes are upregulated. |
The brown module had five nodes and five interactions. In this module, we observed that tubulin alpha 3c (TUBA3C) was at the core of the PPI network, and five nodes were upregulated DEmRNAs. Moreover, there were five enriched pathways identified by clusterProfiler. We found that TUBA3C, as the hub gene, was involved in four pathways, namely, “Pathogenic Escherichia coli infection”, “Gap junction”, “Apoptosis”, and “Phagosome”.
The turquoise module had 53 nodes and 76 interactions. We found some genes that were central to PPI, including patatin-like phospholipase domain-containing 3 (PNPLA3), albumin (ALB), microsomal triglyceride transfer protein (MTTP), and phosphoenolpyruvate carboxy-kinase 2 (PCK2), are the hub genes related to PRCC, and all the DEmRNAs were downregulated. In this module, a total of 19 pathways were enriched in the PPI network. PNPLA3 was enriched in the pathway of “Metabolic pathways”. PCK2 was involved in the pathways of “Glycolysis/Gluconeogenesis” and the “PPAR signaling pathway”. However, we found that there was no interaction between genes in the yellow module, and no significantly enriched KEGG pathway was identified.
The gray color cluster represented the non-clustering genes in WGCNA. Some non-clustering genes could serve as potential regulators that are associated with the progression of PRCC. Therefore, to better understand the functional annotation and the PPI, we constructed the PPI network and identified the KEGG pathways involved in these genes. This PPI network showed 122 nodes and 962 interactions. The most significant hub genes were nuclear receptor subfamily 4 group A member 2 (NR4A2), dachshund family transcription factor 1 (DACH1), glypican 5 (GPC5), potassium voltage-gated channel subfamily H member 2 (KCNH2), specificity protein 1 (SP1), v-myc avian myelocytomatosis viral oncogene (MYCN), high mobility group AT-hook 2 (HMGA2), tenascin R (TNR), CAMP responsive element-binding protein 5 (CREB5), apoptosis regulator Bcl-2 (BCL2), cyclin-dependent kinase 2 (CDK2), and tissue inhibitor of metalloproteinases 3 (TIMP3). In this module, we found 29 significantly upregulated pathways and demonstrated that the crucial enriched genes were involved in biological processes and molecular metabolism, such as “Metabolism of xenobiotics by cytochrome P450”, “Metabolic pathways”, “Aldosterone-regulated sodium reabsorption”, and “Cell cycle”. The NR4A2 and CREB5 genes were identified as being related to “Aldosterone synthesis and secretion” pathways. In addition, CREB5 and TNR could play important roles in the “PI3K-Akt signaling pathway”. TNR and HMGA2 were found to be enriched in “MicroRNAs in cancer”. The pathway for “Transcriptional misregulation in cancer” included MYCN, HMGA2, and BCL2.
Construction of the ceRNA network in PRCC
To investigate DElncRNA mediation of PRCC in greater depth, we used Cytoscape software to construct the ceRNA network including lncRNA–miRNA–mRNA interactions (Figure 4A). We integrated the mRNASeq and miRNASeq data to identify the hub genes and DEmiRNAs, based on the above analytical methods. The DEmiRNA–mRNA pairs were constructed based on miRTarBase. A total of 28 hub DEmRNAs were identified as target genes by WGCNA. We found that hsa-mir-217, hsa-mir-133b, hsa-mir-216a, hsa-mir-133a, hsa-mir-145, hsa-mir-211, and hsa-mir-1297 were also closely related with these target DEmRNAs. Moreover, we found that 16 DElncRNAs were related with the key DEmiRNAs, based on retrieving miRcode database (Table 3). PVT1, as a key DElncRNA, had interactive associations with mir-145, mir-211, mir-216a, mir-133a, and mir-133b in this network. The DElncRNA RP11-496D24.2 interacted with mir-145, mir-211, mir-216a, and mir-217. Taken together, we suggest that DElncRNA PVT1 and RP11-496D24.2 could be key regulators in the pathogenesis of PRCC by mediating the ceRNA network.
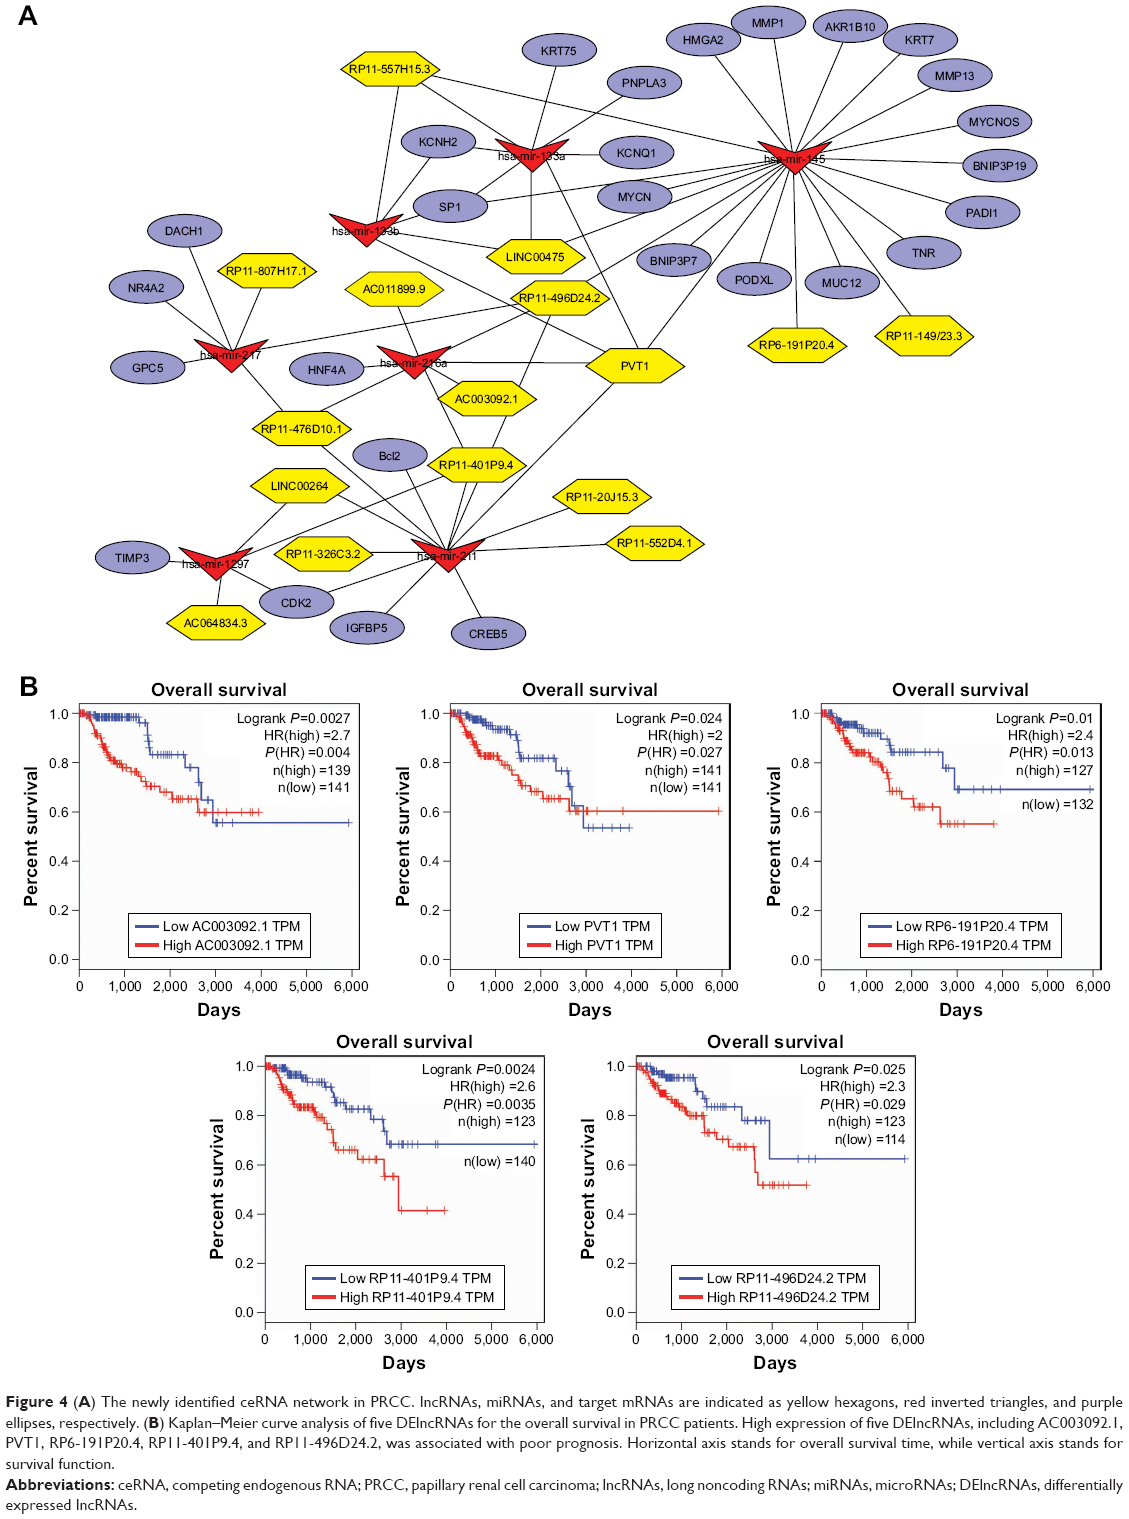 | Figure 4 (A) The newly identified ceRNA network in PRCC. lncRNAs, miRNAs, and target mRNAs are indicated as yellow hexagons, red inverted triangles, and purple ellipses, respectively. (B) Kaplan–Meier curve analysis of five DElncRNAs for the overall survival in PRCC patients. High expression of five DElncRNAs, including AC003092.1, PVT1, RP6-191P20.4, RP11-401P9.4, and RP11-496D24.2, was associated with poor prognosis. Horizontal axis stands for overall survival time, while vertical axis stands for survival function. |
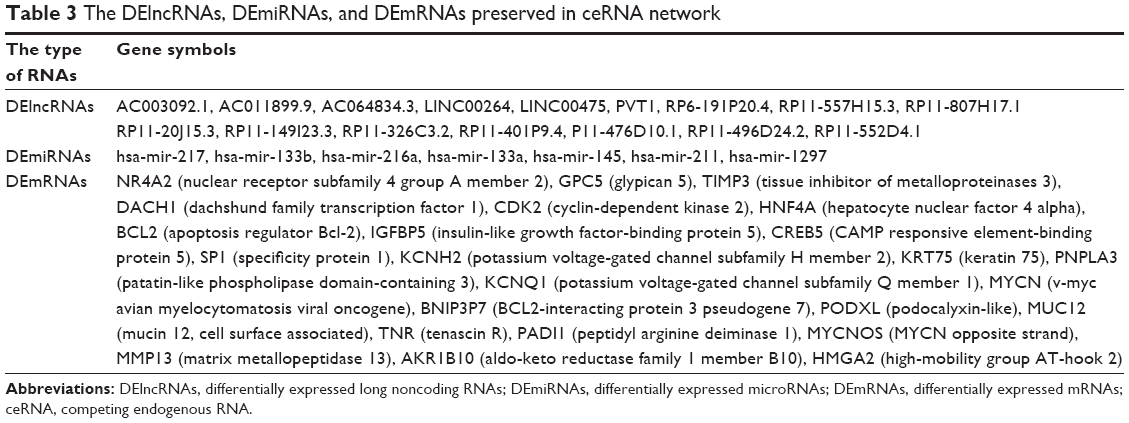 | Table 3 The DElncRNAs, DEmiRNAs, and DEmRNAs preserved in ceRNA network |
Survival analysis for the hub DEGs and DEmiRNAs
A total of 16 DElncRNAs and seven DEmiRNAs were identified as hub lncRNAs/miRNAs that were responsible for the tumorigenesis of PRCC. To investigate overall survival for these RNAs, we performed Kaplan–Meier curve analysis to obtain the prognostic signature. The survival analysis suggested that all key lncRNAs, except LINC00264, were related to the progression of PRCC (Figure S1). High expression of five DElncRNAs, including AC003092.1, PVT1, RP6-191P20.4, RP11-401P9.4, and RP11-496D24.2, was associated with poor prognosis (Figure 4B). Conversely, the other 10 DElncRNAs with highly expressed levels predicted a longer patient survival time. Similar to DEmiRNAs, survival analysis for the seven miRNAs showed that all DEmiRNAs, except mir-211, have negative effects on overall survival of patients (Figure 5).
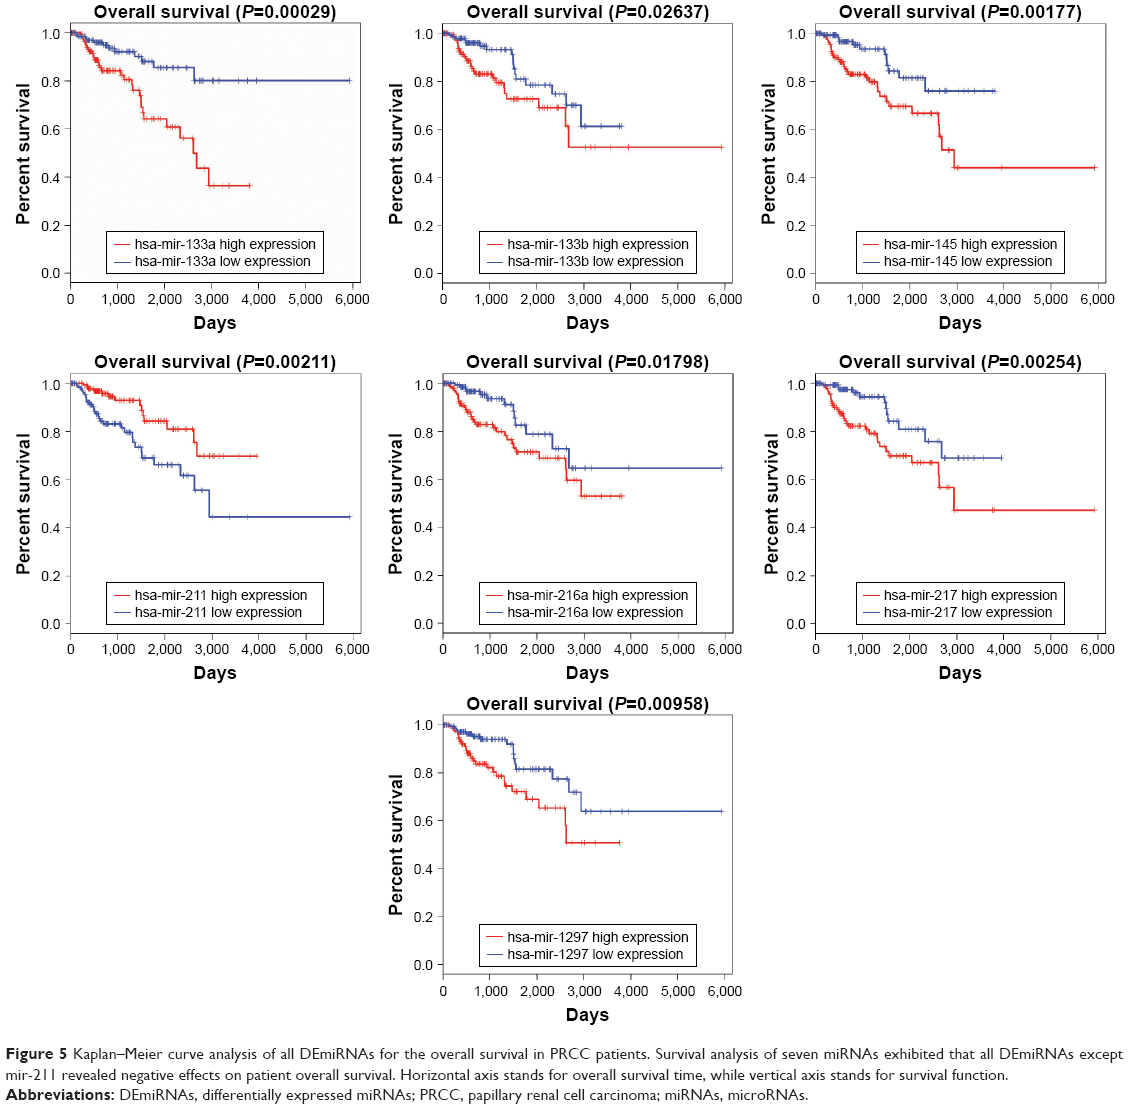 | Figure 5 Kaplan–Meier curve analysis of all DEmiRNAs for the overall survival in PRCC patients. Survival analysis of seven miRNAs exhibited that all DEmiRNAs except mir-211 revealed negative effects on patient overall survival. Horizontal axis stands for overall survival time, while vertical axis stands for survival function. |
Discussion
PRCC, as the second most common histological subtype neoplasm affecting the kidney, has been intensively investigated to identify the key regulatory genes and molecules. Most attention has been focused on the study of tumor progression mediated through dysregulated lncRNAs, and the influence that neoplastic metastasis has on prognosis. However, to our knowledge, few studies have been conducted to predict the prognosis of PRCC, and no reliable papillary renal cell cancer-specific lncRNAs, as biomarkers for the detection and risk stratification of PRCC, have been identified. Therefore, we comprehensively integrated mRNA and miRNA data from TCGA, using WGCNA to screen out the tumor-associated genes, and determined the lncRNA–miRNA–mRNA interactions involved in the ceRNA network to further investigate the regulatory mechanism of lncRNAs.
In this study, 16 DElncRNAs were identified as hub lncRNAs, and six of these (PVT1, PR11-401P9.4, PR11-496D24.2, PR11-476D10.1, PR11-557H15.3, and LINC00475), which were distinctly enriched in the ceRNA network, could be prognostic biomarkers for PRCC. After detailed observation of the ceRNA network, we noticed that two DElncRNAs, PVT1 and RP11-496D24.2, not only had more interactions but may also be involved in regulating the target genes by competing for three common miRNAs (mir-145, mir-211, and mir-216a).
lncRNAs are defined as non-protein-coding transcripts longer than 200 nucleotides.24 However, very recent research has indicated that some lncRNAs, playing widespread roles acting as gene regulators and in other cellular processes, can encode proteins. PVT1 has been shown to represent an lncRNA locus, across a genome interval of over 300 kb on the forward strand of chromosome 8, and this had been considered a candidate oncogene.25 Overexpression of PVT1 has been confirmed to be associated with many types of cancers, including breast and ovarian cancers, acute myeloid leukemia, and Hodgkin lymphoma.26–29 In this study, our analysis found that high expression of PVT1 may compete with three key DEmiRNAs (miR-133a, miR-133b, and miR-145) to mediate the expression of target genes. Moreover, patients with highly expressed PVT1 had shorter survival than those with low expression. It can be suggested that PVT1 knockdown may prevent cell proliferation in PRCC, and prolong survival time of patients. Furthermore, we noticed that high expression of RP11-496D24.2 also demonstrated a poor prognosis in patients, but there is little known about this lncRNA. Further investigations are required to clarify the function of RP11-496D24.2 in PRCC and other renal tumors.
miRNAs function as master regulators and signal modulators by fine-tuning gene expression in many complex pathways. Disrupting these miRNAs may result in a permissive tumorigenic state.30 Many dysregulated miRNAs in adenocarcinoma have been reported to play various roles in carcinogenesis. To our knowledge, we found that seven miRNAs, namely, mir-217, mir-133b, mir-216a, mir-133a, mir-145, mir-211, and mir-1297, involved in the ceRNA network, can be supportive to further investigation. mir-145 and mir-211, at the core of the network, were particularly important. Wach et al showed that increased expression of mir-145 in PRCC subtypes was associated with worse outcome.31 Furthermore, survival analysis also indicated that overexpression of mir-145 predicted a shorter lifetime compared to patients with lower mir-145 expression in our research. Regarding mir-211, previous reports have revealed that it can function as a metabolic switch in human melanoma cells, regulate CD44-dependent cell growth in colorectal cancer, and downregulate special AT-rich sequence-binding protein 2 (SATB2) to suppress hepatocellular carcinoma.32–34 Our data have shown that there is a potential mir-211-mediated interaction with PRCC. In addition, survival analysis demonstrated that high mir-211 expression can prolong patient survival time. However, these findings require further research to identify whether these miRNAs have a specific role in PRCC tumorigenesis.
According to the WGCNA, we found that many protein-coding genes from the gray module, such as SP1, CDK2, and MYCN, considered as important target genes, were involved in this newly identified ceRNA network. SP1 demonstrated the most interactions with DEmiRNA in the network. Previous studies have confirmed that SP1 is a specific transcription factor that can recognize GC-rich motifs and bind to DNAs or transcription activators by zinc fingers.35 Moreover, the protein encoded by SP1 has been identified in various cellular processes, such as cell cycle, immune responses, response to DNA damage, and chromatin remodeling. In addition, SP1 can also function as an activator or a repressor though posttranslational modifications (acetylation, phosphorylation, glycosylation, and proteolytic processing).35,36 In the construction of the ceRNA network, SP1 can be a direct target of three hub DEmiRNAs, including miR-133a, miR-133b, and miR-145. Therefore, these DEmiRNAs may compete with a common DElncRNA PVT1. Therefore, we suggested that PVT1 may be a ceRNA to investigate tumor-suppressing effects in PRCC, via downregulation of SP1.
Although ncRNAs and miRNAs have received increasingly more attention in recent years, research focusing on the remarkable genes which code proteins is still ongoing. A similar study based on TCGA database has been conducted by He et al.37 They used the WGCNA method to find out that 17 hub DEmRNAs may serve as potential biomarkers and associate with distinct various pathological stages of PRCC. However, this study only made use of the mRNASeq data, and there were no combinations with lncRNAs, miRNAs, or other types of biological molecules. Conversely, our research has revealed that these specific lncRNAs and miRNAs interact with the key DEmRNAs involved in successful construction of the lncRNA–miRNA–mRNA ceRNA network. Due to the differences in types of RNASeq gene expression, methods used for data processing, and cutoff criteria used for analyzing DEGs, there is no overlap between our research and He et al’s study.
Conclusion
lncRNA-related studies have been increasingly conducted to investigate many biological processes, but few have characterized that lncRNAs, as ceRNAs, can regulate the tumorigenesis of PRCC. We constructed the ceRNA network to display a novel ceRNA regulatory mechanism for further investigation.
Acknowledgment
The authors gratefully acknowledge The Cancer Genome Atlas pilot project (established by NCI and NHGRI), which made the genomic data and clinical data of PRCC available.
Disclosure
The authors declare that they have no conflicts of interest in this work.
References
Rini BI, Campbell SC, Escudier B. Renal cell carcinoma. Lancet. 2009;373(9669):1119–1132. | ||
Moch H, Cubilla AL, Humphrey PA, Reuter VE, Ulbright TM. The 2016 WHO classification of tumours of the urinary system and male genital organs-part A: renal, penile, and testicular tumours. Eur Urol. 2016;70(1):93–105. | ||
Low G, Huang G, Fu W, Moloo Z, Girgis S. Review of renal cell carcinoma and its common subtypes in radiology. World J Radiol. 2016;8(5):484–500. | ||
Baltimore D. Our genome unveiled. Nature. 2001;409(6822):814–816. | ||
Salmena L, Poliseno L, Tay Y, Kats L, Pandolfi PP. A ceRNA hypothesis: the Rosetta Stone of a hidden RNA language? Cell. 2011;146(3):353–358. | ||
Cesana M, Cacchiarelli D, Legnini I, et al. A long noncoding RNA controls muscle differentiation by functioning as a competing endogenous RNA. Cell. 2011;147(2):358–369. | ||
Poliseno L, Salmena L, Zhang J, Carver B, Haveman WJ, Pandolfi PP. A coding-independent function of gene and pseudogene mRNAs regulates tumour biology. Nature. 2010;465(7301):1033–1038. | ||
Zhang B, Horvath S. A general framework for weighted gene co-expression network analysis. Stat Appl Genet Mol Biol. 2005;4:Article17. | ||
Langfelder P, Horvath S. WGCNA: an R package for weighted correlation network analysis. BMC Bioinformatics. 2008;9:559. | ||
Ruan X, Li H, Liu B, et al. A novel method to identify pathways associated with renal cell carcinoma based on a gene co-expression network. Oncol Rep. 2015;34(2):567–576. | ||
Giulietti M, Occhipinti G, Principato G, Piva F. Weighted gene co-expression network analysis reveals key genes involved in pancreatic ductal adenocarcinoma development. Cell Oncol (Dordr). 2016;39(4):379–388. | ||
Giulietti M, Occhipinti G, Principato G, Piva F. Identification of candidate miRNA biomarkers for pancreatic ductal adenocarcinoma by weighted gene co-expression network analysis. Cell Oncol. 2017;40(2):181–192. | ||
Tang RX, Chen WJ, He RQ, et al. Identification of a RNA-Seq based prognostic signature with five lncRNAs for lung squamous cell carcinoma. Oncotarget. Epub 2017 Apr 13. | ||
Zhao W, Langfelder P, Fuller T, Dong J, Li A, Hovarth S. Weighted gene coexpression network analysis: state of the art. J Biopharm Stat. 2010;20(2):281–300. | ||
Tomczak K, Czerwińska P, Wiznerowicz M. The Cancer Genome Atlas (TCGA): an immeasurable source of knowledge. Contemp Oncol (Pozn). 2015;19(1A):A68–A77. | ||
Anders S, Huber W. Differential expression analysis for sequence count data. Genome Biol. 2010;11(10):R106. | ||
Stelzer G, Dalah I, Stein TI, et al. In-silico human genomics with GeneCards. Hum Genomics. 2011;5(6):709–717. | ||
Yu G, Wang LG, Han Y, He QY. clusterProfiler: an R package for comparing biological themes among gene clusters. OMICS. 2012;16(5):284–287. | ||
Szklarczyk D, Morris JH, Cook H, et al. The STRING database in 2017: quality-controlled protein-protein association networks, made broadly accessible. Nucleic Acids Res. 2017;45(Database issue):D362–D368. | ||
Hsu SD, Tseng YT, Shrestha S, et al. miRTarBase update 2014: an information resource for experimentally validated miRNA-target interactions. Nucleic Acids Res. 2014;42(Database issue):D78–D85. | ||
Jeggari A, Marks DS, Larsson E. miRcode: a map of putative microRNA target sites in the long non-coding transcriptome. Bioinformatics. 2012;28(15):2062–2063. | ||
Tang Z, Li C, Kang B, Gao G, Li C, Zhang Z. GEPIA: a web server for cancer and normal gene expression profiling and interactive analyses. Nucleic Acids Res. Epub 2017 Apr 12. | ||
Goeman JJ, Oosting J, Cleton-Jansen AM, Anninga JK, van Houwelingen HC. Testing association of a pathway with survival using gene expression data. Bioinformatics. 2005;21(9):1950–1957. | ||
Ponting CP, Oliver PL, Reik W. Evolution and functions of long noncoding RNAs. Cell. 2009;136(4):629–641. | ||
Wang L, He JH, Han ZP. Characteristics of PVT1 and its roles in diseases. Chin Med Sci J. 2014;29(4):236–238. | ||
Conte F, Fiscon G, Chiara M, Colombo T, Farina L, Paci P. Role of the long non-coding RNA PVT1 in the dysregulation of the ceRNA-ceRNA network in human breast cancer. PLoS One. 2017;12(2):e0171661. | ||
Guan Y, Kuo WL, Stilwell JL, et al. Amplification of PVT1 contributes to the pathophysiology of ovarian and breast cancer. Clin Cancer Res. 2007;13(19):5745–5755. | ||
Taniwaki M. [Recent advancements in molecular cytogenetics for hematological malignancies: identification of novel PVT1 fusion genes]. Rinsho Ketsueki. 2015;56(10):2056–2065. Japanese [with English abstract]. | ||
Ghesquières H, Larrabee BR, Casasnovas O, et al. A susceptibility locus for classical Hodgkin lymphoma at 8q24 near MYC/PVT1 predicts patient outcome in two independent cohorts. Br J Haematol. Epub 2016 Sep 9. | ||
Adams BD, Kasinski AL, Slack FJ. Aberrant regulation and function of microRNAs in cancer. Curr Biol. 2014;24(16):R762–R776. | ||
Wach S, Nolte E, Theil A, et al. MicroRNA profiles classify papillary renal cell carcinoma subtypes. Br J Cancer. 2013;109(3):714–722. | ||
Mazar J, Qi F, Lee B, et al. MicroRNA 211 functions as a metabolic switch in human melanoma cells. Mol Cell Biol. 2016;36(7):1090–1108. | ||
Wu X, He X, Li S, Xu X, Chen X, Zhu H. Long non-coding RNA ucoo2kmd.1 regulates CD44-dependent cell growth by competing for miR-211-3p in colorectal cancer. PLoS One. 2016;11(3):e0151287. | ||
Jiang G, Cui Y, Yu X, Wu Z, Ding G, Cao L. miR-211 suppresses hepatocellular carcinoma by downregulating SATB2. Oncotarget. 2015;6(11):9457–9466. | ||
Chu S. Transcriptional regulation by post-transcriptional modification – role of phosphorylation in Sp1 transcriptional activity. Gene. 2012;508(1):1–8. | ||
Chang WC, Hung JJ. Functional role of post-translational modifications of Sp1 in tumorigenesis. J Biomed Sci. 2012;19:94. | ||
He Z, Sun M, Ke Y, et al. Identifying biomarkers of papillary renal cell carcinoma associated with pathological stage by weighted gene co-expression network analysis. Oncotarget. 2017;8(17):27904–27914. |
Supplementary material
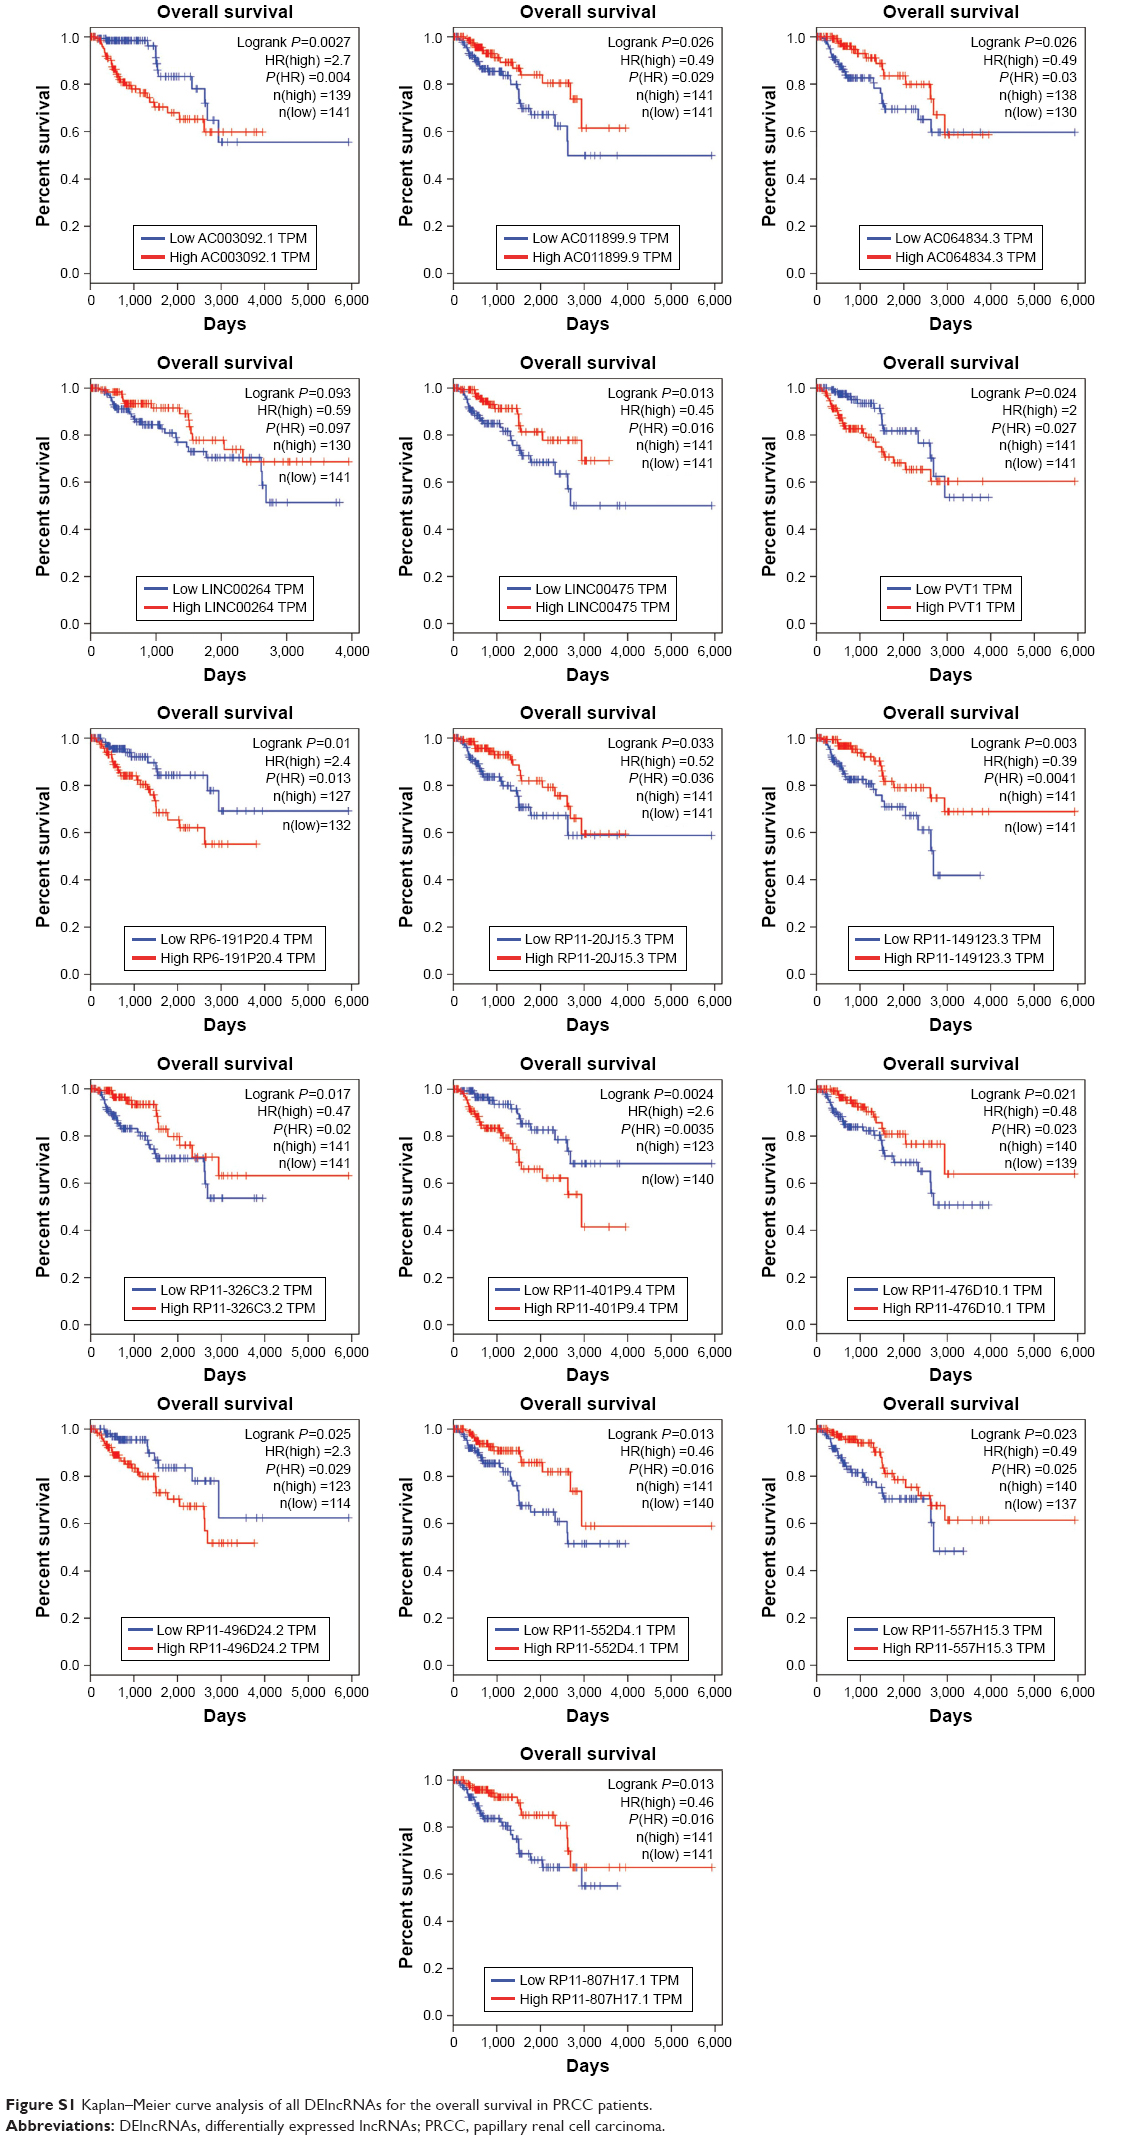 | Figure S1 Kaplan–Meier curve analysis of all DElncRNAs for the overall survival in PRCC patients. |
 © 2017 The Author(s). This work is published and licensed by Dove Medical Press Limited. The full terms of this license are available at https://www.dovepress.com/terms.php and incorporate the Creative Commons Attribution - Non Commercial (unported, v3.0) License.
By accessing the work you hereby accept the Terms. Non-commercial uses of the work are permitted without any further permission from Dove Medical Press Limited, provided the work is properly attributed. For permission for commercial use of this work, please see paragraphs 4.2 and 5 of our Terms.
© 2017 The Author(s). This work is published and licensed by Dove Medical Press Limited. The full terms of this license are available at https://www.dovepress.com/terms.php and incorporate the Creative Commons Attribution - Non Commercial (unported, v3.0) License.
By accessing the work you hereby accept the Terms. Non-commercial uses of the work are permitted without any further permission from Dove Medical Press Limited, provided the work is properly attributed. For permission for commercial use of this work, please see paragraphs 4.2 and 5 of our Terms.