")
Back to Journals » International Journal of Nanomedicine » Volume 12
An in vivo mechanism for the reduced peripheral neurotoxicity of NK105: a paclitaxel-incorporating polymeric micellar nanoparticle formulation
Authors Nakamura I, Ichimura E, Goda R, Hayashi H, Mashiba H, Nagai D, Yokoyama H, Onda T, Masuda A
Received 5 June 2016
Accepted for publication 23 August 2016
Published 15 February 2017 Volume 2017:12 Pages 1293—1304
DOI https://doi.org/10.2147/IJN.S114356
Checked for plagiarism Yes
Review by Single anonymous peer review
Peer reviewer comments 2
Editor who approved publication: Dr Thomas Webster
Iwao Nakamura, Eiji Ichimura, Rika Goda, Hitomi Hayashi, Hiroko Mashiba, Daichi Nagai, Hirofumi Yokoyama, Takeshi Onda, Akira Masuda
Nanomedicine Group, Pharmaceutical Research Laboratories, Nippon Kayaku Co., Ltd., Tokyo, Japan
Abstract: In our previous rodent studies, the paclitaxel (PTX)-incorporating polymeric micellar nanoparticle formulation NK105 had showed significantly stronger antitumor effects and reduced peripheral neurotoxicity than PTX dissolved in Cremophor® EL and ethanol (PTX/CRE). Thus, to elucidate the mechanisms underlying reduced peripheral neurotoxicity due to NK105, we performed pharmacokinetic analyses of NK105 and PTX/CRE in rats. Among neural tissues, the highest PTX concentrations were found in the dorsal root ganglion (DRG). Moreover, exposure of DRG to PTX (Cmax_PTX and AUC0-inf._PTX) in the NK105 group was almost half that in the PTX/CRE group, whereas exposure of sciatic and sural nerves was greater in the NK105 group than in the PTX/CRE group. In histopathological analyses, damage to DRG and both peripheral nerves was less in the NK105 group than in the PTX/CRE group. The consistency of these pharmacokinetic and histopathological data suggests that high levels of PTX in the DRG play an important role in the induction of peripheral neurotoxicity, and reduced distribution of PTX to the DRG of NK105-treated rats limits the ensuing peripheral neurotoxicity. In further analyses of PTX distribution to the DRG, Evans blue (Eb) was injected with BODIPY®-labeled NK105 into rats, and Eb fluorescence was observed only in the DRG. Following injection, most Eb dye bound to albumin particles of ~8 nm and had penetrated the DRG. In contrast, BODIPY®–NK105 particles of ~90 nm were not found in the DRG, suggesting differential penetration based on particle size. Because PTX also circulates as PTX–albumin particles of ~8 nm following injection of PTX/CRE, reduced peripheral neurotoxicity of NK105 may reflect exclusion from the DRG due to particle size, leading to reduced PTX levels in rat DRG (275).
Keywords: micelle, paclitaxel, peripheral neurotoxicity, dorsal root ganglion, vascular permeability
Introduction
Taxol® (Bristol-Myers Squibb Co., Princeton, NJ, USA) is one of the most widely used antineoplastic agents and exhibits wide-spectrum antitumor activity.1 However, Taxol® is also known to induce various adverse effects. Of these, sensory peripheral neuropathy is a dose-limiting factor for Taxol® treatments as no accepted standard of care for its prevention or treatment has been established.2,3 Taxol® contains paclitaxel (PTX) as a main active ingredient, which is formulated in Cremophor® EL and dehydrated ethanol (PTX/CRE), an original formulation of PTX.
NK105 is a PTX-incorporating core-shell-type micellar nanoparticle formulation comprising the novel amphiphilic block copolymer (NK105 polymer in self-association with polymeric micellar nanoparticles) in aqueous media.4 Because of its high hydrophobicity, PTX is physically entrapped within NK105 polymers and forms the inner core of the NK105 formulation. In our preceding rodent study, NK105 showed significantly higher antitumor effects than PTX/CRE, and the associated peripheral neurotoxicity (PN) was reduced.4 Increased antitumor effects of NK105 likely reflected longer retention times in the plasma and enhanced permeability and retention effects in tumor tissues.5,6 However, the mechanisms behind limited NK105-induced PN remain unknown and were the focus of the present study.
Although numerous reports describe the molecular mechanisms of PTX/CRE-induced PN,7–13 high PTX distribution to the dorsal root ganglion (DRG) seems to play a pivotal role.14–17 High distributions of other anticancer platinum derivatives to the DRG have also been known to associate with PN in animal models and in cancer patients.18–20 Moreover, high levels of methylmercury21 or cadmium22 have also been reported in the DRG of the rat cadmium- or methyl mercury-induced peripheral neuropathy models and seem to be one of the main reasons for their symptoms.23 Thus, in the present study, we compared the relative distributions of NK105 and PTX to the DRG by pharmacokinetics analyses following weekly injections of NK105 or PTX/CRE in rats.
In contrast with peripheral nerves in rats,24 the capillaries in the DRG are much more permeable to nanoparticles, such as serum albumin (70 kDa, 8 nm24 in diameter),25,26 horseradish peroxidase (40 kDa, 2.5–5.0 nm),27,28 and dextrans of various sizes (3–150 kDa, 3–17 nm).24 Therefore, following injections of PTX/CRE formulations, PTX rapidly adheres to albumin29 and circulates in the blood as albumin-bound PTX particles (≈8 nm)24 that must be small enough to leak from the blood vessels into the DRG.24–26 Subsequent extravasation into DRG parenchyma seems to result in significantly higher and more sustained distributions of PTX in the DRG of PTX/CRE-treated rodents.14,16,17,23,30 In contrast, NK105 is ~90 nm in diameter4 and may be excluded from the DRG, thus limiting the distribution of PTX to the DRG. To confirm this assumption, we compared plasma and DRG concentrations of NK105 polymer and PTX in rats using pharmacokinetic assays and fluorescent analyses following injections of BODIPY®-labeled NK105 polymer and the extravasation marker Evans blue (Eb). Previous studies showed that Eb adheres to albumin soon after injection31 and, similar to PTX,29 circulates as albumin-bound Eb.31 Thus, the present Eb fluorescence experiments indicate likely distributions of albumin-bound PTX in rat DRG and suggest that the comparatively limited presence of NK105 reduces PTX-associated PN in rats.
Materials and methods
Experimental animals
Female Sprague Dawley rats (Charles River Japan Inc., Yokohama, Kanagawa, Japan) were used in all experiments after 1 week of habituation. Animal studies were conducted with the approval of the in-house experimental Animal Ethics Committee of Nippon Kayaku Co., Ltd. (Tokyo, Japan) and in accordance with the protocols in the Guidelines for Proper Conduct issued by the Japanese Association for Laboratory Animal Science.32 All attempts were made to minimize the pain and stress inflicted on the animals.
Drugs
NK105 was manufactured by Nippon Kayaku Co., Ltd. (Tokyo, Japan) as a freeze-dried product and was dissolved in 5% glucose for all experiments. The mean diameter of NK105 micelles was measured to be ~90 nm by dynamic light scattering analyses (Zeta Potential/Particle Sizer, NICOMP™ 380 ZLS; Particle Sizing Systems, Port Richey, FL, USA). NK105 was injected at volumes of 0.1–0.5 mL/0.1 kg in all experiments. PTX was purchased from Xi’an High-Tech Industries (Xi’an, People’s Republic of China), and PTX/CRE stock solution was prepared for each experiment by dissolving PTX in a mixed solution of Cremophor® EL (Sigma-Aldrich Co., St Louis, MO, USA) and dehydrated ethanol (50:50, v/v). PTX/CRE was injected immediately after diluting stock solutions with sterile saline. Control rats were intravenously administered a 5% glucose solution.
Concentration–time profiles of PTX after weekly injections of NK105 or PTX/CRE
Eighty rats (9–10 weeks old) were assigned to 16 groups of five rats with minimal differences in mean body weights using the SAS system preclinical package, version 5.0 (SAS Institute Inc., Cary, NC, USA). Subsequently, eight groups of five rats each were treated with NK105, and the other eight groups were treated with PTX/CRE.
NK105 or PTX/CRE were administered weekly, and at 0.083, 1, 4, 8, 24, 72, and 168 h following the sixth injection of NK105 or PTX/CRE at 7.5 mg/kg/day, one of the eight subgroups from each treatment was euthanized by blood collection from the abdominal aorta under ether anesthesia. Plasma samples were separated by centrifuging the blood samples at 3,000 rpm for 15 min at 4°C. Subsequently, liver, sciatic nerve, sural nerve, spinal cord, brain (cerebellum), and DRG (L1 to L6) tissues were excised, weighed, and stored at −80°C until further analysis.
Concentrations of PTX in plasma, liver, and neural tissues were determined using a liquid chromatography/electrospray ionization (positive)-selected reaction monitoring method (API4000; AB SCIEX, Framingham, MA, USA). To accommodate technical difficulties of measuring PTX concentrations which are incorporated in and released from micelles separately and precisely, PTX concentrations were determined as the combination of both forms. Pharmacokinetic parameters were calculated using noncompartmental analyses with the WinNonlin Professional program, version 4.1 (Pharsight Corporation, Mountain View, CA, USA).
Concentration–time profiles of the NK105 polymer and PTX after single injections of NK105
At 1, 24, and 72 h after single injections of NK105 at 7.5 mg/kg/day into 11-week-old rats, plasma and DRGs were collected and stored as described earlier, and NK105 polymer concentrations were measured according to those of the hydrolytic component 4-phenyl-1-butanol,4 which binds to polyethylene glycol (PEG) polyaspartate chain, using a liquid chromatography/electrospray ionization (negative)-selected reaction monitoring method (API300; AB SCIEX). The concentration of NK105 polymer was estimated to be the sum of the NK105 micelle concentration and a single or a few aggregated PEG polyaspartate chain concentrations. The concentrations of PTX in plasma and DRG were estimated as the sum of micelle-incorporated and micelle-released PTX concentrations as described earlier.
Histopathological observations and morphometrical analyses of sciatic nerves and DRGs from rats
In our previous light microscope observations, weekly injections of PTX/CRE at 7.5 mg/kg/day for 6 weeks induced apparent histological damages to sciatic4 and sural nerves (Figure S1) but to the DRG (data not shown) compared to the vehicle. Thus, to compare the effects of NK105 and PTX/CRE on the DRG histologically, we administered NK105 or PTX/CRE at 18 mg/kg/day on days 0 and 3, according to a previous study which induced much severe PN in rats.33
DRGs and sciatic nerves were excised on days 4, 8, and 10 from euthanized rats (9–10 weeks old) and were fixed in 10% phosphate-buffered formalin for histopathological and immunohistochemical analyses. After fixation, frozen or paraffin-embedded tissues were sectioned and stained with hematoxylin and eosin for histopathological analysis or were processed for immunohistochemical analysis by incubating overnight with mouse monoclonal antibodies against anti-neurofilament (NF; Nichirei Biosciences Inc., Tokyo, Japan), Ki-67 (clone MIB-5, 1:50; Dako Denmark A/S, Glostrup, Denmark), glial fibrillary acidic protein (GFAP, clone GA5; Nichirei Biosciences Inc.), and rabbit polyclonal anti-activating transcription factor 3 (ATF-3) antibody (1:500; Santa Cruz Biotechnology Inc., Dallas, TX, USA). Subsequently, the sections were washed and incubated with HRP-conjugated anti-mouse IgG (Histofine SAB-PO kit; Nichirei Biosciences Inc.) or Alexa Fluor 594-conjugated goat polyclonal anti-rabbit IgG (H + L) secondary antibodies (Thermo Fisher Scientific, Waltham, MA, USA). Fluorescent images were generated and analyzed using 576 nm and 628 nm emission filters (NanoZoomer; Hamamatsu Photonics, Shizuoka, Japan).
The numbers of ATF-3-positive and NF-positive neurons were counted within the entire DRG areas and were expressed as percentages of the total number of neurons. The numbers of Ki-67-positive satellite cells were counted within three randomly selected DRG areas at a magnification of 200× and were expressed as percentages of the total number of satellite cells in each area.
Fluorescent image analysis of BODIPY®-labeled NK105 polymer and Eb albumin in the DRG
Rats (16 weeks old) were injected with 100 mg/kg Eb or 30 mg/kg BODIPY®-labeled NK105, which was prepared using BODIPY®-conjugated NK105 polymer and PTX. BODIPY® was conjugated to the polyaspartate component of the NK105 polymer. At 4 and 24 h after single injections, DRGs were excised from euthanized rats and were immediately frozen in Jung Tissue-freezing medium™ (Leica Microsystems, Wetzlar, Germany) on dry ice. Sections (5 μm) were observed using a fluorescence microscope (Biozero BZ-8000; Keyence, Osaka, Japan) with 630 nm and 560 nm emission filters for both Eb and BODIPY®.
Statistics
Data were expressed as mean ± standard deviation (SD). Differences between NK105-treated and PTX/CRE-treated groups were identified using Student’s t-test with an EXSUS statistical analysis system for biological experimental data (CAC EXICARE, Tokyo, Japan) and were considered significant when P<0.05.
Results
Concentration–time profiles of PTX after weekly injections of NK105 or PTX/CRE
Concentration–time curves of PTX were generated for plasma, liver, and five neural tissues from NK105-treated and PTX/CRE-treated rats (Figure 1), and pharmacokinetic parameters were determined (Table 1). In the NK105 group, the highest Cmax_PTX (maximum concentration) and AUC0-inf._PTX (area under the concentration–time curve) values among neural tissues were observed in the DRG and were at least 6.9 times larger than those observed in sciatic and sural nerves. Similarly, in the PTX/CRE group, the highest Cmax_PTX and AUC0-inf._PTX values among neural tissues were observed in the DRG and were at least 16.9 times larger than those observed in sciatic and sural nerves.
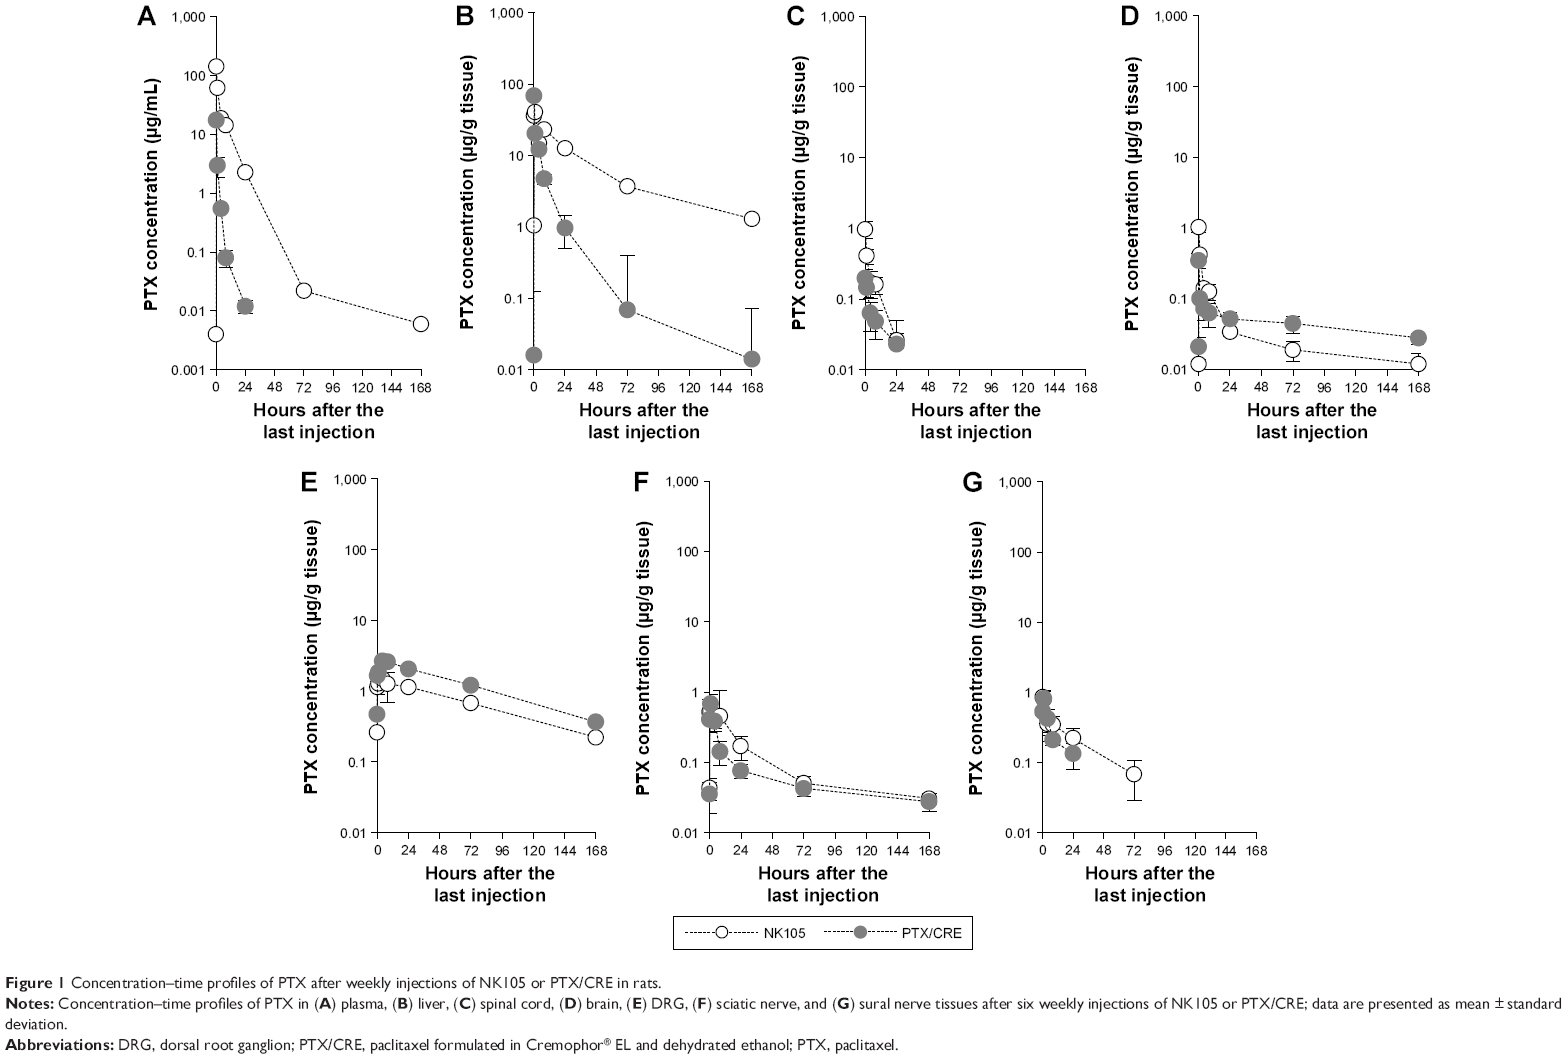 | Figure 1 Concentration–time profiles of PTX after weekly injections of NK105 or PTX/CRE in rats. |
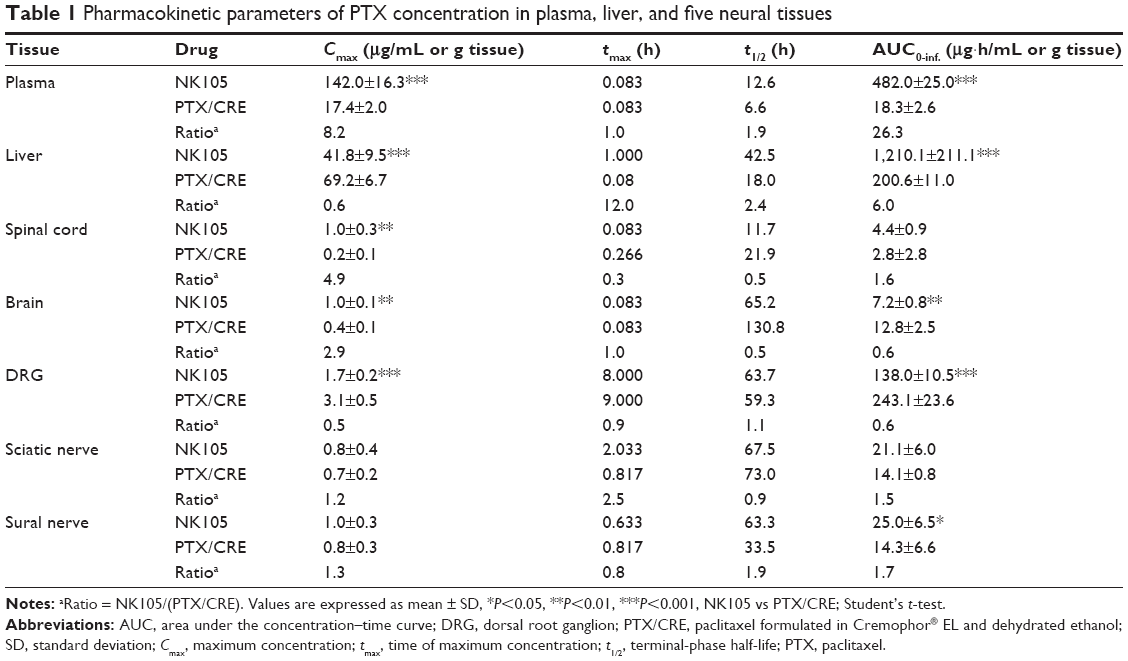 | Table 1 Pharmacokinetic parameters of PTX concentration in plasma, liver, and five neural tissues |
Significantly higher plasma Cmax_PTX (P<0.001) and AUC0-inf._PTX (P<0.001) values were observed in the NK105 group than in the PTX/CRE group, whereas DRG Cmax_PTX (P<0.001) and AUC0-inf._PTX (P<0.001) values were significantly lower in the NK105 group, at 0.6 times of those observed in DRGs from the PTX/CRE group. In addition, the NK105 group showed higher Cmax_PTX and AUC0-inf._PTX values in sciatic nerves than the PTX/CRE group, although these differences were not statistically significant. Finally, NK105-treated rats showed significantly higher Cmax_PTX and AUC0-inf._PTX (P<0.05) values in sural nerves than PTX/CRE-treated rats.
In a pilot study, we generated concentration–time profiles of PTX after single injections of NK105 or PTX/CRE in rats (Figure S2). Although numbers of samples were fewer, the results were similar to those presented in Figure 1, indicating limited PTX accumulation in plasma, liver, and neural tissues under the present drug administration conditions in rats.
Concentration–time profiles of NK105 polymer and PTX after single injections of NK105
Although sample numbers were fewer than in multiple dose studies (Figure 1), single doses produced similar plasma concentration–time profiles (Figure 2).
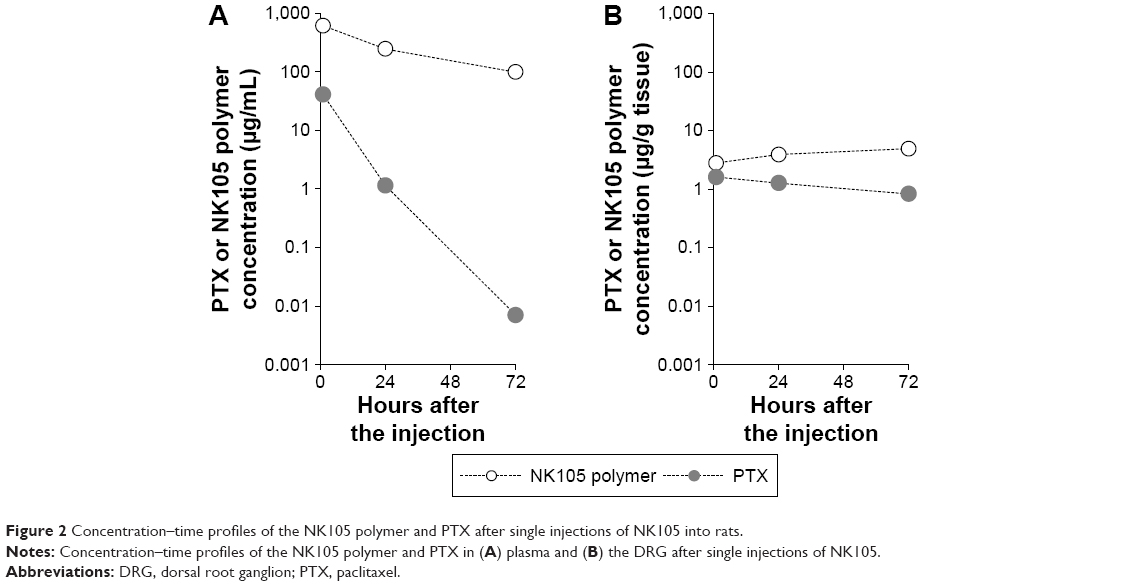 | Figure 2 Concentration–time profiles of the NK105 polymer and PTX after single injections of NK105 into rats. |
Specifically, plasma NK105 polymer concentrations gradually decreased by 84% from 1 to 72 h after injection. Plasma PTX concentrations also decreased, but much faster than those of the NK105 polymer. These data indicate that circulating NK105 micelles gradually release PTX, which is eliminated from plasma much faster than the NK105 polymer.
NK105 polymer concentrations in the DRG increased slightly from 1 to 72 h but remained much lower than those in the plasma, at only 0.5%, 1.6%, and 4.9% of plasma NK105 polymer concentrations at 1, 24, and 72 h after injection, respectively. These data suggest that the NK105 polymer is not readily distributed from plasma to the DRG. In contrast, PTX concentrations in DRG were more stable than those in plasma. Hence, the PTX concentration difference between plasma and DRG was much smaller than that observed for the NK105 polymer. These results indicate that PTX moves from the plasma to the DRG more easily than the NK105 polymer and tends to remain in the DRG for much longer period than in the plasma.
Light microscope observations of histological damage to the DRG and sciatic nerves
Degeneration of DRG neurons was observed on day 4 in NK105 and PTX/CRE groups (Figure 3A), and hypertrophy of satellite cells was shown in both treatment groups on day 8. On days 8 and 10, Nageotte nodules, which are an indicator of neuronal degeneration,15 were observed in both treatment groups (data not shown).
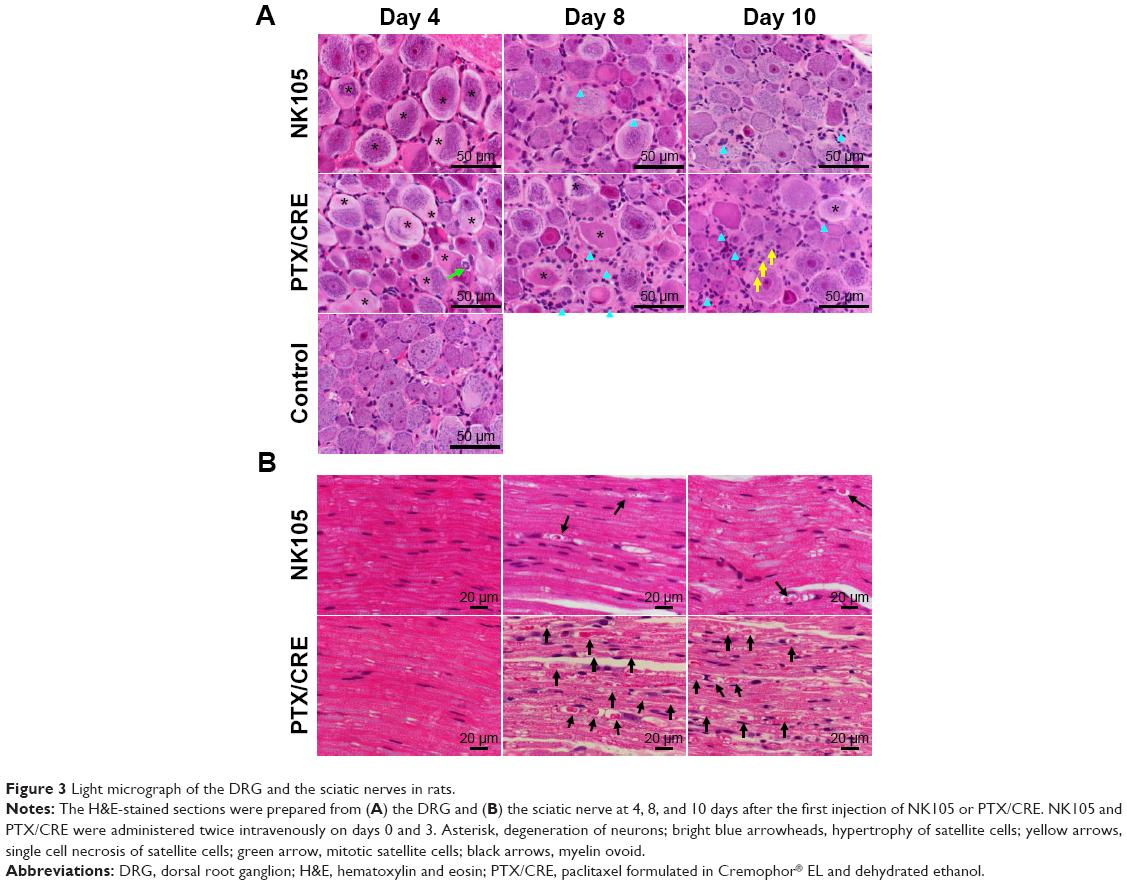 | Figure 3 Light micrograph of the DRG and the sciatic nerves in rats. |
No aberrant histological changes were observed in sciatic nerves from NK105-treated and PTX/CRE-treated animals on day 4 (Figure 3B). Myelin ovoids, which are a distinctive feature of degeneration of myelinated fibers,34 were seen in both treatment groups on days 8 and 10. However, these were much less prevalent in the NK105 group than in the PTX/CRE group.
These data show that administration of NK105 or PTX/CRE induces neural damage in the DRG. However, the extent of damage was mild in comparison with sciatic and sural nerve damage.
Serial observations of neural damage according to histopathological markers in the DRG
ATF-3-positive immunoreactivity was ubiquitously seen in the nuclei of DRG neurons on day 4 in both treatment groups, but it was less frequent on day 8 and was hardly observed on day 10 (Figure 4A). In contrast, ATF-3-positive immunoreactivity was not observed in the nuclei of satellite cells until day 8 but became visible on day 10 (Figure 4A). In contrast, NF-positive immunoreactivity was ubiquitously observed in neuron cytoplasms on day 4, but was less prevalent on day 8 and was hardly seen on day 10 (Figure 4B). Similar to ATF-3, Ki-67-positive and GFAP-positive immunoreactivity was observed in satellite cell nuclei on day 8 and remained visible on day 10 (Figure 4B). Finally, the ratios of ATF-3-positive and NF-positive neurons and Ki-67-positive satellite cells in the DRG varied similarly over time in NK105 and PTX/CRE groups. Although almost all ratios were lower in the NK105 group, these did not differ significantly with those in the PTX/CRE group (Figure 4C).
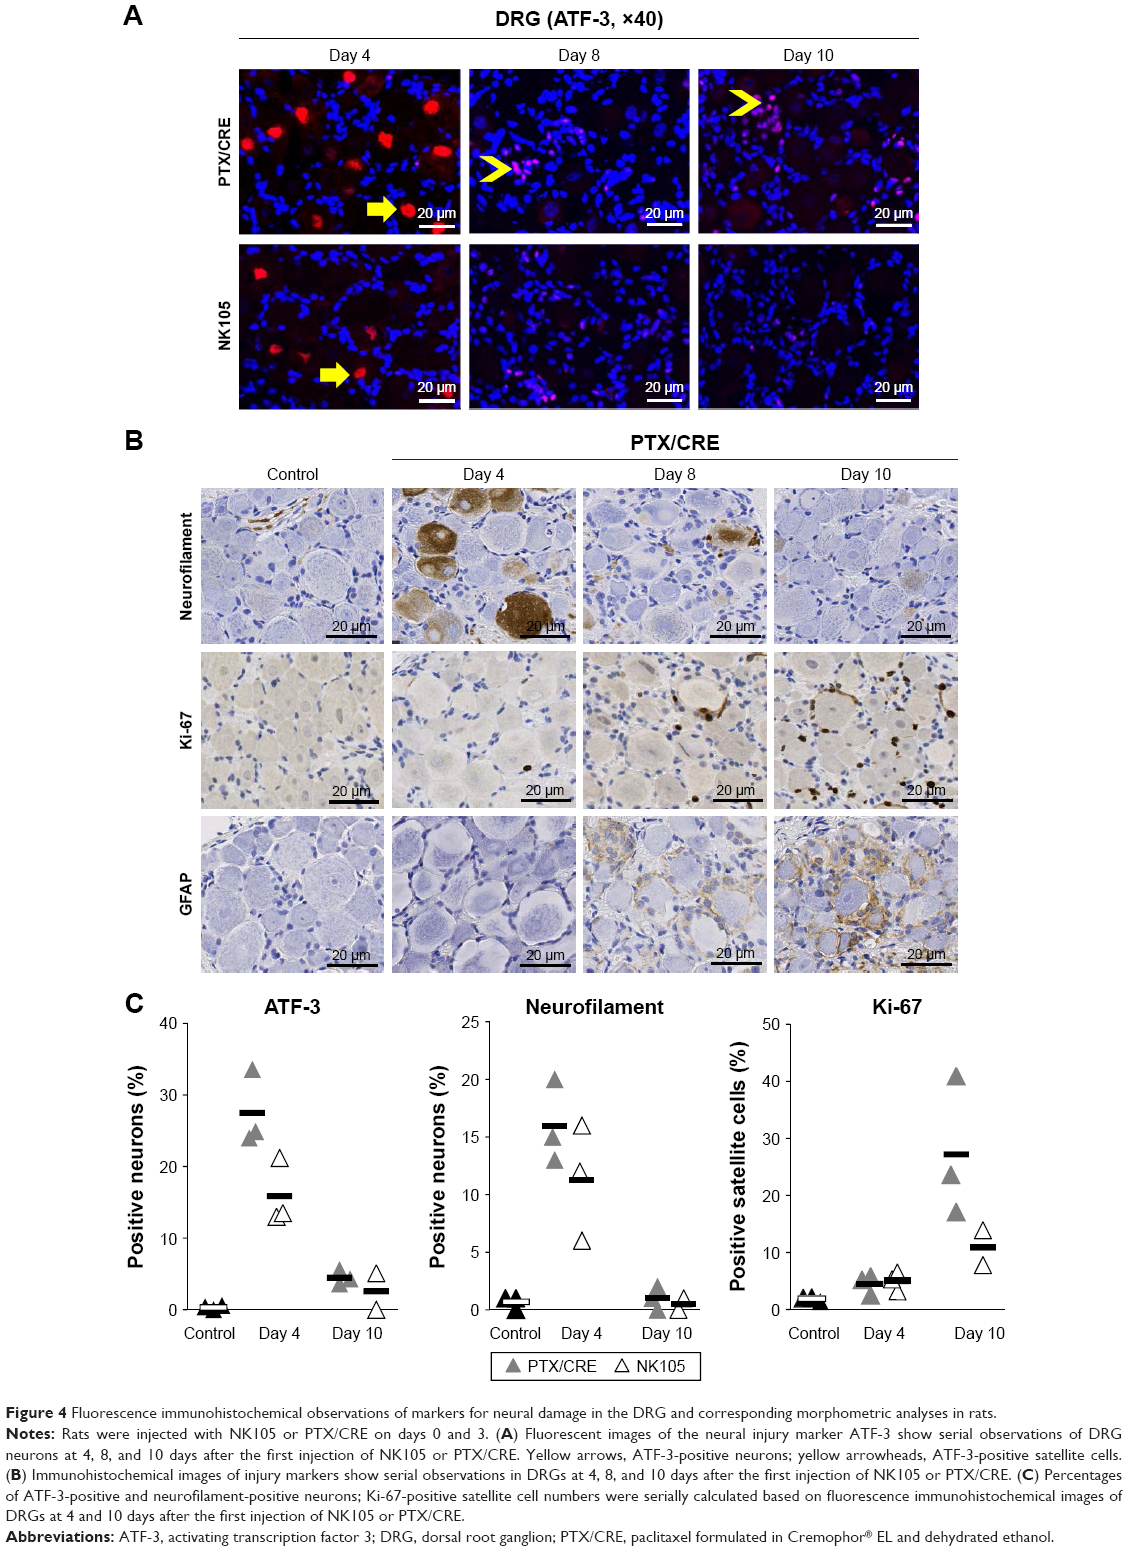 | Figure 4 Fluorescence immunohistochemical observations of markers for neural damage in the DRG and corresponding morphometric analyses in rats. |
Fluorescent image analysis of BODIPY®-labeled NK105 polymer and albumin-bound Eb in the DRG
In BODIPY®-labeled NK105 polymer-treated rats, strong fluorescence was concentrated in the tissues surrounding the DRG, and little fluorescence was seen in the DRG at 4 and 24 h after injection (Figure 5A). In contrast, steady and ubiquitous fluorescence from albumin-bound Eb was diffusely observed in the surrounding tissues and in the DRG at 4 and 24 h after injection (Figure 5B). These observations suggest that circulating albumin-bound Eb extravasates into the DRG at significant concentrations. In contrast, circulating BODIPY®-labeled NK105 had limited access to the DRG, as indicated by concentrated fluorescence in the tissues surrounding the DRG.
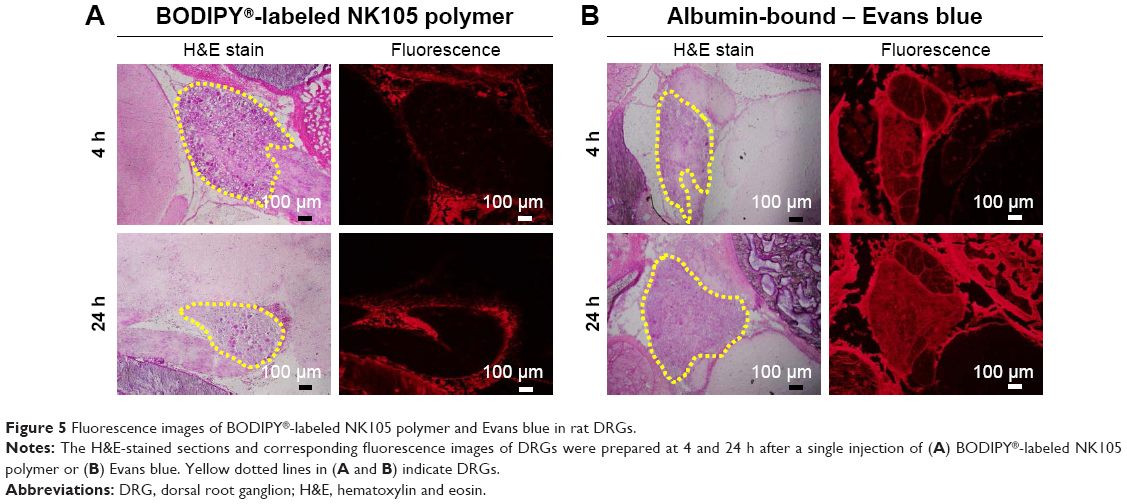 | Figure 5 Fluorescence images of BODIPY®-labeled NK105 polymer and Evans blue in rat DRGs. |
Discussion
In the present pharmacokinetic analyses, PTX concentrations were greatest in the DRG among the five neural tissues following treatment with PTX/CRE. PTX was also predominantly distributed in the DRG following treatment with NK105. However, the Cmax_PTX and AUC0-inf._PTX values in the DRG were significantly lower in the NK105 group than in the PTX/CRE group, but were greater in sciatic and sural nerves of NK105-treated animals. Histopathological analyses showed less damage in the DRG and peripheral nerves in the NK105 group than in the PTX/CRE group (Figures 3 and S1). In addition, fluorescence and immunohistochemical observations showed that initial damage occurred in the DRG of both treatment groups, and then, subsequent nerve damage emerged in the peripheral nerves, which was more apparent in the PTX/CRE group. These present pharmacokinetic and histopathological results are in strict agreement with the results of our previous study4 and suggest greater involvement of DRG damage in PTX/CRE-induced PN than sciatic and sural nerve damage. Accordingly, reduced distributions of PTX in the DRG following treatment with NK105 may have significantly attenuated PN in the rats of present study.
In addition to reports indicating significant involvement of the DRG in PTX/CRE-induced PN in rodents,14–17,23 previous studies also suggest that the direct neurodegenerative effects of PTX on peripheral nerves lead to PTX/CRE-induced PN in rats.35–37 However, if that were true, NK105 should have caused more apparent histopathological damage in sciatic and sural nerves because Cmax_PTX and AUC0-inf_PTX values of NK105 in those peripheral nerves were greater than those of PTX/CRE in this study. This discrepancy indicates much greater involvement of the DRG in PTX-induced PN than that of sciatic and sural nerves in the present rats.
Although Cmax_PTX and AUC0-inf._PTX values in the DRG of NK105-treated animals were about half of those in the PTX/CRE group, this difference was arguably insufficient to explain the differences in degrees of PN between the treatment groups in our previous study.4 However, in this study, Cmax_PTX and AUC0-inf._PTX values in the DRG of the NK105 group were calculated as the sum of micelle-incorporated and micelle-released PTX. Because only the latter can exert cytotoxic effects, cytotoxic Cmax_PTX and AUC0-inf._PTX values in the DRG may have been much smaller than those presented in Table 1. Alternatively, BODIPY®–NK105 fluorescence was concentrated in the tissues surrounding the DRG, suggesting lower PTX concentrations in the DRGs of NK105-treated rats than indicated in Figure 1. Taken together, these interpretations might suggest that lower cytotoxic PTX concentrations in the DRG underlie the significant differences in degrees of PN between the treatment groups in our previous study.4
Pharmacokinetic data from a Phase 1 study38 and a preclinical study4 indicate that circulating NK105 micelles release PTX gradually. However gradual this release, PTX would circulate as albumin-bound PTX and extravasate into the DRG, eventually leading to similar AUC0-inf._PTX values as those following treatment with PTX/CRE. Although the half-life of PTX (t1/2_PTX) was longer in the NK105 group, the greater AUC0-inf._PTX value of NK105 in the plasma (Figure 1) would likely correspond with a DRG AUC0-inf._PTX value in excess of that following treatment with PTX/CRE. The present data indicate that this is not the case. As indicated in Figures 1 and 2, NK105 gradually released PTX into the plasma without an initial burst.39 However, at least 84% of the NK105 polymer was eliminated from the plasma by 24 h after injection, potentially reflecting the actions of hepatic and other phagocytic cells. In addition, although circulating in the blood, poor extravasation of NK105 into the DRG likely reflects exclusion from DRG vasculature due to particle size.16,23,40 Taken together, these observations suggest that NK105 is eliminated from the blood before releasing all incorporated PTX, as reflected by significantly smaller AUC0-inf._PTX values in DRGs of NK105-treated rats.
Drug delivery systems (DDS) generally enhance antitumor effects of chemotherapeutic agents and attenuate adverse effects by improving pharmacokinetics and/or distributions of the incorporated antitumor agents. In the case of PTX, DDS are required to increase antitumor effects and to decrease the ensuing PN of PTX/CRE.41,42 In the present study, PN was attenuated by NK105, at least partly due to decreased PTX concentrations in the DRG. Accordingly, NK105 reportedly has significantly stronger antitumor effects on xenografted tumors in mice.4 In addition, NK105 showed significantly stronger antitumor effects on MRMT-1 allografted rat tumors than PTX/CRE (Figure S3). Moreover, these effects were associated with ~12 times higher PTX concentrations in MRMT-1 tumors (Table S1). Taken together, these data suggest that NK105 enhances antitumor effects and attenuates PN by limiting the distribution of PTX to the DRG, warranting further studies in animal models and clinical trials.
Conclusion
In this study, we showed that PTX concentrations in the DRG were lower following treatment with NK105 than after treatment with PTX/CRE, potentially explaining previously observed decreases in PTX-mediated PN in rats.4 These pharmacokinetic data were confirmed by immunohistochemical analyses which show less PTX in the DRG of NK105-treated animals and may reflect less extravasation from DRG blood vessels due to the large diameter of NK105.
Disclosure
All authors are employees of Nippon Kayaku Co., Ltd. The authors report no other conflicts of interest in this work.
References
Rowinsky EK, Donehower RC. Paclitaxel (Taxol). N Engl J Med. 1995;332(15):1004–1014. | ||
Lipton RB, Apfel SC, Dutcher JP, et al. Taxol produces a predominantly sensory neuropathy. Neurology. 1989;39(3):368–373. | ||
Rowinsky EK, Chaudhry V, Cornblath DR, Donehower RC. Neurotoxicity of Taxol. J Natl Cancer Inst Monogr. 1993;15:107–115. | ||
Hamaguchi T, Matsumura Y, Suzuki M, et al. NK105, a paclitaxel-incorporating micellar nanoparticle formulation, can extend in vivo antitumour activity and reduce the neurotoxicity of paclitaxel. Br J Cancer. 2005;92(7):1240–1246. | ||
Matsumura Y, Maeda H. A new concept for macromolecular therapeutics in cancer chemotherapy: mechanism of tumoritropic accumulation of proteins and the antitumor agent smancs. Cancer Res. 1986;46(12 Pt 1):6387–6392. | ||
Maeda H, Wu J, Sawa T, Matsumura Y, Hori K. Tumor vascular permeability and the EPR effect in macromolecular therapeutics: a review. J Control Release. 2000;65(1–2):271–284. | ||
Flatters SJ, Bennett GJ. Studies of peripheral sensory nerves in paclitaxel-induced painful peripheral neuropathy: evidence for mitochondrial dysfunction. Pain. 2006;122(3):245–257. | ||
Gornstein E, Schwarz TL. The paradox of paclitaxel neurotoxicity: mechanisms and unanswered questions. Neuropharmacology. 2014;76 Pt A:175–183. | ||
Horwitz SB, Lothstein L, Manfredi JJ, et al. Taxol: mechanisms of action and resistance. Ann N Y Acad Sci. 1986;466:733–744. | ||
Jordan MA, Wilson L. Microtubules as a target for anticancer drugs. Nat Rev Cancer. 2004;4(4):253–265. | ||
Peters CM, Jimenez-Andrade JM, Jonas BM, et al. Intravenous paclitaxel administration in the rat induces a peripheral sensory neuropathy characterized by macrophage infiltration and injury to sensory neurons and their supporting cells. Exp Neurol. 2007;203(1):42–54. | ||
Schiff PB, Fant J, Horwitz SB. Promotion of microtubule assembly in vitro by taxol. Nature. 1979;277(5698):665–667. | ||
Theiss C, Meller K. Taxol impairs anterograde axonal transport of microinjected horseradish peroxidase in dorsal root ganglia neurons in vitro. Cell Tissue Res. 2000;299(2):213–224. | ||
Cavaletti G, Cavalletti E, Oggioni N, et al. Distribution of paclitaxel within the nervous system of the rat after repeated intravenous administration. Neurotoxicology. 2000;21(3):389–393. | ||
Peters CM, Jimenez-Andrade JM, Kuskowski MA, Ghilardi JR, Mantyh PW. An evolving cellular pathology occurs in dorsal root ganglia, peripheral nerve and spinal cord following intravenous administration of paclitaxel in the rat. Brain Res. 2007;1168:46–59. | ||
Jimenez-Andrade JM, Herrera MB, Ghilardi JR, Vardanyan M, Melemedjian OK, Mantyh PW. Vascularization of the dorsal root ganglia and peripheral nerve of the mouse: implications for chemical-induced peripheral sensory neuropathies. Mol pain. 2008;4:10. | ||
Xiao WH, Zheng H, Zheng FY, Nuydens R, Meert TF, Bennett GJ. Mitochondrial abnormality in sensory, but not motor, axons in paclitaxel-evoked painful peripheral neuropathy in the rat. Neuroscience. 2011;199:461–469. | ||
Gregg RW, Molepo JM, Monpetit VJ, et al. Cisplatin neurotoxicity: the relationship between dosage, time, and platinum concentration in neurologic tissues, and morphologic evidence of toxicity. J Clin Oncol. 1992;10(5):795–803. | ||
Holmes J, Stanko J, Varchenko M, et al. Comparative neurotoxicity of oxaliplatin, cisplatin, and ormaplatin in a Wistar rat model. Toxicol Sci. 1998;46(2):342–351. | ||
Thompson SW, Davis LE, Kornfeld M, Hilgers RD, Standefer JC. Cisplatin neuropathy. Clinical, electrophysiologic, morphologic, and toxicologic studies. Cancer. 1984;54(7):1269–1275. | ||
Somjen GG, Herman SP, Klein R, et al. The uptake of methyl mercury (203 Hg) in different tissues related to its neurotoxic effects. J Pharmacol Exp Ther. 1973;187(3):602–611. | ||
Arvidson B, Tjalve H. Distribution of 109Cd in the nervous system of rats after intravenous injection. Acta Neuropathol. 1986;69(1–2):111–116. | ||
Jacobs JM. Vascular permeability and neurotoxicity. Environ Health Perspect. 1978;26:107–116. | ||
Hultstrom D, Malmgren L, Gilstring D, Olsson Y. FITC-Dextrans as tracers for macromolecular movements in the nervous system. A freeze-drying method for dextrans of various molecular sizes injected into normal animals. Acta Neuropathol. 1983;59(1):53–62. | ||
Olsson Y. Topographical differences in the vascular permeability of the peripheral nervous system. Acta Neuropathol. 1968;10(1):26–33. | ||
Hirakawa H, Okajima S, Nagaoka T, Kubo T, Takamatsu T, Oyamada M. Regional differences in blood-nerve barrier function and tight-junction protein expression within the rat dorsal root ganglion. Neuroreport. 2004;15(3):405–408. | ||
Karnovsky MJ. The ultrastructural basis of capillary permeability studied with peroxidase as a tracer. J Cell Biol. 1967;35(1):213–236. | ||
Jacobs JM, Macfarlane RM, Cavanagh JB. Vascular leakage in the dorsal root ganglia of the rat, studied with horseradish peroxidase. J Neurol Sci. 1976;29(1):95–107. | ||
Kumar GN, Walle UK, Bhalla KN, Walle T. Binding of taxol to human plasma, albumin and alpha 1-acid glycoprotein. Res Commun Chem Pathol Pharmacol. 1993;80(3):337–344. | ||
Olsson Y. Microenvironment of the peripheral nervous system under normal and pathological conditions. Crit Rev Neurobiol. 1990;5(3):265–311. | ||
Rawson, RA. The binding of T-1824 and structurally related diazo dyes by plasma proteins. Amer J Physiol. 1943;137:708–717. | ||
Japanese Association for Laboratory Animal Science (JALAS) Guidelines for animal experimentation. Exp Anim. 1987;36:285–288. | ||
Cliffer KD, Siuciak JA, Carson SR, et al. Physiological characterization of Taxol-induced large-fiber sensory neuropathy in the rat. Ann Neurol. 1998;43(1):46–55. | ||
Thomas PK. Changes in the endoneurial sheaths of peripheral myelinated nerve fibres during Wallerian degeneration. J Anat. 1964;98:175–182. | ||
Roytta M, Horwitz SB, Raine CS. Taxol-induced neuropathy: short-term effects of local injection. J Neurocytol. 1984;13(5):685–701. | ||
Roytta M, Raine CS. Taxol-induced neuropathy: chronic effects of local injection. J Neurocytol. 1986;15(4):483–496. | ||
Yang IH, Siddique R, Hosmane S, Thakor N, Hoke A. Compartmentalized microfluidic culture platform to study mechanism of paclitaxel-induced axonal degeneration. Exp Neurol. 2009;218(1):124–128. | ||
Hamaguchi T, Kato K, Yasui H, et al. A phase I and pharmacokinetic study of NK105, a paclitaxel-incorporating micellar nanoparticle formulation. Br J Cancer. 2007;97(2):170–176. | ||
Huang X, Brazel CS. On the importance and mechanisms of burst release in matrix-controlled drug delivery systems. J Control Release. 2001;73(2–3):121–136. | ||
Anzil AP, Blinzinger K, Herrlinger H. Fenestrated blood capillaries in rat cranio-spinal sensory ganglia. Cell Tissue Res. 1976;167(4):563–567. | ||
Hennenfent KL, Govindan R. Novel formulations of taxanes: a review. Old wine in a new bottle? Ann Oncol. 2006;17(5):735–749. | ||
Singh S, Dash AK. Paclitaxel in cancer treatment: perspectives and prospects of its delivery challenges. Crit Rev Ther Drug Carrier Syst. 2009;26(4):333–372. |
Supplementary materials
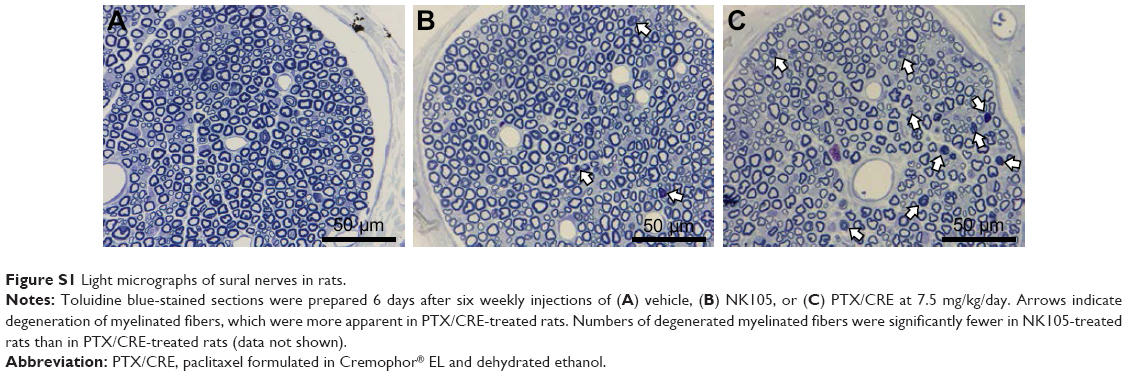 | Figure S1 Light micrographs of sural nerves in rats. |
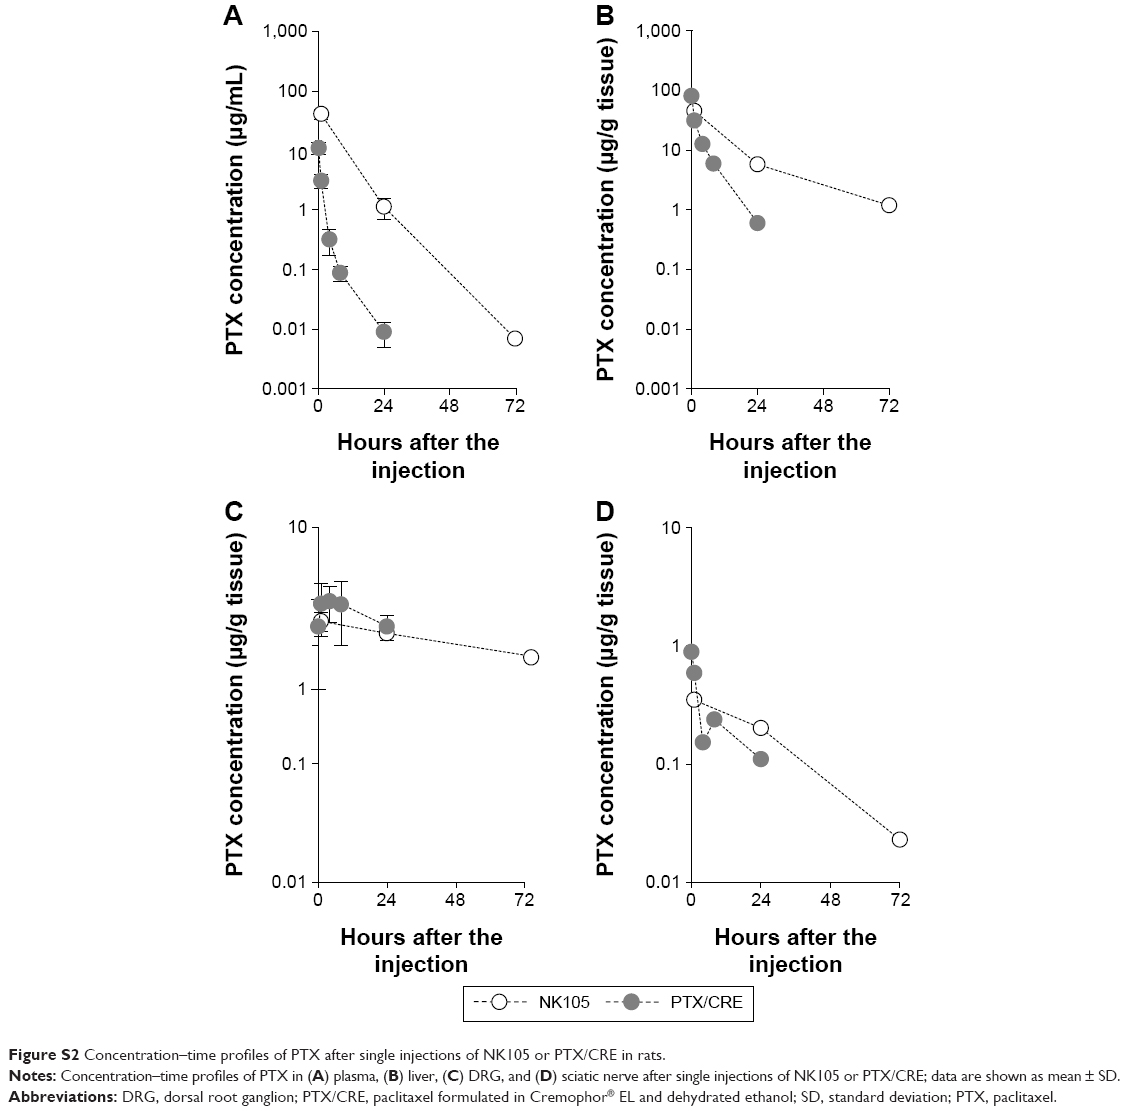 | Figure S2 Concentration–time profiles of PTX after single injections of NK105 or PTX/CRE in rats. |
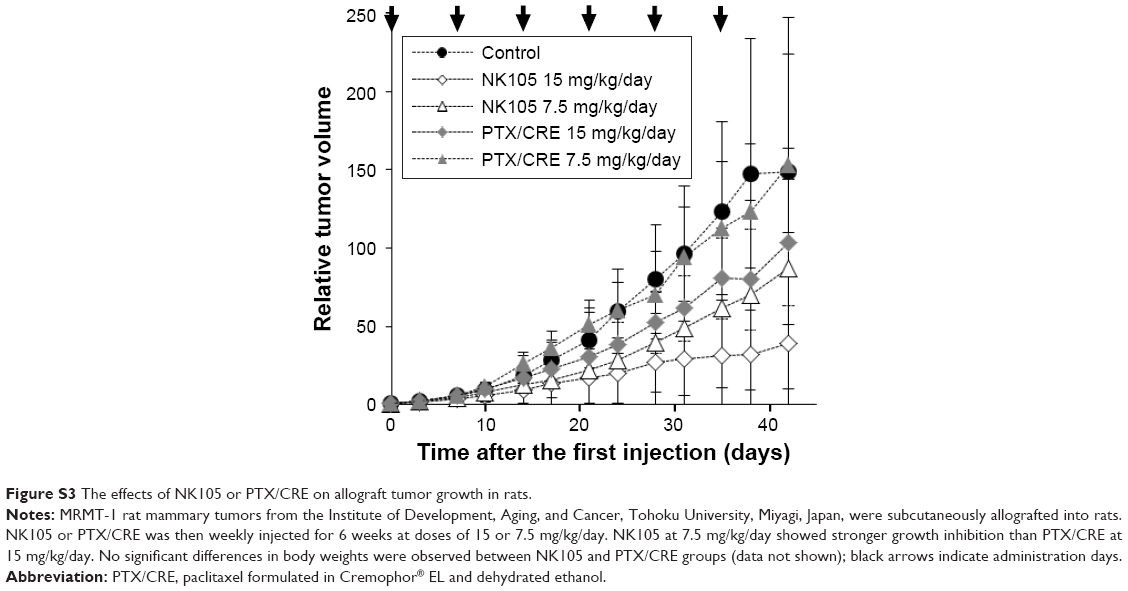 | Figure S3 The effects of NK105 or PTX/CRE on allograft tumor growth in rats. |
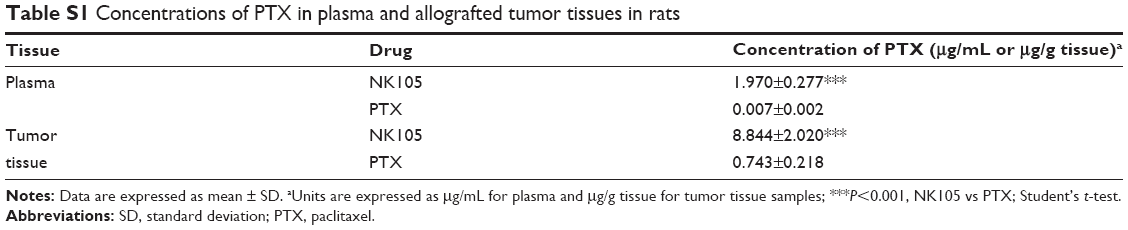 | Table S1 Concentrations of PTX in plasma and allografted tumor tissues in rats |
 © 2017 The Author(s). This work is published and licensed by Dove Medical Press Limited. The full terms of this license are available at https://www.dovepress.com/terms.php and incorporate the Creative Commons Attribution - Non Commercial (unported, v3.0) License.
By accessing the work you hereby accept the Terms. Non-commercial uses of the work are permitted without any further permission from Dove Medical Press Limited, provided the work is properly attributed. For permission for commercial use of this work, please see paragraphs 4.2 and 5 of our Terms.
© 2017 The Author(s). This work is published and licensed by Dove Medical Press Limited. The full terms of this license are available at https://www.dovepress.com/terms.php and incorporate the Creative Commons Attribution - Non Commercial (unported, v3.0) License.
By accessing the work you hereby accept the Terms. Non-commercial uses of the work are permitted without any further permission from Dove Medical Press Limited, provided the work is properly attributed. For permission for commercial use of this work, please see paragraphs 4.2 and 5 of our Terms.