")
Back to Journals » International Journal of Chronic Obstructive Pulmonary Disease » Volume 11 » Issue 1
An in silico analysis of oxygen uptake of a mild COPD patient during rest and exercise using a portable oxygen concentrator
Authors Katz I , Pichelin M, Montesantos S, Kang M, Sapoval B, Zhu K , Thevenin C, McCoy R, Martin A, Caillibotte G
Received 10 May 2016
Accepted for publication 6 June 2016
Published 29 September 2016 Volume 2016:11(1) Pages 2427—2434
DOI https://doi.org/10.2147/COPD.S112473
Checked for plagiarism Yes
Review by Single anonymous peer review
Peer reviewer comments 2
Editor who approved publication: Dr Richard Russell
Ira Katz,1,2 Marine Pichelin,1 Spyridon Montesantos,1 Min-Yeong Kang,3 Bernard Sapoval,3,4 Kaixian Zhu,5 Charles-Philippe Thevenin,5 Robert McCoy,6 Andrew R Martin,7 Georges Caillibotte1
1Medical R&D, Air Liquide Santé International, Centre de Recherche Paris-Saclay, Les Loges-en-Josas, France; 2Department of Mechanical Engineering, Lafayette College, Easton, PA, USA; 3Physique de la Matière Condensée, CNRS, Ecole Polytechnique, Palaiseau, 4Centre de Mathématiques et de leurs Applications, CNRS, UniverSud, Cachan, 5Centre Explor!, Air Liquide Healthcare, Gentilly, France; 6Valley Inspired Products, Inc, Apple Valley, MN, USA; 7Department of Mechanical Engineering, University of Alberta, Edmonton, AB, Canada
Abstract: Oxygen treatment based on intermittent-flow devices with pulse delivery modes available from portable oxygen concentrators (POCs) depends on the characteristics of the delivered pulse such as volume, pulse width (the time of the pulse to be delivered), and pulse delay (the time for the pulse to be initiated from the start of inhalation) as well as a patient’s breathing characteristics, disease state, and respiratory morphology. This article presents a physiological-based analysis of the performance, in terms of blood oxygenation, of a commercial POC at different settings using an in silico model of a COPD patient at rest and during exercise. The analysis encompasses experimental measurements of pulse volume, width, and time delay of the POC at three different settings and two breathing rates related to rest and exercise. These experimental data of device performance are inputs to a physiological-based model of oxygen uptake that takes into account the real dynamic nature of gas exchange to illustrate how device- and patient-specific factors can affect patient oxygenation. This type of physiological analysis that considers the true effectiveness of oxygen transfer to the blood, as opposed to delivery to the nose (or mouth), can be instructive in applying therapies and designing new devices.
Keywords: efficiency, respiratory physiology, respiratory disease, pulsed delivery
Introduction
A recent review1 of home-based long-term oxygen treatment makes several pertinent points regarding the proper selection and use of intermittent-flow devices such as pulse delivery modes available from portable oxygen concentrators (POCs). Intermittent-flow devices, introduced in the 1980s, addressed the need to improve the efficiency of oxygen delivery by providing flows only when the patient was inhaling, thereby eliminating the supply, and therefore the waste, of gas during exhalation. POCs depend on these efficiency gains to reduce size and extend operating times to achieve ambulatory systems that are patient friendly, thereby improving adherence. However, these devices have also created confusion related to oxygen delivery, prescriptions, device selection, understanding patient versus product capabilities, and reimbursement for long-term oxygen treatment. In particular, health care professionals and patients alike do not have the theoretical or practical tools to compare intermittent-flow devices, commonly characterized by the pulse bolus sized in milliliters of oxygen, with the better understood continuous-flow administration of supplemental oxygen, prescribed in liters per minute. In fact, the equivalence of intermittent-flow delivery to continuous-flow delivery is dependent on a number of variables, yet when one or more of these variables change, the equivalence of an intermittent-flow delivery method to continuous-flow delivery cannot be achieved. Furthermore, the timing of the oxygen pulse is also a key design feature and setting, as the pulses can be administered at a fixed frequency independent of the patient’s breathing or triggered, usually based on a negative pressure threshold that is fixed by the manufacturer or set by the user. Thus, McCoy1 shows that the shape of the oxygen flow curve, as the dose is delivered, may also impact patient comfort and adherence, and we would add, also potentially, the level of oxygenation.
Recognizing that oxygenation using a POC with intermittent-flow setting depends on the characteristics of the delivered pulse such as volume, pulse width (the time of the pulse to be delivered), and pulse delay (the time for the pulse to be initiated from the start of inhalation) as well as on a patient’s breathing characteristics, disease state, and respiratory morphology, McCoy1 shows that there is a lack of research on new home oxygen therapies to ensure that the patient is provided adequate oxygenation at all activity levels.
In appreciation of this need, we have performed a physiological-based analysis of the performance, in terms of blood oxygenation, of a popular commercial POC at different settings using an in silico model of a COPD patient at rest and during exercise. This analysis encompasses experimental measurements of pulse volume, width, and time delay of the POC at three different settings and two breathing rates related to rest and exercise. These experimental data of device performance are inputs to a physiological-based model of oxygen uptake2 that takes into account the real dynamic nature of gas exchange to illustrate how device- and patient-specific factors can affect patient oxygenation. The COPD model used represents a relatively mild case of the disease that is normoxic at rest. The specific aim is to illustrate and quantify the complex interaction of the medical device and patient functional parameters during oxygen uptake to give guidance on making POC therapy more effective.
Methods
POC pulse characterization experiments
Measurements of pulse volume (mL of oxygen), pulse width (ms), and pulse delay (ms) of a POC shown in Figure 1 (Eclipse 5; Caire Inc., Ball Ground, GA, USA) are performed using a test system designed specifically to evaluate intermittent-flow devices (Series 1130, O2 Conserver Testing System; Hans Rudolph Inc., Shawnee, KS, USA). The POC was connected to the test system through the standard 2.1 m of cannula tubing. The test system trigger was set to 2 cm H2O. The POC had nine (1–9) possible pulse bolus volume settings and three rise time options – fast, medium, and slow for delivery of the specified 90% oxygen. The low settings nominally represent the equivalent continuous flow: for setting 1, the pulse volume is specified as 16 mL provided during an inspiration of 1 second. Thus, nominally the pulsed delivery relative to the equivalent continuous delivery is 0.016 L × 60 s/min =0.96≈1 L/min. Figure 2 shows examples of flow versus time pulses for setting 1, indicating two different rise times with the pulse width and time delay. The pulse volume can be found by integrating the flow versus time curve. Tests were performed at settings 1, 5, and 9 (specified pulse volumes of 16 mL, 80 mL, and 192 mL, respectively) at the fast and medium rise times and two different breathing conditions (described later). Data were collected for ten successive pulses in each condition/setting.
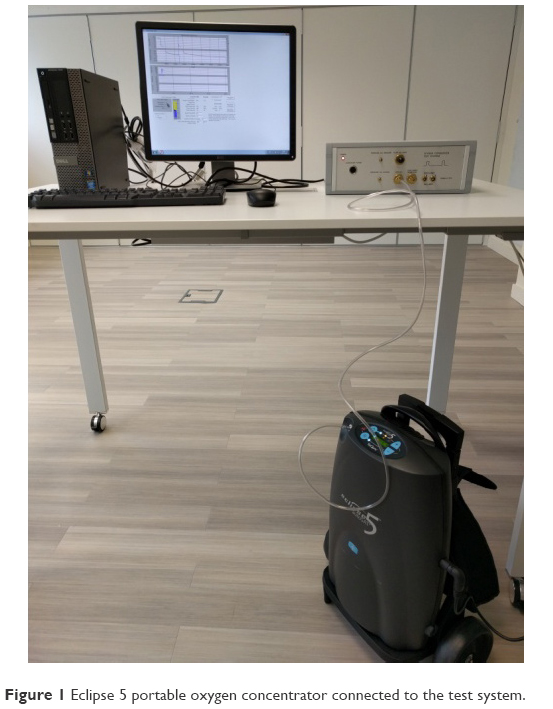 | Figure 1 Eclipse 5 portable oxygen concentrator connected to the test system. |
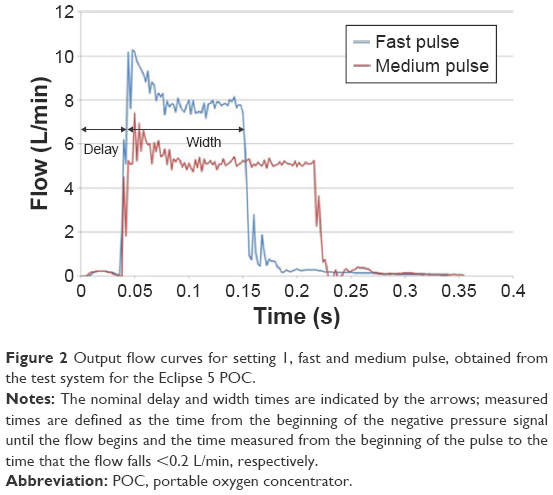 | Figure 2 Output flow curves for setting 1, fast and medium pulse, obtained from the test system for the Eclipse 5 POC. |
Gas uptake model
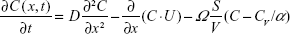
An oxygen uptake model developed by Kang et al2 solves a system of partial differential equations for 1D convection along the airway and diffusion and permeation across the peripheral alveolar surface to the blood within a realistic acinus morphology. The two key equations that are the basis of the model are as follows:
|
|
|
|
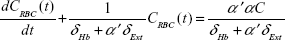
Here, C is the concentration of oxygen at a position x in the acinus airway at time t, D is the diffusion coefficient of oxygen in air, U is gas convection velocity in the airway, Ω is the oxygen integrative permeability of all the elements between the gas phase and venous blood, α is the Ostwald partition ratio, CV is the oxygen concentration in the venous blood, CRBC is the oxygen concentration in the red blood cells, δHb is a characteristic time for oxygen trapping by hemoglobin molecules, α′ is the partition ratio of oxygen concentration between plasma and red blood cells, and δExt is the characteristic time for oxygen diffusion from the alveolar space to a red blood cell surface. Also of fundamental importance to this work is a calculation of the arrival time of inhaled gas to the acinus that is a function of the trachea–bronchial dead volume and the inhalation flow rate. The system of equations is solved via time integration to provide the instantaneous oxygen flux from the gas phase to the blood and all of the other functional parameters over time. Of interest here is the total oxygen flux integrated over a single breath.
The model was validated by comparing in silico results to functional data for healthy lungs at rest and during exercise found in the literature.3 The general approach of the model allows many applications that have included a mapping of oxygen uptake over a wide range of ventilation and perfusion combinations and to illustrate the influence of altitude. Furthermore, the model (using the same equations as for oxygen) was able to predict the transport and trapping of carbon monoxide and nitric oxide used in single-breath lung function testing consistent with experiments. While the complete mathematical description of the gas uptake model is beyond the scope of this article, the key point to recognize is its ability to illustrate the importance of time, that is, ventilation and perfusion dynamics, in the process of oxygen capture. Thus, the model can include the effect of the arrival time of the enriched oxygen pulse from the POC to the acinus region in the oxygen capture process. The form of the pulse itself is simplified to be a square wave in the model and added to the inhalation flow. The details of this model are beyond the scope of this article but can be found in the cited reference.2
COPD model
Input parameters to the in silico oxygen uptake model for normal, healthy individuals at rest are taken from Kang et al2 (Table 1). These parameters have been adjusted to complete a normal, healthy model for moderate exercise, where moderate exercise is taken to be walking upstairs, 4.7 metabolic equivalents to rest.4 The COPD parameters at rest and exercise were taken from the study reported by Agusti et al5 (Table 1). In that study, eight patients (all male, 62±1 years) were confirmed to have COPD using standard clinical criteria and with previous functional confirmation of nonreversible chronic airflow limitation (FEV1 1.15±0.12 L; 36%±3% predicted). None of them had clinical evidence of overt right heart failure. Type B COPD was present in five patients, whereas the three remaining patients had predominantly type A COPD. Type A patients are characterized by the presence of anatomical emphysema or an increased total lung capacity (TLC), while type B patients are characterized by evidence of chronic inflammation or smaller TLC.6 Minute ventilation and respiratory rate were recorded minute by minute using a calibrated Wright spirometer. Low dead space, low resistance, and nonrebreathing valves were used to collect the expired gas through a heated-mixing box, at rest (no 1,500; Hans Rudolph Inc.) or during exercise (E Jaeger, Wurzburg, Germany) to measure oxygen uptake. Tidal volume is calculated by dividing the minute ventilation by the breathing frequency. Functional residual capacity (FRC) is 40% of TLC for normal healthy subjects and 50% for COPD subjects.7 TLC for COPD is based on data from Wagner et al.8 The inhalation time is obtained from the breathing frequency by assuming an inhalation/exhalation ratio of 0.5 at rest and 1 during exercise. Based on these morphological, ventilatory, and cardiac output parameters, the model, that is, the inputs to the oxygen uptake model, a COPD model has been defined.
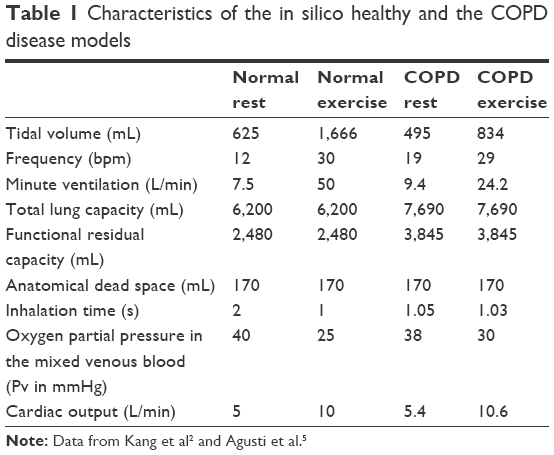 | Table 1 Characteristics of the in silico healthy and the COPD disease models |
Results
Pulse characterization
The results of the pulse characterization experiments, performed at rest (19 bpm) and during exercise (29 bpm) with the breathing frequencies for the COPD model, are given in Table 2. At rest, there is no degradation at settings 1 and 5 of the pulse volume as per the manufacturer’s nominal specification9 of 16 mL and 80 mL, respectively. However, for setting 9, the specified pulse volume is 192 mL, which was not achieved for the breathing patterns tested. For exercise, settings 1 and 5 again meet the specifications, while for setting 9, the pulse volume is only 54% of that specified. In terms of rise time options, there were no differences in pulse volume between medium and fast rise time under all of the conditions tested. For all the tests, the 90% specified oxygen concentration was met.
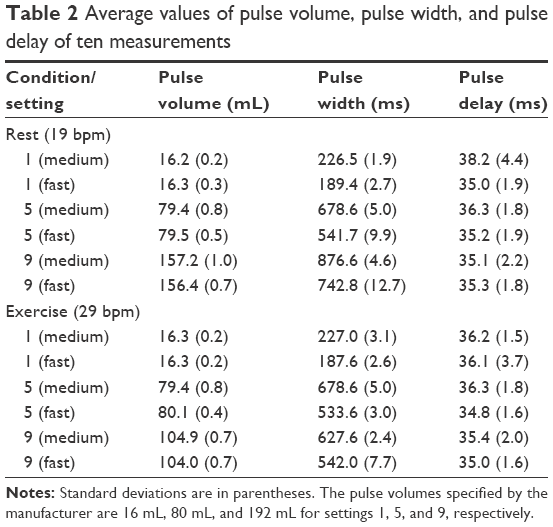 | Table 2 Average values of pulse volume, pulse width, and pulse delay of ten measurements |
Oxygenation
The oxygenation results obtained using the in silico oxygen uptake model are given in Table 3. The first column of Condition/setting defines the set of simulation input parameters taken from Tables 1 and 2 that were used to obtain the uptake results. Column 2 provides the delivered dose volume of 90% oxygen from the POC. This is not applicable for the two baseline cases (normal for a typical adult male and a representative COPD patient) where there is no delivered dose. For continuous oxygen treatment, the delivered dose volume from the POC for 1 L/min, 5 L/min, or 9 L/min is simply 1,000 mL/min, 5,000 mL/min, or 9,000 mL/min. Pulsed delivery per minute is calculated from the pulse volume delivered by the POC per breath given in Table 1 multiplied by the breathing frequency given in Table 2. Columns 3 and 4 are oxygen uptake (mL/min) and the arterial partial pressure (mmHg), respectively, which are outputs from the model. The uptake here is the time average because the instantaneous rate is variable and only occurs during inhalation. Derivative results are presented in columns 5 and 6. The uptake over a single breath (mL) is obtained by multiplying column 3 by the breathing frequency. Another output of the model is the percentage of saturation as calculated using the oxygen disassociation curve6 with the input of the calculated arterial pressure. Columns 7 and 8 are measures of the effectiveness and efficiency of the oxygen treatment, respectively. The percentage of the normal uptake gives an indication of the relative severity of the COPD model and the extent that the therapy can return the COPD patient to normal. The efficiency (the increased uptake divided by the delivered dose) is a measure of the effectiveness of a therapy to provide longer time for ambulatory activity and is shown in Figure 3. In more precise terms, it is a measure of how much of the supplementary oxygen is actually used (uptake to blood) as opposed to the delivery to the nose (or mouth).
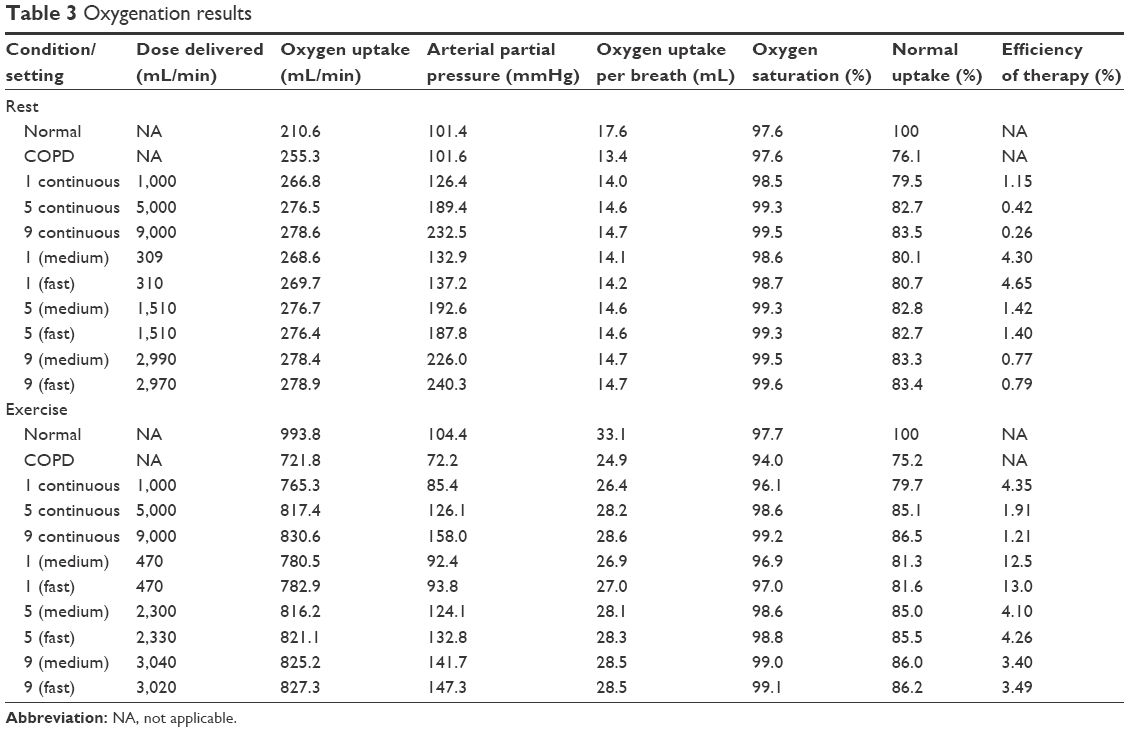 | Table 3 Oxygenation results |
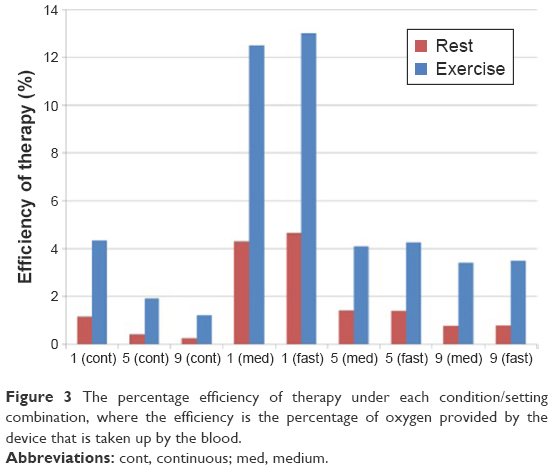 | Figure 3 The percentage efficiency of therapy under each condition/setting combination, where the efficiency is the percentage of oxygen provided by the device that is taken up by the blood. |
Discussion
This study follows the fundamental understanding that exercise is critical to reduce patient’s morbidity10–15 and that portable oxygen may allow patients the potential to increase their exercise capacity. However, clinical studies that tested this concept have not been definitive. For example, Casaburi et al16 followed 22 COPD patients for 6 months, with a control group and one using 3.6 lb. cylinders on cart to provide the portable oxygen. Activity monitoring revealed low activity levels prior to randomization and no significant increase over time in either group. In another study, POCs alone did not supply the same levels of oxygenation as the combination of fixed and portable systems.17 Furthermore, as described by McCoy1 and others,18 it is not clear how the wide variety of models and setting available on modern POCs affect patient oxygenation and adherence. Thus, we believed that a fundamental study of the interaction of patient physiology with the output of a real POC could provide guidance for future developments in device design and patient management.
Performance of the POC
The performance of the Eclipse 5 POC as provided in Table 1 indicates that only at setting 9, is there a decrease in the pulse volume compared to the equivalent continuous dose and the nominal pulse volume quoted in the device specifications.9 However, it should be noted that the User’s Manual clearly states that under certain conditions the output volumes can be reduced. For example, when the Eclipse 5 is connected to the DC supply in a vehicle a maximum of only 3.0 L/min of continuous flow is available. Furthermore, it is stated that Bolus (or pulse) volume decreases as the breath rate exceeds the published range (15–40 bpm based on the setting) and that the pulse dose setting is not necessarily equal to the continuous flow rate in L/min. Finally regarding the Eclipse 5 specifically, note that it can be classified as ambulatory (comparable to rolling carry-on luggage, 8.2 kg, 45.5×29.0×18.0 cm3) but not portable in the sense of fitting into a shoulder bag or smaller.
Oxygen uptake
Oxygen uptake results are provided in Table 2 for a normal (healthy) case as well as for a single COPD model at rest and during light exercise, similar to walking up stairs. These comparative in silico results between normal and COPD, at rest and during exercise, are similar to previous in vivo results.19 The oxygen uptake of a healthy adult gives a control comparison to the COPD model. At rest, arterial pressure and saturation are maintained, but at the cost of higher breathing frequency. The overall uptake is actually greater (more energy is needed for breathing) but the uptake per breath is reduced (76.1% of normal). During exercise, the diseased lung is no longer able to maintain oxygenation so the uptake in mL/min and per breath (75.2% of normal) are less than normal and partial desaturation occurs (94.0% versus 97.7% normal). However, this COPD model clearly represents a mild case of the disease. The application of supplementary oxygen during exercise for normoxic patients at rest has been suggested because oxygen reduces dyspnea by a reduction in minute ventilation during exercise and would have a beneficial effect on oxidative metabolism in peripheral muscle, leading to an increase in exercise capacity.20 On the other hand, more recent clinical results recommend that supplemental oxygen during exercise for these patients is not indicated.21 This limitation in our study model is discussed later.
Notably, at rest, the lack of oxygenation is not serious unless the patient’s respiratory muscles would become fatigued. Thus, the addition of oxygen therapy results in very little increased uptake, although the percentage of normal uptake per breath is increased, indicating that the breathing frequency might be reduced in time. Continuous therapy is not efficient; the great majority of the oxygen provided is never used by the body. The pulsed therapies improve efficiency only slightly for the patient at rest. During exercise, the efficiency of the therapy increases, especially the pulsed delivery relative to the continuous. However, the therapy is still relatively inefficient suggesting that devices could be greatly optimized by simply providing a small and fast pulse without all of the optional settings. For example, the relatively efficient pulse setting of 1 medium could be improved by 28% (from 12.5% to 16%) if the 35 ms pulse delay were eliminated. This result implies that the timing of the pulse, in fact its arrival time at the acinus, affects the oxygen uptake and perhaps that a very small, low weight device that provided a single small volume of oxygen without a delay could be more effective for many patients.
These results show that while eliminating oxygen delivery during exhalation, relatively improves uptake efficiency, the continued overall inefficiency of the pulsed therapies is an indication of the importance of the particular respiratory physiology of the patient to obtain truly efficient uptake. The role of physiology can be explored in greater depth by considering arrival time. The high concentration pulse shown in Figure 2 is assumed to mix with the ambient inhalation gas stream such that the ventilation is unchanged but oxygen concentration is elevated for a fixed period during the breath. The arrival of the fresh gas stream, and then the high concentration pulse if there is a delay, to the acinus is a factor controlling the local oxygen uptake. The arrival time is dependent on the complete morphological structure upstream from the acinus and the ventilator parameters.
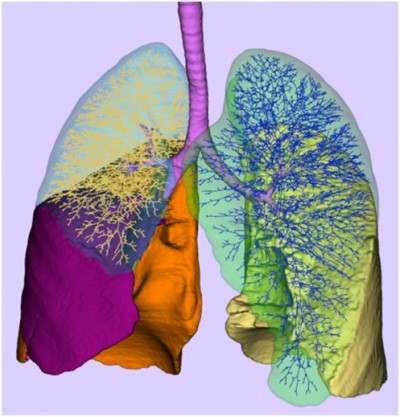
To illustrate the role of lung morphology in the oxygen uptake, the algorithm for the generation of an individualized 3D deterministic model of the conducting part of the human tracheo-bronchial tree developed by Montesantos et al can be considered.22 Distinct initial conditions were obtained from the high-resolution computed tomography images of seven healthy volunteers from a previous study. The algorithm developed is fractal in nature and is implemented as a self-similar space subdivision procedure. The expansion process utilizes physiologically realistic relationships and thresholds to produce an anatomically consistent human airway tree that leads to thousands of separate paths unique to each acinus (Figure 4). For two subjects (H01, FRC =2,360 mL, anatomical dead space =123 mL, 15,952 acini; H03, FRC =3,170 mL, anatomical dead space =138 mL, 28,255 acini), the arrival time to each acinus was calculated for the same ventilation maneuver (tidal volume of 600 mL, inhalation time of 2 seconds, and for an inspiratory flow rate of 18 L/min). The frequency distribution of arrival times is plotted in Figure 5. It is important to note the range of arrival times present for each of these healthy individuals (in a sense intrasubject variability) and the intersubject variability between them, owing to the volume of the physiological dead space of the tracheo-bronchial region along different pathways supplying the acini. Note that with the single compartment model used herein, the single arrival times for the model cases of normal at rest, normal during exercise, COPD at rest, and COPD during exercise are 0.7 second, 0.21 second, 0.42 second, and 0.31 second, respectively. Also of importance is the heterogeneous nature of the gas uptake that can result from disease23 deriving from obstruction, ventilation heterogeneity, and alveolar dead space.
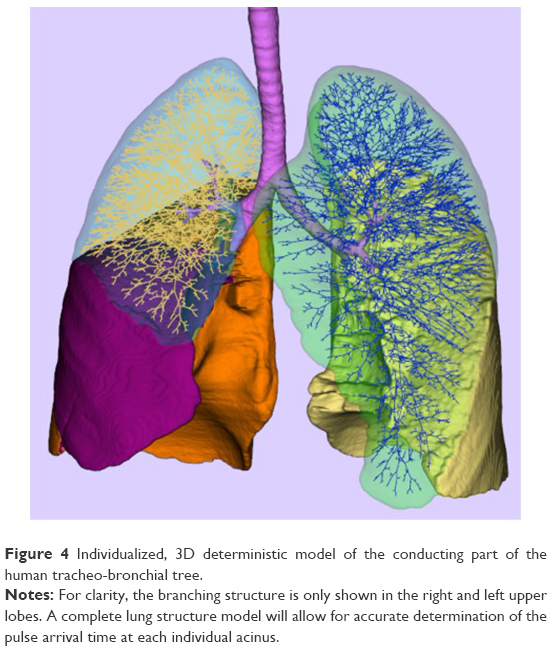 | Figure 4 Individualized, 3D deterministic model of the conducting part of the human tracheo-bronchial tree. |
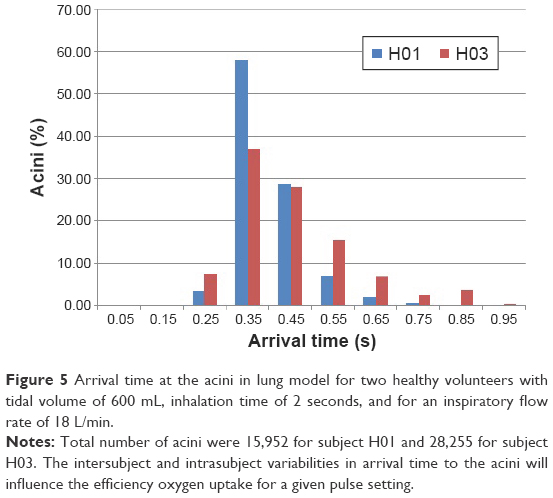 | Figure 5 Arrival time at the acini in lung model for two healthy volunteers with tidal volume of 600 mL, inhalation time of 2 seconds, and for an inspiratory flow rate of 18 L/min. |
Limitations
There are many important limitations to this study. The single COPD model is not exhaustive but illustrative. Clearly, the variability of COPD will have significant effects on oxygen uptake, both in terms of severity and type.24–26 The interaction of local ventilation and perfusion in the lung for COPD patients is very complex.8 Perhaps, the key limitation in the COPD model is the single compartment with one arrival time for the whole lung. Indeed, it is interesting that with a single compartment lung model, it was not possible to obtain a severe COPD case using the measured ventilatory parameters from the literature that were used.5 This suggests that there is an important role of heterogeneous or regional lung deterioration that limits oxygen uptake.27 The next step in our research is to integrate the acinar oxygen uptake model with the lung morphology model to calculate the oxygen uptake for the thousands of acini individually. With this approach, regional lung morphology and localized disease can be investigated. In spite of the mild case considered, there was desaturation during exercise, and the efficiency of the uptake of the supplementary oxygen was relatively poor, although the need to consider more severe cases is clear.
The model can be considered to apply to the situation at the onset of therapy because no physiological changes with therapy are included in the model (eg, changes in cardiac output and breathing frequency that are expected benefits of the therapy).28 In terms of assessing the device itself, the model does not account for the metabolic load of moving the POC. As noted, the Eclipse 5 can be called ambulatory. Thus, it is also evident that there is a need to consider many of the other smaller and more portable models where oxygen outputs would be less stable.
Palwai et al29 have shown that clinical performance of devices can often be quite different than specified performance. There are a multitude of device and patient characteristics that could be considered. The testing of the device and the in silico model took no consideration for the efficiency of patient interface that can affect triggering as well as comfort and adherence. The fact that there was a direct connection of the POC to the testing device is different than loose fitting nasal cannulae that often occurs with patients is but one aspect of real patient–device interaction that may affect oxygenation.
Conclusion
The goal of POCs is to allow patients to increase their activity. But as noted by clinical researchers, “POC recipients should be appropriately tested during all activities of daily living to ensure adequate oxygenation. The health care provider should provide information and help direct the preferences and lifestyle”.30 This issue is understood by POC manufacturers, at least in the sense that they provide warnings in the user’s manual that setting must be determined for each patient at different levels of activity. We have demonstrated in this study the physiological complexity of oxygen uptake on the use of a POC, to underline the need for robust and repeated (as the patient’s condition could change over time) testing of a particular patient, at a particular level of exertion, with a particular device, at a particular setting. We have also shown that the poor efficiency of the POC in terms of oxygen uptake, at least for this mild case of COPD during exercise, implies much smaller and lighter devices that have much lower oxygen-producing capability could be more effective. Finally, this type of physiological analysis that considers the true effectiveness, oxygen transfer to the blood as opposed to delivery to the nose (or mouth), can be instructive in applying therapies and designing new devices.
Acknowledgment
This study was funded by Air Liquide.
Disclosure
The authors report no conflicts of interest in this work.
References
McCoy RW. Options for home oxygen therapy equipment: storage and metering of oxygen in the home. Respir Care. 2013;58(1):65–85. | ||
Kang M-Y, Katz I, Sapoval B. A new approach to the dynamics of oxygen capture by the human lung. Respir Physiol Neurobiol. 2015;205:109–119. | ||
Astrand P-O. Textbook of Work Physiology: Physiological Bases of Exercise. Human Kinetics; 2003. | ||
Jette M, Sidney K, Blümchen G. Metabolic equivalents (METS) in exercise testing, exercise prescription, and evaluation of functional capacity. Clin Cardiol. 1990;13(8):555–565. | ||
Agusti AG, Barbera JA, Guitart J, Wagner PD, Guitart R, Rodriguez-Roisin R. Hypoxic pulmonary vasoconstriction and gas exchange during exercise in chronic obstructive pulmonary disease. Chest. 1990;97(2):268–275. | ||
Murphy EM, Bone RC, Hiller FC, Diederich DA, Ruth WE. The oxyhemoglobin dissociation curve in type A and type B COPD. Lung. 1976;154(1):299–305. | ||
Come CE, Diaz AA, Curran-Everett D, et al; COPDGene Investigators. Characterizing functional lung heterogeneity in COPD using reference equations for CT scan-measured lobar volumes. Chest. 2013;143(6):1607–1617. | ||
Wagner PD, Dantzker DR, Dueck R, Clausen JL, West JB. Ventilation-perfusion inequality in chronic obstructive pulmonary disease. J Clin Invest. 1977;59(2):203–216. | ||
Claire, Inc [webpage on the Internet]. Eclipse with AutoSat: Users Manual. Available from: https://www.vitalitymedical.com/pdf/eclipse-5-user-manual.pdf. Accessed March 23, 2016. | ||
Esteban C, Arostegui I, Aburto M, et al. Influence of changes in physical activity on frequency of hospitalization in chronic obstructive pulmonary disease. Respirology. 2014;19(3):330–338. | ||
Garcia-Aymerich J, Lange P, Benet M, Schnohr P, Antó JM. Regular physical activity reduces hospital admission and mortality in chronic obstructive pulmonary disease: a population based cohort study. Thorax. 2006;61(9):772–778. | ||
Moy ML, Teylan M, Weston NA, Gagnon DR, Garshick E. Daily step count predicts acute exacerbations in a US cohort with COPD. PLoS One. 2013;8(4):e60400. | ||
Moy ML, Teylan M, Danilack VA, Gagnon DR, Garshick E. An index of daily step count and systemic inflammation predicts clinical outcomes in chronic obstructive pulmonary disease. Ann Am Thorac Soc. 2014;11(2):149–157. | ||
Moy ML, Teylan M, Weston NA, Gagnon DR, Danilack VA, Garshick E. Daily step count is associated with plasma C-reactive protein and IL-6 in a US cohort with COPD. Chest. 2014;145(3):542–550. | ||
Waschki B, Kirsten A, Holz O, et al. Physical activity is the strongest predictor of all-cause mortality in patients with COPD: a prospective cohort study. Chest. 2011;140(2):331–342. | ||
Casaburi R, Porszasz J, Hecht A, et al; COPD Clinical Research Network. Influence of lightweight ambulatory oxygen on oxygen use and activity patterns of COPD patients receiving long-term oxygen therapy. COPD. 2012;9(1):3–11. | ||
Yáñez AM, Prat JP, Álvarez-Sala JL, et al. Oxygenation with a single portable pulse-dose oxygen-conserving device and combined stationary and portable oxygen delivery devices in subjects with COPD. Respir Care. 2015;60(3):382–387. | ||
Chatburn RL, Williams TJ. Performance comparison of 4 portable oxygen concentrators. Respir Care. 2010;55(4):433–442. | ||
Häussermann S, Schulze A, Katz IM, et al. Effects of a helium/oxygen mixture on individuals’ lung function and metabolic cost during submaximal exercise for participants with obstructive lung diseases. Int J Chron Obstruct Pulmon Dis. 2015;10:1987–1997. | ||
Steiner MC, Morgan MD. Enhancing physical performance in chronic obstructive pulmonary disease. Thorax. 2001;56(1):73–77. | ||
McDonald CF, Whyte K, Jenkins S, Serginson J, Frith P. Clinical practice guideline on adult domiciliary oxygen therapy: executive summary from the Thoracic Society of Australia and New Zealand. Respirology. 2016;21(1):76–78. | ||
Montesantos S, Katz I, Pichelin M, et al. A realistic individualized 3D model of the conductive and pulmonary regions of the human lung. J Aerosol Med Pulm Drug Deliv. 2015;28(3):A37–A38. | ||
Johansen T, Winkler T, Kelly VJ, et al. A method for mapping regional oxygen and CO2 transfer in the lung. Respir Physiol Neurobiol. 2016;222:29–47. | ||
Barnes PJ. Asthma-COPD overlap. Chest. 2016;149(1):7–8. | ||
Pinto LM, Alghamdi M, Benedetti A, Zaihra T, Landry T, Bourbeau J. Derivation and validation of clinical phenotypes for COPD: a systematic review. Respir Res. 2015;16(1):50. | ||
Villar AB, Sanmartín AP [webpage on the Internet]. Chronic obstructive pulmonary disease with eosinophilia, an emerging phenotype? Arch Bronconeumol Engl Ed. 2016. Available from: http://www.sciencedirect.com/science/article/pii/S1579212916000379. Accessed March 18, 2016. | ||
Russi EW, Bloch KE, Weder W. Functional and morphological heterogeneity of emphysema and its implication for selection of patients for lung volume reduction surgery. Eur Respir J. 1999;14(1):230–236. | ||
Bateman NT, Leach RM. ABC of oxygen: acute oxygen therapy. Br Med J. 1998;317(7161):798–801. | ||
Palwai A, Skowronski M, Coreno A, Drummond C, McFadden ER Jr. Critical comparisons of the clinical performance of oxygen-conserving devices. Am J Respir Crit Care Med. 2010;181(10):1061–1071. | ||
LeBlanc CJ, Lavallée LG, King JA, Taylor-Sussex RE, Woolnough A, McKim DA. A comparative study of three portable oxygen concentrators during a 6–minute walk test in patients with chronic lung disease. Respir Care. 2013;58(10):1598–1605. |
 © 2016 The Author(s). This work is published and licensed by Dove Medical Press Limited. The full terms of this license are available at https://www.dovepress.com/terms.php and incorporate the Creative Commons Attribution - Non Commercial (unported, v3.0) License.
By accessing the work you hereby accept the Terms. Non-commercial uses of the work are permitted without any further permission from Dove Medical Press Limited, provided the work is properly attributed. For permission for commercial use of this work, please see paragraphs 4.2 and 5 of our Terms.
© 2016 The Author(s). This work is published and licensed by Dove Medical Press Limited. The full terms of this license are available at https://www.dovepress.com/terms.php and incorporate the Creative Commons Attribution - Non Commercial (unported, v3.0) License.
By accessing the work you hereby accept the Terms. Non-commercial uses of the work are permitted without any further permission from Dove Medical Press Limited, provided the work is properly attributed. For permission for commercial use of this work, please see paragraphs 4.2 and 5 of our Terms.