")
Back to Journals » OncoTargets and Therapy » Volume 12
An immune-related gene pairs signature predicts overall survival in serous ovarian carcinoma
Authors Zhang L, Zhu P, Tong Y, Wang Y, Ma H, Xia X, Zhou Y, Zhang X, Gao F , Shu P
Received 3 January 2019
Accepted for publication 2 August 2019
Published 28 August 2019 Volume 2019:12 Pages 7005—7014
DOI https://doi.org/10.2147/OTT.S200191
Checked for plagiarism Yes
Review by Single anonymous peer review
Peer reviewer comments 3
Editor who approved publication: Dr Arseniy Yuzhalin
Liuyan Zhang,1,* Ping Zhu,2,* Yao Tong,3 Yuzhuo Wang,4 Haifen Ma,5 Xuefei Xia,6 Yu Zhou,6 Xingguo Zhang,6 Feng Gao,7,8 Peng Shu6
1Department of Obstetrics, Beilun People’s Hospital, Ningbo, People’s Republic of China; 2Department of Gynecology, CangZhou People’s Hospital, CangZhou, People’s Republic of China; 3Department of Molecular Biology and Genetics, College of Agriculture and Life Sciences, Cornell University, Ithaca, NY, USA; 4Department of Prenatal Diagnostic, CangZhou People’s Hospital, CangZhou, People’s Republic of China; 5Department of Pathology, Beilun People’s Hospital, Ningbo, People’s Republic of China; 6Department of Clinical Laboratory, Beilun People’s Hospital, Ningbo, People’s Republic of China; 7The Sixth Affiliated Hospital, Sun Yat-Sen University, Guangzhou, People’s Republic of China; 8Guangdong Institute of Gastroenterology, Guangdong Provincial Key Laboratory of Colorectal and Pelvic Floor Diseases, Supported by National Key Clinical Discipline, Guangzhou, People’s Republic of China
*These authors contributed equally to this work
Correspondence: Peng Shu
Department of Clinical Laboratory, Beilun People’s Hospital, Ningbo, People’s Republic of China
Email [email protected]
Feng Gao
The Sixth Affiliated Hospital, Sun Yat-Sen University, Guangzhou, People’s Republic of China
Email [email protected]
Background: Ovarian cancer has the highest death rate of all fatal gynecological cancers. Increasing evidence has depicted the correlation between serous ovarian carcinoma prognosis and immune signature. Therefore, the aim of this study is to develop a robust prognostic immune-related gene pairs (IRGPs) signature for estimating overall survival (OS) of HGSOC.
Methods: Gene expression profiling and clinical information of serous ovarian carcinoma patients were derived from three public data sets, divided into training and validation cohorts. Immune genes significantly associated with prognosis were selected.
Results: Among 1,534 immune genes, a 20 IRGPs signature was built which was significantly associated with OS in the training cohort (P=1.44×10⁻¹⁴,; hazard ratio [HR] =3.05 [2.26, 4.10]). In the validation datasets, the IRGPs signature significantly divided patients into high- vs low- risk groups considering their prognosis (P=4.30×10⁻³,; HR =1.48 [1.13, 1.95]) and was prognostic in multivariate analysis. Functional analysis showed that several biological processes, including EMT and TGF-β related pathways, enriched in the high-risk group. Macrophages M2 was significantly higher in the high-risk group compared with the low-risk group.
Conclusion: We successfully constructed a robust IRGPs signature with prognostic values for serous ovarian carcinoma, providing new insights into post-operational treatment strategies.
Keywords: serous ovarian carcinoma, prognosis, immune-related gene pairs
Introduction
Ovarian cancer is one of the most lethal cancers in women, with about 238,700 new cases diagnosed worldwide each year.1 About 70% of ovarian cancer is high-grade serous ovarian cancer (HGSOC).2 The overall five-year survival rate (46%) has not changed much over the past few decades.3 Most patients are usually diagnosed as late stage due to their inapparent symptoms and lack of highly specific biomarkers.4 Recently, despite advances in treatment, the prognosis for serous ovarian carcinoma remains grim, creating a major barrier to resistance to standard platinum chemotherapy. So far, the standard treatment is a combination of surgery and postoperative chemotherapy. However, the vast majority of patients develop resistance to chemotherapy within six months of surgery.5 Conventional clinical features, such as tumor grade, histopathological classification, debulking status, and CA-125 levels, do not provide an accurate prognosis prediction for serous ovarian carcinoma patients.6 Meanwhile, patients with the same clinical or pathological conditions tend to have different clinical manifestations. The intrinsic genetic heterogeneity of patients has the greatest effect on the clinical and molecular diversity of ovarian cancer.7
Recently, researchers have established numerous molecular subtyping of serous ovarian carcinoma patients based on gene expression profiles and have constructed prognostic multigene expression features that can divide patients into different risk groups.8–11 However, due to problems such as overfitting on small sample training data-sets and lack of enough verification datasets, none have been applied to daily clinical practice, and at the same time, these defects may reduce the efficiency and robustness of statistical conclusions. However, the diversity of data also poses great challenges for the effective use of large-scale gene expression data. Considering the technical bias and biological heterogeneity, it is difficult to standardize gene expression profiles produced by various platforms.12 Recently, a new method based on relative ranking of gene expression level to eliminate the shortcomings of gene expression data processing, such as data normalization and scaling, has been reported, and has achieved reliable results in various studies.13–15
There is growing evidence that the immune system plays a key role in the development and progression of cancer.16,17 For example, Webb and Darb-Esfahani team reported have separately looked at possible correlations between PD-L1 expression and serous ovarian carcinoma prognosis.18,19 Given their prognostic potential in serous ovarian carcinoma, the molecular characteristics of immune interactions should be studied in depth. In this study, immune genes significantly associated with prognosis were selected. Based on these genes, individualized prognostic signature was constructed and validated by integrating immune-related gene pairs (IRGPs) for serous ovarian carcinoma.
Methods
Ethical approval
The researchers were granted approval to conduct the research by Departmental Research Ethics Committee at the Beilun People’s Hospital, Ningbo, China. The study protocol was approved by the institutional review board of Beilun People’s Hospital. All the procedures were performed in accordance with the Declaration of Helsinki and relevant policies in China.
Sources of serous ovarian carcinoma patients
This was a retrospective study using public data for comprehensive analysis. A complete list of all selected gene expression profiles (GEP), relevant accession numbers and corresponding publications is given in Table S1. In total, three independent data-sets from different high-throughput platforms were used in this study including TCGA (n=490),9 Bonome (GSE26712, n=185),20 and Yoshihara (GSE32062, n=260).21 Gene expression data together with corresponding clinical information were accessed from Gene Expression Omnibus (GEO http://www.ncbi.nlm.nih.gov/geo/) and Firehose Broad GDAC portal (http://gdac.broadinstitute.org/, accessed on Aug 1, 2017). Totally, 935 samples were available for analysis.
Gene expression data processing
The original microarray data file (GSE26712 and GSE32062) was normalized using the robust multi-array average (RMA) method from the “affy” package.22 For each data set, the expression profile was converted from probe level to corresponding gene symbol based on each set of annotation files without further standardization; probe sets were selected on the basis of overall highest overall expression for each gene. For all data-sets, this study only selected patients with complete overall survival (OS) information. The other two data-sets (GSE26712 and GSE32062) were merged for meta-validation.
Construction of prognostic immune-related gene pairs (IRGPs) signature
The identification of prognostic IRGPs was performed as described previously.15 The TCGA cohort were used for discovery and training the model. To construct immune-related prognostic signature, we obtained 1,811 immune-related genes (IRGs) from the ImmPort database (https://immport.niaid.nih.gov)23 on 3/18/2018. A variety of immune-related genes were included including natural killer cell cytotoxicity, presentation pathways, cytokines, cytokine receptors, and antigen processing. We only kept IRGs measured on all the platforms involved in this study and with relatively high variation (determined by median absolute deviation >0.5).24 Each IRGP was computed by pairwise comparison the gene expression level in a specific sample or profile. More specifically, in a pairwise comparison, the output is 1 if the first element is larger than the later one and 0 for the different order. After removing IRGPs with a small variation and imbalanced distribution (MAD =0), the remaining IRGPs were left and selected as initial candidate IRGPs for prognosis prediction. From the initial candidate IRGPs, an IRGP index (IRGPI) was constructed using Lasso Cox proportional hazards regression with 10-fold cross validation (glmnet package, version: 2.0–18) and 20 gene pairs were used to define the final model. To stratify patients into low or high-risk groups, the optimal cut off of the IRGPI was determined using time-dependent receiver operating characteristic (ROC) curve analysis (survivalROC, version 1.0.3) at 5 years in the training cohort for overall survival.
Validation of the IRGPs signature
The IRGPI model was further evaluated in the meta-validation of serous ovarian carcinoma patients by the log-rank test. We then assessed the IRGPI based on other clinical factors in the univariate and multivariate cox proportional-hazards analysis.
Immune cells infiltration in bulk tumor GEPs
In order to study the enrichment of immune cells in different risk groups, we used CIBERSORT,25 a machine learning method for predicting immune cell infiltration of bulk tumor GEPs. CIBERSORT estimates enrichment of various immune cell types using support vector regression25 in bulk tumor GEPs. For each sample, CIBERSORT quantified the relative abundance of 22 types of infiltrating immune cells, including T cells, B cells macrophages, and natural killer cells, amongst others. Using monte carlo sampling, CIBERSORT calculates the p-value of the deconvolution for each sample to provide confidence in the estimation. The TCGA GEPs were uploaded to the online analytical platform CIBERSORT portal website (http://cibersort.stanford.edu/), using the default signature matrix at 1,000 permutations.
Gene ontology (GO) and gene set enrichment analysis (GSEA)
GO analysis was performed for the prognostic immune signature using gProfiler26 (https://biit.cs.ut.ee/gprofiler/). Gene set enrichment analysis27 was conducted using the Bioconductor package “fgsea” with 10,000 permutations. The log2 fold change between the gene expression profiles of high-and low-risk groups was taken. Gene sets from high- vs low- risk groups were compared. Biological processes involved in this study were downloaded from the Molecular Signature Database (MSigDB C2 and C5 databases, version 6) (http://www.broadinstitute.org/gsea/msigdb/collections.jsp). FDR-adjusted P<0.05 or nominal (NOM) P<0.05 was used to select statistically significant gene sets.
Statistical analysis
All the statistical tests were performed using R (version 3.4.3, www.r-project.org). Student’s t-tests were used to compare the differences among groups. Cumulative survival time was calculated using the Kaplan-Meier method and the differences in survival curves were analyzed using the log-rank test from “survival” package (version: 2.41.3). Hazard ratios were calculated using the “survcomp” package28 (version: 1.28.4). Univariate and multivariate analyses were conducted using the Cox proportional hazards regression model. For all tests, a p-value of less than 0.05 indicated a statistically significant difference. Statistical significance is shown as *P<0.05, **P<0.01, ***P<0.001.
Results
Prognostic IRGPs signature construction
The TCGA cohort (n=490) gene expression data was used as discovery cohort and genes with relatively high variation were kept as candidates, evaluated by median absolute deviation (MAD) >0.5. The filtered discovery dataset was subjected to construct the prognostic model by using 1,811 unique immune-related genes (IRGs), which were obtained from the ImmPort database (accessed on 3/18/2018), including 17 categories, and 398 IRGs were measured in the discovery set as well as on other platforms. From these 398 IRGs, 79,003 immune-related gene pairs (IRGPs) were established. After removing IRGPs with relatively small variation (MAD =0), 91 IRGPs were left and selected as initial candidate IRGPs. Then we defined IRGP index (IRGPI) using Lasso Cox proportional hazards regression on the training set and selected 20 IRGPs in the final risk scoring model. The IRGPI includes a panel of 40 unique IRGs and 27 of them are Antimicrobials and Cytokines related molecules (Table 1). We then used the IRGPI to calculate the risk score for each patient in the training group. The optimal cut-off of the IRGPI for dividing patients into the high- or low-immune risk groups was set at −0.074 using time-dependent ROC curve analysis (Figure 1). The IRGPI significantly stratified training set patients into low- and high-risk groups in terms of overall survival (OS). Our data suggested that the high-risk group exhibited a significantly poorer OS than the low-risk group (P=1.44×10⁻¹⁴; HR =3.05 [2.26, 4.10]) (Figure 2A and Table S2). To further explore the prognostic power of the IRGPI for other clinical factors, univariate and multivariate Cox proportional hazards regression analyses were applied to the TCGA cohort. Clinical features like age and tumor stage demonstrated a prognostic effect in the univariate Cox analysis. However, only the IRGPI signature remained an independent prognostic factor (Table 2) in the multivariate Cox analysis.
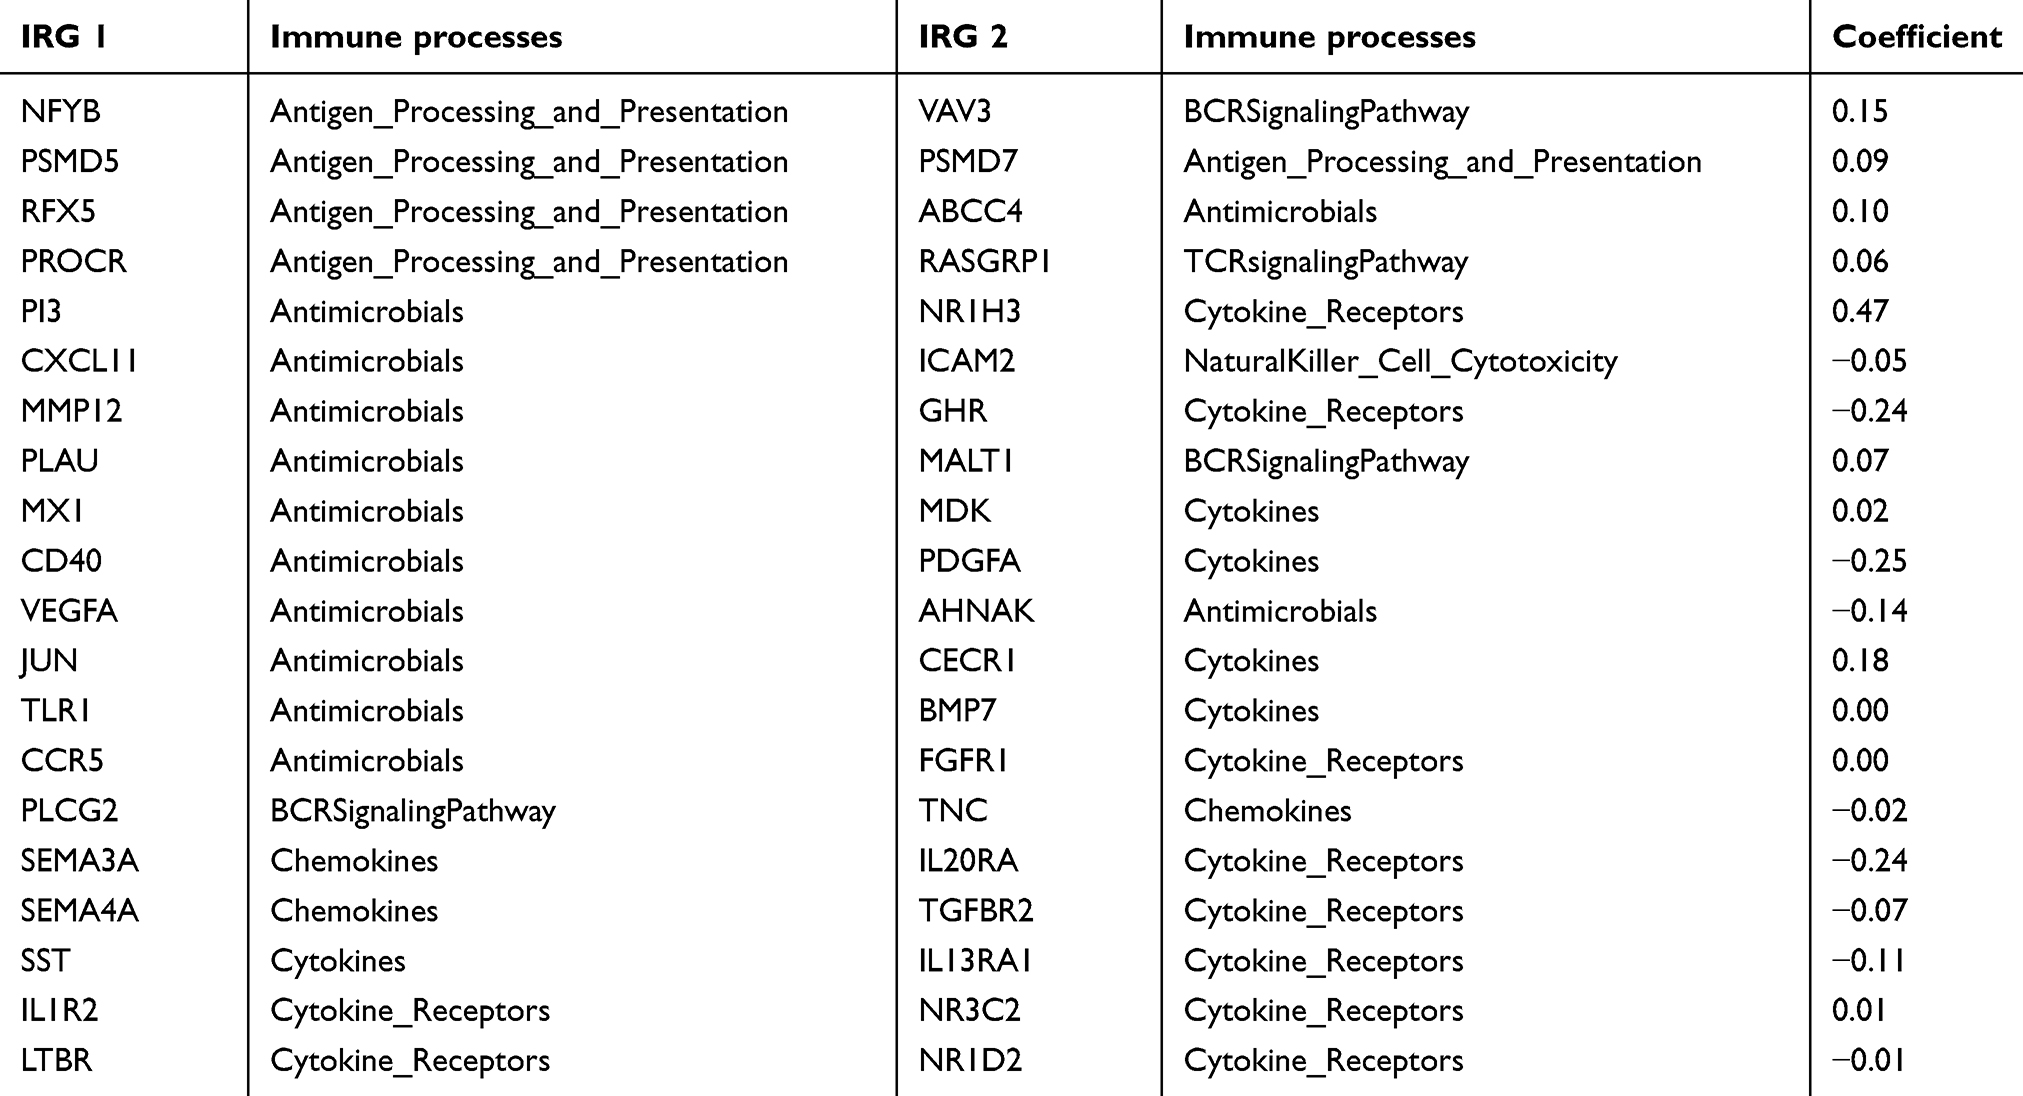 |
Table 1 Model information about IRGPI |
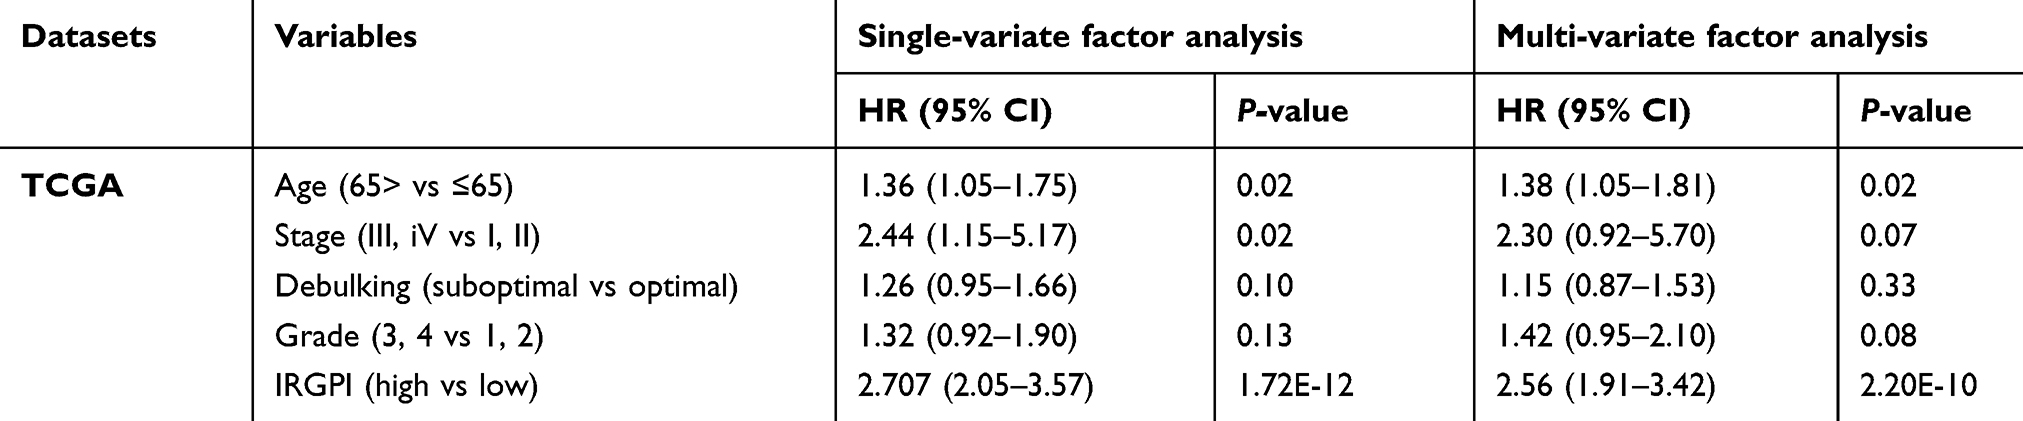 |
Table 2 Univariate and multivariate analyses of prognostic factors in validation cohort |
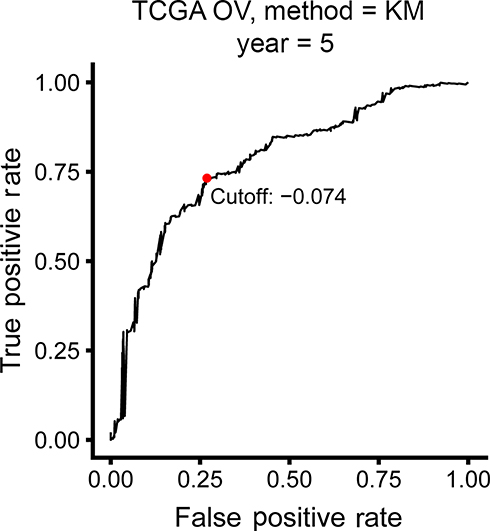 |
Figure 1 Time-dependent ROC curve for IRGPI in the training cohort. IRGPI score of −0.074 which was used as cut-off for IRGPI to stratify patients into low- or high-risk groups.Abbreviations: OV, ovarian cancer; ROC, receiver operating characteristic; IRGPI, immune-related gene pairs index. |
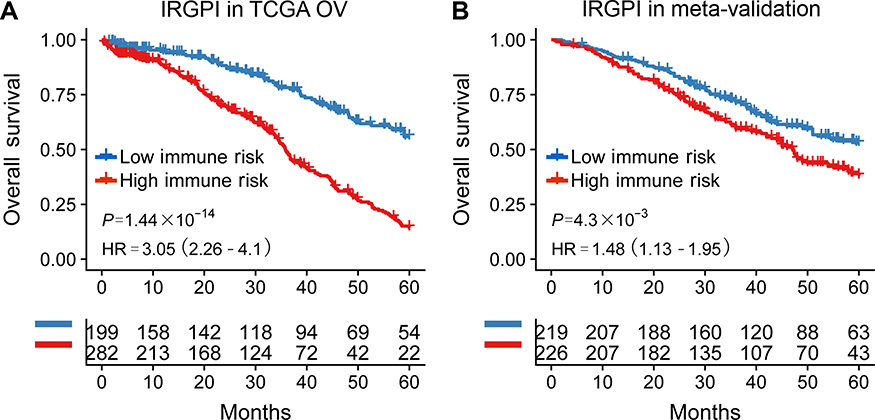 |
Figure 2 Kaplan-meier curves of overall survival (OS) among different IRGPI risk groups. Patients were stratified by immune-related gene pair index (IRGPI) (low vs high risk). OS among patients in the training (A) and meta-validation cohorts (B).Abbreviation: HR, hazard ratio. |
Validation of the IRGPI signature for survival prediction
To validate whether the IRGPI had consistent prognostic value in different risk groups, we applied the IRGPI signature to two independent validation cohorts from Bonome (GSE26712, n=185)20, and Yoshihara (GSE32062, n=260)21 as external validation. Patients in the validation groups were divided into low- and high-risk groups, and then survival was compared. Similar to the results obtained from the training cohort, patients in the high-risk group had a shorter OS than those in the low-risk group (P=4.30×10⁻³; HR =1.48 (1.13, 1.95)) (Table S2 and Figure 2B). When testing in independent validation cohorts, the IRGPI remained highly prognostic for HGSOC patients (Figure 3).
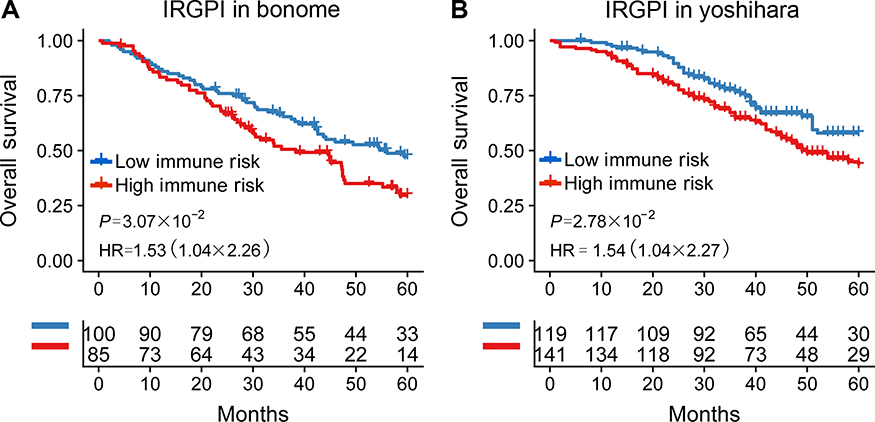 |
Figure 3 Kaplan-Meier curves of overall survival among independent validation cohorts. Overall survival for patients in the (A) Bonome (n=185) and (B) Yoshihara (n=260) cohort, respectively.Abbreviations: IRGPI, immune-related gene pairs index; HR, hazard ratio. |
Immune cells infiltration within different risk groups
It has been reported that tumor infiltrating immune cells are associated with prognosis.29 CIBERSORT can estimate of immune cell subsets and has been used in many previous cancer microenvironmental studies36–38. We applied CIBERSORT to estimate the relative proportion of 22 different immune cells for each patient within different risk groups. Figure 4A depicted a comparative summary of CIBERSORT output resulting from these two risk groups. Immune cells, such as Macrophages M2, T cells CD8, and Macrophages M1 were enriched in different risk groups (Figure 4A). We found that Macrophages M2 was significantly highly expressed in the high-risk group (P=0.007), while the percentage of T cells CD8 was significantly higher in the low-risk group (P=0.02, Figure 4B). Previous studies have depicted Macrophages M230 contributing to poor prognosis, while T cells CD831 indicates of better prognosis.
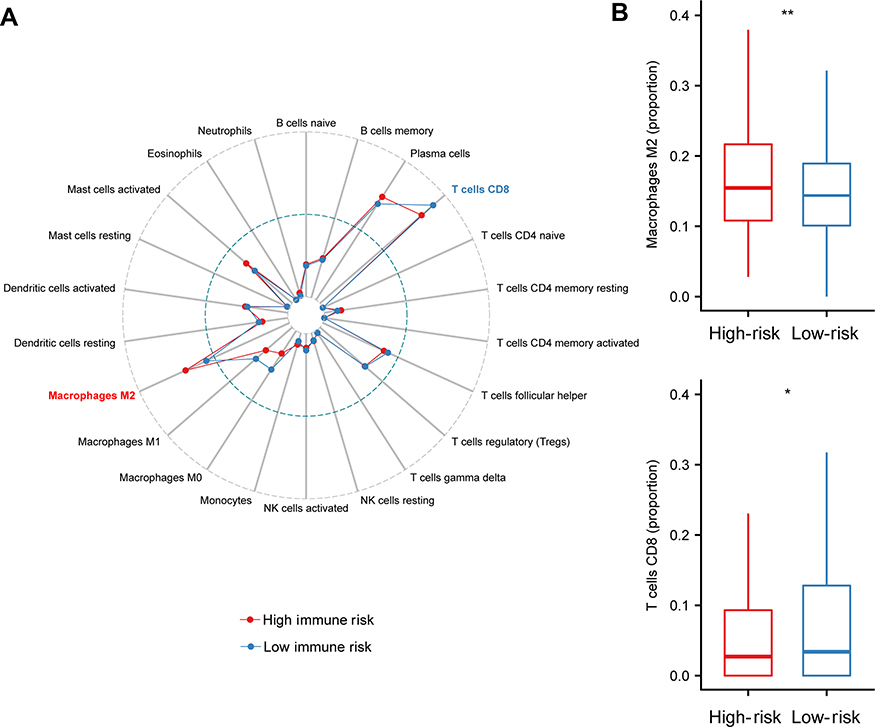 |
Figure 4 Immune infiltration status within IRGPI risk groups. (A). Summary of the 22 immune cells’ abundance estimated by CIBERSORT for different risk groups. (B) The abundance distribution of specific Immune cells’ within different risk groups. Macrophages M2 was significantly highly expressed in the high-risk group (P=0.007), while the percentage of T cells CD8 was significantly higher in the low-risk group (P=0.02). P-values are based on t-test (*P<0.05, **P<0.01).Abbreviation: IRGPI, immune-related gene pairs index. |
Functional assessment of the IRGPI signature
To explore the biological processes and signaling pathways altered by the IRGPI signature, we carried out GO analysis and GSEA. GO analysis showed that the IRGPI signature genes in the training cohort were mostly involved in response to stimulus (Figure 5 and Table S3). GSEA was carried out between high- and low-risk groups to investigate the pathways that were significantly altered. Multiple mesenchymal phenotype-related pathways, including the epithelial-mesenchymal transition (EMT), TGF-beta signaling pathway, extracellular matrix signaling pathway and focal adhesion, were highly enriched for the high-risk groups (false discovery rate (FDR) <0.01) (Figure 6 and Table S4). The enrichment of mesenchymal phenotype-related pathways provided evidence of molecular mechanisms affected by the IRGPI signature and thus predicts the prognosis of HGSOC.
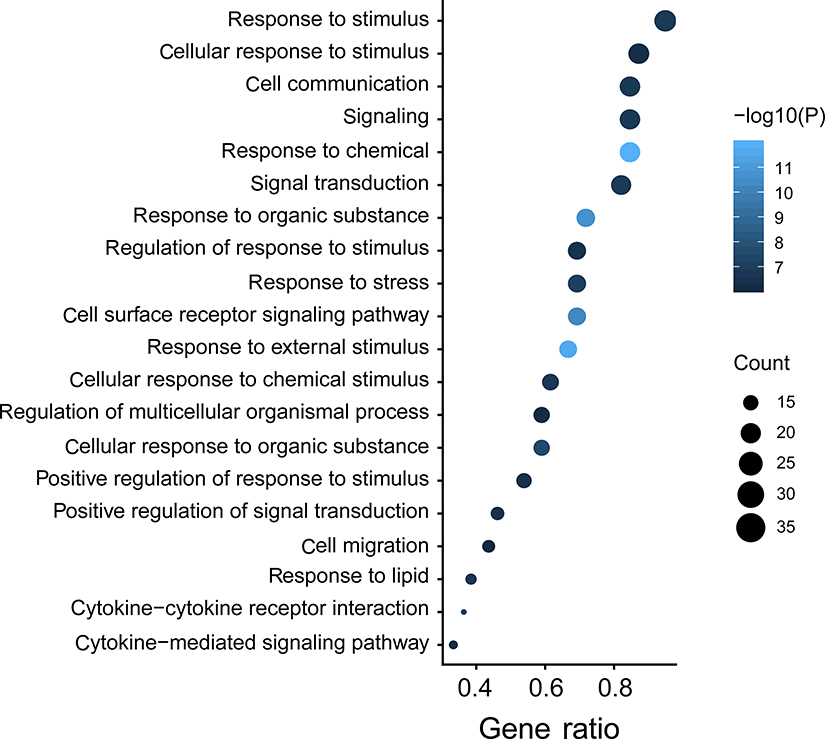 |
Figure 5 Immune-related signature genes analysis. Gene ontology (GO) of the 40 immune signature genes. “GeneRatio” is the percentage of total differential genes in the given GO term. |
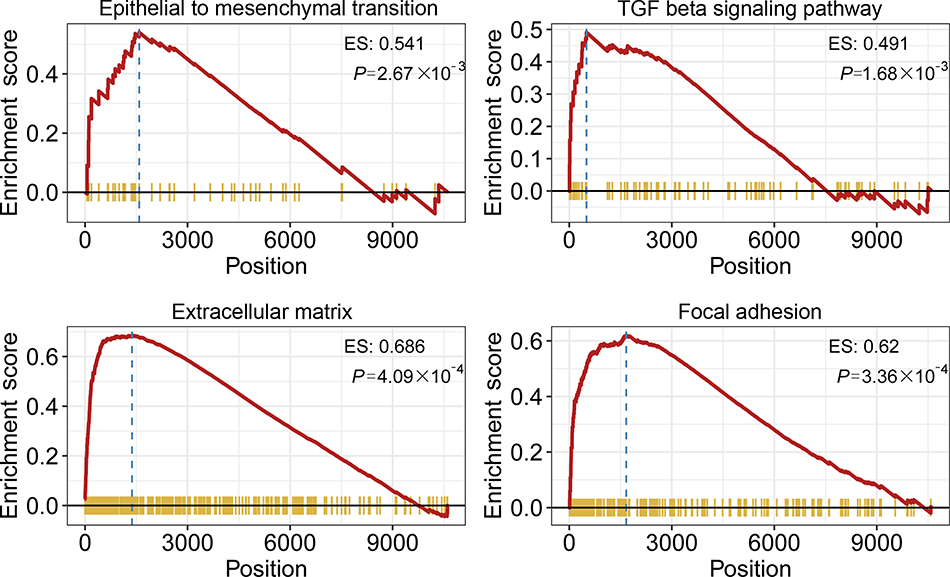 |
Figure 6 Gene Set Enrichment Analysis (GSEA). Gene set enrichment analysis confirmed that mesenchymal phenotype-related pathways were upregulated in the high- risk group. |
Discussion
Ovarian cancer is the leading cause of death among gynecological cancers. About 70% of ovarian cancer is high-grade serous ovarian cancer (HGSOC). Currently, clinical features, such as tumor grade, histopathological classification, debulking status, and CA-125 levels are still the most common ways to evaluate the risk of serous ovarian carcinoma patients,6 and besides, a lot of multigene prognostic signatures8–11 have been developed for serous ovarian carcinoma patients, but the accuracy of their prognosis predictions remains uncertain. Therefore, there is an urgent to find robust prognostic biomarkers to predict the survival of serous ovarian carcinoma patients.
Given the inherent biological heterogeneity of tumors and the technical bias caused by sequencing platforms, previous prognostic risk models need to properly standardize gene expression profiles, which is a difficult point for data analysis. In order to achieve the robustness of prognosis prediction, we used a new method to conduct data analysis without considering the technical bias of different platforms.32 The newly established prognostic feature does not require data preprocessing, such as scaling and normalization, but is achieved through relative ranking and paired comparison of gene expression values. This method has been reported to have reliable results in many studies, including cancer molecular classification.13
In the present study, we identified an immune-related gene pair signature to predict overall survival for serous ovarian carcinoma patients. The prognostic signature consists of 20 immune-related gene pairs (IRGPs) containing 40 unique IRGs. Most of the genes involved in the immune signature are cytokines and cytokine receptors that play key roles in response to stimulus. Within these 40 immune genes, decreased expression of SEMA3A is associated with poor prognosis in gastric carcinoma (GC).33 Over-expression of VAV3 was found to be a poor prognostic indicator in ovarian cancer patients.34 High expression of PDGFA has been shown to be associated with a poor prognosis in GC.35 The expression of BMP7 in colorectal tumors is associated with pathological invasiveness such as liver metastasis and poor prognosis.36 Inhibition of FGFR1 increases chemotherapy sensitivity in ovarian cancer.37 In addition, Macrophages M2 has been shown to be related to poor prognosis in a variety of cancer types.38 We found a significantly increased infiltration level of Macrophages M2 in the immune high-risk group. Moreover, in this study, we also found that several mesenchymal phenotype-related pathways, such as EMT, TGF-beta, extracellular matrix and focal adhesion signaling pathways, were related to the IRGPI signature. These pathways are well-known critical factors that affect tumor metastasis.39–41 Our findings suggested that a high-risk score correlates with up-regulation of mesenchymal phenotype-related pathways, consistent with the above knowledge. These results suggest the important role of the IRGPI signature in tumor invasion in serous ovarian carcinoma patients.
There are some limitations to our study. First, the prognostic signature is based on the gene expression profiles produced by rna-seq or microarray platforms, which is difficult to popularize in daily clinical applications due to its high price, long conversion cycle and requirement of bioinformatics expertise. Second, the training data-set used to establish the immune signature came from retrospective studies and included fresh frozen samples. Therefore, there are still doubts about the stability and efficiency of FFPE samples. More data-sets with different sample attributes need to be included for broader validation.
Conclusion
In summary, we systematically investigated the prognostic value of the immune-related gene pair signature, which could provide risk assessment for serous ovarian carcinoma patients management. Our immune-related signature was associated with prognosis of serous ovarian carcinoma patients. These immune signature genes and biological functions of the IRGPI provide a further understanding of the role of our prognostic signature in the development of serous ovarian carcinoma. This signature will be a useful predictive tool for identifying patients who may benefit from immunotherapy.
Acknowledgment
This study was supported by the Basic Public Welfare Research Program of Zhejiang Province (No. LGF18H040001), and the Ningbo Social Development Major Project (No. 2017C510009).
Author contributions
Peng S, Feng G and Xingguo Z designed the study; Peng S and Liuyan Z wrote the manuscript; Liuyan Z, Ping Z, Yao T, Yuzhuo W, Haifen M, and Xuefei X analyzed the data and interpreted the results. All authors contributed to data analysis, drafting or revising the article, gave final approval of the version to be published, and agree to be accountable for all aspects of the work.
Disclosure
The authors report no conflicts of interest in this work.
References
1. Jayson GC, Kohn EC, Kitchener HC, Ledermann JA. Ovarian cancer. Lancet. 2014;384(9951):1376–1388. doi:10.1016/S0140-6736(13)62146-7
2. Seidman JD, Horkayne-Szakaly I, Haiba M, Boice CR, Kurman RJ, Ronnett BM. The histologic type and stage distribution of ovarian carcinomas of surface epithelial origin. Int J Gynecol Pathol. 2004;23(1):41–44. doi:10.1097/01.pgp.0000101080.35393.16
3. Siegel RL, Miller KD, Jemal A. Cancer statistics, 2016. CA Cancer J Clin. 2016;66(1):7–30. doi:10.3322/caac.21332
4. Weberpals JI, Koti M, Squire JA. Targeting genetic and epigenetic alterations in the treatment of serous ovarian cancer. Cancer Genet. 2011;204(10):525–535. doi:10.1016/j.cancergen.2011.09.004
5. Koti M, Gooding RJ, Nuin P, et al. Identification of the IGF1/PI3K/NF κB/ERK gene signalling networks associated with chemotherapy resistance and treatment response in high-grade serous epithelial ovarian cancer. BMC Cancer. 2013;13:549. doi:10.1186/1471-2407-13-549
6. May T, Stewart JM, Bernardini MQ, et al. The prognostic value of perioperative, pre-systemic therapy CA125 levels in patients with high-grade serous ovarian cancer. Int J Gynaecol Obstet. 2018;140(2):247–252. doi:10.1002/ijgo.12376
7. Konecny GE, Wang C, Hamidi H, et al. Prognostic and therapeutic relevance of molecular subtypes in high-grade serous ovarian cancer. J Natl Cancer Inst. 2014;106:10. doi:10.1093/jnci/dju249
8. Tothill RW, Tinker AV, George J, et al. Novel molecular subtypes of serous and endometrioid ovarian cancer linked to clinical outcome. Clin Cancer Res. 2008;14(16):5198–5208. doi:10.1158/1078-0432.CCR-08-0196
9. Cancer Genome Atlas Research Network. Integrated genomic analyses of ovarian carcinoma. Nature. 2011;474(7353):609–615. doi:10.1038/nature10166
10. Jin C, Xue Y, Li Y, et al. A 2-protein signature predicting clinical outcome in high-grade serous ovarian cancer. Int J Gynecol Cancer. 2018;28(1):51–58. doi:10.1097/IGC.0000000000001141
11. Zhang J, Yang L, Xiang X, Li Z, Qu K, Li K. A panel of three oxidative stress-related genes predicts overall survival in ovarian cancer patients received platinum-based chemotherapy. Aging. 2018;10(6):1366–1379. doi:10.18632/aging.101473
12. Leek JT, Scharpf RB, Bravo HC, et al. Tackling the widespread and critical impact of batch effects in high-throughput data. Nat Rev Genet. 2010;11(10):733–739. doi:10.1038/nrg2825
13. Popovici V, Budinska E, Tejpar S, et al. Identification of a poor-prognosis BRAF-mutant-like population of patients with colon cancer. J Clin Oncol. 2012;30(12):1288–1295. doi:10.1200/JCO.2011.39.5814
14. Heinäniemi M, Nykter M, Kramer R, et al. Gene-pair expression signatures reveal lineage control. Nat Methods. 2013;10(6):577–583. doi:10.1038/nmeth.2445
15. Li B, Cui Y, Diehn M, Li R. Development and validation of an individualized immune prognostic signature in early-stage nonsquamous non-small cell lung cancer. JAMA Oncol. 2017;3(11):1529–1537. doi:10.1001/jamaoncol.2017.1609
16. Angell H, Galon J. From the immune contexture to the immunoscore: the role of prognostic and predictive immune markers in cancer. Curr Opin Immunol. 2013;25(2):261–267. doi:10.1016/j.coi.2013.03.004
17. Gentles AJ, Newman AM, Liu CL, et al. The prognostic landscape of genes and infiltrating immune cells across human cancers. Nat Med. 2015;21(8):938–945. doi:10.1038/nm.3909
18. Webb JR, Milne K, Kroeger DR, Nelson BH. PD-L1 expression is associated with tumor-infiltrating T cells and favorable prognosis in high-grade serous ovarian cancer. Gynecol Oncol. 2016;141(2):293–302. doi:10.1016/j.ygyno.2016.03.008
19. Darb-Esfahani S, Kunze CA, Kulbe H, et al. Prognostic impact of programmed cell death-1 (PD-1) and PD-ligand 1 (PD-L1) expression in cancer cells and tumor-infiltrating lymphocytes in ovarian high grade serous carcinoma. Oncotarget. 2016;7(2):1486–1499. doi:10.18632/oncotarget.6429
20. Bonome T, Levine DA, Shih J, et al. A gene signature predicting for survival in suboptimally debulked patients with ovarian cancer. Cancer Res. 2008;68(13):5478–5486. doi:10.1158/0008-5472.CAN-07-6595
21. Yoshihara K, Tsunoda T, Shigemizu D, et al. High-risk ovarian cancer based on 126-gene expression signature is uniquely characterized by downregulation of antigen presentation pathway. Clin Cancer Res. 2012;18(5):1374–1385. doi:10.1158/1078-0432.CCR-11-2725
22. Gautier L, Cope L, Bolstad BM, Irizarry RA. affy–analysis of Affymetrix GeneChip data at the probe level. Bioinformatics. 2004;20(3):307–315. doi:10.1093/bioinformatics/btg405
23. Bhattacharya S, Andorf S, Gomes L, et al. ImmPort: disseminating data to the public for the future of immunology. Immunol Res. 2014;58(2–3):234–239. doi:10.1007/s12026-014-8516-1
24. Guinney J, Dienstmann R, Wang X, et al. The consensus molecular subtypes of colorectal cancer. Nat Med. 2015;21(11):1350–1356. doi:10.1038/nm.3967
25. Newman AM, Liu CL, Green MR, et al. Robust enumeration of cell subsets from tissue expression profiles. Nat Methods. 2015;12(5):453–457. doi:10.1038/nmeth.3337
26. Raudvere U, Kolberg L, Kuzmin I, et al. g:profiler:a web server for functional enrichment analysis and conversions of gene lists (2019 update). Nucleic Acids Res. 2019;47(W1):W191–W198. doi:10.1093/nar/gkz369
27. Subramanian A, Tamayo P, Mootha VK, et al. Gene set enrichment analysis: a knowledge-based approach for interpreting genome-wide expression profiles. Proc Natl Acad Sci U S A. 2005;102(43):15545–15550. doi:10.1073/pnas.0506580102
28. Schröder MS, Culhane AC, Quackenbush J, Haibe-Kains B. survcomp: an R/Bioconductor package for performance assessment and comparison of survival models. Bioinformatics. 2011;27(22):3206–3208. doi:10.1093/bioinformatics/btr511
29. Liu X, Wu S, Yang Y, Zhao M, Zhu G, Hou Z. The prognostic landscape of tumor-infiltrating immune cell and immunomodulators in lung cancer. Biomed Pharmacother. 2017;95:55–61. doi:10.1016/j.biopha.2017.08.003
30. Niino D, Komohara Y, Murayama T, et al. Ratio of M2 macrophage expression is closely associated with poor prognosis for Angioimmunoblastic T-cell lymphoma (AITL). Pathol Int. 2010;60(4):278–283. doi:10.1111/j.1440-1827.2010.02514.x
31. Sato E, Olson SH, Ahn J, et al. Intraepithelial CD8 tumor-infiltrating lymphocytes and a high CD8 /regulatory T cell ratio are associated with favorable prognosis in ovarian cancer. Proc National Acad Sci. 2005;102(51):18538–18543. doi:10.1073/pnas.0509182102
32. Eddy JA, Sung J, Geman D, Price ND. Relative expression analysis for molecular cancer diagnosis and prognosis. Technol Cancer Res Treat. 2010;9(2):149–159. doi:10.1177/153303461000900204
33. Tang C, Gao X, Liu H, Jiang T, Zhai X. Decreased expression of SEMA3A is associated with poor prognosis in gastric carcinoma. Int J Clin Exp Pathol. 2014;7(8):4782–4794.
34. Kwon A-Y, Kim G-I, Jeong J-Y, et al. VAV3 overexpressed in cancer stem cells is a poor prognostic indicator in ovarian cancer patients. Stem Cells Dev. 2015;24(13):1521–1535. doi:10.1089/scd.2014.0588
35. Katano M, Nakamura M, Fujimoto K, Miyazaki K, Morisaki T. Prognostic value of platelet-derived growth factor-A (PDGF-A) in gastric carcinoma. Ann Surg. 1998;227(3):365–371. doi:10.1097/00000658-199803000-00008
36. Motoyama K, Tanaka F, Kosaka Y, et al. Clinical significance of BMP7 in human colorectal cancer. Ann Surg Oncol. 2008;15(5):1530–1537. doi:10.1245/s10434-007-9746-4
37. Cole C, Lau S, Backen A, et al. Inhibition of FGFR2 and FGFR1 increases cisplatin sensitivity in ovarian cancer. Cancer Biol Ther. 2010;10(5):495–504. doi:10.4161/cbt.10.5.12585
38. Edin S, Wikberg ML, Dahlin AM, et al. The distribution of macrophages with a M1 or M2 phenotype in relation to prognosis and the molecular characteristics of colorectal cancer. PLoS One. 2012;7(10):e47045. doi:10.1371/journal.pone.0047045
39. Singh A, Settleman J. EMT, cancer stem cells and drug resistance: an emerging axis of evil in the war on cancer. Oncogene. 2010;29(34):4741–4751. doi:10.1038/onc.2010.215
40. Akhurst RJ, Derynck R. TGF-β signaling in cancer — a double-edged sword. Trends Cell Biol. 2001;11:S44–S51.
41. Stetler-Stevenson W, Aznavoorian S, Liotta LA. Tumor cell interactions with the extracellular matrix during invasion and metastasis. Annu Rev Cell Biol. 1993;9(1):541–573. doi:10.1146/annurev.cb.09.110193.002545
 © 2019 The Author(s). This work is published and licensed by Dove Medical Press Limited. The full terms of this license are available at https://www.dovepress.com/terms.php and incorporate the Creative Commons Attribution - Non Commercial (unported, v3.0) License.
By accessing the work you hereby accept the Terms. Non-commercial uses of the work are permitted without any further permission from Dove Medical Press Limited, provided the work is properly attributed. For permission for commercial use of this work, please see paragraphs 4.2 and 5 of our Terms.
© 2019 The Author(s). This work is published and licensed by Dove Medical Press Limited. The full terms of this license are available at https://www.dovepress.com/terms.php and incorporate the Creative Commons Attribution - Non Commercial (unported, v3.0) License.
By accessing the work you hereby accept the Terms. Non-commercial uses of the work are permitted without any further permission from Dove Medical Press Limited, provided the work is properly attributed. For permission for commercial use of this work, please see paragraphs 4.2 and 5 of our Terms.