")
Back to Journals » Diabetes, Metabolic Syndrome and Obesity » Volume 8
An exploratory retrospective assessment of a quantitative measure of diabetes risk: medical management and patient impact in a primary care setting
Authors Courtney M, Moler E, Osborne J, Whitney G, Conard SE
Received 6 December 2014
Accepted for publication 27 May 2015
Published 18 September 2015 Volume 2015:8 Pages 447—453
DOI https://doi.org/10.2147/DMSO.S78810
Checked for plagiarism Yes
Review by Single anonymous peer review
Peer reviewer comments 3
Editor who approved publication: Professor Ming-Hui Zou
Maureen R Courtney,1 Edward J Moler,2 John A Osborne,3 Geoff Whitney,4 Scott E Conard5
1College of Nursing, University of Texas Arlington, Arlington, 2Clarient Diagnostics, Aliso Viejo, CA, 3State of the Heart Cardiology, Grapevine, 4WaveTwo, Inc., Irving, 5ACAP Health, Dallas, TX, USA
Background: Primary care providers with limited time and resources bear a heavy responsibility for chronic disease prevention or progression. Reliable clinical tools are needed to risk stratify patients for more targeted care. This exploratory study examined the care of patients who had been risk stratified regarding their likelihood of clinically progressing to type 2 diabetes.
Methods: This was a retrospective chart review pilot study conducted to assess a primary care provider's use of a risk screening test. In this quality improvement project, the result of the risk screening was examined in relation to its influence on medical management and clinical impact on patients at risk for diabetes. All providers were board certified in family medicine and had more than 10 years clinical experience in managing diabetes and prediabetes. No specific clinical practice guidelines were mandated for patient care in this pilot study. Physicians in the practice group received an orientation to the diabetes risk measure and its availability for use in a pilot study to be conducted over a 6-month period. We identified the 696 nondiabetic adults in family practices who received a risk screening test (PreDx®, a multi-marker blood test that estimates the 5-year likelihood of conversion to type 2 diabetes) between June and November 2011 for a 6-month sample. A comparison group of 2,002 patients from a total database of 3.2 million patients who did not receive the risk test was randomly selected from the same clinical database after matching for age, sex, selected diagnoses, and metabolic risk factors. Patient groups were compared for intensity of care provided and clinical impact.
Results: Compared to patients with a similar demographic and diagnostic profile, patients who had the risk test received more intensive primary care and had better clinical outcome than comparison patients. Risk-tested patients were more likely to return for follow-up visits, be monitored for relevant cardio-metabolic risk factors, and receive prescription medications with P<0.001. Further, intensity of care was associated with the level of risk test result: patients with moderate or high scores were more likely to return for follow-up visits and receive prescription medications than patients with low scores. All P-values for comparison patients between the low and moderate groups, low and high groups, and moderate and high groups resulted in P<0.001. Risk-tested patients were more likely than their comparison group counterparts to achieve weight reduction, lowered blood pressure, and improved blood glucose and cholesterol as demonstrated by P-values of <0.001.
Conclusion: Use of a risk stratification test in primary care may help providers to more effectively identify high risk patients, manage diabetes risk, increase patient involvement in diabetes risk management, and improve clinical outcomes. A randomized controlled study is the next step to investigate the impact of diabetes risk stratification in primary care.
Keywords: patient outcomes, diabetes, diabetes prevention
Introduction
Type 2 diabetes is a progressive, chronic disease that has become one of the most challenging public health problems of the 21st century. In the USA, 29.1 million adults have diabetes. Of these, almost 28% are currently undiagnosed. Many individuals are at risk to develop diabetes with almost 38% of US adults having prediabetes, meaning elevated glycated hemoglobin (HbA1c) levels and/or impaired fasting blood glucose. One half of these adults are older than 65 years.1
Studies have shown that less than 10% of individuals at risk of developing the disease will actually progress to diabetes within 5 years.2 In addition, multiple clinical studies have shown it is possible to prevent, or at least delay, the onset of type 2 diabetes with lifestyle changes or prescription medications.3–12 Hence, to effectively curb the growing diabetes epidemic, primary care providers must be able to identify patients who are at highest risk of progressing to type 2 diabetes so that prevention efforts can be focused on those most likely to benefit.
In the face of the diabetes epidemic, the health care system in the USA must contend with a shortage of primary care physicians. Even as the demand for primary care is increasing, fewer graduating medical students are choosing to enter primary care practice.13,14 As a result, some estimate that the USA will experience a shortage of 35,000–44,000 adult primary care physicians by the year 2025.15 Fewer physicians will be available to manage the care of patients with chronic diseases such as diabetes, and will be further challenged to manage those at risk for the disease.
To complicate matters further, one must also address the problem of clinical inertia in managing chronic diseases such as type 2 diabetes. Clinical inertia has been defined as the failure of health care providers to initiate or intensify therapy when indicated.16 For example, providers who engage in evidence-based practice will manage a patient’s systolic and diastolic blood pressure to a specific target level such as recommended by the American Diabetes Association. In contrast, if clinical inertia is present, a provider may recognize that a patient is not at the blood pressure goal but will not add a second required medication to reach the goal, instead maintaining the current drug therapy. In a primary care setting, clinical inertia has been shown to impact the control of diabetes-related risk factors17 and contribute to poor diabetes outcome.18 As such, there is a critical need for reliable, easy-to-use tools that will help physicians and other providers working in primary care to easily and effectively identify risk and target clinical resources for the prevention of type 2 diabetes.
The risk test used for this study was the PreDx® test, a multi-marker blood test that can help primary care providers to estimate the likelihood of a patient progressing from prediabetes to type 2 diabetes within the next 5 years. The PreDx test has been validated in several patient cohorts, and shown to provide a better assessment of diabetes risk than fasting plasma glucose or insulin alone.19–24 The PreDx test has been available since 2008, but its use in primary care practice has not yet been evaluated.
The clinical utility of risk stratification tools such as the PreDx test has not been fully evaluated in primary care practice. The primary objective of this retrospective pilot study was to assess if physicians would use a risk test in primary care practice and a preliminary assessment of how it might influence medical management and clinical impact for patients at risk for diabetes.
Materials and methods
Study design
The study used comprehensive electronic medical records of 3.2 million patients maintained by a large southwestern medical group across 713 physicians in 531 clinics in the Dallas-Fort Worth area. The collection of data for this study was conducted as part of a quality improvement initiative project and used a de-identified database. IRB review is not required for a Quality Improvement study nor for a database using only deidentified data.
We identified the 696 patients aged 30 years or older with no prior diagnosis of diabetes who had received the PreDx test in June–December 2010 with valid test results. A total of 35 physicians ordered the risk test for at least one patient during this period. A comparison group of patients who had no record of visiting a physician known to be ordering this test was randomly selected in a 3:1 ratio to the risk-tested group to ensure sufficient statistical power for meaningful analysis. Patients in the comparison group were selected, after stratification to match sex and age distributions, from those who had at least one measurement of low-density lipoprotein (LDL), blood pressure, and weight in the 18 months prior to the reference date. Inclusion/exclusion criteria for patient selection involved selecting patients with other existing diagnoses such as hypertension and dyslipidemia. The natural prevalence of other conditions are thus represented in the patients included for analysis. The reference date of October 1, 2010 was selected for patients in the comparison group as this was the approximate mode of risk testing dates. The reference date for risk-tested patients was the date of blood draw for the test.
Biometric, diagnosis, and prescription records of all selected patients were extracted for the 18 months prior to the reference date and all dates afterwards (mean follow-up 4 months). Biometric measures included blood pressure, LDL, high-density lipoprotein (HDL), weight, HbA1c, triglycerides, and fasting glucose. Per-patient means for these biometric measures were computed for periods before and after the reference date. Diagnoses included hypercholesterolemia and hypertension, classified as International Classification of Diseases, ninth revision, codes 272.x and 401.x, respectively. Prescriptions included those written for antihypertensives, lipid-lowering agents, antidiabetic agents, and recommendations for aspirin after reference dates were compiled.
Risk testing
Physicians in the group who ordered risk testing for their patients used it for patients with one or more clinical risk factors for diabetes (ie, metabolic syndrome, hyperglycemia, history of gestational diabetes, and obesity). No preselected diabetes mellitus guidelines were used by providers. This clinical practice audit pilot was intended to examine the natural practice patterns of experienced physicians in managing patients with an identified risk tool.
The risk test used for this study was PreDx, a multi-marker blood test that determines the likelihood of a patient progressing from prediabetes to type 2 diabetes within 5 years. The test required a simple fasting blood draw, using standard sample collection and handling procedures, and was performed by a Clinical Laboratory Improvement Amendments (CLIA)-certified laboratory (Tethys Clinical Laboratory, Emeryville, CA, USA). The test result was an individualized numerical score that indicated whether the patient had a low, moderate, or high likelihood of developing diabetes within 5 years. The PreDx test has been validated in several patient cohorts, and shown to provide a better assessment of likelihood of progression to disease than fasting plasma glucose or insulin alone.19–24 The PreDx test measures seven biomarkers (glucose, HbA1c, insulin, CRP, ferritin, IL2RA, and adiponectin) that are independently associated with diabetes risk, and uses an algorithm that incorporates these measures, along with sex and age, to generate an objective and quantitative score that indicates a patient’s 5-year likelihood of progressing to type 2 diabetes.
The test report included a single numerical score that distinguishes among patients at low, moderate, and high risk of developing type 2 diabetes, as indicated by risk scores of <4.5, 4.5–7.9, and ≥8.0, respectively. The report also indicated a patient’s likelihood of developing type 2 diabetes relative to the general population, and provided results and normal ranges of the individual biomarkers used to determine the risk score.
Differences in intensity of care received were assessed by monitoring follow-up visit history, rates of subsequent risk factor monitoring, and use of prescription medication for risk-tested patients and comparison patients. Differences in clinical impact between these two groups were evaluated by monitoring improvements in risk factor control.
Statistical analysis
Statistical significance was assessed using P-values computed by a two-tailed chi-square test. Significance was reported as calculated.
Results
Follow-up histories
Intensity of care was evaluated by comparing follow-up history for the 696 patients who had received a valid risk test result and 2,002 comparison patients (Table 1). The comparison and risk-tested groups were matched for age (mean age =53 years) and sex (60% of each group were male) and balanced for representation of metabolic risk factors, hypertension, and hypercholesterolemia to the extent possible. The results showed that the proportion of risk-tested patients who returned for follow-up visits was almost double that of comparison patients (80% versus [vs] 42.7%, respectively), indicating that patients who received the risk test were assessed more intensively than patients in the comparison group. Among patients in both groups who returned for at least one follow-up visit, the mean number of follow-up visits, and mean time to the first and last follow-up visits, were comparable.
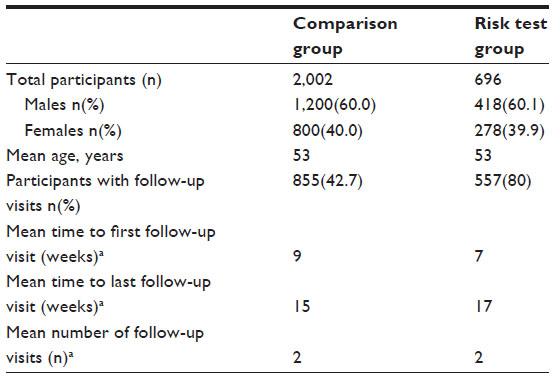 | Table 1 Demographic characteristics and follow-up history of study participants |
Intensity of care for the risk-tested patients was evaluated further by examining the follow-up history for patients stratified according to their risk score (Table 2). Although the different risk groups remained reasonably well matched for sex (60% of each group were male), they differed with respect to mean age. The mean age was lowest in the low-risk group and highest in the high-risk group. The results showed that all risk-tested patients, even those in the low-risk group, had greater rates of follow-up visits as compared to the comparison group. Moreover, there was a significant increase in the percentage of patients returning for follow-up visits among those with higher risk scores (all P-values for controls between the low and moderate groups, low and high groups, and moderate and high groups were <0.001), indicating that patients deemed to be at higher risk for diabetes by risk score were assessed more intensively than those at lower risk. Among patients who returned for at least one follow-up visit, the mean number of follow-up visits, as well as the times to first and last follow-up visits, were comparable across the three groups.
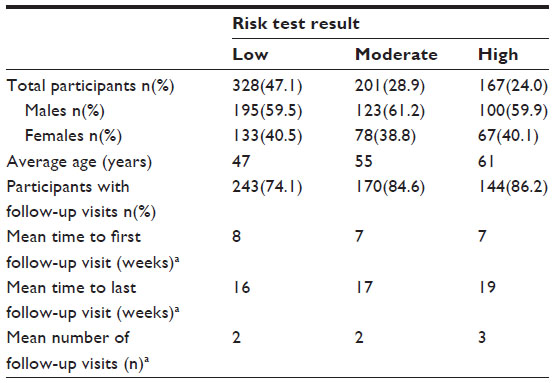 | Table 2 Stratification of participants by risk test result |
Risk factor monitoring
The monitoring of risk factors was also assessed as an indication of intensity of care. As shown in Figure 1, patients who received the risk test were far more likely to receive follow-up measurements for relevant risk factors as compared to patients in the comparison group. Risk-tested patients were twice as likely to have follow-up measurements for blood pressure (91.5% of risk-tested patients vs 42.7% of comparison patients) and weight (91.1% of risk-tested patients vs 42.8% of comparison patients), and nearly three times as likely to have follow-up measurements for LDL (71.8% of risk-tested patients vs 24.0% of comparison patients) and HDL (72.7% of risk-tested patients vs 24.3% of comparison patients). The greatest difference in follow-up measurements was observed for HbA1c, where the percentage of risk-tested patients subsequently tested for HbA1c was five times that of comparison patients (58.6% of risk-tested patients vs 11.5% of comparison patients).
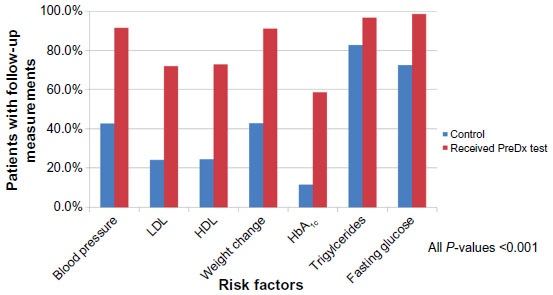 | Figure 1 Association of risk testing with subsequent risk factor monitoring. |
Although the differences in subsequent risk factor monitoring between the risk-tested and comparison groups reached statistical significance (P<0.001) for all comparison patients, less difference was observed for follow-up tests of triglycerides and fasting glucose. As compared to comparison group patients, the percentage of risk-tested patients who received follow-up testing was somewhat higher for subsequent monitoring of triglycerides (96.8% of risk-tested patients vs 82.8% of comparison patients) and subsequent monitoring of fasting glucose (98.4% of risk-tested patients vs 72.4% of comparison patients). Taken together, these results indicate more careful and targeted monitoring for relevant risk factors among risk-tested patients as compared to patients not risk tested.
Prescription medication
As yet another indication of intensity of care, the rate at which medications were prescribed during the follow-up period was compared among patients in the comparison group and patients with low, moderate, or high risk scores. As shown in Figure 2, risk-tested patients received significantly more new prescriptions during the follow-up period as compared to patients in the comparison group. The higher rate of new prescriptions among risk-tested patients was observed for all medications examined, including antihypertensives, lipid-lowering, antidiabetic, and aspirin. Moreover, the frequency of prescriptions written during the follow-up period was associated with the test result – patients with a low risk score received fewer prescriptions than patients with a moderate or high risk score. These results indicate more compliant use of prescription medications among risk-tested patients, particularly among those with higher risk scores, as compared to patients not risk tested.
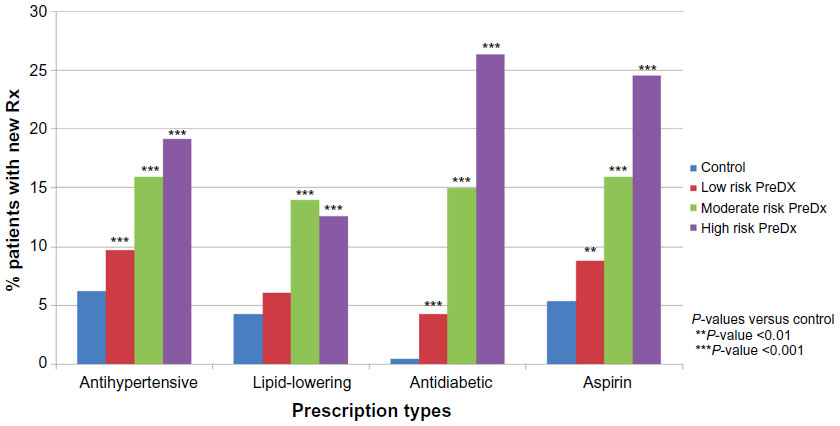 | Figure 2 Association of risk test result with medications prescribed during the follow-up period. |
Clinical impact
Risk-tested patients were compared with comparison patients for monitoring and improvement in clinical measures. As shown in Figure 3, significantly more risk-tested patients had clinical measures monitored and improvement as compared with patients in the comparison group. Risk-tested patients were more likely than their comparison group counterparts to have these risk factors monitored and to achieve reductions in blood pressure and weight, and to improve measures for blood cholesterol, glucose, and HbA1c. The greater improvement in clinical measures among risk-tested patients may be related to the closer follow-up and monitoring received by this group.
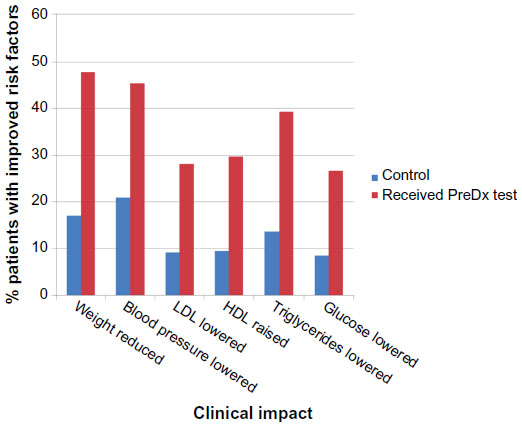 | Figure 3 Association of risk testing with clinical impact. |
Discussion
Physicians and other providers who work in primary care settings are faced with the challenge of providing appropriate and meaningful care to the many patients in their practice. Given the limited time primary care providers have to tend to the needs of each patient, and the expected smaller number of primary care providers in the near future, the early signs of chronic, progressive diseases such as type 2 diabetes may be easily overlooked and undertreated. Indeed, studies have reported low rates of lifestyle counseling and of initiation or intensification of pharmaceutical therapy among patients with diabetes-related risk factors in primary care settings, indicating that clinical inertia can impact outcome for patients at risk of developing type 2 diabetes.17 Although physician- and patient-related contributions to clinical inertia are not yet fully understood, reliable tools that can easily be incorporated into clinical practice and that provide clear, objective information about diabetes risk may help to improve clinical management of patients at risk for developing type 2 diabetes.
In this retrospective, observational study of patients and physicians, we evaluated whether medical management and clinical outcomes for patients at risk for diabetes could be improved by use of a risk test. We found that risk-tested patients were more likely than their comparison group counterparts to return for follow-up visits, be monitored for relevant risk factors, and receive prescription medications targeting risk-factor comparison. The authors note that only a future randomized trial with an experimental and control group can determine if use of a risk screening test does indeed promote significant changes in patient and provider behaviors. However, this study’s findings do suggest that patients who are screened and risk stratified may benefit in their care.
Further, the intensity of care was clearly associated with the risk test result – patients with moderate or high scores were more likely to return for follow-up visits and received more prescription medications than patients with low scores or no test. We also found significantly better clinical impact among risk-tested patients, who were more likely than comparison patients to have observed measures of weight reduction, lowered blood pressure, reduced fasting plasma glucose, and improved cholesterol and triglyceride measures. These results indicate that in this observational, pilot study patients with risk tests had metrics associated with more intensive care and better clinical outcomes than patients not risk tested.
Several limitations of this study should be noted. First, this is a retrospective, observational pilot study and not a randomized, controlled clinical trial. Because physicians overseeing the care of patients in the risk-tested group were self-selected, it may be that these physicians were naturally more aggressive in the intensity of care they provided to their patients as compared to physicians who had not yet adopted use of the risk test. Second, data for this study were extracted from electronic health records collected during routine care. The accuracy with which these records were collected and entered has not been assessed, and specific protocols for data entry beyond the usual institutional usage protocols were not required. Third, 66% of patients in the comparison group had a prior diagnosis of hypercholesterolemia or hypertension as compared to 82% of risk-tested patients and could account for some of the higher follow-up rates among risk-tested patients. Finally, our pilot observation that risk testing is associated with greater intensity of care and better clinical outcome does not demonstrate causality. Although results from this study showed differences between risk-tested patients and comparison patients in the intensity of care received and clinical outcome achieved, prospective studies are needed to demonstrate the clinical value of risk testing in medical management and clinical outcomes for patients at risk for diabetes.
To our knowledge, this is the first study to examine the use of a diabetes risk-stratification test in a real-world, primary care setting. Our results suggest that use of a stratification test can help primary care providers deliver more focused and intensive clinical management of diabetes risk, increase patient involvement in diabetes risk management, and improve clinical outcomes. As greater time pressures are placed on primary care practices, it will become even more essential to identify high-risk patients for special population management strategies that may involve not only physicians, but also support staff and other members of the health care team. By providing an objective, individualized measure of diabetes risk, stratification tests may help enable more consistent follow-up and closer monitoring of patients for diabetes-relevant risk factors, and may help to improve clinical outcomes by facilitating initiation and intensification of clinical therapy.
Conclusion
This retrospective, observational study showed that patients who were tested with a risk assessment tool received more intensive care when appropriate and had significantly better clinical impact than patients not risk tested. Screened patients were more likely than their comparison group counterparts to return for follow-up visits, be monitored for relevant risk factors, and receive prescription medications. Screened patients also were more likely than comparison patients to achieve weight reduction, lowered blood pressure, reduced fasting plasma glucose, and improved cholesterol and triglyceride measures. Use of a stratification test in daily clinical practice may help primary care providers more effectively manage diabetes risk, increase patient involvement in diabetes risk management, and improve clinical outcomes.
Acknowledgments
The authors gratefully acknowledge C Henry, MD, John Wood, MD, Odilon Alvarado, MD, and David Slater, MD of Medical Edge Healthcare Group, Inc., Dallas, TX, for their data collection efforts with their patients, and thank Linda Kahl for editorial and manuscript assistance. This work was funded by Tethys Bioscience, Inc.
Disclosure
The authors report no conflicts of interest in this work.
References
James C, Bullard KM, Rolka DB, et al. Implications of alternative definitions of prediabetes for prevalence in US adults. Diabetes Care. 2011;34(2):387–391. | |
Nichols GA, Hillier TA, Brown JB. Progression from newly acquired impaired fasting glucose to type 2 diabetes. Diabetes Care. 2007;30(2):228–233. | |
Delahanty LM, Nathan DM. Implications of the diabetes prevention program and Look AHEAD clinical trials for lifestyle interventions. J Am Diet Assoc. 2008;108(4 Suppl 1):S66–S72. | |
Look AHEAD Research Group, Wadden TA, West DS, et al. The Look AHEAD study: a description of the lifestyle intervention and the evidence supporting it. Obesity (Silver Spring). 2006;14(5):737–752. | |
The Diabetes Prevention Program (DPP) Research Group. The Diabetes Prevention Program (DPP): description of lifestyle intervention. Diabetes Care. 2002;25(12):2165–2171. | |
Gillies CL, Abrams KR, Lambert PC, et al. Pharmacological and lifestyle interventions to prevent or delay type 2 diabetes in people with impaired glucose tolerance: systematic review and meta-analysis. BMJ. 2007;334(7588):299. | |
Tuomilehto J, Lindstrom J, Eriksson JG, et al. Prevention of type 2 diabetes mellitus by changes in lifestyle among subjects with impaired glucose tolerance. N Engl J Med. 2001;344(18):1343–1350. | |
Knowler WC, Barrett-Connor E, Fowler SE, et al. Reduction in the incidence of type 2 diabetes with lifestyle intervention or metformin. N Engl J Med. 2002;346:393–403. | |
DeFronzo RA, Tripathy D, Schwenke DC, et al. Pioglitazone for diabetes prevention in impaired glucose tolerance. N Engl J Med. 2011; 364(12):1104–1115. | |
Chiasson JL, Josse RG, Gomis R, et al. Acarbose for prevention of type 2 diabetes mellitus: the STOP-NIDDM randomised trial. Lancet. 2002;359(9323):2072–2077. | |
Eriksson J, Lindstrom J, Valle T, et al. Prevention of Type II diabetes in subjects with impaired glucose tolerance: the Diabetes Prevention Study (DPS) in Finland. Study design and 1-year interim report on the feasibility of the lifestyle intervention programme. Diabetologia. 1999;42(7):793–801. | |
DREAM (Diabetes REduction Assessment with ramipril and rosiglitazone Medication) Trial Investigators, Gerstein HC, Yusuf S, et al. Effect of rosiglitazone on the frequency of diabetes in patients with impaired glucose tolerance or impaired fasting glucose: a randomised controlled trial. Lancet. 2006;368(9541):1096–1105. | |
American College of Physicians. How is a Shortage of Primary Care Physicians Affecting the Quality and Cost of Medical Care? Philadelphia: American College of Physicians White Paper; 2008. Available from: https://www.acponline.org/advocacy/current_policy_papers/assets/primary_shortage.pdf. Accessed July 11, 2015. | |
Bodenheimer T. Primary care – will it survive? N Engl J Med. 2006; 355(9):861–864. | |
Colwill JM, Cultice JM, Kruse RL. Will generalist physician supply meet demands of an increasing and aging population? Health Aff (Millwood). 2008;27(3):w232–w241. | |
Phillips LS, Branch WT, Cook CB, et al. Clinical inertia. Ann Intern Med. 2001;135(9):825–834. | |
Grant RW, Cagliero E, Dubey AK, et al. Clinical inertia in the management of Type 2 diabetes metabolic risk factors. Diabet Med. 2004;21(2):150–155. | |
van Bruggen R, Gorter K, Stolk R, Klungel O, Rutten G. Clinical inertia in general practice: widespread and related to the outcome of diabetes care. Fam Pract. 2009;26(6):428–436. | |
Kolberg JA, Jorgensen T, Gerwien RW, et al. Development of a type 2 diabetes risk model from a panel of serum biomarkers from the Inter99 cohort. Diabetes Care. 2009;32(7):1207–1212. | |
Lyssenko V, Jorgensen T, Gerwien RW, et al. Validation of a multi-marker model for the prediction of incident type 2 diabetes mellitus: combined results of the Inter99 and Botnia studies. Diab Vasc Dis Res. 2012;9(1):59–67. | |
Rowe MW, Bergman RN, Wagenknecht LE, Kolberg JA. Performance of a multi-marker Diabetes Risk Score in the Insulin Resistance Atherosclerosis Study (IRAS), a multi-ethnic US cohort. Diabetes Metab Res Rev. 2012;28(6):519–526. | |
Shafizadeh TB, Moler EJ, Kolberg JA, et al. Comparison of accuracy of diabetes risk score and components of the metabolic syndrome in assessing risk of incident type 2 diabetes in Inter99 cohort. PLoS One. 2011;6(7):e22863. | |
Urdea M, Kolberg J, Wilber J, et al. Validation of a multimarker model for assessing risk of type 2 diabetes from a five-year prospective study of 6784 Danish people (Inter99). J Diabetes Sci Technol. 2009;3(4):748–755. | |
Watkins SM, Rowe MW, Kolberg JA, Wagenknecht LE, Bergman RN. Biomarker models as Surrogates for the Disposition index in the Insulin Resistance Atherosclerosis Study. Diabet Med. 2012;29(11):1399–1406. |
 © 2015 The Author(s). This work is published and licensed by Dove Medical Press Limited. The full terms of this license are available at https://www.dovepress.com/terms.php and incorporate the Creative Commons Attribution - Non Commercial (unported, v3.0) License.
By accessing the work you hereby accept the Terms. Non-commercial uses of the work are permitted without any further permission from Dove Medical Press Limited, provided the work is properly attributed. For permission for commercial use of this work, please see paragraphs 4.2 and 5 of our Terms.
© 2015 The Author(s). This work is published and licensed by Dove Medical Press Limited. The full terms of this license are available at https://www.dovepress.com/terms.php and incorporate the Creative Commons Attribution - Non Commercial (unported, v3.0) License.
By accessing the work you hereby accept the Terms. Non-commercial uses of the work are permitted without any further permission from Dove Medical Press Limited, provided the work is properly attributed. For permission for commercial use of this work, please see paragraphs 4.2 and 5 of our Terms.