")
Back to Journals » Patient Preference and Adherence » Volume 14
An Evaluation of the Video Narrative Technique on the Self-Efficacy of Medication Understanding and Use Among Post-Stroke Patients: A Randomized-Controlled Trial
Authors Appalasamy JR, Quek KF, Md Zain AZ , Joseph JP, Seeta Ramaiah S, Tha KK
Received 14 March 2020
Accepted for publication 28 July 2020
Published 16 October 2020 Volume 2020:14 Pages 1979—1990
DOI https://doi.org/10.2147/PPA.S253918
Checked for plagiarism Yes
Review by Single anonymous peer review
Peer reviewer comments 2
Editor who approved publication: Dr Johnny Chen
Supplementary video 1 presented by Siva Seeta Ramaiah.
Views: 147
Jamuna Rani Appalasamy,1,2 Kia Fatt Quek,1 Anuar Zaini Md Zain,1 Joyce Pauline Joseph,3 Siva Seeta Ramaiah,4 Kyi Kyi Tha1
1Jeffrey Cheah School of Medicine and Health Sciences, Monash University Malaysia, Bandar Sunway, Selangor, Malaysia; 2School of Pharmacy, Monash University Malaysia, Bandar Sunway, Selangor, Malaysia; 3Department of Neurology, Hospital Kuala Lumpur, Ministry of Health, Kuala Lumpur, Malaysia; 4Medical Department, Subang Jaya Medical Center, Sunway, Malaysia
Correspondence: Kyi Kyi Tha Tel: +60 355145623
Email [email protected]
Introduction: Self-efficacy is positively associated with medication understanding and use self-efficacy (MUSE) among post-stroke patients. It is also closely related to knowledge, belief, and perception, which vary among people from different socioeconomic backgrounds and cultures. As interventions using video and peer stories have emerged to be successful on behavior modification, this study aimed to explore the effectiveness of video narratives incorporated with Health Belief constructs on MUSE and its associated factors among patients with stroke at a local setting.
Methods: A randomized controlled trial (RCT) for 12 months was carried out on patients diagnosed with stroke at Hospital Kuala Lumpur, Malaysia. The RCT recruited up to 216 eligible patients who were requested to return for two more follow-ups within six months. Consented patients were randomized to either standard care or intervention with video narratives. The control of potential confounding factors was ensured, as well as unbiased treatment review with prescribed medications, only obtained onsite.
Results and Discussion: A repeated measure of MUSE mean score differences at T0 (baseline), T2 (6th month) and T4 (12th month) for antithrombotic, antihypertensive, and all medication categories indicated significant within and between groups differences in the intervention group (p< 0.05). Moreover, this impact was reflected upon continuous blood pressure (BP) monitoring compared to the control group (F (1214) =5.23, p=0.023, ƞ2=0.024). Though BP measure differences were non-significant between the groups (p=0.552), repeated measure analysis displayed significant mean differences between intervention and control group on BP control over time (F (1.344, 287.55) =8.54, P< 0.001, ƞ2=0.038). Similarly, the intervention’s positive impact was also present with similar trends for knowledge, illness perception, and the belief about medicine. Though significant differences (p< 0.05) of all outcome measures gradually decreased between T2 and T4 in the intervention group; nevertheless, these positive findings confirmed that personalized video narratives were able to motivate and influence MUSE and its associated factors among post-stroke patients. The significant improvement in medication-taking self-efficacy and the sustenance of BP monitoring habits among patients in the intervention group strengthened our conceptual framework’s practicality.
Keywords: video narratives, Health Belief Model, medication understanding and use self-efficacy, patient education, randomized controlled trial, stroke
Plain Language Summary
Health care professionals had always found it a huge task to exert appropriate self-efficacy habits in managing prescribed medication among patients with stroke. Furthermore, socioeconomic and cultural differences add more barriers between them. The video narratives technique is a promising tool to improve medication-taking issues, but it was untested among post-stroke patients in Malaysia. Hence, we ran a one-year trial of the video narrative intervention on these patients, separated into two groups. The control group received the hospital’s standard care, whereas the trial group received similar care and the intervention. The trial’s impact was on behavioral changes, especially on the self-efficacy of understanding and taking medication appropriately, blood pressure control and monitoring habits, and other factors, such as knowledge retention, illness perception, and medication beliefs. As per speculation, the video narratives had successfully induced an improvement in the targeted behavior changes, which gradually sustained until the completion of the trial compared to the control group. We believed that the persuasive tone and personalized peer messages would have contributed to this progress. Though limitation existed, the video narratives technique has proven its benefit and practicality among post-stroke patients with specific needs such as motivation, and resilience.
Introduction
Stroke is the second common cause of deaths and disability occurrences worldwide.1 It causes a significant impact in a developing country like Malaysia.2 Approximately 23% of stroke cases were stroke recurrence, and one of its contributing factors was treatment nonadherence.2–4 Despite many efforts in the ‘stroke and its risk factor-patient education innovation’ revolving medication adherence, medication understanding, and taking behavioral issues remains a challenge for many healthcare professionals. It is because the health-related behavioral modification involves the individuals’ and social perception towards their illness and its preventative measures. Moreover, the patients’ past experiences and willingness to change influence these perceptions.5 Therefore, the self-efficacy concept is believed to be a trigger factor towards proactivity and positive healthcare actions. This concept has been implemented in numerous patient education strategies with measurable outcomes.6
However, these interventions have had mixed results due to methodology and population heterogeneity. Also, programs that target specific needs would require emotional and cultural touch apart from being only conceptually applicable to be effective.7 Thus, narrative communication would deliver a suitable mechanism in influencing the listeners as they actively engage with the information or story. Therefore, inspired by these knowledge gaps, the researchers pursued to experiment on motivational narratives of a neurologist and a patient to encourage post-stroke patients’ self-efficacy in medication understanding and its appropriate usage.
It has become apparent that successful engagement is portrayed by persistence towards the delivered messages compared to cognitive justification.8 Nevertheless, to obtain a good ratio of patient education engagement depends very much on its presentation form. Studies have shown that we get absorbed and focused better via visual and hearing senses.9 Behavioral modification research found that multimedia in an audio-visual format was an effective approach.10 Hence, narratives incorporated with behavioral health constructs, delivered in a video format could be an appropriate strategy for addressing medication-taking issues that lack self-efficacy in medication understanding and use (MUSE). With all this information in hand, the researchers hypothesized that this intervention would have an effect or significant change on MUSE over the 12 months trial period.
Materials and Methods
Study Design
A single-blind, randomized controlled trial (RCT) was conducted among 216 post-stroke patients who were randomly assigned to receive either a combination of video narratives and the standard care intervention or standard care alone. The main assumption was that patients who received the intervention would perceive a better MUSE, compared to the control group patients. The intervention was delivered at baseline: T0, three months: T1, and six months: T2. Whereas, RCT outcomes were only ascertained at baseline: T0, six months: T2, and 12 months: T4 as per feasibility and acceptability study feedback on patients’ varied clinic follow-up period, which spanned between four to five months. Figure 1 depicts the trial’s summarized flow chart.
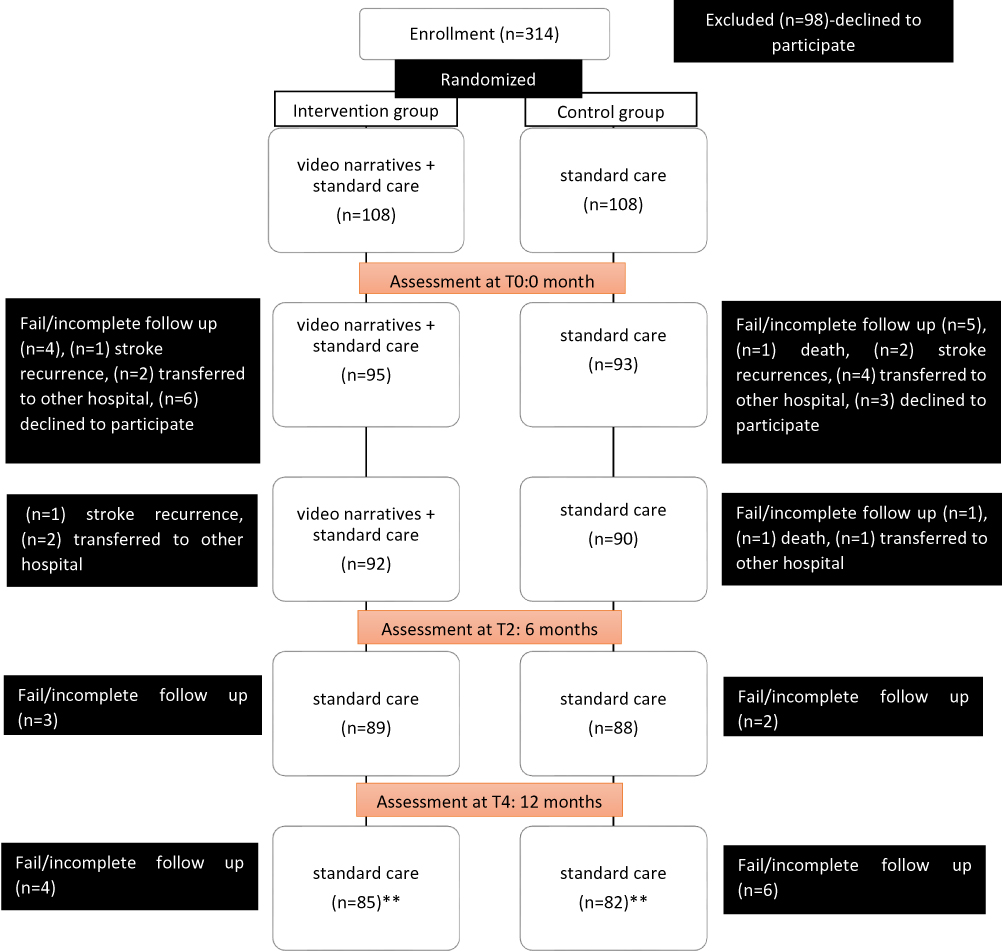 |
Figure 1 Flowchart of the trial. **Patients available for analysis. Nevertheless, intention-to-treat analysis (ITT) was undertaken. Therefore, finalized number of patients for analysis were 108 of them from each group. |
The design and conduct of the trial adhered to the revised Consolidated Standards of Reporting (CONSORT) guidelines11 and to the Standard Protocol Items: Recommendations for Interventional Trials (SPIRIT).12 Whereas the study procedures were approved by the Malaysian Medical Research and Ethics Committee—MREC (NMRR ID-15-851-24,737) and the Monash University Human Research Ethics Committee—MUHREC (ID 9640), followed by the trial’s registration with the Australian New Zealand Clinical Trials Registry—ANZCTR (ACTRN12618000174280), Universal Trial Number (UTN) U1111-1201-3955. The trial was conducted in accordance with the Declaration of Helsinki. The trial’s protocol has been published previously.13
Study Population
Informed and written, consented patients were from the outpatient Neurology Clinic at Hospital Kuala Lumpur (HKL). HKL receives a high referral number of stroke patients from many areas around Klang Valley and other areas in Malaysia. The study included patients who are adults, aged 18 years and above, of satisfactory literacy and those who received the diagnosis of their first stroke within six months of the recruitment period. As most patients were primarily hypertensive, it was essential to include patients who were also prescribed antithrombotic and antihypertensive medication. However, only those who were able to comprehend in English or Malay language were eligible in the trial. Besides, those patients with cognitive impairment or psychological issues (Patient Health Questionnaire; PHQ-9 score ≥1 and Montreal Cognitive Assessment; MoCA score <26) were not eligible for participation.
Sample Size
Sample size estimation conferred to average effect sizes from comparable studies associated with parallel behavioral modification framework.14–17 Therefore, with the inclusion of 0.05 alpha, and with the power of 0.80, the RCT required 100 patients in each group.18 However, the study targeted to recruit about 230 patients for a projected 10–15% attrition rate.
Randomization and Study Procedures
A staff nurse who was not involved in the trial randomly allocated patients to either the control or intervention group. The assignment was from a list of number blocks of varying lengths, placed in opaque envelopes to ease randomization and avoid bias. These procedures took place as post-baseline screening. Patients from the control group received ongoing referrals within various healthcare departments, eg, rehabilitation, speech therapy, medication and nutritional counseling, Medication Therapeutic and Adherence Clinic (MTAC), and short message service (SMS) appointment reminders. The neurologists also observed patients’ clinic appointment attendance and advised their patients to perform self-care monitoring. Apart from this, only the intervention group received face-to-face video narratives. Nevertheless, both groups were given printed materials on stroke treatment. They participated in the “teach-back-method” by the clinical pharmacist to moderate the knowledge and health literacy inconsistencies between both groups.19,20 Reminders were sent to all patients up to three times to retain trial participation. However, those who failed to respond were considered as a drop-out. Nonetheless, there were no occurrences of un-blinding of the patient’s allocation. Therefore, respective groups underwent similar study procedures, whereby; patients first met their neurologists, then continued with blood pressure assessment and performed self-administered outcome measurement. Several minutes consequently, only those allocated to the intervention group were followed-up with video viewing at allocated timelines as depicted in Figure 1.
The Intervention
Based on post-stroke patients’ needs in Malaysia,21 two sets of video narratives (in English and the Malay language) were previously designed to enhance MUSE.23 (Video 1, Video 2, Video 3 and Video 4). The behavioral constructs of the Health Belief Model (HBM)22 built a connected storyline which depicted a neurologist perspective on illness and treatment and a patient’s experiences in dealing successfully with stroke recovery. The scripts were initially developed in English and then translated into the Malay language. Following that, the back translation process by a linguistic expert validated the consistency of sentences and meanings. Finally, an expert panel of doctors, pharmacists, educationists, and stroke patients reviewed and edited the scripts and videos several times. The short messages were culturally appropriate quotes to increase patients’ awareness and to change negative perceptions. The motivational messages focused on self-efficacy, especially in self-managing prescribed medication and stroke risk factors. Hence, to strengthen the engagement aspects of statements, both; an actual neurologist and a post-stroke survivor rendered their narratives with authentic feelings. Common themes encompassed the narratives; nevertheless, each story focused on different perceived angles and tones.
Outcomes
The main outcome was the observation of changes in MUSE. It is an “eight-item Likert-scale,” which measures a patient’s self-efficacy perception in understanding and taking their medication. Patients were either asked to choose (using the Strongly Disagree (1); Slightly Disagree (2); Slightly Agree (3), and Strongly Agree (4) response options), or, otherwise asked if they disagree or agree with the statement which then branches out further if they Strongly or Slightly Disagree or Agree. For example, if a patient answered “Strongly disagree” to every single item, his or her score would be 8. Whereas, if they selected “Strongly agree” to every single item, their score would be 32. MUSE has good internal consistency (Cronbach’s alpha >0.7) with acceptable construct and predictive validity. It was applied for three medication categories; antithrombotic, antihypertensive, and “all prescribed medication” to evaluate in-depth differences between these groupings.24 Nevertheless, given that MUSE is closely linked to knowledge, perception, and belief of every individual,4 secondary validated measures were necessary, to be able to understand the video narratives’ impact on modifiable dependent factors.
The Stroke Knowledge Test (SKT), a self-administered questionnaire was used to assess patients’ knowledge of stroke illness and its treatment. It consists of 20 items with scores between 0 to 20 to estimate knowledge level differences between individuals and groups.25,26 Whereas, the Brief Illness Perception Questionnaire (BIPQ)27,28 and the Belief about Medicine Questionnaire (BMQ)29,30 have been globally used in various healthcare settings to measure patients’ illness perception and beliefs towards their prescribed medication. The BIPQ consists a “nine-items” with eight items of Likert scale scoring range from “0 to 10ʹ, which represents patients” attitudes and concerns about their disease whereby total higher scores reflect threatening views of illness. Similarly, the BMQ 18-item questionnaire uses scales that measure medication beliefs in general and specific concepts about medicine of a disease condition. Ascending total scores of >47 signifies sturdier negative beliefs about medicine.
The self-report of BP self-monitoring frequency was also documented per visit at allocated timelines. We hypothesized that positive behavior changes in MUSE would reflect on patients being more concerned of stroke risk prevention. Hence, there would be a rise in blood pressure (BP) self-monitoring activity, translating their effort on BP control. The patients’ “last two” averaged systolic and diastolic blood pressure readings were taken using similar calibrated blood pressure measurement devices at the neurology clinics. BP control, according to stroke guidelines, was considered as at or below 140/90 mmHg for patients with no diabetes, while for those with diabetes, the BP control is as at or below 130/80 mmHg.31,32
Data Handling and Analysis
Two independent researchers, blinded to randomization, performed data entry and verification. The researchers ensured data confidentiality and appropriate safekeeping in the repository center (Lab Archives), of Monash University Malaysia. Statistical analysis was conducted using IBM SPSS Statistics V.24.0 with P<0.05 as the significance level. The preliminary analysis consisted of descriptive statistics as means and SDs or frequency distributions of demographic and clinical characteristics. Chi-square (χ2) or equivalent analysis concluded the association between categorical variables, whereas, independent t-test or equivalent analysis confirmed the mean differences of continuous outcome variables. The two-way repeated measures of Multivariate Analysis of Variance (MANOVA) determined variances in multiple dependent variables over three-time points data; baseline: T0, six months: T2, and 12 months: T4. Data were evaluated based on an intention-to-treat analysis, with the application of Last Observation Carried Forward (LOCF) principles.33
Results
Patient Characteristics
More than 450 patients went through the screening phase during RCT recruitment, but only 314 patients were eligible for the trial. From this number of patients, 98 of them declined their consent to participate. The common reasons for refusing enrolment were language barriers and fear of commitment or stress. However, during the 12 months’ follow-up, the trial experienced a dropout-rate of (49/216) 22.7%. The most reasons for trial incompletion were loss of contact and patients transferred to other hospitals.
Table 1 presents the socio-demographic data of patients randomized at baseline. There were no significant differences in variable and socio-demographic characteristics between both groups except for ethnicity (p=0.046). There were about 20% more male patients than females with the dominance of a higher number of the Malay race in both groups (>50%). Patients were between 20 and 90 years old, with a majority of about 80% completed secondary education. This percentage adds on with almost similar adequate health literacy percentages but with higher unemployment rates (>60%). A majority of patients (>90%) had an ischemic stroke with primary hypertension. On average, 60% of them also had diabetes, and many suffered from several underlying stroke risk factors, eg, hyperlipidemia and arrhythmia. Slightly more than 80% of patients were prescribed with three or more types of stroke preventative medication. However, lifestyle factors such as diet and obesity were not inclusive in the list due to incomplete medical history documentation. The mean MUSE score (<24) of both groups indicated inadequate perceived understanding and use self-efficacy, and the score of BIPQ and BMQ (≥50) between them paralleled higher threat of illness and negative belief about medicine. Both groups presented with limited stroke knowledge score (<10), poor BP control (≥140mmHg), and reported an average of two times per week of BP self-monitoring. All data were multivariate normally distributed.
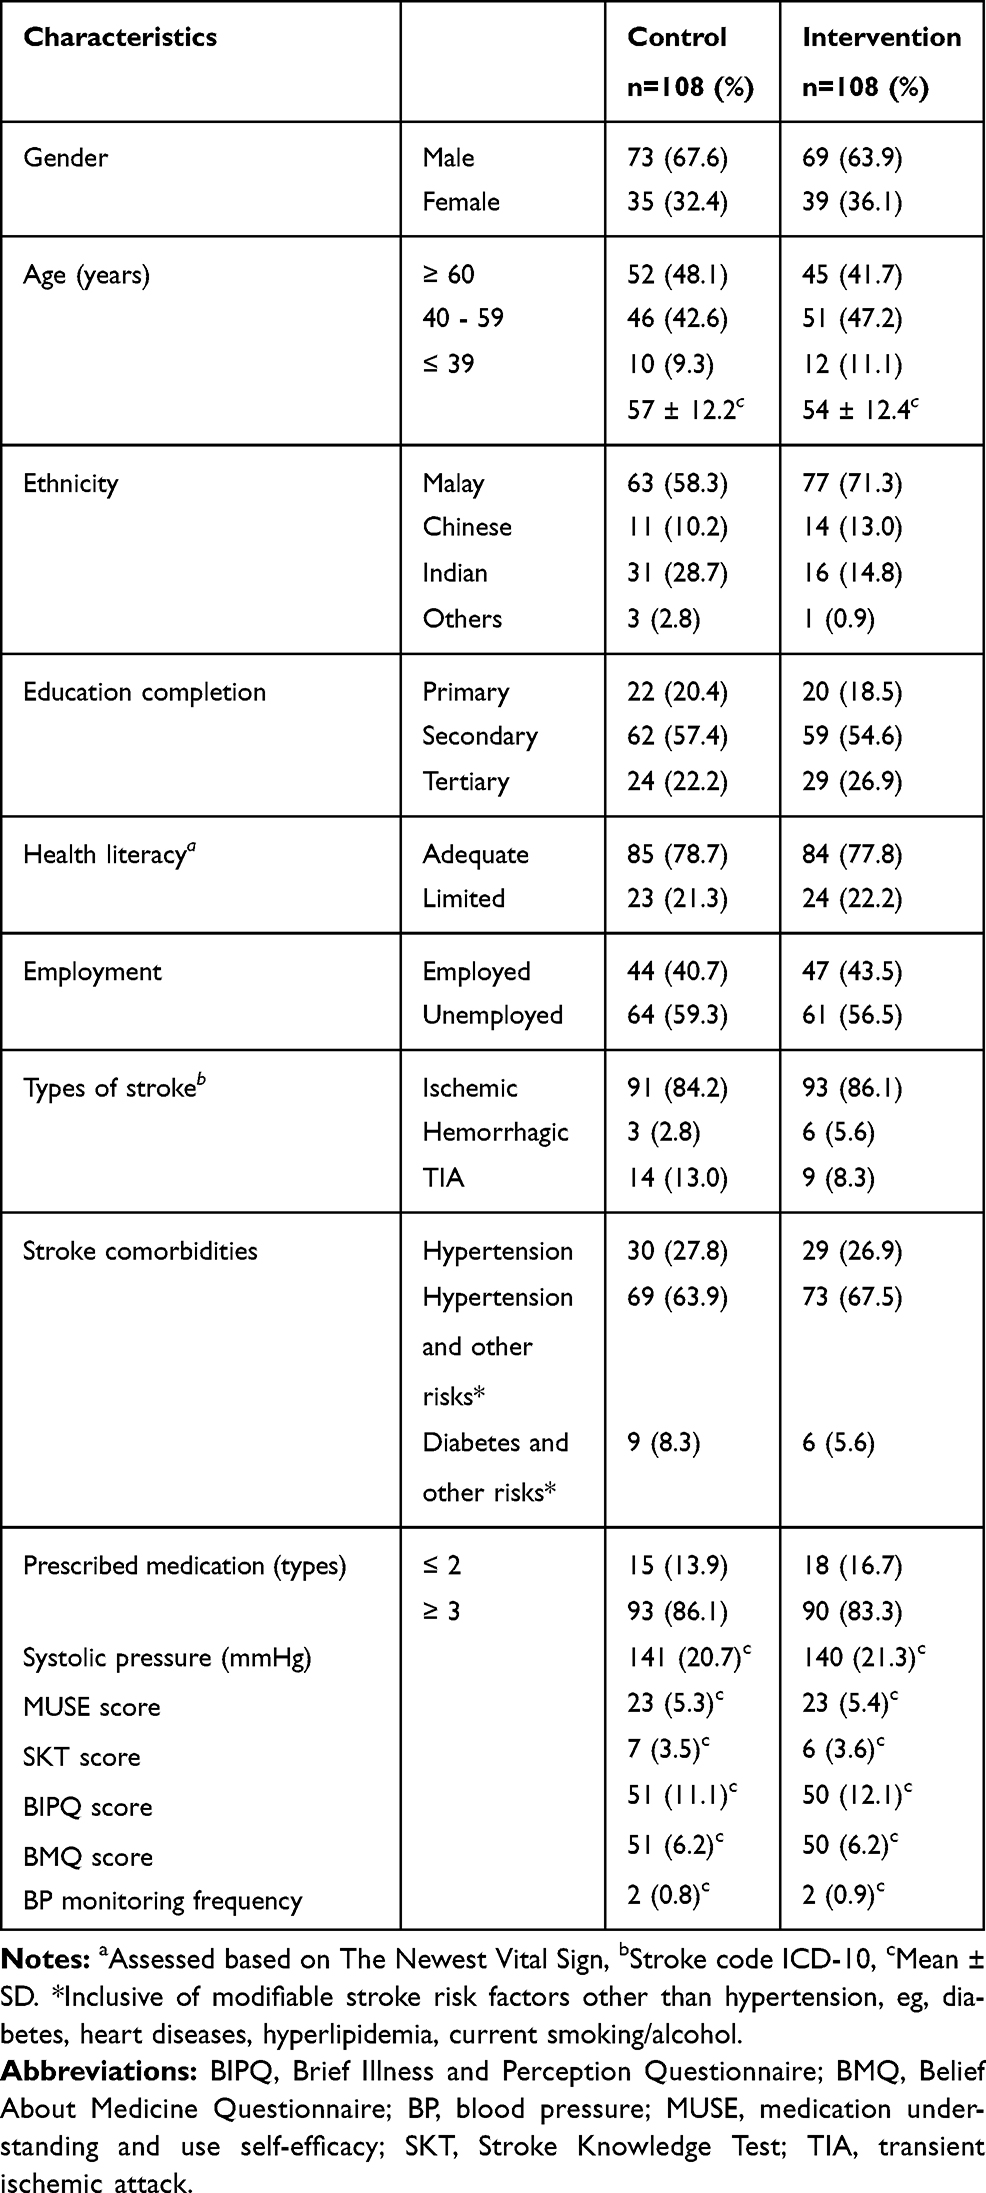 |
Table 1 Socio-Demographic Data of Patients at Baseline (n=216) |
The Intervention’s Effect on MUSE and Its Associated Factors at T0, T2, and T4 Among Post-Stroke Patients
Repeated measures MANOVA analysis revealed that there was a significant difference between intervention and control group when considered an overall effect of the viewing of behavioral health-constructs-incorporated video narratives on MUSE and its associated factors, Roy’s Largest Root=1.201, F (16,199) =14.94, p<0.001, ƞ2=0.546. A weak relationship, r= (0–0.3, p<0.05) coexisted between demographic variables (age, gender, and health literacy) and several outcome measures such as MUSE and BP monitoring; nevertheless, a temporal relationship could not be established and unreliable due to uneven ratio in the samples. Hence, univariate analysis of the intervention’s effect on outcome measures and behavioral changes is described further in the following sections.
Impact on MUSE Categorical Scores and BP Control
The difference between both groups on MUSE categories overtime was significant for “all prescribed medication” (F (1.543, 330.30) =42.99, p<0.001, ƞ2=0.167), antithrombotic (F (1.279, 273.76) =6.91, p=0.005, ƞ2=0.205), and antihypertensive (F (1.24, 264.39) =12.22, p<0.001, ƞ2=0.195) (Table 2). We also observed significant mean score differences between the intervention and control group for these categories; (F (1214) =12.41, p=0.001, ƞ2=0.055), (F (1214) =5.10, p=0.025, ƞ2=0.023), and (F (1214) =7.25, p=0.008, ƞ2=0.033) respectively. Nevertheless, a post hoc pairwise comparison using Bonferroni correction discovered only improved significant score differences (p<0.025) between baseline assessment (T0) and six months follow-up (T2) in both groups for the three categories (Table 3). On the other hand, except for the “all prescribed medication” MUSE intervention group category, the antithrombotic and antihypertensive categories eventually leveled at significant score variances (p<0.05) between T2 and T4 (12 months follow-up). However, the control group’s score differences did not reach significance between T2 and T4 (Figure 2AC).
 |
Table 2 Groups’ Comparison at Various Timelines |
 |
Table 3 Pair Wise Comparison Between Timelines (T0, T2, T4) |
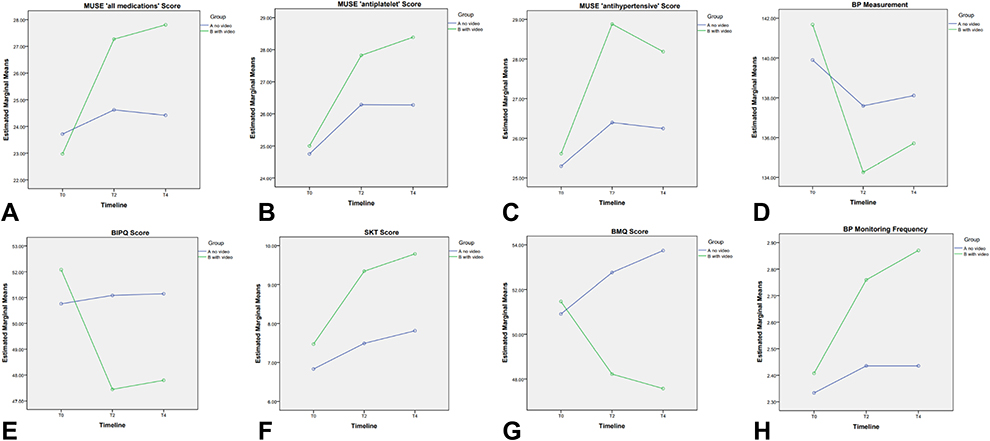 |
Figure 2 Changes in mean score, measurement and frequency of outcome measures within timeline for control and intervention groups. (A) Changes in mean score of the medication understanding and use self-efficacy (MUSE) “all medications” within timeline. (B) Changes in mean score of the medication understanding and use self-efficacy (MUSE) “antiplatelet” within timeline. (C) Changes in mean score of the medication understanding and use self-efficacy (MUSE) “antihypertensive” within timeline. (D) Changes in the blood pressure (BP) measurement within timeline. (E) Changes in mean score of the brief illness and perception questionnaire (BIPQ) within timeline. (F) Changes in mean score of the stroke knowledge test (SKT) within timeline. (G) Changes in mean score of the belief about medicine questionnaire (BMQ) within timeline. (H) Changes in the blood pressure (BP) monitoring frequency within timeline. |
Following similar trends, the BP self-monitoring also observed significant frequency differences between the intervention and control group (F (1214) =5.23, p=0.023, ƞ2=0.024) with substantial interactions between timelines and study groups (F (1.585, 339.19) =12.49, p<0.001, ƞ2=0.055) (Table 2). Furthermore, both of their post hoc pairwise comparisons showed improved significant frequency differences (p<0.05) between T0 and T2 but non-significance (p>0.05) between T2 and T4 (Table 3 and Figure 2H).
Nonetheless, the systolic BP analysis presented different trends. Within-group analysis, only the intervention group showed significant mean measurement differences (F (1.335, 142.81) =35.67, p<0.001, ƞ2=0.250) and at post hoc, pairwise comparisons of all timelines; T0 vs T2, T0 vs T4, and T2 vs T4 compared to the control group (Tables 2 and 3). Though BP measure differences were non-significant between the groups (p=0.552), repeated measure analysis displayed significant mean differences between intervention and control group on BP control over time (F (1.344, 287.55) =8.54, p<0.001, ƞ2=0.038). These results corresponded with a continuous BP control in the intervention group, as depicted in (Figure 2D).
Impact on SKT, BIPQ and BMQ Scores
Overall, the SKT evaluation of both intervention and control group presented with significant interactions between mean scores at timelines and study groups (F (1.427, 305.35) = 32.39, p<0.001, n2= 0.131) and substantial mean score differences between groups (F (1214) =11.54, p=0.001, ƞ2=0.051). Significance was also present within both groups; intervention (F (1.372, 146.81) = 137.64, p<0.001, ƞ2=0.563) and control (F (1.501, 160.58) = 42.93, p<0.001, ƞ2=0.286) respectively. Furthermore, pairwise comparisons at T0 vs T2, T0 vs T4, and T2 vs T4 of both groups resulted in substantial score differences. However, patients in the intervention group performed with higher SKT mean scores at all time-points; compared to the control group (Tables 2 and 3, and Figure 2F).
The interventions effect on BMQ scores were comparable with the SKT trends, whereby, score variance significance occurred within groups; the intervention group (F (1.474, 157.69) = 51.39, p<0.001, ƞ2= 0.251) and the control group (F (1.587, 169.78)=23.82, p<0.001, ƞ2=0.182) and for the interactions between mean scores at timelines and study groups (F (1.531, 327.69)= 71.76, p<0.001, ƞ2= 0.251). As well as, substantial mean score differences between groups; (F (1214) =15.93, p<0.001, ƞ2=0.069) (Table 2). Figure 2G illustrates an opposing gradual increment of average means between both groups, which reflected the significant post hoc pairwise comparison (p<0.05) between T0 vs T2 and T0 vs T4 for both of the groups.
On the other hand, the BIPQ score analysis showed diverse trends. The control group showed no significant differences for neither within groups nor post hoc pairwise contrasts compared to the intervention group. Nevertheless, there were no significant score differences (p>0.05) between both groups too. However, Figure 2E depicts a notable decrease in the mean score, which reflected significant score differences within the intervention group (F (1.688, 180.63) = 53.84, p<0.001, ƞ2=0.335) and remarkable pairwise comparisons between baseline scores and six months’ follow-up. Furthermore, significant interactions between mean scores at all timelines and study groups (F (1.600, 342.36) =34.16, p<0.001, ƞ2=0.104) were documented (Tables 2 and 3).
Discussion
As per our knowledge, this is the first RCT of a video narrative intervention for post-stroke patients in Malaysia. Moreover, the video narratives had a notable effect on those diagnosed with first ischemic stroke incidence and were primarily hypertensive. The narratives which were incorporated with HBM constructs and catered post-stroke patients’ needs have necessitated a relatively positive impact on MUSE and other associated factors such as SKT, BMQ, and BIPQ compared to the control group. The intervention successfully assisted post-stroke patients in maintaining BP control, perhaps through behavioral regulation to being self-efficacious and proactive in illness management. It was also possible that the advantage of having culturally appropriate narrators and empathizing tones broke the language barriers whereas, the “highlighted” quotes, which acted as meaningful cues to action, motivated patients to change their illness and treatment perception or belief.
According to a review paper, the authors concluded that there were limited evidence to determine the effectiveness of narrative communication moreover the audio-visual technique as a tool for behavior change.34 Although there were no trials or lack evidence about the theoretical and conceptual framework efficacy comparable to our study population at this point in time, we propose some explanation with relevant studies to support our findings. A previous study on narrative communication with cancer patients suggested that the para-social interaction mediated by narrators in mass media advocated behavior-change quotes that created the feeling of being understood by peers among the patients.35 Similarly, another research work on a storytelling method enhanced realism by trained actors heightened the awareness and satisfactory BP control among their hypertensive patients.36 Therefore, it was concluded that the actual “storytellers” of a doctor and a patient in this RCT have succeeded in decreasing cognitive resistance37 and allowed changes in beliefs and perceptions among post-stroke patients.
The personalized HBM content according to patients’ needs influenced the behavioral entity of self-efficacy in understanding and taking medication which also warranted the applicability of HBM constructs among hypertensive-stroke risk patients.38 A simple bivariate analysis discovered that there was some correlation (r= 0–0.3, p<0.05) between MUSE and BP monitoring activity, that sustained until trial completion. A similar trend was also with beliefs about illness and its treatment. The findings deduced that most of the primarily hypertensive patients sensed the same connections towards our storyteller, who himself experienced a major ischemic stroke caused by uncontrolled hypertension. Therefore, the narratives’ persuasion impact reflected in the gradual improvement of the perceived MUSE categorical outcomes and BP monitoring activity. We established an understanding of the narratives’ promotion of homophily, from an observation on the prolonged behavior sustenance period of specific MUSE categorical outcomes.35 This conclusion was based on a systematic review of behavioral interventions39 that documented similarity of systolic blood pressure mean reduction for patients from the intervention group.
Health literacy is a predictive factor of education retention among patients with stroke.40 A bivariate analysis of our RCT data confirms this linear relationship. Also, a previous work of ours in a similar patient population discovered that MUSE is positively associated with health literacy, illness perception, and treatment beliefs.4 Hence, there was some evidence to elucidate the efficacy of the behavioral and motivational framework and use of media technology of this trial resulting in rapid improvements in SKT, BIPQ, and BMQ.
During the RCT patient recruitment, though health literacy was adequate among post-stroke patients, the SKT baseline scores indicated limited stroke knowledge, demonstrating a lack of information reinforcement. The continuous exposure to informational brochures and counseling services provided by the hospital staff improved the SKT mean score in both groups. Nevertheless, the intervention group maintained a better SKT score improvement compared to their counterpart. This phenomenon is clearly explained by Wise et al, who researched the didactic and narrative approaches to improve health outcomes. The authors deduced that narratives enabled a better reinforcement of knowledge that patients retrieved initially compared to the didactic approach alone.41 This approach was also supported by a recent study on learning pedagogy using digital storytelling.42 Thus, the video narratives intervention had successfully induced a fortified method of understanding the management of illness.
According to the Social Learning Theory by Albert Bandura, our cognitive process is versatile to various inputs which contributes to the acquisition of new behaviors or skills.43 Therefore, the habit of frequent BP monitoring with appropriate medication management created a learning opportunity for patients, eg, adhering to antihypertensive medication to reduce their blood pressure, which led to improved scores. The style of managing their medication differs individually. Still, BIPQ and BMQ outcome measures managed to capture the intervention’s continuous positive impact with regards to enhanced illness perception and treatment belief. The possible mechanism of these findings could be associated with the “principles of foresight” which debates between patients will power and rational action as in this context for a better health outcome.44 Speaking of which, stroke survivors, especially with disabilities or with various comorbidities, would require tremendous effort and psychology stability to prepare for prolonged time improvement rather than being impatient and relying on short rewards. Furthermore, external social influence plays a vital role in developing the appropriate “rational” thoughts on the purpose of improving one’s illness. Hence, the video narratives provided a motivational platform and a useful reminder for patients to be resilient and continue to learn via the rewards of learned skills. Hence, repeated viewing of the video is needed to sustain the impact on health and medication-taking behavior.
Study Strengths and Limitation
Patients with stroke require unique strategies that aptly address diverse personal cognitive and emotional demands regarding external barriers such as language, culture, and belief apart from institutional healthcare facilities. Thus, this trial focused on a behavioral modification approach to overcome major personal obstacles, eg, self-efficacy, motivation, and negative illness and its treatment perception.21 Through the qualitative feedback,23 the patients appreciated the healthcare professional who helped them increase the awareness of illness management and stroke prevention. They were receptive of the audio-visuals featuring their pain and challenges, moreover, towards their peer, who boldly stepped forward to share his success and strength in managing his stroke condition. Thus, the integration of behavioral and motivational theories with an adaptation of the Information-Motivation-Behavior framework and media technology has reflected noble translational research in an actual healthcare setting. The intervention aimed to develop a potential tool to assist the behavioral modification component of the Medication Therapy Adherence Clinic (MTAC) services in line with patient education strategy. Furthermore, this trial well identified and adapted specific outcome measures, especially MUSE, which was also a potential predictor of medication adherence.4
Nevertheless, this study has its limitations. More than 15% of the estimated attrition rate could have affected estimates of effect size for the intervention. These RCT findings may also not apply to other post-stroke patient populations seeking treatment in different settings such as primary health clinics and private medical centers. Furthermore, due to time and lack of funding support, the full understanding of the intervention’s sustainability was inadequate, though the frequency and duration of exposure were within the ideal period.45 Nonetheless, there were difficulties in maintaining a face-to-face video-viewing gap period of 3 months due to changes in patients’ appointment dates. Besides, changes in prescribing practice of antihypertensive medications during the appointment gaps could have affect BP measurement sustenance. Following this setback, the researcher had no video narratives translated in the Mandarin or Tamil languages, which could have optioned out eligible patients who would have benefitted using the tool. The significant ethnicity differences between groups could have also contributed as a confounding factor. Other than that, there was a likelihood that patients were looking forward to new videos, which could have hampered their follow-up interest. On top of that, the study received a high-unfilled non-response rate for the Short Form (36) Health Survey (SF36) that was unforeseen in a previous feasibility study. Besides, limited sample size and lack of other blood parameter data, eg, HbA1c, fasting blood glucose, lipid profile, and INR, hindered further stratified analysis of each video’s effect on various patients’ group characteristics. Even so, possibilities existed that concurrent service and care from HKL may have been present as bias or threat to the effect on knowledge retention and systolic blood pressure management. Nevertheless, despite all these limitations, the significant improvement in medication-taking self-efficacy, belief of illness, and its treatment in the intervention group and BP monitoring habit strengthened the practicality of our conceptual framework.
Conclusion
This trial was an opportunity of a translational research discovery of “theory to practice” whereby we tested the applicability of the intervention in an actual healthcare setting. Hence, our future research direction aims to explore affordable media technologies which could be accessed by specific patient populations with various beliefs and socioeconomic background. However, even though the narrative contents may be irrelevant to other cultures or specific illness conditions, the conceptual framework, feasibility, and storytelling concepts could be easily personalized to other chronic diseases. This scenario indicates a prerequisite for a future trial of innovative patient education interventions with more unrelenting power-on behavior modification. However, the option is upon researchers’ discretion and consideration of the needs of the target population.
Data Sharing Statement
All data are not publicly available to maintain patient record confidentiality and are within the judiciary of the Director General of Health Malaysia.
Acknowledgments
The authors would like to thank the Jeffrey Cheah School of Medicine and Health Sciences, Monash University Malaysia, for their facilities support. The authors wish to acknowledge the contributions of all healthcare staff and patients from the Neurology Clinic, Hospital Kuala Lumpur. We want to thank the Director-General of Health Malaysia for his permission to publish this article. This study was part of Jamuna’s research in fulfillment of her Ph.D. from Monash University.
Disclosure
The authors report no conflicts of interest in this work.
References
1. Krishnamurthi RV, Ikeda T, Feigin VL. Global, regional and country-specific burden of ischaemic stroke, intracerebral haemorrhage and subarachnoid haemorrhage: a systematic analysis of the global burden of disease study 2017. Neuroepidemiology. 2020;54(2):171–179. doi:10.1159/000506396
2. Loo KW, Gan SH. Burden of stroke in Malaysia. Int J Stroke. 2012;7(2):165–167. doi:10.1111/j.1747-4949.2011.00767.x
3. Ganasegeran K, Rashid A. The prevalence of medication nonadherence in post-myocardial infarction survivors and its perceived barriers and psychological correlates: a cross-sectional study in a cardiac health facility in Malaysia. Patient Prefer Adherence. 2017;11:1975–1985. doi:10.2147/ppa.s151053
4. Appalasamy JR, Joseph JP, Ramaiah SS, Quek KF, Zain AZM, Kyitha K. Exploring stroke survivors’ self-efficacy in understanding and taking medication and determining associated factors: a cross-sectional study in a neurology clinic in Malaysia. Patient Prefer Adherence. 2019;13:1463–1475. doi:10.2147/ppa.s215271
5. Costa E, Pecorelli S, Giardini A, et al. Interventional tools to improve medication adherence: review of literature. Patient Prefer Adherence. 2015:1303. doi:10.2147/ppa.s87551.
6. Dale LP, Whittaker R, Jiang Y, Stewart R, Rolleston A, Maddison R. Text message and internet support for coronary heart disease self-management: results from the text4heart randomized controlled trial. J Med Internet Res. 2015;17:10. doi:10.2196/jmir.4944
7. Schulz AJ, Kannan S, Dvonch JT, et al. Social and physical environments and disparities in risk for cardiovascular disease: the healthy environments partnership conceptual model. Environ Health Perspect. 2005;113(12):1817–1825. doi:10.1289/ehp.7913
8. Knowles ES. Resistance and persuasion. 1st ed. Knowles ES, Linn JA, editor. New YOrk, USA: Imprint Psychology Press; 2004. doi:10.4324/9781410609816
9. Lopez EJ. The art of using visual aids. Nurse Pract. 2005;30:15–16. doi:10.1097/00006205-200500001-00007
10. Stanczyk N, Vries HD, Candel M, Muris J, Bolman C. Effectiveness of video- versus text-based computer-tailored smoking cessation interventions among smokers after one year. Prev Med. 2016;82:42–50. doi:10.1016/j.ypmed.2015.11.002
11. Hopewell S, Clarke M, Moher D, et al. Consort for reporting randomised trials in journal and conference abstracts. Lancet. 2008;371(9609):281–283. doi:10.1016/s0140-6736(07)61835-2
12. Chan A-W, Tetzlaff JM, Altman DG, et al. Spirit 2013 statement: defining standard protocol items for clinical trials. Ann Intern Med. 2013;158(3):200. doi:10.7326/0003-4819-158-3-201302050-00583
13. Appalasamy JR, Tha KK, Quek KF, Ramaiah SS, Joseph JP, Zain AZM. The effectiveness of culturally tailored video narratives on medication understanding and use self-efficacy among stroke patients. Medicine. 2018;97:22. doi:10.1097/md.0000000000010876
14. Campbell T, Dunt D, Fitzgerald JL, Gordon I. The impact of patient narratives on self-efficacy and self-care in Australians with type 2 diabetes: stage 1 results of a randomized trial. Health Promot Int. 2013;30(3):438–448. doi:10.1093/heapro/dat058
15. O’Carroll R, Whittaker J, Hamilton B, Johnston M, Sudlow C, Dennis M. Predictors of adherence to secondary preventive medication in stroke patients. Annals Behavioral Med. 2010;41(3):383–390. doi:10.1007/s12160-010-9257-6
16. Sullivan KA, Katajamaki A. Stroke education: promising effects on the health beliefs of those at risk. Top Stroke Rehabil. 2009;16(5):377–387. doi:10.1310/tsr1605-377
17. Pitthayapong S, Thiangtam W, Powwattana A, Leelacharas S, Waters CM. A community based program for family caregivers for post stroke survivors in Thailand. Asian Nurs Res. 2017;11(2):150–157. doi:10.1016/j.anr.2017.05.009
18. Faul F, Erdfelder E, Lang A-G, Buchner AG. *Power 3: a flexible statistical power analysis program for the social, behavioral, and biomedical sciences. Behav Res Methods. 2007;39(2):175–191. doi:10.3758/bf03193146
19. Porter K, Chen Y, Estabrooks P, Noel L, Bailey A, Zoellner J. Using teach-back to understand participant behavioral self-monitoring skills across health literacy level and behavioral condition. J Nutr Educ Behav. 2016;48:1. doi:10.1016/j.jneb.2015.08.012
20. Davis TC, Federman AD, Bass PF, et al. Improving patient understanding of prescription drug label instructions. J Gen Intern Med. 2008;24(1):57–62. doi:10.1007/s11606-008-0833-4
21. Appalasamy JR, Subramanian P, Tan KM, et al. Barriers of medication-taking self-efficacy among poststroke patients: qualitative study. JMIR Nursing. 2019;2:1. doi:10.2196/14399
22. Rosenstock IM, Strecher VJ, Becker MH. Social learning theory and the health belief model. Health Educ Q. 1988;15(2):175–183. doi:10.1177/109019818801500203
23. Appalasamy JR, Joseph JP, Ramaiah SS, Quek KF, Zain AZM, Tha KK. An intervention to promote medication understanding and use self-efficacy: design of video narratives for aging patients at risk of recurrent stroke. JMIR Aging. 2019;2:1. doi:10.2196/11539
24. Cameron KA, Ross EL, Clayman ML, et al. Medication understanding and use self-efficacy scale. PsycTESTS Dataset. 2010. doi:10.1037/t23013-000
25. Sullivan K, Dunton NJ. Development and validation of the stroke knowledge test. Top Stroke Rehabil. 2004;11(3):19–28. doi:10.1310/red5-v47t-8mjn-jy9h
26. Sowtali SN, Yusoff DM, Harith S, Mohamed M. Translation and validation of the Malay version of the stroke knowledge test. J Arrhythmia. 2016;32(2):112–118. doi:10.1016/j.joa.2015.10.003
27. Broadbent E, Petrie KJ, Main J, Weinman J. Brief illness perception questionnaire. PsycTESTS Dataset. 2006. doi:10.1037/t10379-000
28. Norfazilah A, Samuel A, Law P, et al. Illness perception among hypertensive patients in primary care centre UKMMC. Malays Fam Physician. 2013;8:19–25.
29. Chew B-H, Vos RC, Heijmans M, Shariff-Ghazali S, Fernandez A, Rutten GEHM. Validity and reliability of a Malay version of the brief illness perception questionnaire for patients with type 2 diabetes mellitus. BMC Med Res Methodol. 2017;17:1. doi:10.1186/s12874-017-0394-5
30. Horne R, Weinman J. Patients beliefs about prescribed medicines and their role in adherence to treatment in chronic physical illness. J Psychosom Res. 1999;47(6):555–567. doi:10.1016/s0022-3999(99)00057-4
31. Moon MA. Recurrent stroke prevention guidelines get an update. Internal Med News. 2010;43(18):38. doi:10.1016/s1097-8690(10)70936-7
32. Venketasubramanian N, Pwee KH, Chen CPL. Singapore Ministry of Health clinical practice guidelines on stroke and transient ischemic attacks. Int J Stroke. 2011;6(3):251–258. doi:10.1111/j.1747-4949.2011.00602.x
33. Little R, Kang S. Intention-to-treat analysis with treatment discontinuation and missing data in clinical trials. Stat Med. 2014;34(16):2381–2390. doi:10.1002/sim.6352
34. Hinyard LJ, Kreuter MW. Using narrative communication as a tool for health behavior change: a conceptual, theoretical, and empirical overview. Health Education Behavior. 2007;34(5):777–792. doi:10.1177/1090198106291963
35. Kreuter MW, Green MC, Cappella JN, et al. Narrative communication in cancer prevention and control: a framework to guide research and application. Annals Behavioral Med. 2007;33(3):221–235. doi:10.1007/bf02879904
36. Houston TK, Allison JJ, Sussman M, et al. Culturally appropriate storytelling to improve blood pressure. Ann Intern Med. 2011;154(2):77. doi:10.7326/0003-4819-154-2-201101180-00004
37. Slater MD. Entertainment-education and elaboration likelihood: understanding the processing of narrative persuasion. Communication Theory. 2002;12(2):173–191. doi:10.1093/ct/12.2.173
38. Yue Z, Li C, Weilin Q, Bin W. Application of the health belief model to improve the understanding of antihypertensive medication adherence among Chinese patients. Patient Educ Couns. 2015;98(5):669–673. doi:10.1016/j.pec.2015.02.007
39. Fahey T, Schroeder K, Ebrahim S. Interventions used to improve control of blood pressure in patients with hypertension. Cochrane Database Systematic Rev. 2006. doi:10.1002/14651858.cd005182.pub2
40. Sanders K, Schnepel L, Smotherman C, et al. Assessing the impact of health literacy on education retention of stroke patients. Prev Chronic Dis. 2014:11. doi:10.5888/pcd11.130259.
41. Wise M, Han JY, Shaw B, Mctavish F, Gustafson DH. Effects of using online narrative and didactic information on healthcare participation for breast cancer patients. Patient Educ Couns. 2008;70(3):348–356. doi:10.1016/j.pec.2007.11.009
42. Ezegbe BN, Eseadi C, Ede MO, et al. Rational emotive digital storytelling therapy for improving HIV/AIDS knowledge and risk perception among schoolchildren: a group randomized trial. J Rational-Emotive Cognitive-Behavior Therapy. 2019;37(4):358–374. doi:10.1007/s10942-019-00316-4
43. Bandura A, Walters RH. Social Learning and Personality Development. London: Holt: Rinehart and Winston; 1970.
44. Reach G. The mental mechanisms of patient adherence to long-term therapies. Philosophy Med. 2015. doi:10.1007/978-3-319-12265-6
45. Dormann C, Griffin MA. Optimal time lags in panel studies. Psychol Methods. 2015;20(4):489–505. doi:10.1037/met0000041
 © 2020 The Author(s). This work is published and licensed by Dove Medical Press Limited. The full terms of this license are available at https://www.dovepress.com/terms.php and incorporate the Creative Commons Attribution - Non Commercial (unported, v3.0) License.
By accessing the work you hereby accept the Terms. Non-commercial uses of the work are permitted without any further permission from Dove Medical Press Limited, provided the work is properly attributed. For permission for commercial use of this work, please see paragraphs 4.2 and 5 of our Terms.
© 2020 The Author(s). This work is published and licensed by Dove Medical Press Limited. The full terms of this license are available at https://www.dovepress.com/terms.php and incorporate the Creative Commons Attribution - Non Commercial (unported, v3.0) License.
By accessing the work you hereby accept the Terms. Non-commercial uses of the work are permitted without any further permission from Dove Medical Press Limited, provided the work is properly attributed. For permission for commercial use of this work, please see paragraphs 4.2 and 5 of our Terms.