")
Back to Journals » OncoTargets and Therapy » Volume 10
An evaluation of the clinical diagnostic value of contrast-enhanced ultrasound combined with contrast-enhanced computed tomography in space-occupying lesions of the kidney
Authors Tian W, Lu JB, Jiao D, Cong ZB
Received 23 February 2017
Accepted for publication 28 April 2017
Published 14 July 2017 Volume 2017:10 Pages 3493—3499
DOI https://doi.org/10.2147/OTT.S135500
Checked for plagiarism Yes
Review by Single anonymous peer review
Peer reviewer comments 2
Editor who approved publication: Dr Tohru Yamada
Wen Tian,1 Jianbo Lu,2 Dan Jiao,3 Zhibin Cong2
1Department of Blood Transfusion, The Second Hospital of Jilin University, 2Department of Ultrasound, Affiliated Hospital of Changchun University of Traditional Chinese Medicine, 3Department of Ultrasound, China-Japan Union Hospital of Jilin University, Changchun, Jilin, People’s Republic of China
Background: There are a variety of space-occupying lesions of the kidney, and the benign lesions may be difficult to differentiate from the malignant ones. Therefore, an accurate judgment of the benign and malignant nature of the space-occupying lesions of the kidney is of high importance for the treatment and prognosis of these patients.
Objective: To evaluate the diagnostic value of contrast-enhanced ultrasound (CEUS) combined with contrast-enhanced computed tomography (CECT) in space-occupying lesions of the kidney.
Data and methods: Three hundred and sixty-seven patients with space-occupying lesions of the kidney (378 lesions) were examined by CEUS and CECT, respectively, then, a combined diagnosis was made after the combination of CEUS and CECT by a multidisciplinary team. The diagnoses from the three methods were compared. The pathological results were taken as the gold standard. The sensitivity, specificity, positive and negative predictive values and area under the receiver operating characteristic (ROC) curve were calculated for the three methods. Thus, the diagnostic value of the three methods was assessed.
Results: Of the 378 lesions examined, there were 301 malignant lesions and 77 benign lesions. The combined examination revealed 303 malignant lesions, with 9 benign lesions mistakenly diagnosed as malignant ones; thus, the misdiagnosis rate was 11.7%. By using the combined examination, 75 benign lesions were diagnosed, with the missed diagnosis of 7 malignant lesions, so the missed diagnosis rate was 2.3%. The sensitivity, specificity, positive and negative predictive values and area under the ROC curve with the combined examination of CEUS and CECT were 97.67% (0.950–0.989), 88.31% (0.785–0.942), 97.03% (0.942–0.985), 90.67% (0.811–0.958) and 0.930 (0.887–0.973), respectively. As compared with either CEUS or CECT alone, the difference in these indicators was of statistical significance (P<0.05). The combined examination greatly improved the sensitivity, specificity and accuracy of the diagnosis of the space-occupying lesions of the kidney.
Conclusion: CEUS and CECT each have advantages and disadvantages in the diagnosis of the space-occupying lesions of the kidney. The two techniques can be used in combination to compensate for the respective defects. More salient benefits can be reaped from the combined examination than from either technique used alone.
Keywords: space-occupying lesions of the kidney, CEUS, CECT, combined diagnosis
Corrigendum for this paper has been published.
Introduction
The kidney is one of the most common sites of urinary system tumors.1 Renal cell carcinoma accounts for 2%–3% of all malignant tumors,2 and the number of people diagnosed with renal cell carcinoma is increasing year by year.3 Space-occupying lesions of the kidney mainly include renal malignant tumors (renal cell carcinoma, renal pelvic carcinoma and metastatic cancer), hamartoma, angiomyolipoma, renal cyst and indeterminate lesions. The malignant lesions of the kidney may be difficult to be differentiated from the benign ones. However, the malignant lesions of the kidney account for a greater proportion, and the symptoms are usually atypical and of a late onset. Many patients already have metastasis upon diagnosis, and the prognosis of these patients is usually poor. Therefore, an early determination of the benign and malignant nature and an accurate classification of the space-occupying lesions of the kidney are considered crucial for prognostic prediction and formulation of individualized therapy.
The commonly used imaging techniques for the space-occupying lesions of the kidney include ultrasound (US), computed tomography (CT) and contrast-enhanced CT (CECT), magnetic resonance imaging (MRI) and contrast-enhanced MRI (CEMRI), intravenous pyelography, renal arteriography and contrast-enhanced US (CEUS). Since most space-occupying lesions of the kidney are asymptomatic at an early stage, 70%–80% of the renal tumors are found by ultrasound during routine physical examination.4,5 Ultrasound examination is now considered the optimal imaging technique for renal tumors, and it has been already applied extensively in the early screening and routine diagnosis of tumors. However, given the limitations of routine ultrasound, CECT or CEMRI may be needed for further localization and qualitative diagnosis of the space-occupying lesions. CEUS can achieve a real-time, dynamic observation of microvascular perfusion inside and around the lesions. Clinical practice has indicated a comparability of diagnostic accuracy between CEUS, CECT and CEMRI.6–8
In order to increase the diagnostic accuracy in the space-occupying lesions of the kidney and to reduce the cost and operational difficulty, we proposed the combined examination of CEUS and CECT. This method can integrate the advantages of the two techniques and realize an accurate, economic, convenient and highly efficient diagnosis.
Data and methods
Subjects
From January 2014 to December 2016, 367 patients with space-occupying lesions of the kidney (excluding those with severe mental illnesses, disturbance of consciousness and allergy to the contrast agent) were included; 378 lesions were examined. This study and the experiment were approved by the ethics committee of The Second Hospital of Jilin University. All patients had intact clinical data and signed the informed consent.
Eighty-nine patients visited the hospital with symptoms, 37 patients had lumbago and soreness of the lower back, 25 patients had hematuria, 12 patients had poor appetite and abdominal discomfort, 8 cases had fever, and 7 cases had urinary tract infection. The lesions were discovered by routine physical examination in the remaining 278 cases (254 cases by routine ultrasound, 19 cases by CT and 5 cases by MRI). Of 367 cases, there were 246 males and 121 females, who were aged 17–91 years old with an average of 53.2±9.7 years. The lesion diameter was 4.9–145.8 mm, with an average of 42.8 mm. The lesions were found in the left kidney in 195 cases, and the lesions were located in the right kidney in 172 cases. All cases received CEUS and CECT before surgery. Of 378 lesions, 372 were pathologically proven by radical or partial nephrectomy. With the consent of the patients, the other 6 lesions of patients with small and deep location of the disease with atypical renal space-occupying lesions were performed pathological biopsy. The research flowchart is available as Figure 1.
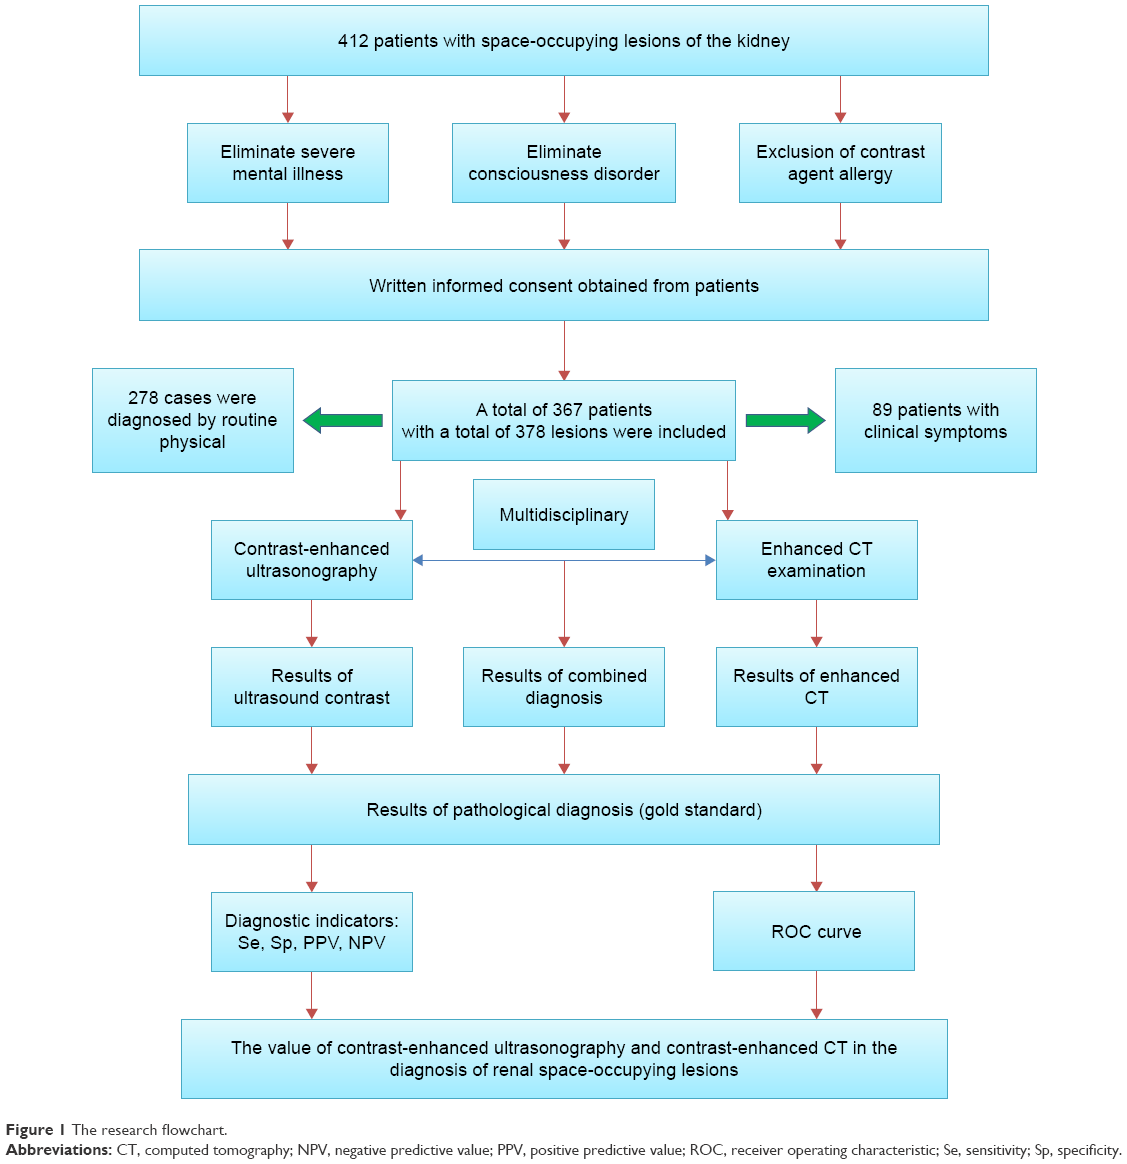 | Figure 1 The research flowchart. |
Examination
LightSpeed 64-row helical CT scanner and Siemens Emition 16-row helical CT scanner were used. Ultravist (Bayer Schering) containing 300 mg iodine per milliliter was used as the contrast agent. Plain CT scan was first performed for the two kidneys, which was followed by contrast-enhanced scan of the abdomen. On the high-pressure syringe, the flow rate was set to 3.5–4.0 mL/s, with slice thickness of 3–5 mm and an injection dose of 95–100 mL. Three-phase CT scan was performed, with scan in the arterial, venous and pelvic phase lasting for 20–30 s, 45 s and 3–5 min, respectively.
ACUSON S2000 Ultrasound System (probe 4C1, frequency 2.5–5 MHz) was used for CEUS; the contrast agents were Bracco and SonoVue. Before CEUS, 5 mL of the normal saline was added into the contrast agent and mixed well by shaking gently. For each scan, 1.2 mL of the diluted contrast agent was taken and the bolus injection was performed in the median cubital vein. First, the tumor size, echoic pattern and blood flow signals were detected by color Doppler ultrasound. The cross sections that showed the lesions most clearly and the most renal tissues were chosen. The distribution of the contrast agent inside the tumor was observed for 3–4 min. The characteristic manifestations of the lesions upon the contrast-enhanced scan and CEUS were observed and recorded. The images were stored for off-line analysis.
Imaging processing and analysis
Two radiologists who had 15–20 years of working experience and were blinded to the clinical symptoms and the pathological results interpreted the images of CEUS and CECT. Under the multidisciplinary team (MDT) treatment plan, consultation was held between the two radiologists and the imaging characteristics were analyzed comprehensively. A diagnosis was made based on the combined examination.
In order to reduce the deviation of subjective judgment, the CEUS and CECT data were analyzed and recorded in detail by two physicians from ultrasound imaging and radiation imaging departments, who must have >15–20 years of working experience and not know the clinical symptoms and pathological results. If two physicians disagree on the diagnosis, they should communicate with each other and analyze by synthesis of its imaging features to make a final diagnosis. Then, applying MDT, diagnostic value of CEUS combined with CT was analyzed and determined by a further selection of another two ultrasound imaging physicians and two radiology physicians.
Statistical process
SPSS 20.0 software was used for statistical analysis. On the time–intensity curves, the parameters were reported as mean ± standard deviation. The difference between the benign and malignant lesions was compared by using the t-test. The pathological results from surgery or biopsy were taken as the gold standard. The sensitivity (Se), specificity (Sp), positive predictive value (PPV) and negative predictive value (NPV) were calculated for CEUS, CECT and the combined examination, respectively. The diagnoses made by the three techniques were compared by using the McNemar’s test. The diagnostic value of the three methods was assessed by the receiver operating characteristic (ROC) curves. The significance level was set to α=0.05, and P<0.05 was considered to be significantly different.
Results
Pathological results of 378 lesions
As confirmed pathologically by biopsy or surgery, there were 301 malignant lesions (79.63%) and 77 benign lesions (11.37%). Table 1 shows the pathological classification of these lesions.
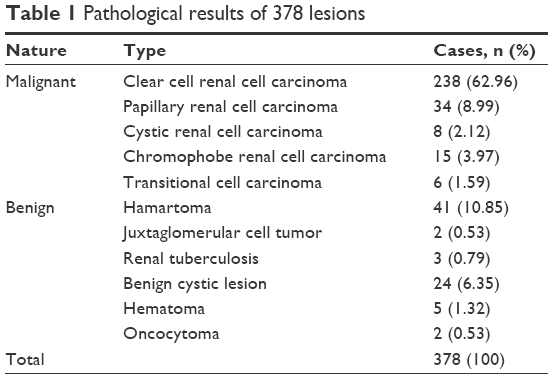 | Table 1 Pathological results of 378 lesions |
Imaging characteristics of the space-occupying lesions
CEUS manifestations
All 301 malignant lesions were enhanced upon CEUS, with 89.03% (268/301) of the lesions showing hyper-enhancement and 10.97% (33/301) of the lesions showing hypo-enhancement. As to the enhancement pattern, 216 lesions (71.76%) were fast wash-in and fast wash-out; 39 lesions (12.95%) were fast wash-in and slow wash-out; 31 lesions were slow wash-in and fast wash-out and 15 lesions were slow wash-in and slow wash-out. Diffuse and concentric enhancement was found in 281 lesions (93.36%) and 20 lesions (6.64%), respectively. Pseudocapsule was observed in the parenchymal phase in 38.87% lesions (117/301).
Of 77 benign lesions, enhancement was found in 58 lesions (75.32%). There was no enhancement in 19 benign lesions. Of the enhanced lesions, 46 lesions (79.31%) showed hypo-enhancement; 49 lesions (84.48%) were slow wash-in and slow wash-out; 51 lesions (87.93%) showed concentric enhancement and 2 lesions (3.45%) showed pseudocapsules.
Manifestations of lesions upon CECT
In CECT, 159 lesions (52.82%) showed hyper-enhancement; 87 lesions (28.90%) showed iso-enhancement; 48 lesions (15.94%) showed mild enhancement and 7 lesions (2.32%) showed no enhancement. Of 294 enhanced lesions, 249 lesions (82.72%) were fast wash-in and fast wash-out; 43 lesions (14.28%) were fast wash-in and slow wash-out and 15 lesions (2.99%) were slow wash-in and slow wash-out.
Of 77 benign lesions, 11 lesions (14.28%) showed hyper-enhancement upon CECT; 28 lesions (36.37%) showed iso-enhancement; 22 lesions (28.57%) showed mild enhancement and 16 lesions (20.78%) showed no enhancement. Of 44 enhanced lesions, 34 lesions (77.27%) were fast wash-in and slow wash-out; 3 lesions (6.81%) were fast wash-in and slow wash-out and 7 lesions (15.90%) showed persistent hypo-enhancement.
Analysis of quantitative parameters on the time–intensity curves
Qontra Xt software was used for the quantitative analysis of the scan parameters in the cortex of the benign and malignant lesions of the kidney. The time–intensity curves showing tumor enhancement and clearance were obtained along with the quantitative parameters. It can be seen from Table 2 that the benign lesions took longer time to reach the peak as compared with the malignant lesions. The peak intensity and area under the curve were smaller in the benign lesions than in the malignant lesions. P<0.001 was considered significant difference.
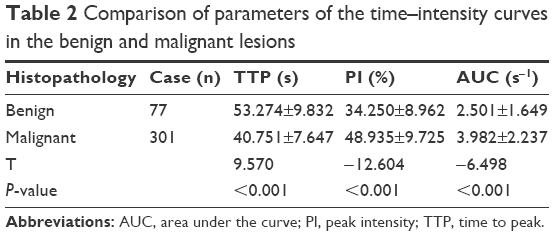 | Table 2 Comparison of parameters of the time–intensity curves in the benign and malignant lesions |
Comparison of diagnoses of the space-occupying lesions using the three methods
Taking the pathological results as the gold standard, we compared the diagnoses of space-occupying lesions using the three methods. CEUS revealed 308 malignant lesions, with 20 benign lesions misdiagnosed; thus, the misdiagnosis rate was 26.0%. Seventy benign lesions were diagnosed by CEUS, with missed diagnosis of 13 malignant lesions; the missed diagnosis rate was 4.3%. The CECT diagnosed 304 malignant lesions, with 25 benign lesions misdiagnosed; the misdiagnosis rate was 32.5%. Seventy-four benign lesions were diagnosed by CECT, with missed diagnosis of 22 malignant lesions; the missed diagnosis rate was 7.3%. The combined examination diagnosed 303 malignant lesions, with 9 benign lesions misdiagnosed; the misdiagnosis rate was 11.7%. Seventy-five benign lesions were diagnosed, with missed diagnosis of 7 malignant lesions; the missed diagnosis rate was 2.3%. The diagnoses made with the three methods were checked against the pathological results. The McNemar χ2 test indicated P>0.05 between the three methods, and thus, there was no significant difference in the diagnostic value (Table 3).
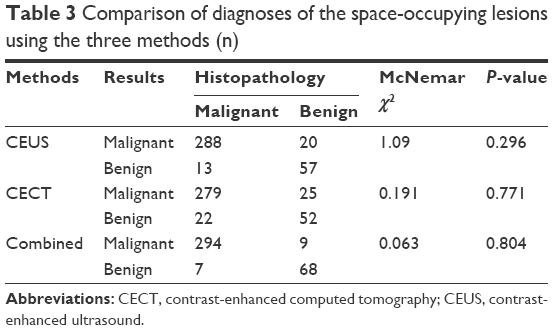 | Table 3 Comparison of diagnoses of the space-occupying lesions using the three methods (n) |
Comparison of the diagnostic value of the space-occupying lesions using the three methods
Table 4 provides the ratios (%) of the diagnostic performance and 95% confidence interval (95% CI) of the three methods. The sensitivity of the combined examination was 97.67% (0.950–0.989); the specificity was 88.31% (0.811–0.958); the PPV was 97.03% (0.942–0.985) and the NPV was 90.67% (0.811–0.958). These values were all above those using CEUS or CECT alone. The chi-square test showed P<0.05, indicating significant difference.
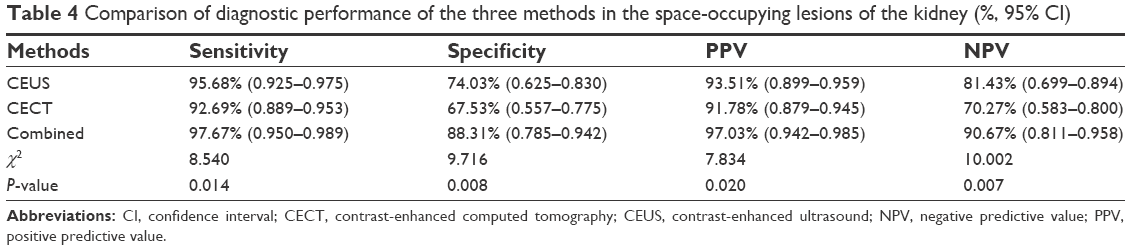 | Table 4 Comparison of diagnostic performance of the three methods in the space-occupying lesions of the kidney (%, 95% CI) |
Comparison of ROC curves with the three methods
The ROC curves were plotted (Figure 2) for the 387 lesions based on the diagnoses made by the three methods and the pathological results. The area under the curve was calculated (Table 5). The area under the ROC curve was 0.930 (0.887–0.973) for the combined combination, which was higher than that of the CEUS (0.849, 0.778–0.909) and CECT (0.803, 0.737–0.868). This means the combined examination had a higher diagnostic value for the space-occupying lesions of the kidney (area >0.9). CEUS or CECT alone had moderate diagnostic value (area >0.7).
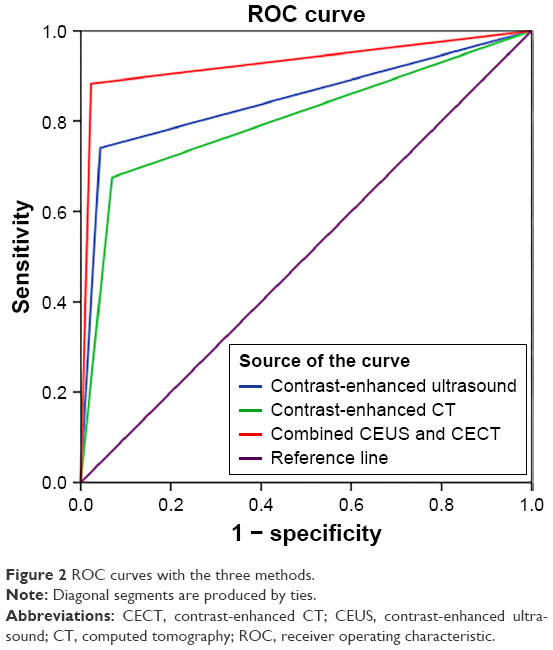 | Figure 2 ROC curves with the three methods. |
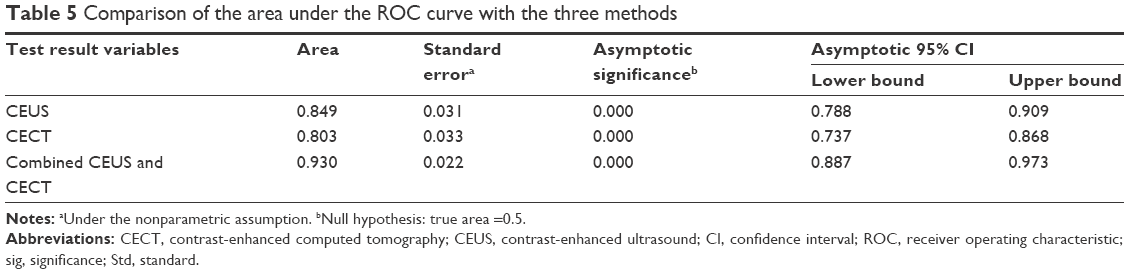 | Table 5 Comparison of the area under the ROC curve with the three methods |
Discussion
We included 378 space-occupying lesions of the kidney that were pathologically confirmed and divided into 11 benign and malignant types (five malignant types and six benign types). Only 89 patients (24.25%) showed clinical symptoms. It may be sometimes difficult to differentiate between the benign and malignant lesions of the kidney in clinics. Imaging techniques are considered very helpful in the diagnosis, and routine ultrasound is the preferred choice due to its non-invasiveness.7,9 In this study, the lesions were found by routine ultrasound during routine physical examination in 254 patients.
With the use of contrast agent, thin-slice scan, rapid dynamic scan and 3D reconstruction, the 3-phase scan (arterial, venous and delayed phase) in the CECT is of a high diagnostic value for space-occupying lesions of the kidney.10 Statistical analysis indicated that the sensitivity, specificity, PPV, NPV and the area under the ROC curve for the CECT were 92.69% (0.889–0.953), 67.53% (0.557–0.775), 91.78% (0.879–0.945), 70.27% (0.583–0.800) and 0.803 (0.737–0.868), respectively. This indicates a high diagnostic value of CECT in differentiating between the benign and malignant tumors of the kidney.
CEUS is the emerging ultrasound technique after CECT and CEMRI; it is also one of the frontier research areas in the medical world.11 CEUS utilizes the high-intensity non-linear harmonic signals produced by the contrast agent to increase the contrast between the normal tissues and the lesions. Depending on the microvascular perfusion of the lesions,12 CEUS can be used to diagnose and differentiate between indeterminate lesions, small renal cell carcinoma, complex cyst and focal inflammatory lesions.13
Another benefit of CEUS is its ability in quantitative analysis. Based on the time–intensity curves plotted by the acoustic quantitative analysis software, the microcirculatory perfusion of the target tissues can be evaluated quantitatively.14 CEUS is very useful for a quantification of the lesions.15 The time–intensity curves plotted in this study indicated that the benign lesions took longer time to reach the peak than the malignant lesions; the peak intensity and area under the ROC curve were much smaller in the benign lesions than in the malignant lesions.
The sensitivity, specificity, PPV, NPV and area under the ROC curve for CEUS were 95.68% (0.925–0.975), 74.03% (0.625–0.830), 93.51% (0.899–0.959), 81.43% (0.699–0.894) and 0.849 (0.778–0.909), respectively. Thus, CEUS has a broad application prospect.
Both CEUS and CECT exhibit high sensitivity and specificity in diagnosing space-occupying lesions of the kidney, though each has respective defects. CEUS outperforms the CECT in visualizing the tumor blood supply and also in qualitative diagnosis of renal tumors.16 CEUS can detect minute, low-speed blood flows and display a higher sensitivity to small vessels than the CECT.17 CEUS can realize real-time, dynamic imaging of the wash-in and wash-out of the renal tumors and parenchyma; it can be used to observe the tumor vessel perfusion and to differentiate between the cystic and solid tumors at a higher performance than the CECT.18 Seven patients with benign cystic lesions of the kidney were misdiagnosed by CECT in this study. Nevertheless, CECT provides a more detailed understanding of the inner structure and basic features of the space-occupying lesions by virtue of the 3D reconstruction technique, as well as the anatomical relationship with the surrounding tissues.19 With CECT, we can make a more accurate diagnosis of the tumors in the retroperitoneum and at a deeper depth. In contrast, CEUS can only depict a single lesion and may be inadequate for multiple lesions, especially in bilateral renal lesions; the kidneys, peri-renal and retroperitoneal conditions, renal veins and inferior vena cava may be not fully visualized.20 In this study, 2 lesions <1 cm were not detected by CEUS.
We proposed the combination of CEUS and CECT in the diagnosis of the space-occupying lesions of the kidney to integrate the benefits of the two. Statistical analysis indicated that the sensitivity, specificity, PPV, NPV and area under the ROC curve were 97.67% (0.950–0.989), 88.31% (0.785–0.942), 97.03% (0.942–0.985), 90.67% (0.811–0.958) and 0.930 (0.887–0.973), respectively. The combined approach achieved a considerable improvement of the sensitivity, specificity and accuracy in the diagnosis of the space-occupying lesions of the kidney as compared with either CEUS or CECT alone.
CEUS integrates the qualitative and quantitative imaging techniques and achieves a real-time, non-invasive, non-allergic, radiation-free, safe and accurate diagnosis. CECT is less costly and easier to operate and therefore more widely applicable; it is fit for screening for tumors and for observing the peri-renal and retroperitoneal conditions. By combining the two techniques together, we can achieve a more accurate diagnosis of the space-occupying lesions of the kidney than using either alone. This combined approach is worthy of clinical popularization.
Disclosure
The authors report no conflicts of interest in this work.
References
Apel H, Walschburger-Zorn K, Häberle L, et al. De novo malignancies in renal transplant recipients: experience at a single center with 1882 transplant patients over 39 yr. Clin Transplant. 2013;27(1):E30–E36. | ||
Atkins MB, Hidalgo M, Stadler WM, et al. Randomized phase II study of multiple dose levels of CCI-779, a novel mammalian target of rapamycin kinase inhibitor, in patients with advanced refractory renal cell carcinoma. J Clin Oncol. 2004;22(5):909–918. | ||
Rini BI, Campbell SC, Escudier B. Renal cell carcinoma. Lancet. 2009;373(9669):1119–1132. | ||
Li P, Li FH, Fang H, et al. Comparison of contrast-enhanced ultrasound and CECT in differential diagnosis of benign and malignant renal parenchyma lesions. Chin J Med Imaging Technol. 2009;25(5):844–847. | ||
Pavlica P, Derchi L, Martorana G, et al. Renal cell carcinoma imaging. Eur Urol Suppl. 2006;5(8):580–592. | ||
Lan D, Qu H-C, Li N, et al. The value of contrast-enhanced ultrasonography and CECT in the diagnosis of malignant renal cystic lesions: a meta-analysis. PLoS One. 2016;11(5):e0155857. | ||
Park BK, Kim B, Kim SH, Ko K, Lee HM, Choi HY. Assessment of cystic renal masses based on Bosniak classification: comparison of CT and contrast-enhanced US. Eur J Radiol. 2007;61(2):310–314. | ||
Egger C, Goertz R, Strobel D, et al. Dynamic contrast-enhanced ultrasound (DCE-US) for easy and rapid evaluation of hepatocellular carcinoma compared to dynamic contrast-enhanced computed tomography (DCE-CT)–a pilot study. Ultraschall Med. 2012;33(06):587–592. | ||
Rukstalis DB, Simmons J, Fulgham PF. Renal ultrasound. In: Fulgham PF, Gilbert BR, editors. Practical Urological Ultrasound. Dallas, TX: Springer; 2017:51–76. | ||
Zhu Y-H, Wang X, Zhang J, et al. Low enhancement on multiphase CECT images: an independent predictor of the presence of high tumor grade of clear cell renal cell carcinoma. Am J Roentgenol. 2014;203(3):W295–W300. | ||
Xue L-Y, Lu Q, Huang B-J, et al. Contrast-enhanced ultrasonography for evaluation of cystic renal mass: in comparison to CECT and conventional ultrasound. Abdom Imaging. 2014;39(6):1274–1283. | ||
Yue XZ, Ya-Ke LI. Value of contrast enhanced ultrasound in the diagnosis of focal hepatic lesions. Chin J General Prac. 2012;10(11):1781–1783. Chinese. | ||
Harvey CJ, Sidhu PS. Ultrasound contrast agents in genitourinary imaging. Ultrasound Clin. 2010;5(4):489–506. | ||
Ordén M-R, Jurvelin JS, Kirkinen PP. Kinetics of a US contrast agent in benign and malignant adnexal tumors 1. Radiology. 2003;226(2):405–410. | ||
Nemec U, Nemec SF, Novotny C, Weber M, Czerny C, Krestan CR. Quantitative evaluation of contrast-enhanced ultrasound after intravenous administration of a microbubble contrast agent for differentiation of benign and malignant thyroid nodules: assessment of diagnostic accuracy. Eur Radiol. 2012;22(6):1357–1365. | ||
Quaia E, Bertolotto M, Cioffi V, et al. Comparison of contrast-enhanced sonography with unenhanced sonography and CECT in the diagnosis of malignancy in complex cystic renal masses. Am J Roentgenol. 2008;191(4):1239–1249. | ||
Tamai H, Takiguchi Y, Oka M, et al. Contrast-enhanced ultrasonography in the diagnosis of solid renal tumors. J Ultrasound Med. 2005;24(12):1635–1640. | ||
Aoki S, Hattori R, Yamamoto T, et al. Contrast-enhanced ultrasound using a time-intensity curve for the diagnosis of renal cell carcinoma. BJU Int. 2011;108(3):349–354. | ||
Shen G, Xu L. Diagnosis value of ultrasound combined with CT in adrenal lesions. Chongqing Med. 2015;44(5):649–651. Chinese. | ||
Lei WU, Zha YF, Chen W, et al. Diagnostic value of contrast enhanced US for cystic renal masses: a meta analysis. J Chin Clin Med Imaging. 2013;24(11):780–783. |
 © 2017 The Author(s). This work is published and licensed by Dove Medical Press Limited. The full terms of this license are available at https://www.dovepress.com/terms.php and incorporate the Creative Commons Attribution - Non Commercial (unported, v3.0) License.
By accessing the work you hereby accept the Terms. Non-commercial uses of the work are permitted without any further permission from Dove Medical Press Limited, provided the work is properly attributed. For permission for commercial use of this work, please see paragraphs 4.2 and 5 of our Terms.
© 2017 The Author(s). This work is published and licensed by Dove Medical Press Limited. The full terms of this license are available at https://www.dovepress.com/terms.php and incorporate the Creative Commons Attribution - Non Commercial (unported, v3.0) License.
By accessing the work you hereby accept the Terms. Non-commercial uses of the work are permitted without any further permission from Dove Medical Press Limited, provided the work is properly attributed. For permission for commercial use of this work, please see paragraphs 4.2 and 5 of our Terms.