")
Back to Journals » Therapeutics and Clinical Risk Management » Volume 13
An estimate of the cost of administering intravenous biological agents in Spanish day hospitals
Authors Nolla JM, Martín E, Llamas P, Manero J, Rodríguez de la Serna A, Fernández-Miera MF, Rodríguez M, López JM, Ivanova A, Aragón B
Received 4 May 2016
Accepted for publication 24 September 2016
Published 14 March 2017 Volume 2017:13 Pages 325—334
DOI https://doi.org/10.2147/TCRM.S112062
Checked for plagiarism Yes
Review by Single anonymous peer review
Peer reviewer comments 3
Editor who approved publication: Professor Garry Walsh
Joan Miquel Nolla,1 Esperanza Martín,2 Pilar Llamas,3 Javier Manero,4 Arturo Rodríguez de la Serna,5 Manuel Francisco Fernández-Miera,6 Mercedes Rodríguez,6 José Manuel López,7 Alexandra Ivanova,8 Belén Aragón9
1Rheumatology Department, IDIBELL-Hospital Universitari de Bellvitge, Barcelona, 2Hospital Universitario de Getafe, Madrid, 3Hospital Universitario Fundación Jiménez Díaz, Madrid, 4Hospital Universitario Miguel Servet, Zaragoza, 5Hospital de la Santa Creu i Sant Pau, Barcelona, 6Hospital Universitario Marqués de Valdecilla, Santander, 7Hospital Universitario Virgen del Rocío, Sevilla, 8Max Weber Institute, Madrid, 9MSD, Madrid, Spain
Objective: To estimate the unit costs of administering intravenous (IV) biological agents in day hospitals (DHs) in the Spanish National Health System.
Patients and methods: Data were obtained from 188 patients with rheumatoid arthritis, collected from nine DHs, receiving one of the following IV therapies: infliximab (n=48), rituximab (n=38), abatacept (n=41), or tocilizumab (n=61). The fieldwork was carried out between March 2013 and March 2014. The following three groups of costs were considered: 1) structural costs, 2) material costs, and 3) staff costs. Staff costs were considered a fixed cost and were estimated according to the DH theoretical level of activity, which includes, as well as personal care of each patient, the DH general activities (complete imputation method, CIM). In addition, an alternative calculation was performed, in which the staff costs were considered a variable cost imputed according to the time spent on direct care (partial imputation method, PIM). All costs were expressed in euros for the reference year 2014.
Results: The average total cost was €146.12 per infusion (standard deviation [SD] ±87.11; CIM) and €29.70 per infusion (SD ±11.42; PIM). The structure-related costs per infusion varied between €2.23 and €62.35 per patient and DH; the cost of consumables oscillated between €3.48 and €20.34 per patient and DH. In terms of the care process, the average difference between the shortest and the longest time taken by different hospitals to administer an IV biological therapy was 113 minutes.
Conclusion: The average total cost of infusion was less than that normally used in models of economic evaluation coming from secondary sources. This cost is even less when the staff costs are imputed according to the PIM. A high degree of variability was observed between different DHs in the cost of the consumables, in the structure-related costs, and in those of the care process.
Keywords: day hospitals, rheumatoid arthritis, intravenous biological agents, unit cost of infusion, variability, care process
Introduction
In recent years, there has been an important change in the care of patients whose chronic or prolonged processes require intravenous (IV) therapies. This change is occurring because of the appearance of biological therapies, which in some cases cannot be administered in the patient’s home.
“Day hospitalization” has become the best way to administer IV therapies, without the need for admission and with the same quality of care as that of an admitted patient, but with fewer risks and associated costs.1 That is why activity in day hospital (DH) in Spain has been increasing in recent years, with >4 million2 patients being cared for in this way in 2012. This increase in the level of health care activity has created the need to develop standardized procedures and to introduce mechanisms for controlling expenditure in DH. So in 2009, the Spanish Ministry of Health and Social Policy issued a Guide to Standards and Recommendations for the running of DH in Spain.3 Likewise, scientific societies began to develop standards of management and quality indicators for different specializations4 showing theoretical recommendations for the operation of a DH. However, no information is available about the costs of a DH related to the care process, the resources which it consumes, or about the possible effect that the management of the DH has on the cost of the therapies administered. In fact, differences in the clinical management of patients in DH may have a very strong impact on the costs of IV therapies and specifically on their administration – differences between centers can reach >€7,000 per patient per year5 according to data obtained from a study carried out in France on patients with rheumatoid arthritis (RA).
Recently published studies reveal that the most common problems observed in Spanish DH, from the management point of view, are a saturation of patients in relation to the number of available beds/chairs and the delay in receiving medication from the hospital pharmacy.1 Another notable problem is that of the existing variability between different DHs in Spain.6,7 The conclusion of a very recent study is that none of the rheumatology DHs would currently reach excellence,8 which points to the need to study more deeply their care processes in order to improve their efficiency, and thence to reevaluate the costs of the therapies administered, including the IV ones. The result of the lack of research into this subject is that in most of the related works published in Spain, the costs of administering IV therapies in DH come from local health service tariffs and other secondary data. Consequently, the main aim of this work is to estimate the unit costs of administering IV drugs in DH in the Spanish National Health System, using primary data and taking into account the resources consumed in providing the care process in a DH.
Patients and methods
As this study was classified as an EPA-OD by the Spanish Agency of Medicines and Sanitary Products and was approved by the University Hospital of Getafe Ethics Committee written informed consent was not required. A total of 188 patients were recruited in nine DHs belonging to the Spanish National Health System. The fieldwork was carried out between March 2013 and March 2014. The patients diagnosed with RA,9 aged 18 years or older, and undergoing therapy with one of the following IV biological agents were included: infliximab, rituximab, abatacept, or tocilizumab. The distribution of patients between IV therapies was: infliximab (n=48), rituximab (n=38), abatacept (n=41), or tocilizumab (n=61). Rhythm of drug administration was not considered, but each visit was considered as independent IV infusion.
The DHs included in the sample were selected on the basis of their typology; all of them were polyvalent. This study preserved the anonymity of the hospitals included in the sample, and the nomenclature used to present the results was completely random with no relation between the numbering (DH1, DH2, etc). The complete list of hospitals was as follows: Hospital Universitari de Bellvitge, Hospital Universitario de Getafe, Hospital Universitario Fundación Jiménez Díaz, Hospital Universitario Miguel Servet, Hospital de la Santa Creu i Sant Pau, Hospital Universitario Marqués de Valdecilla, Hospital Universitario Virgen del Rocío, Hospital General Universitario de Valencia, and Hospital Virgen de la Salud.
In order to estimate the unit cost of each infusion, personnel trained specifically for this study measured the time taken by the medical staff in caring for patients during the administration of biological agents in all selected DHs. The following information about the hospitals was also collected:
- Annual structural costs attributed by cost accounting to the DH.
- Annual costs of maintenance contracts, electromedical equipment, information technology, and so on.
- Cost of consumable products and medical and nonmedical articles, both storable and non-storable, for the pursuit of the DH activity.
- Number of patients treated in the DH, classified by diagnosis and treatment.
- Details of the consumables and/or medical articles needed to carry out each therapy included in this study.
- Standard cost of the DH staff by category and level of remuneration, indicating the number of people and the annual cost of each category.
- Cost of the extraordinary activity of the DH staff and the number of patients treated during that activity.
In order to obtain the total unit cost of administering IV drugs, three types of costs were taken into account: 1) costs related to the structure (calculated on the basis of the area of the DH in square meter), 2) costs of consumable medical and nonmedical materials (obtained from the DH accounting records), and 3) staff costs (including the average annual salaries of a doctor, a nurse, a nursing assistant, a hospital attendant, and an administrative employee).
From the methodological point of view, this work is governed by the principles of cost accounting, the purpose of which is to analyze costs by product or by department. The chosen model for the calculation of costs was the so-called “Full costs” model,10,11 which takes into account both the direct costs (directly related to the consumption of resources necessary for the provision of medical care) and the indirect costs (costs of structure, central departments, etc) of the hospitals.
The methods of attributing different types of costs were the following (Figure 1):
- Structure-related costs: for the estimation of the indirect costs of each DH, and subsequently of each IV therapy, the cost accounting criteria of the INSALUD’s GECLIF system were used, the main aim of which being to standardize hospitals’ clinical and financial information and calculate the cost per process so as to obtain the costs for each care activity.3,12 Specifically, the area of each DH in square meter was used whenever information about the structure-related cost attributable to each group of patients was not available in that hospital accounting system. Subsequently, from the total activity of each DH, a calculation was performed to find the percentage to be used to divide these indirect costs between the patients who received one of the IV therapies under study.
- Costs of consumable materials: as the consumption of resources was very similar among all patients, the cost per patient was calculated by dividing the cost of the annual consumption of medical and nonmedical materials by the number of patients cared for in the DH.
- Staff costs: the staff of a DH has been grouped into three sections: area specialist doctor, nursing, and others. The doctor performs a monitoring visit, so his/her function is to verify that the patient feels fine and make some general questions. For this reason, only three hospitals were recorded costs of specialist doctor. In the group of “others”, costs of administrative staff, guards, and so on have been included. In the base case, it was considered that the staff cost is a fixed cost, so the established method of calculation (complete imputation method, CIM) imputed both the time spent on the direct care of each patient and the time that the medical staff devotes to general activities within the DH. In other words, this method imputes the entire cost of the staff attached to the DH to the patients under their care, given that those staffs are needed for the medical care provided. This method of assigning costs thus divides the whole of the DH costs among the population under its care, and it is probably the same as the method used by the hospitals themselves in their cost control. Nevertheless, an alternative calculation has been devised (partial imputation method, PIM), which imputes, as a cost of the infusion, the cost of the time effectively devoted to that particular patient on various tasks that are necessary for that infusion. The cost of specialist doctor matches in both methods, because their main task is not allocated to the DH and we only consider the time spent in doing the monitoring visit to the patient.
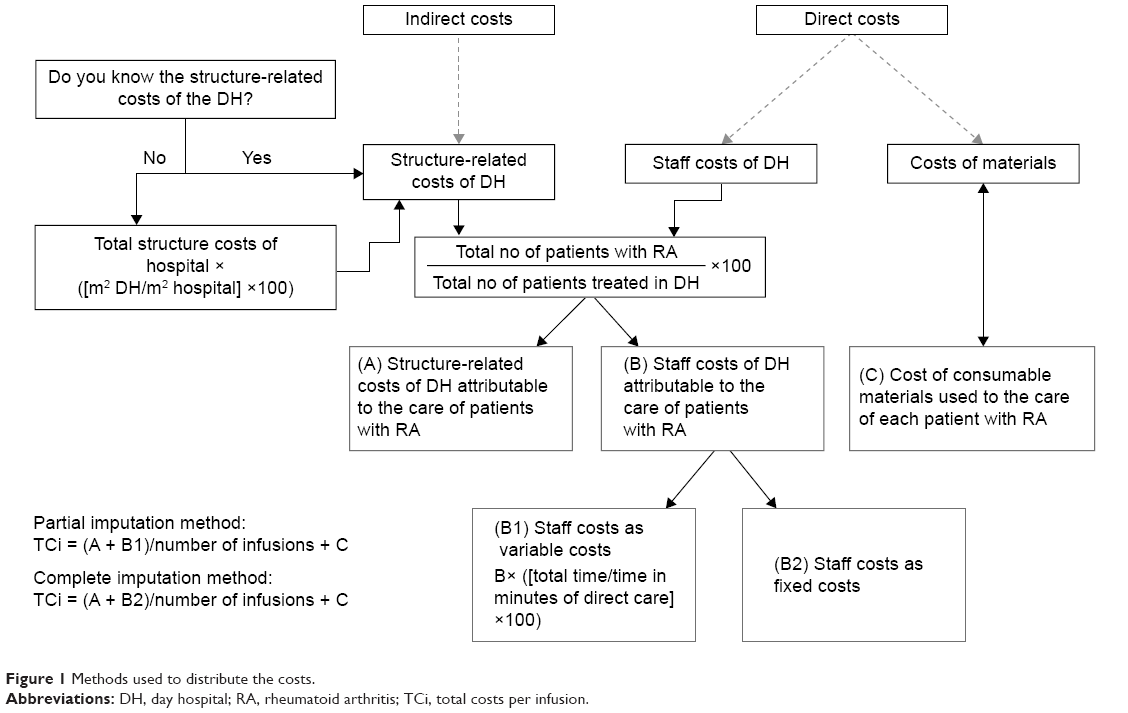 | Figure 1 Methods used to distribute the costs. |
On the basis of the methods used, the final result of the work produced an average total cost per infusion and an average cost per minute of infusion, expressed in euros for the reference year 2014. The second one was calculated in order to eliminate the factor of the time taken for the infusion in the treatment of patients with RA, thus facilitating the extrapolation of the results of this work to other therapies in DH.
In terms of the health care process, the following phases in the care of a patient were defined:
- Premedication phase: the time spent on activities prior to the treatment, related to the administration of drugs such as paracetamol, methylprednisolone, and so on. This phase applies to the case of rituximab and infliximab.
- Infusion or treatment phase: the time between the insertion of the catheter and its removal.
- Waiting phase: the time during which the patient remains in the room without receiving any medical care, for example, the time spent waiting for the nurse to be free or the time spent waiting for the medicine to arrive from the hospital pharmacy.
Results
The results of the study show that the average total cost of administering IV biological agents is €146.12 per infusion (CIM). When the PIM is used, the cost is 4.92 times less (a total unit cost of €29.70 per infusion; Tables 1 and 2). The category of medical staff that devotes the most time to the care of patients in the administration of their IV treatments is the nursing staff (Table 3).
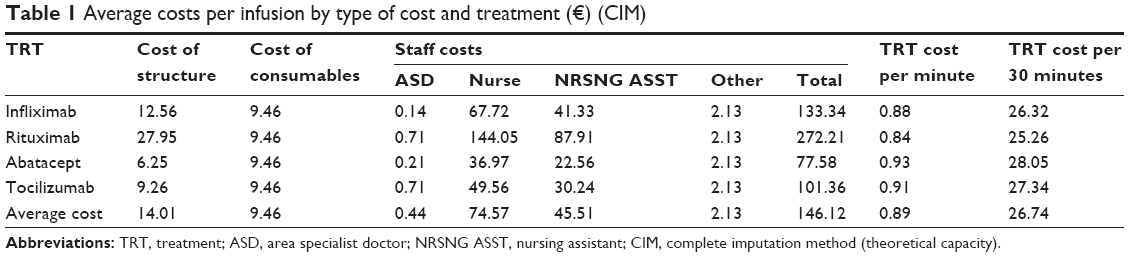 | Table 1 Average costs per infusion by type of cost and treatment (€) (CIM) |
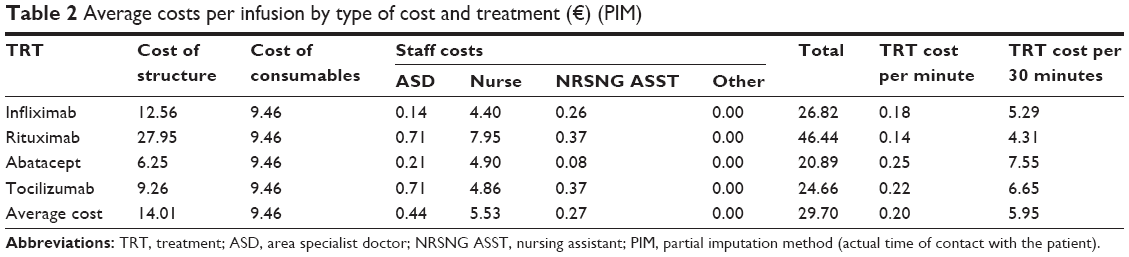 | Table 2 Average costs per infusion by type of cost and treatment (€) (PIM) |
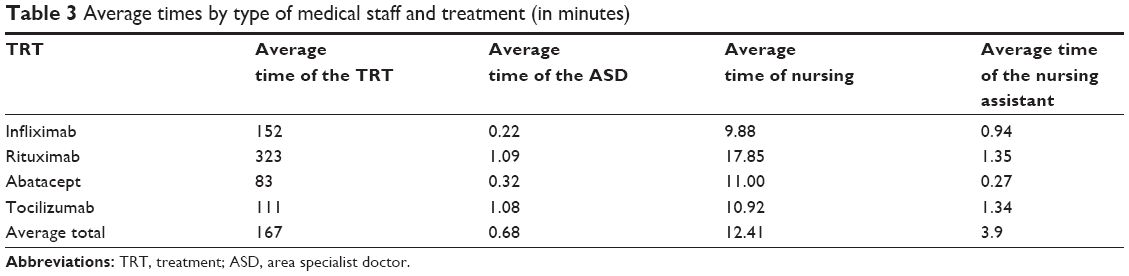 | Table 3 Average times by type of medical staff and treatment (in minutes) |
With regard to the percentage share of each type of cost, the results show that the staff costs constitute the greatest burden with 83.9% of the unit cost of each infusion, followed by the structure-related costs (9.6%) and the cost of consumable materials (6.5%, CIM). From the perspective of the weightage of each group of costs, a big change in the composition of the total cost is observed when using the PIM, in which the group of costs with the greatest weightage is that of the structure-related costs (47.2%), followed by the costs of consumable materials (31.8%) and staff costs (21%, on the basis of time spent on direct care; Figures 2 and 3).
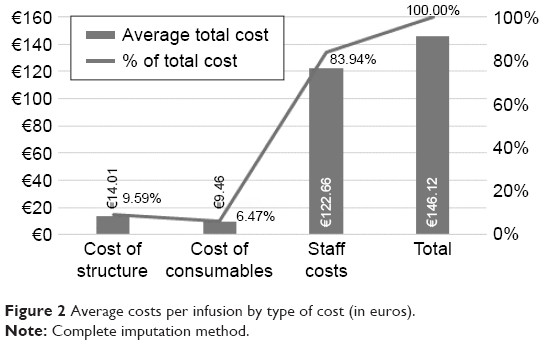 | Figure 2 Average costs per infusion by type of cost (in euros). |
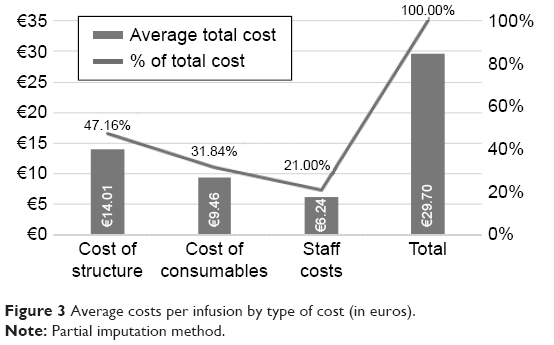 | Figure 3 Average costs per infusion by type of cost (in euros). |
The average total cost per minute is €0.89, and the average cost of 30 minutes of treatment is €26.74 (CIM); the values obtained from the PIM being €0.20 per infusion per minute and €5.95 per infusion per half an hour.
With regard to the health care process, the results show that the total time spent on caring for patients is divided as follows: the treatment phase occupies 64% of the total caring time, followed by the waiting phase (28%), and the premedication phase, which occupies 8% of the total time (Table 4). Large differences were noticed in the lengths of the waiting phases at different DHs (Table 5). The shortest waiting period was in a hospital where it was 15 minutes, contrasting with the hospital with the longest waiting period of 68.8 minutes. This waiting period has now reached more than one-third (37%) of the total time spent by patients in a hospital for the purpose of receiving IV therapies, indicating a potential area for improvement with a probable impact both on the cost of the DH and, without doubt, on the patients themselves.
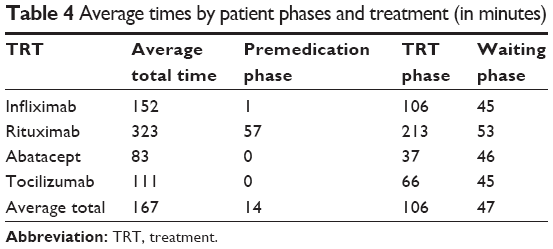 | Table 4 Average times by patient phases and treatment (in minutes) |
 | Table 5 Weight (%) of the waiting phase out of the total time, by day hospital |
With regard to variability, big differences were detected between DH in Spain, both in terms of structure (depending on the type of hospital, mono-specialized vs poly-specialized, size, etc) and in terms of the costs of the materials, number of staffs employed, hours of operation, number of chairs, and process of health care. Some hospitals do not use nursing assistants to look after patients, while others use seven employed professionals in this category; the average is two nursing assistants. With regard to the total time devoted to care, differences of up to 113 minutes per patient were observed (Figure 4). As for the number of chairs, the minimum number observed was four, and the maximum was 37.
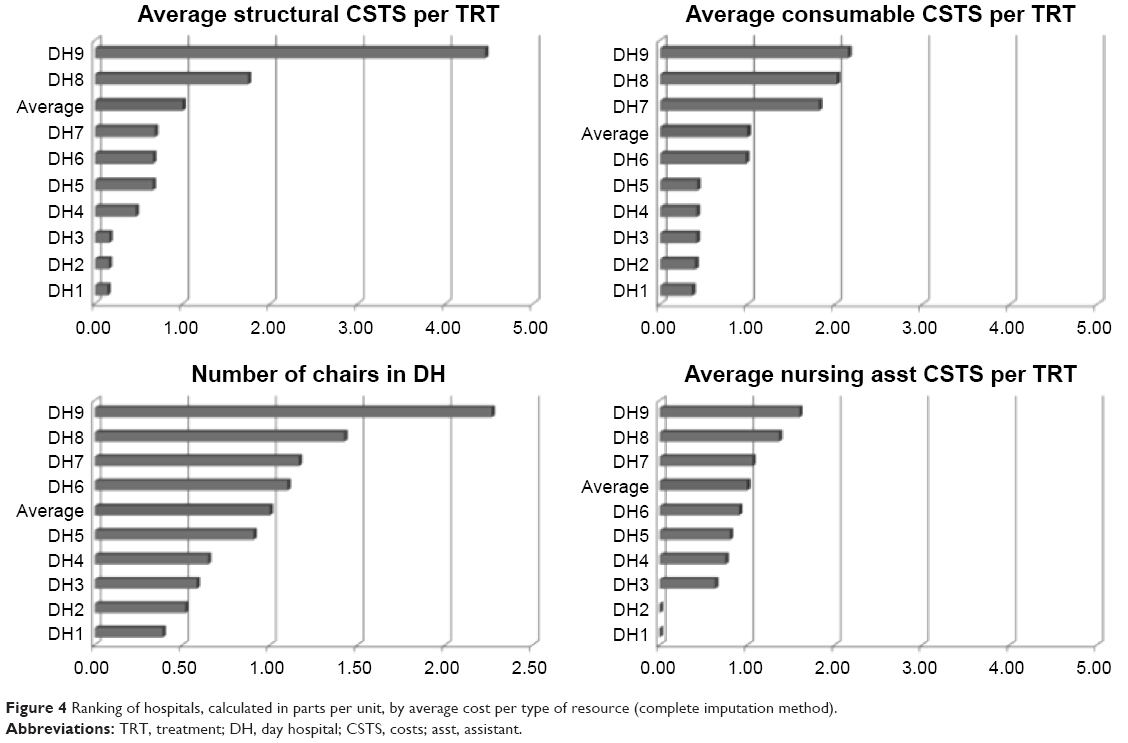 | Figure 4 Ranking of hospitals, calculated in parts per unit, by average cost per type of resource (complete imputation method). |
All these factors affect the costs of IV therapy and complicate any comparison between centers, so their different combinations mean that there are differences between the DH analyzed (Table 6). If, in addition to the aforementioned variability, we include in the analysis the criterion of imputation of the staff cost, the differences observed, both interhospital and intrahospital, are very considerable, and the total cost of the infusion can be as much as <90%.
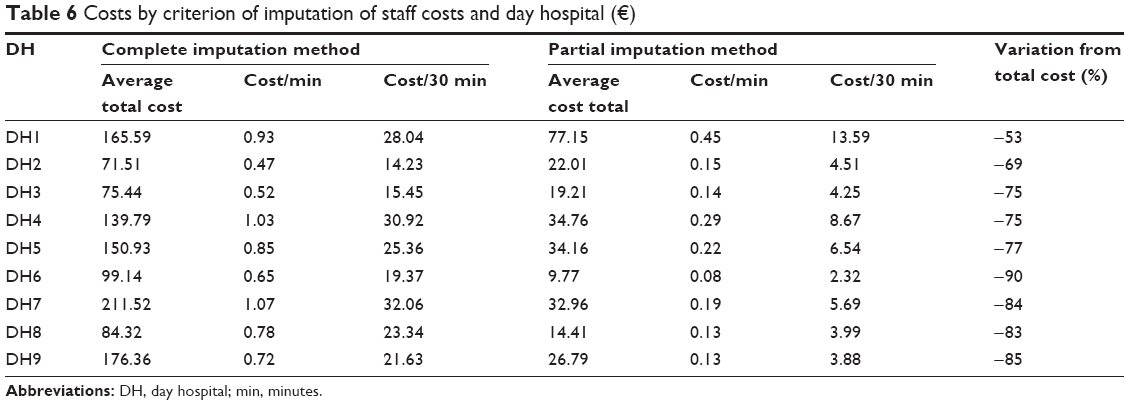 | Table 6 Costs by criterion of imputation of staff costs and day hospital (€) |
Discussion
The fieldwork for this project was carried out with patients diagnosed with RA, which invites one to take other considerations into account before proceeding to extrapolate the results obtained for all IV therapies. First of all, it is very important to know the distribution of patients for each disease group, in order to compare the relative experience in RA (Table 7). Then, and as we have indicated in this article, each medication requires a certain period of treatment and the use of specific medical and nonmedical materials, which definitely produces variations in the total cost. In order to offer homogenous information, the cost per minute of treatment was calculated. To a certain extent, this helps to compensate for the differences in the duration of the treatment, so that the results can be compared with those of other studies.
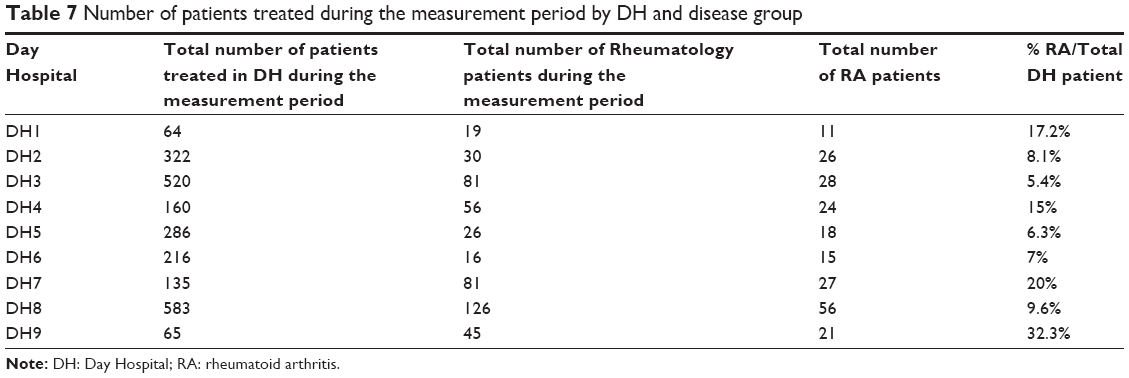 | Table 7 Number of patients treated during the measurement period by DH and disease group3 |
The average total cost of IV infusion for a patient with RA is €146 per infusion, according to the CIM. This cost would be 80% lesser if the only criterion for the imputation of the costs of the medical staff were the time spent on direct care of the patient, obtained by the PIM. The average costs per minute would then be €0.20 (PIM) and €0.89 (CIM), and the average costs of infusion would be €12 per hour and €53.48 per hour, respectively. The main conclusion that we reach is that the average cost of infusion determined by this study is less than that which is normally used in models for economic evaluation, obtained from the e-Salud database (Table 8).
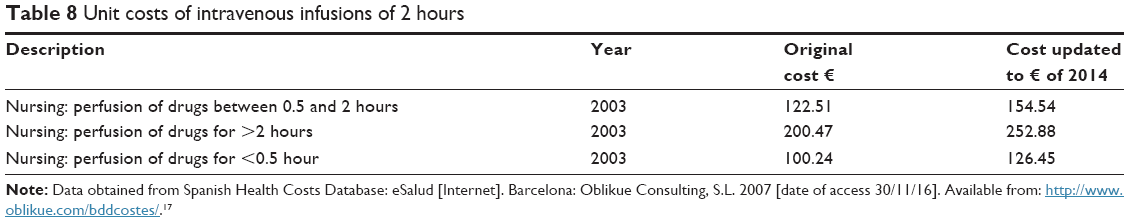 | Table 8 Unit costs of intravenous infusions of 2 hours |
It is important to point out some key aspects when it comes to interpreting our results. Throughout this study, we observed a high degree of variability among the DHs in Spain. This leads to a greater deviation in the average. Specifically, there is a high variability both in the cost of the consumables used in each DH and in the structure-related costs. The latter, when assigned to infusion in different hospitals, vary between €2.23 and €62.35 per patient and DH, the average structure-related cost for infusion being €14.01. As for the average cost of consumables, it oscillates between €3.48 and €20.34 per patient and DH, the average cost of consumables for infusion being €9.46. In the case of the structure-related costs, the characteristics of the hospital building itself, which in some cases, whether because of its size (a larger or smaller area in square meter), location (a high-rise building or a single floor, in the same building as the hospitalization or surgical area), air-conditioning systems, equipment used, and so on, can justify the differences occurring between these costs, regardless of the DH own activity. In the case of the consumables, although the standards for the application of procedures are more or less well established in hospital centers, there are some relevant differences. In this study, we did not analyze differences between protocols used to drug administration, because we used real data collected in each hospital. But it would be desirable to carry out a study in greater depth, in order to compare adherence to the same or different protocols at each hospital, which would reveal more information about the reasons why their consumption is higher in one hospital than in another, based on the cost data supplied by the centers.
In some of our neighboring countries, studies have been carried out to calculate the cost per infusion of biological treatments for patients with RA, based on the time taken to administer those treatments. In particular, Soini et al13 calculated the cost per infusion of biological agents for RA in Finland, using the public tariffs of Finnish hospitals. These authors obtained average costs for the administration of infliximab, rituximab, abatacept, and tocilizumab of €275.34, €434.16, €258.39, and €227.41, respectively.13,14 These data are in line with those of our study and reinforce the idea that when using secondary sources the resulting costs of infusion are higher than those obtained when primary sources are used. In this way, the study of Soini et al13 shows a cost that trebles the cost shown in our data in the case of abatacept. In contrast, in the analysis carried out by Wong et al,15 we observed an average cost for the administration of biological treatments of US$226 (2008), equivalent to €157.3514 (2014). This figure is very close to the one obtained in our own study (€146.12).
Yazici et al16 showed the duration of biological therapy in patients with RA in the US. This study estimates infusion times of 130, 216, and 409 minutes per patient for abatacept, infliximab, and rituximab, respectively. These data are in line with the results of our study, with regard to the “ranking” of times per treatment, but they are a little higher with regard to the total time for each treatment. These differences could well be related to possible differences between the health care processes in the Spanish and US health systems. Of particular interest is the waiting time recorded in the American study, in which the average for the three treatments analyzed is 17.8 minutes. Our results fix the length of the waiting phase at an average of 47 minutes. Although these differences are very probably related, at least in part, to the count of activities included under this section in both studies, they invite one to consider whether improvements could be introduced into the health care process in Spain. As already suggested by Román-Ivorra et al,1 we may be able to reduce the time spent on the preparation of the drugs by making improvements in the health care process. It is worth noting that, from the point of view of efficiency, the ideal would be that, in cases in which, in this phase, the patient is occupying an infusion post needed by another patient because no other posts are available (thus involving a certain opportunity cost); this additional time component (the waiting phase) should be as short as possible, so that both the patient and the medical center can devote to the treatment the time that is strictly necessary, avoiding idle time or waiting time during reception, positioning, caring, treatment, and release from the center. It seems reasonable to think that, according to the foregoing description, the length of this waiting period could be an indicator of the degree of efficiency of the center’s DH, in those cases in which the patient is occupying a resource, such as an infusion chair, which is needed to treat a new patient who then has to wait until it is available, and which depends directly on the organization and the resources of each center. The estimate of the waiting time does not include aspects such as early arrival since we have defined the waiting phase as the time during which the patient remains in the room without receiving any medical care. However, to assess in greater detail aspects of efficiency, it could be important to consider the issue of the catchment area for each DH, in terms of distribution of patients and distance to hospital.
Due to the lack of studies in Spain, it is difficult to compare the results obtained in our work. However, a consideration of two calculation models enables us to evaluate the possible differences in the final results. The difference in the average total cost per treatment depends on the method used for imputing the staff costs. When we consider these costs solely as variable costs (imputed in accordance with the time spent on individualized direct care), we observe that the unit cost of the therapy is considerably smaller than the cost obtained by considering the whole of the salary bill for the medical staff employed by the DH. This estimate does not show the minimum to which the cost per infusion could be reduced in the DH by optimizing its efficiency, but it does show the component of this optimized cost which would be directly related to the individual and direct care of each patient. In this work, we observed large variations between hospitals in terms of staff employed and time spent on care; the difference between the shortest and the longest time taken by hospitals to administer an IV being 113 minutes, as an average for the four treatments analyzed. Focusing on the areas for potential improvement, we observed differences of up to 53 minutes in the waiting times at different DHs. The design of this study does not allow us to analyze the reasons for these differences in detail, so it would be useful to carry out future research to analyze the relationship between the funding of the hospitals and the waiting times, saturation ratios, and so on. In fact, it will be very interesting to develop future research using number of chairs available in each DH contrasted with physical space, in order to compare “packing” density of the hospitals.
This work does confirm that all these variables have an influence on the unit cost of administering medicines, and this invites us to believe that the optimization of resources would help to reduce costs and thus achieve greater efficiency (Figure 5).
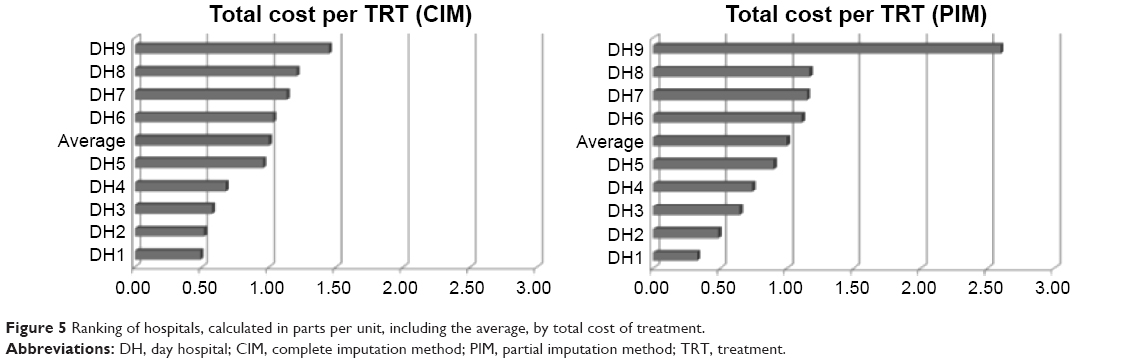 | Figure 5 Ranking of hospitals, calculated in parts per unit, including the average, by total cost of treatment. |
It is clear that the vast majority of the works published in our country use costs of administering biological therapies to patients with RA, which are taken from medical tariffs published by the autonomous communities that are themselves taken from the e-Salud database. This study was a pioneering study in Spain because it made an estimate of the cost of the biological agents applied to patients with RA, starting from primary data. So, in view of the results obtained in this work, it may be inferred that the data found in secondary sources are an estimate, on the high side, of the cost of administering biological agents in RA and, therefore, do not reflect the true cost of these treatments with any exactitude.
Acknowledgments
Our sincere acknowledgment to María Aparicio, Hospital Universitario Barcelona, María de los Ángeles Macheles, Hospital Universitario Miguel Zaragoza; Yoana Ivanova, Max Weber Institute; Lucía Martínez, Max Weber Institute, Madrid; and Neboa Zozaya, Max Weber Institute for the good work and support they have given us in the fieldwork for data collection. The working group includes A Hidalgo (University of Castilla – La Mancha, Toledo), LM Longobardo (University of Castilla – La Mancha), PA Cabello (Servicio de Salud de Castilla La Mancha – SESCAM), and G Nocea (MSD, Madrid, Spain).
Disclosure
This study was funded by MSD, Madrid, Spain. The authors report no further conflicts of interest in this work.
References
Román-Ivorra J, Chalmeta Verdejoa C, Salvador G. Estado actual de los Hospitales de Día de Reumatología en España [Current status of Rheumatology Day Hospitals in Spain]. Rev Esp Reumatol. 2004;31(2):87–94. Spanish. | ||
Ministerio de Sanidad Servicios Sociales e Igualdad [webpage on the Internet]. Estadística de Centros Sanitarios de Atención Especializada 2012. Información y Estadísticas Sanitarias 2014. Available from: http://www.msssi.gob.es/estadEstudios/estadisticas/estHospiInternado/inforAnual/homeESCRI.htm. Accessed September 28, 2016. | ||
Terol E, Palanca E. Hospital de Día. Estándares y Recomendaciones. Informes, Estudios e investigación. MSPS; 2009. Available from: http://www.msssi.gob.es/organizacion/sns/planCalidadSNS/docs/UnidadHospitalDia.pdf. Accessed September 28, 2016. | ||
Garcia-Vicuna R, Montoro M, Egues Dubuc CA, et al. Quality standards in a rheumatology Day-Care Hospital Unit. The proposal of the Spanish Society of Rheumatology Day Hospitals’ Working Group. Reumatol Clin. 2014;10(6):380–388. | ||
Fautrel B, Woronoff-Lemsi MC, Ethgen M, et al. Impact of medical practices on the costs of management of rheumatoid arthritis by anti-TNFalpha biological therapy in France. Joint Bone Spine. 2005;72(6):550–556. | ||
Roman Ivorra JA, Gomez-Salazar JR, Calvo Catala J. Grupo para el estudio de los hospitales de dia de Reumatologia de la Sociedad Valenciana de R. [Current status of day care units where rheumatology treatments are administered in the autonomous community of Valencia]. Reumatol Clin. 2010;6(5):244–249. Spanish. | ||
Hernandez Miguel MV, Martin Martinez MA, Corominas H, et al. Variability in rheumatology day care hospitals in Spain: VALORA study. Reumatol Clin. Epub 2016 Mar 8. | ||
Roman Ivorra JA, Sanmarti R, Collantes-Estevez E, Carreno Perez L, Betegon L. Model of excellence in Rheumatology Day Hospitals in Spain: the HD-Reumatolex project. Reumatol Clin. 2013;9(3):142–147. | ||
Aletaha D, Neogi T, Silman AJ, et al. Rheumatoid arthritis classification criteria: an American College of Rheumatology/European League Against Rheumatism collaborative initiative. Arthritis Rheum. 2010;62(9):2569–2581. | ||
Bebbington J, Gray R, Hibbitt C, Kirk E. Full Cost Accounting: An Agenda for Action. London: Certified Accountants Educational Trust; London, 2001. | ||
Salas OA, García PS. Contabilidad y gestión de costes. 6a Edición Revisada ed. Profit Editorial; 2009. | ||
Garcia B. La experiencia en contabilidad de costes y en benchmarking del Sistema Nacional de Salud español. Balance de una década. [Experience in cost accounting and benchmarking in the Spanish national health system. Balance of a decade.] Revista de administración sanitaria siglo XXI. 2004;2(1):103–124. | ||
Soini EJ, Leussu M, Hallinen T. Administration costs of intravenous biologic drugs for rheumatoid arthritis. Springerplus. 2013;2:531. | ||
EPPI [webpage on the Internet]. Cost Converter. Available from: http://eppi.ioe.ac.uk/costconversion/. Accessed September 28, 2016. | ||
Wong BJ, Cifaldi MA, Roy S, Skonieczny DC, Stavrakas S. Analysis of drug and administrative costs allowed by U.S. Private and public third-party payers for 3 intravenous biologic agents for rheumatoid arthritis. J Manag Care Pharm. 2011;17(4):313–320. | ||
Yazici Y, McMorris BJ, Darkow T, Rosenblatt LC. Patient and physician perception of the infusion process of the biologic agents abatacept, infliximab, and rituximab for the treatment of rheumatoid arthritis. Clin Exp Rheumatol. 2009;27(6):907–913. | ||
Spanish Health Costs Database: eSalud [Internet]. Barcelona: Oblikue Consulting, S.L. 2007. Available from: http://www.oblikue.com/bddcostes/. Accessed November 30, 2016. |
 © 2017 The Author(s). This work is published and licensed by Dove Medical Press Limited. The full terms of this license are available at https://www.dovepress.com/terms.php and incorporate the Creative Commons Attribution - Non Commercial (unported, v3.0) License.
By accessing the work you hereby accept the Terms. Non-commercial uses of the work are permitted without any further permission from Dove Medical Press Limited, provided the work is properly attributed. For permission for commercial use of this work, please see paragraphs 4.2 and 5 of our Terms.
© 2017 The Author(s). This work is published and licensed by Dove Medical Press Limited. The full terms of this license are available at https://www.dovepress.com/terms.php and incorporate the Creative Commons Attribution - Non Commercial (unported, v3.0) License.
By accessing the work you hereby accept the Terms. Non-commercial uses of the work are permitted without any further permission from Dove Medical Press Limited, provided the work is properly attributed. For permission for commercial use of this work, please see paragraphs 4.2 and 5 of our Terms.