")
Back to Journals » International Journal of General Medicine » Volume 14
An Epithelial–Mesenchymal Transition Hallmark Gene-Based Risk Score System in Head and Neck Squamous-Cell Carcinoma
Authors Liang F, Wang R, Du Q, Zhu S
Received 2 July 2021
Accepted for publication 27 July 2021
Published 6 August 2021 Volume 2021:14 Pages 4219—4227
DOI https://doi.org/10.2147/IJGM.S327632
Checked for plagiarism Yes
Review by Single anonymous peer review
Peer reviewer comments 2
Editor who approved publication: Dr Scott Fraser
Feifei Liang,1 Rensheng Wang,1 Qinghua Du,2 Shangyong Zhu3
1Department of Radiation Oncology, First Affiliated Hospital of Guangxi Medical University, Nanning, People’s Republic of China; 2Department of Radiation Oncology, Second Affiliated Hospital of Guangxi Medical University, Nanning, People’s Republic of China; 3Department of Ultrasound, First Affiliated Hospital of Guangxi Medical University, Nanning, People’s Republic of China
Correspondence: Shangyong Zhu
Department of Ultrasound, First Affiliated Hospital of Guangxi Medical University, No. 6 Shuangyong Road, Nanning, Guangxi, 530021, People’s Republic of China
Email [email protected]
Background: Epithelial-to-mesenchymal transition (EMT) program plays a critical role in cancer. Thus, we attempted to generate a risk score system according to the expression pattern of different EMT hallmark genes in head and neck squamous-cell carcinoma (HNSC).
Methods: Differentially expressed EMT hallmark genes were screened to generate a risk score (RS) on TCGA HNSC dataset. The relative prognostic value of the RS compared to clinicopathological characteristics was explored using multivariable Cox analysis. Functional enrichment analysis was performed to reveal the biological characteristics. An external dataset was applied to validate the prognostic value of the RS.
Results: Nine genes constituted the EMT hallmark gene-based RS, which is significantly associated with poor prognosis and could successfully divide patients with HNSC into high- and low-risk groups. The RS was also an independent prognostic indicator compared to routine clinical factors.
Conclusion: We proposed and validated a nine-EMT hallmark gene-based risk score system in HNSC.
Keywords: head and neck squamous-cell carcinoma, epithelial-to-mesenchymal transition, EMT, risk score system, angiogenesis
Introduction
Head and neck cancer is the seventh most common malignancy worldwide, with the greater being head and neck squamous-cell carcinoma (HNSC).1 Despite advances in treatments, the prognosis of HNSC remains poor with mortality rates of 40–50%.2 HNSC is a heterogeneous type of disease at phenotypic and genetic levels.3 The current clinical decision-making system in HNSC is mainly based on phenotypic heterogeneity, such as the American Joint Committee on Cancer TNM staging system4 and tumor grade. It is imperative to identify individuals at high-risk with the same phenotypes by revealing the genetic heterogeneity.
Epithelial-to-mesenchymal transition (EMT) is considered one of the hallmarks of cancer.5 The emerging evidence has shown that EMT program contributes to the induction of cancer stem cells, immune escape during cancer progression, and drug resistance in various types of cancers,6–8 including HNSC.9 Thus, the expression pattern of different EMT hallmark genes may be one of the critical genetic heterogeneity of cancers. We assumed that there is an EMT hallmark gene-based risk score system as a prognostic indicator in HNSC. To investigate the hypothesis, we used the datasets of HNSC from TCGA, including clinical information and gene expression profiles, to generate an EMT hallmark gene-based risk score system for predicting prognosis for patients with HNSC, and validated it on another independent dataset.
Materials and Methods
Data Processing
The RNA sequencing (RNA-seq) data (displayed as raw counts) and clinical information of HNSC in The Cancer Genome Atlas (https://www.cancer.gov/) were downloaded to generate an EMT hallmark gene-based risk score (RS) to predict prognosis. Another HNSC data set GSE6585810 based on platform of GPL10558 was downloaded from Gene Expression Omnibus (https://www.ncbi.nlm.nih.gov/geo/) and used to validate the RS. The RNA-seq data was normalized using voom function from limma package11 in R software (version 4.0.2) (https://www.r-project.org/). The gene expression profiles in GSE65858 were normalized by the contributor. If multiple probes correspond to a gene, then the average value of these probes is considered as the expression value of this gene. EMT hallmark gene set included 200 genes (Table S1) was obtained from the Molecular Signatures Database (version 7.2).12,13 The present study only included 192 EMT hallmark genes because their expression values are available in both TCGA and GSE65858. The workflow of the present study is displayed in Figure 1.
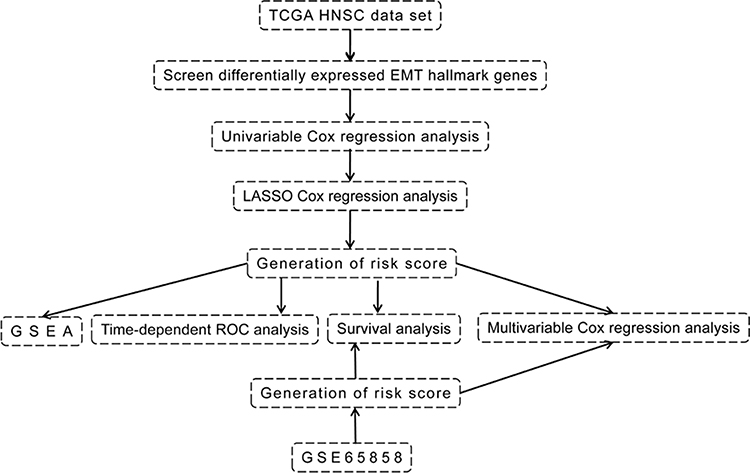 |
Figure 1 The workflow of the present study. Abbreviations: TCGA, The Cancer Genome Atlas; HNSC, head and neck squamous-cell carcinoma; LASSO, least absolute shrinkage and selection operator; GSEA, gene set enrichment analysis. |
Screening Differentially Expressed Genes (DEGs)
The expression profiles of the 192 EMT hallmark genes were extracted from the TCGA HNSC dataset, and subsequently used to screen the DEGs in HNSC compared to healthy tissues using limma package. Genes with P adjusted by false discovery rate < 0.05 and log2 (fold change) >1 were considered significant.
Cox Regression and Least Absolute Shrinkage and Selection Operator Analysis
The expression profiles of DEGs and overall survival data were used to perform univariable Cox regression to identify the prognosis-associated EMT hallmark genes. Subsequently, the expression profiles of prognosis-associated EMT hallmark genes were performed with least absolute shrinkage and selection operator (LASSO) analysis using glmnet (https://CRAN.R-project.org/package=glmnet) R package to select the optimal prognostic EMT hallmark genes. Thus, the EMT hallmark gene-based risk score (RS) was created as:
RS = Exprgene1*Coefgene1 + Exprgene2*Coefgene2+ Exprgene2*Coefgene2+ …
The “Coef” is the regression coefficient of gene and is derived from the LASSO Cox regression, and “Expr” indicates the expression values of the gene. Each patient with HNSC got a RS, and was divided into the high- or low-risk group according to the median RS. The OS between the two different risk groups were compared using log-rank method. In addition, the routine clinical factors were included in the multivariable Cox regression analysis to assess whether the RS is an independent prognostic factor.
Gene Set Enrichment Analysis (GSEA)
To explore the biological state of high-risk group patients, GSEA12,14 was performed using the GSEA JAVA program (version 4.0.1) (http://www.broadinstitute.org/gsea). The hallmark gene set included 50 gene sets obtained from the Molecular Signatures Database (version 7.2)12,13 used as the reference gene set. Gene sets with nom p < 0.05 after performing 1000 permutations were considered to be significantly enriched.
Validation of the EMT Hallmark Gene-Based RS
As it was in the TCGA HNSC data set, each patient in GSE65858 got an RS according to the above formula, and was divided into high- or low-risk groups. The OS between the two different risk groups were compared and the multivariable Cox regression analysis was carried out.
Statistical Analysis
All analyses were performed using R software (version 4.0.2). The unpaired t-test from limma package was used to screen DEGs. Kaplan–Meier survival analysis and Log rank test were used to compare survival between the two groups of patients. Time-receiver operating characteristic (tROC) curve analysis was performed using the timeROC package (https://CRAN.R-project.org/package=timeROC). All tests were two-sided and p < 0.05, unless otherwise stated, was considered to indicate statistical significance.
Results
Multiple EMT Hallmark Genes Upregulated in HNSC
A total of 93 EMT hallmark genes (Table S2) were differentially expressed in HNSC compared to healthy paracancer tissue, including 16 downregulated and 77 upregulated genes (Figure 2A). This indicates that EMT plays a crucial role in promoting HNSC due to the fact that most EMT hallmark genes are upregulated. The expression heat map of the DEGs shows that it has a promising effect of distinguishing tumor from paracancer tissue (Figure 2B).
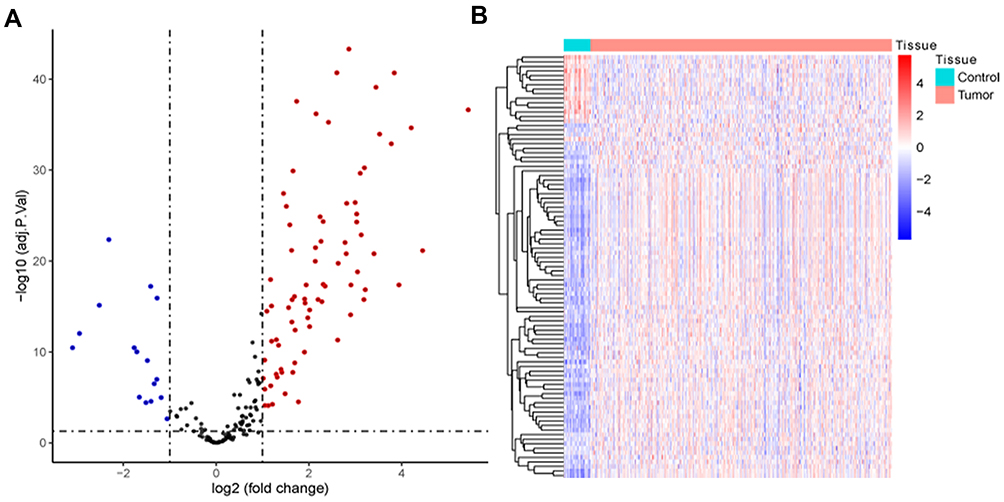 |
Figure 2 Differentially expressed EMT hallmark genes. (A) The volcano plot of the differentially expressed genes. Red indicates up-regulated, and blue indicates down-regulated. (B) The expression heat map of the differentially expressed EMT hallmark genes. |
EMT Hallmark Gene-Based RS as an Independent Prognostic Factor
After univariable Cox regression analysis, nineteen EMT hallmark genes were identified as the prognosis-associated genes (Table 1). Unsurprisingly, most of (17 from 19) the prognosis-associated EMT hallmark genes show an association with poor prognosis in HNSC. Subsequently, nine EMT hallmark genes (SFRP1, TGFBR3, DKK1, PCOLCE2, PTX3, CAP2, PLOD2, VEGFC, and IL6) were considered as optimal features through LASSO Cox analysis (Figure 3A). Thus, all patients got RS according to the coefficients. The RS is significantly associated with poor prognosis (Hazard Rate (HR) = 3.254, 95% CI = 2.367–4.473, p < 0.001). The RS showed promising prognostic value with AUC approximately 0.7 (Figure 3B), and the AUC of 5-year tROC was 0.660 (Figure 3C). The high-risk group HNSC patients showed significantly shorter OS than the low-risk group HNSC patients (Figure 3D). Furthermore, the RS remained independent compared to some routine clinical factors, including TNM staging system, tumor grade, and tumor primary subdivision (Figure 4).
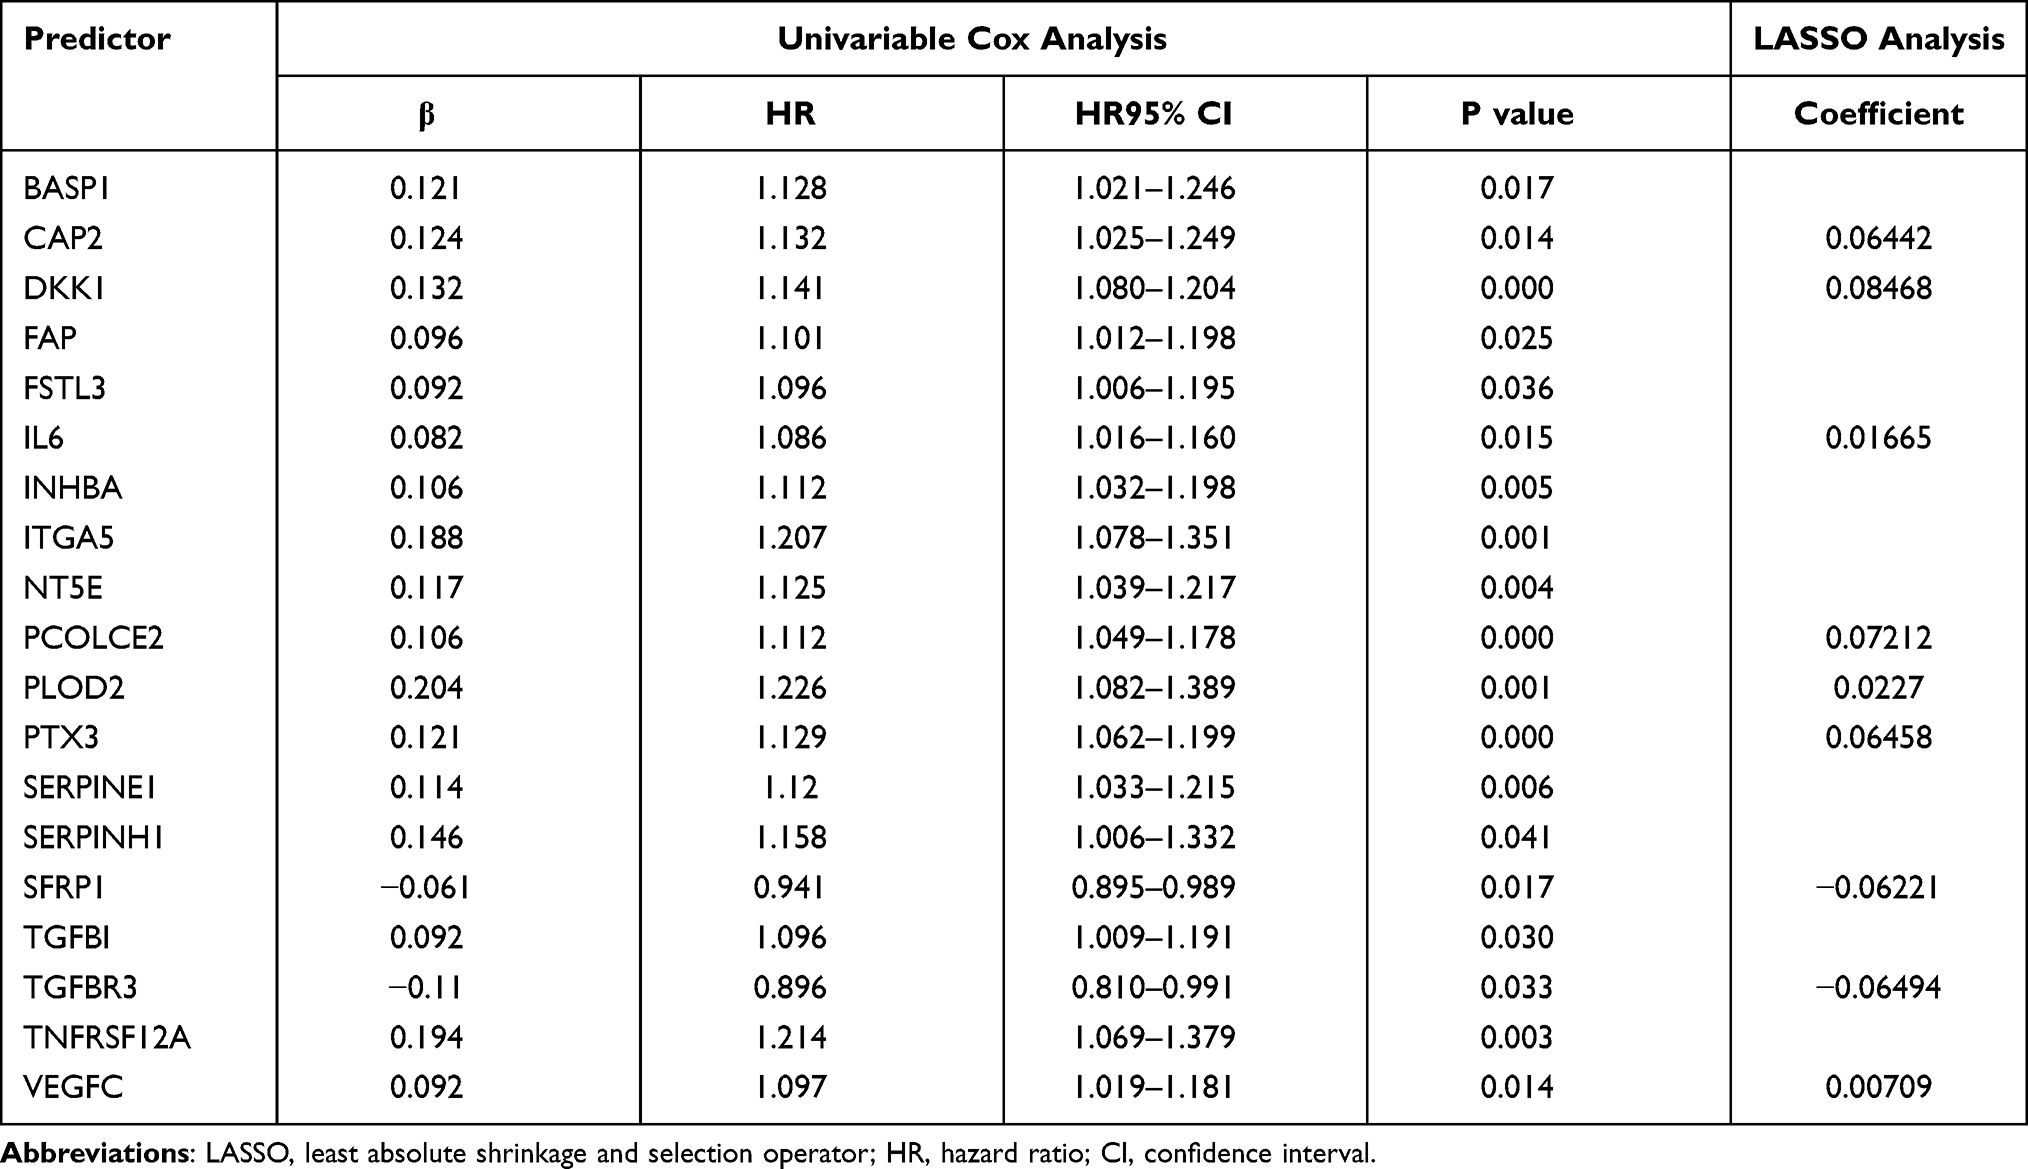 |
Table 1 The Results of Univariable and Least Absolute Shrinkage and Selection Operator Cox Analysis |
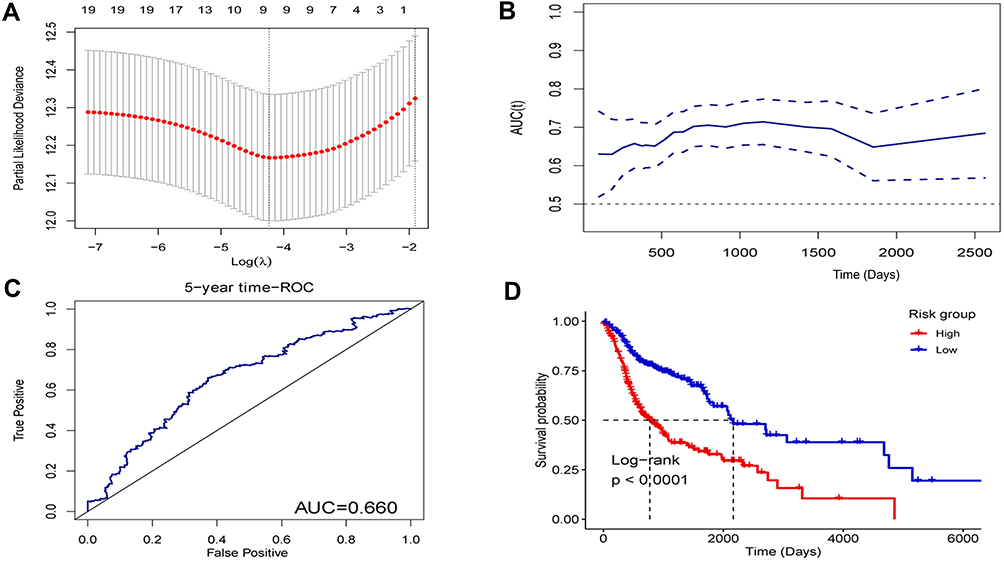 |
Figure 3 The nine-EMT hallmark gene-based risk score in the head and neck squamous-cell carcinoma data set from The Cancer Genome Atlas. (A) Nine genes were considered as the optimal features in the least absolute shrinkage and selection operator Cox analysis. (B) The time-dependent receiver operating characteristic (ROC) curve analysis for the risk score. (C) 5-year The time-dependent ROC curve analysis for the risk score. (D) The Kaplan–Meier curves with the Log rank test of the high- and low-risk groups. Abbreviation: AUC, area under the curve. |
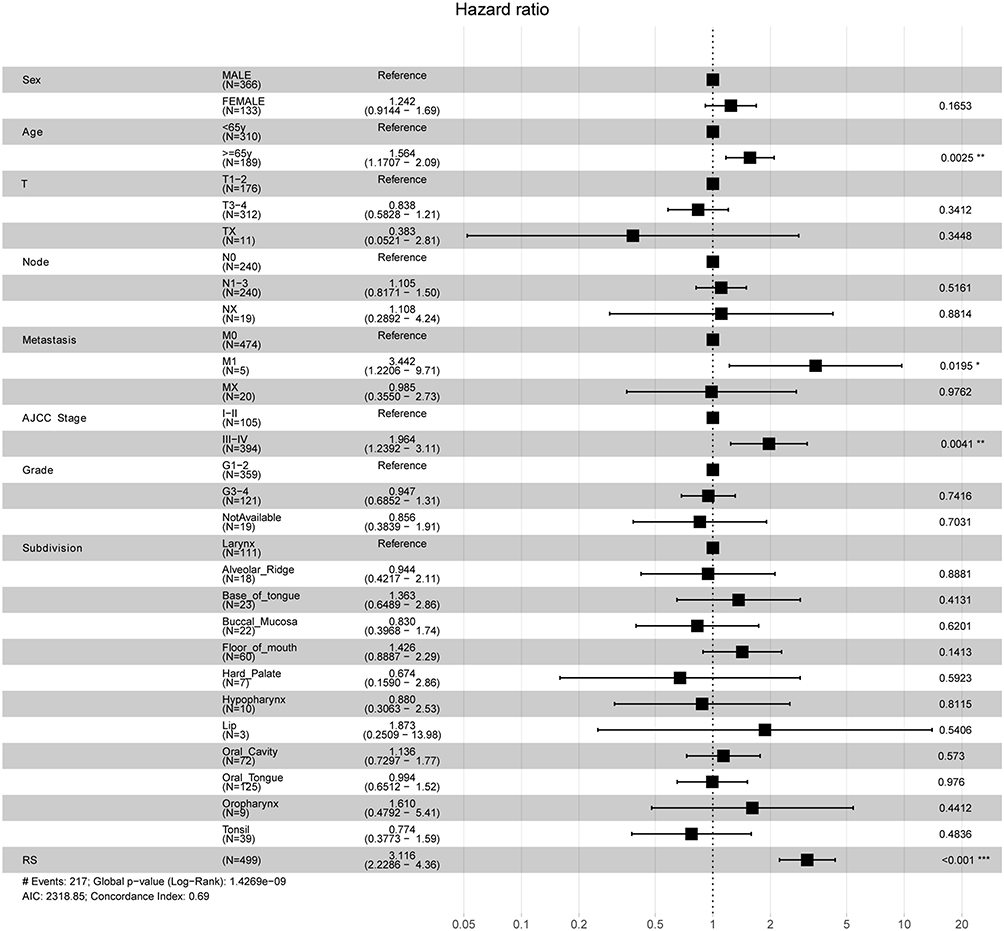 |
Figure 4 The results of the multivariable Cox analysis for the nine-EMT hallmark gene-based risk score (RS) and routine clinical factors. *P < 0.05, **P < 0.01, and ***P < 0.001. |
Biological Phenotypes of High-Risk HNSC
The results of GSEA showed that the EMT hallmark gene set was significantly enriched in high-risk HNSC (Figure 5A). In addition to this, hallmark gene set of angiogenesis (Figure 5B), coagulation (Figure 5C), glycolysis (Figure 5D), hypoxia (Figure 5E), MTORC1 signaling (Figure 5F), unfold protein response (Figure 5G), and UV response up (Figure 5H) were also enriched in high-risk HNSC.
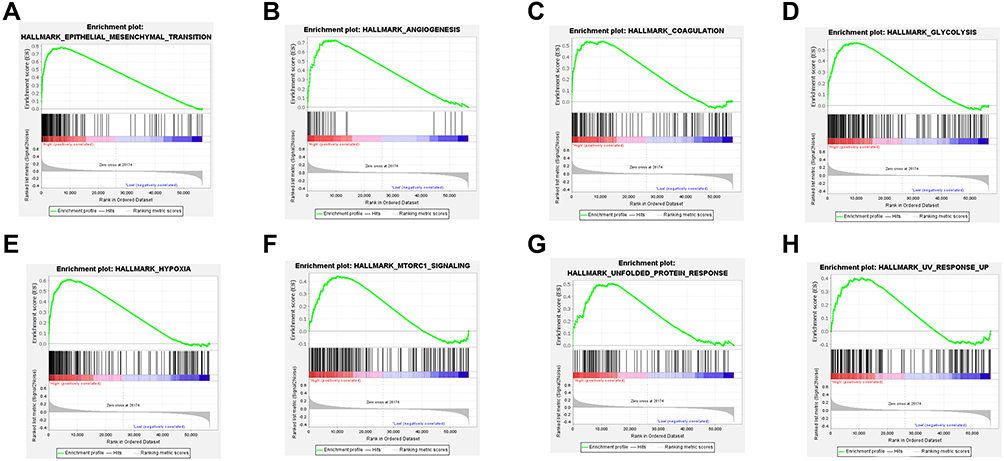 |
Figure 5 The results of gene set enrichment analysis for the high-risk head and neck squamous-cell carcinoma. Eight hallmark gene sets enriched in the samples of high-risk head and neck squamous-cell carcinoma, including (A) epithelial–mesenchymal transition, (B) angiogenesis, (C) coagulation, (D) glycolysis, (E) hypoxia, (F) MTORC1 signaling, (G) unfold protein response, and (H) UV response up. |
The RS Was Validated in an Independent Data Set
As it was in the TCGA HNSC data set, the RS was generated for each individual in GSE65858 according to the formula. The RS remained significantly associated with poor prognosis (HR = 13.261, 95% CI = 2.136–82.352, p = 0.006). The high-risk group HNSC patients remained significantly shorter OS than the low-risk group HNSC patients in GSE65858 (Figure 6A). The RS also remained an independent prognostic factor compared to routine clinical factors (Figure 6B).
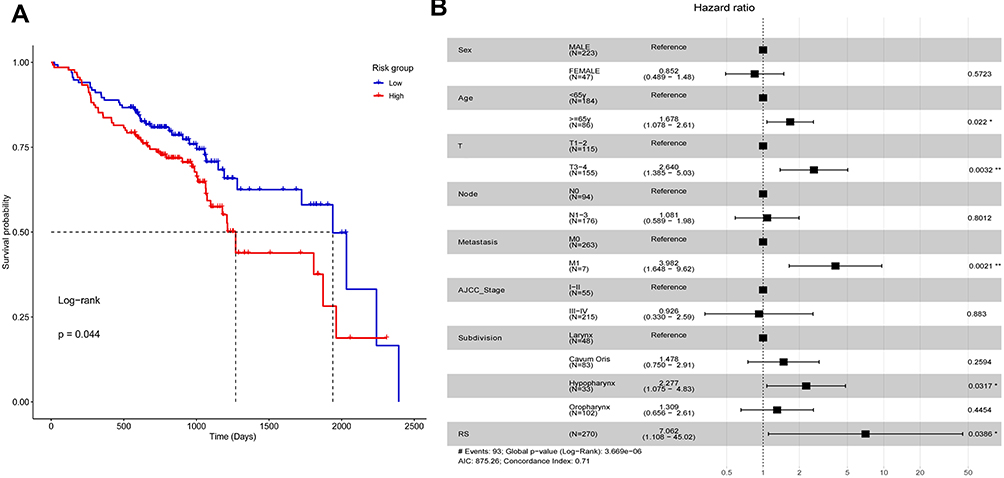 |
Figure 6 The nine- EMT hallmark gene-based risk score in GSE65858. (A) The Kaplan–Meier curves with the Log rank test of the high- and low-risk groups. (B) The results of the multivariable Cox analysis for the nine-EMT hallmark gene-based risk score (RS) and routine clinical factors. *P < 0.05, and **P < 0.01. |
Discussion
Previous studies constructed a prognostic stratification system from multiple perspectives, such as immunity-related gene-based signature,15 microRNA-based signature,16,17 and microenvironment-based system.18 Few studies focused on EMT-related gene-based signature. In our present study, a nine-EMT hallmark gene-based RS was generated to successfully identify the relatively high-risk HNSCs. It was an independent prognostic factor compared to routine clinical factors; moreover, it was validated in an external data set. This may provide more references for clinical decision-making.
Unsurprisingly, some of the nine EMT hallmark genes reported were associated with HNSC or other types of cancer. CAP2 was considered to be related to multistage hepatocarcinogenesis.19 Elevated DKK1 was reported as an independent unfavorable prognostic indicator of survival in HNSC,20 which is consistent with our result. IL-6 plays an important role in HNSC tumor proliferation and metastasis, and IL-6/STAT3 signaling may be a potential target for treating HNSCC patients.21 PLOD2 was found to contribute to drug resistance in laryngeal cancer by promoting cancer stem cell-like characteristics.22 PTX3 is an extrinsic oncosuppressor regulating complement-dependent inflammation in cancer.23 The loss of SFRP1 expression is associated with colorectal cancer, prostate cancer, and renal cell cancer.24,25 Our analysis found that it may also play a tumor suppressor role in HNSC in association with a good prognosis. Gene TGFBR3 was found to play a dual role in bladder cancer, acting as both a tumor suppressor and as a tumor promoter.26 However, a previous study showed it can block lymph node metastasis in head and neck cancer.27 Our analysis shows that TGFBR3 is a protective gene in HNSC. VEGFC may contribute to HNSC growth and motility.28 There are few reports of functional experiments regarding PCOLCE2 in HNSC. In the present study, we found that PCOLCE2 is associated with poor prognosis in HNSC.
Furthermore, we also conducted GSEA to explore the biological characteristics of patients identified as high-risk patients by this nine-EMT hallmark gene-based RS. Based on the results of GSEA, high-risk HNSC is characterized by active EMT program, angiogenesis, MTORC1 signaling, unfold protein response (UPR) program, and high hypoxia. Hypoxia is common in HNSC cells and contributes to malignant behaviors, such as tumor progression, invasion, metastasis, and resistance to chemotherapy and radiotherapy.29 Recent studies suggest that the UPR may affect many hallmarks of cancer, including metastasis, genome stability, angiogenesis, inflammation, and drug resistance.30 These partially explain the reasons for the poor prognosis of the high-risk group. There are numerous ongoing efforts to target the mTOR signaling pathway for cancer therapy,31 however, whether active MTORC1 signaling in high-risk HNSC indicates the response to therapies for targeting mTORC1 signaling still needs further exploration.
Although the present study may provide new insight into the prognostic systems in HNSC, it has several noticed limitations. First, not all EMT hallmark genes were included in the analysis due to the data sets coming from different centers. Thus, the RS may be improved in further study. Secondly, the role of some of these nine genes in HNSC is not yet clear, therefore, it is not clear whether these genes are causal or merely markers for predicting prognosis in HNSC. Thirdly, the present study lacks molecular experimental verification of candidate molecules.
In conclusion, we proposed and validated a nine-EMT hallmark gene-based risk score system for predicting prognosis for patients with HNSC, and also preliminarily explained the biological characteristics of high-risk patients.
Data Sharing Statement
The data for this study can be obtained from Gene Expression Omnibus (https://www.ncbi.nlm.nih.gov/geo/) and in The Cancer Genome Atlas (https://www.cancer.gov/).
Funding
There is no funding to report.
Disclosure
The authors declare that they have no competing interests.
References
1. Bray F, Ferlay J, Soerjomataram I, Siegel RL, Torre LA, Jemal A. Global cancer statistics 2018: GLOBOCAN estimates of incidence and mortality worldwide for 36 cancers in 185 countries. CA Cancer J Clin. 2018;68(6):394–424. doi:10.3322/caac.21492
2. Torre LA, Bray F, Siegel RL, Ferlay J, Lortet-Tieulent J, Jemal A. Global cancer statistics, 2012. CA Cancer J Clin. 2015;65(2):87–108. doi:10.3322/caac.21262
3. Choi J, Gim JA, Oh C, et al. Association of metabolic and genetic heterogeneity in head and neck squamous cell carcinoma with prognostic implications: integration of FDG PET and genomic analysis. EJNMMI Res. 2019;9(1):97. doi:10.1186/s13550-019-0563-0
4. Amin MB, Greene FL, Edge SB, et al. The Eighth Edition AJCC cancer staging manual: continuing to build a bridge from a population-based to a more “personalized” approach to cancer staging. CA Cancer J Clin. 2017;67(2):93–99. doi:10.3322/caac.21388
5. Hanahan D, Weinberg RA. Hallmarks of cancer: the next generation. Cell. 2011;144(5):646–674. doi:10.1016/j.cell.2011.02.013
6. Lee SY, Jeong EK, Ju MK, et al. Induction of metastasis, cancer stem cell phenotype, and oncogenic metabolism in cancer cells by ionizing radiation. Mol Cancer. 2017;16(1):10. doi:10.1186/s12943-016-0577-4
7. Terry S, Savagner P, Ortiz-Cuaran S, et al. New insights into the role of EMT in tumor immune escape. Mol Oncol. 2017;11(7):824–846. doi:10.1002/1878-0261.12093
8. Smith BN, Bhowmick NA. Role of EMT in metastasis and therapy resistance. J Clin Med. 2016;5(2):17. doi:10.3390/jcm5020017
9. Smith A, Teknos TN, Pan Q. Epithelial to mesenchymal transition in head and neck squamous cell carcinoma. Oral Oncol. 2013;49(4):287–292. doi:10.1016/j.oraloncology.2012.10.009
10. Wichmann G, Rosolowski M, Krohn K, et al. The role of HPV RNA transcription, immune response-related gene expression and disruptive TP53 mutations in diagnostic and prognostic profiling of head and neck cancer. Int J Cancer. 2015;137(12):2846–2857. doi:10.1002/ijc.29649
11. Ritchie ME, Phipson B, Wu D, et al. limma powers differential expression analyses for RNA-sequencing and microarray studies. Nucleic Acids Res. 2015;43(7):e47. doi:10.1093/nar/gkv007
12. Subramanian A, Tamayo P, Mootha VK, et al. Gene set enrichment analysis: a knowledge-based approach for interpreting genome-wide expression profiles. Proc Natl Acad Sci U S A. 2005;102(43):15545–15550. doi:10.1073/pnas.0506580102
13. Liberzon A, Subramanian A, Pinchback R, Thorvaldsdottir H, Tamayo P, Mesirov JP. Molecular signatures database (MSigDB) 3.0. Bioinformatics. 2011;27(12):1739–1740. doi:10.1093/bioinformatics/btr260
14. Mootha VK, Lindgren CM, Eriksson KF, et al. PGC-1alpha-responsive genes involved in oxidative phosphorylation are coordinately downregulated in human diabetes. Nat Genet. 2003;34(3):267–273. doi:10.1038/ng1180
15. Zhang F, Liu Y, Yang Y, Yang K. Development and validation of a fourteen- innate immunity-related gene pairs signature for predicting prognosis head and neck squamous cell carcinoma. BMC Cancer. 2020;20(1):1015. doi:10.1186/s12885-020-07489-7
16. Ghafouri-Fard S, Gholipour M, Taheri M, Shirvani Farsani Z. MicroRNA profile in the squamous cell carcinoma: prognostic and diagnostic roles. Heliyon. 2020;6(11):e05436. doi:10.1016/j.heliyon.2020.e05436
17. Nunez Lopez YO, Victoria B, Golusinski P, Golusinski W, Masternak MM. Characteristic miRNA expression signature and random forest survival analysis identify potential cancer-driving miRNAs in a broad range of head and neck squamous cell carcinoma subtypes. Rep Pract Oncol Radiother. 2018;23(1):6–20. doi:10.1016/j.rpor.2017.10.003
18. Chen YP, Wang YQ, Lv JW, et al. Identification and validation of novel microenvironment-based immune molecular subgroups of head and neck squamous cell carcinoma: implications for immunotherapy. Ann Oncol. 2019;30(1):68–75. doi:10.1093/annonc/mdy470
19. Shibata R, Mori T, Du W, et al. Overexpression of cyclase-associated protein 2 in multistage hepatocarcinogenesis. Clin Cancer Res. 2006;12(18):5363–5368. doi:10.1158/1078-0432.CCR-05-2245
20. Gao H, Li L, Xiao M, et al. Elevated DKK1 expression is an independent unfavorable prognostic indicator of survival in head and neck squamous cell carcinoma. Cancer Manag Res. 2018;10:5083–5089. doi:10.2147/CMAR.S177043
21. Choudhary MM, France TJ, Teknos TN, Kumar P. Interleukin-6 role in head and neck squamous cell carcinoma progression. World J Otorhinolaryngol Head Neck Surg. 2016;2(2):90–97. doi:10.1016/j.wjorl.2016.05.002
22. Sheng X, Li Y, Li Y, et al. PLOD2 contributes to drug resistance in laryngeal cancer by promoting cancer stem cell-like characteristics. BMC Cancer. 2019;19(1):840. doi:10.1186/s12885-019-6029-y
23. Bonavita E, Gentile S, Rubino M, et al. PTX3 is an extrinsic oncosuppressor regulating complement-dependent inflammation in cancer. Cell. 2015;160(4):700–714. doi:10.1016/j.cell.2015.01.004
24. Baharudin R, Tieng FYF, Lee LH, Ab Mutalib NS. Epigenetics of SFRP1: the dual roles in human cancers. Cancers (Basel). 2020;12(2):445. doi:10.3390/cancers12020445
25. Atschekzei F, Hennenlotter J, Janisch S, et al. SFRP1 CpG island methylation locus is associated with renal cell cancer susceptibility and disease recurrence. Epigenetics. 2012;7(5):447–457. doi:10.4161/epi.19614
26. Liu XL, Xiao K, Xue B, et al. Dual role of TGFBR3 in bladder cancer. Oncol Rep. 2013;30(3):1301–1308. doi:10.3892/or.2013.2599
27. Fang WY, Kuo YZ, Chang JY, et al. The tumor suppressor TGFBR3 blocks lymph node metastasis in head and neck cancer. Cancers (Basel). 2020;12(6):1375. doi:10.3390/cancers12061375
28. Benke EM, Ji Y, Patel V, Wang H, Miyazaki H, Yeudall WA. VEGF-C contributes to head and neck squamous cell carcinoma growth and motility. Oral Oncol. 2010;46(4):e19–24. doi:10.1016/j.oraloncology.2010.02.006
29. Karar J, Maity A. Modulating the tumor microenvironment to increase radiation responsiveness. Cancer Biol Ther. 2009;8(21):1994–2001. doi:10.4161/cbt.8.21.9988
30. Urra H, Dufey E, Avril T, Chevet E, Hetz C. Endoplasmic reticulum stress and the hallmarks of cancer. Trends Cancer. 2016;2(5):252–262. doi:10.1016/j.trecan.2016.03.007
31. Magaway C, Kim E, Jacinto E. Targeting mTOR and metabolism in cancer: lessons and innovations. Cells. 2019;8(12):1584. doi:10.3390/cells8121584
 © 2021 The Author(s). This work is published and licensed by Dove Medical Press Limited. The full terms of this license are available at https://www.dovepress.com/terms.php and incorporate the Creative Commons Attribution - Non Commercial (unported, v3.0) License.
By accessing the work you hereby accept the Terms. Non-commercial uses of the work are permitted without any further permission from Dove Medical Press Limited, provided the work is properly attributed. For permission for commercial use of this work, please see paragraphs 4.2 and 5 of our Terms.
© 2021 The Author(s). This work is published and licensed by Dove Medical Press Limited. The full terms of this license are available at https://www.dovepress.com/terms.php and incorporate the Creative Commons Attribution - Non Commercial (unported, v3.0) License.
By accessing the work you hereby accept the Terms. Non-commercial uses of the work are permitted without any further permission from Dove Medical Press Limited, provided the work is properly attributed. For permission for commercial use of this work, please see paragraphs 4.2 and 5 of our Terms.