")
Back to Journals » Drug Design, Development and Therapy » Volume 15
An Ensemble Model for Prediction of Vancomycin Trough Concentrations in Pediatric Patients
Authors Huang X, Yu Z, Bu S, Lin Z, Hao X , He W, Yu P, Wang Z, Gao F, Zhang J, Chen J
Received 31 December 2020
Accepted for publication 18 March 2021
Published 14 April 2021 Volume 2021:15 Pages 1549—1559
DOI https://doi.org/10.2147/DDDT.S299037
Checked for plagiarism Yes
Review by Single anonymous peer review
Peer reviewer comments 3
Editor who approved publication: Dr Georgios Panos
Xiaohui Huang,1,* Ze Yu,2,* Shuhong Bu,1 Zhiyan Lin,1 Xin Hao,3 Wenjun He,2 Peng Yu,2 Zeyuan Wang,2 Fei Gao,2 Jian Zhang,1 Jihui Chen1
1Department of Pharmacy, Xinhua Hospital, Shanghai Jiaotong University School of Medicine, Shanghai, People’s Republic of China; 2Beijing Medicinovo Technology Co. Ltd., Beijing, People’s Republic of China; 3Dalian Medicinovo Technology Co. Ltd., Dalian, Liaoning Province, People’s Republic of China
*These authors contributed equally to this work
Correspondence: Jihui Chen; Jian Zhang
Department of Pharmacy, Xinhua Hospital, Shanghai Jiaotong University School of Medicine, Shanghai, People’s Republic of China
Tel +86-2125077155
; +86-2125077150
Email [email protected]; [email protected]
Purpose: This study aimed to establish an optimal model to predict vancomycin trough concentrations by using machine learning.
Patients and Methods: We enrolled 407 pediatric patients (age < 18 years) who received vancomycin intravenously and underwent therapeutic drug monitoring from June 2013 to April 2020 at Xinhua Hospital affiliated to Shanghai Jiaotong University School of Medicine. The median (interquartile range) age and weight of the patients were 2 (0.63– 5) years and 12 (7.8– 19) kg. Vancomycin trough concentrations were considered as the target variable, and eight different algorithms were used for predictive performance comparison. The whole dataset (407 cases) was divided into training group and testing group at the ratio of 80%: 20%, which were 325 and 82 cases, respectively.
Results: Ultimately, five algorithms (XGBoost, GBRT, Bagging, ExtraTree and decision tree) with high R 2 (0.657, 0.514, 0.468, 0.425 and 0.450, respectively) were selected and further ensembled to establish the final model and achieve an optimal result. For missing data, through filling the missing values and model ensemble, we obtained R 2=0.614, MAE=3.32, MSE=24.39, RMSE=4.94 and a prediction accuracy of 51.22% (predicted trough concentration within ± 30% of the actual trough concentration). In comparison with the pharmacokinetic models (R 2=0.3), the machine learning model works better in model fitting and has better prediction accuracy.
Conclusion: Therefore, the ensemble model is useful for the vancomycin concentration prediction, especially in the population of children with great individual variation. As machine learning methods evolve, the clinical value of the ensemble model will be demonstrated in the clinical practice.
Keywords: machine learning, XGBoost, prediction, vancomycin, trough concentration, pediatric patients
Introduction
Vancomycin is an important antibiotic primarily used in the treatment of invasive multidrug-resistant organism infections, especially methicillin-resistant Staphylococcus aureus (MRSA) and ampicillin R, in both adults and children.1 For pediatric patients, compared with adults, the pharmacokinetics of vancomycin is highly variable due to their wide differences in terms of weight, development and organ function.2–4
In clinical practice, vancomycin trough serum concentration is monitored to evaluate the dosage appropriateness.5 At present, studies about vancomycin concentration analysis commonly adopt the population pharmacokinetic (PPK) models, which are affected by a few factors, such as age, weight and creatinine/creatinine clearance rate.1,6 According to the guideline on vancomycin monitoring, trough concentrations in the range 15–20 mg/L were recommended for serious infections to improve clinical outcomes and prevent drug resistance.7,8 Based on the daily monitoring of vancomycin concentration, we found that great individual variation exists among children, with generally low concentrations of vancomycin, most of which cannot reach the effective blood drug concentration, hence the PPK model may not be suitable to predict the dosage for children. As it is challenging to achieve recommended trough concentrations in children, therapeutic drug monitoring (TDM) in pediatric patients is necessary.6
So far, some vancomycin concentration prediction algorithms were developed using linear regression analysis in adult and pediatric patients.9,10 The rapidly developing machine learning methods can help promote data-driven estimation when predicting from multiple variables and capture non-linear variable relations to achieve high accuracy in predicting clinical outcomes.11,12 This article aims to establish an optimal model to predict vancomycin trough concentrations in pediatric patients by using machine learning methods.
Methods
Study Population
Patients who were treated with vancomycin and underwent therapeutic drug monitoring at Xinhua Hospital affiliated to Shanghai Jiaotong University School of Medicine from June 2013 to April 2020 were enrolled in this study. The inclusion criteria were as follows: (i) age < 18 years, (ii) patients were administered intravenous vancomycin, and (iii) vancomycin TDM was performed on day 3 (48 h since the initiation of vancomycin therapy). The exclusion criteria were as follows: (i) new-borns with age < 1 month, and (ii) patients lacking specific blood collection time. Finally, 407 pediatric patients were included in the study.
Vancomycin daily dose information, demographic data and laboratory results were obtained from each patient’s electronic record. Vancomycin blood concentrations were determined by the clinical laboratory of hospital, and previous methods were used.13 To be specific, the chromatographic bar was Hypersil BDS C18 (250 mm × 4.6 mm, 5 μm). The mobile phase was tribasic potassium phosphate buffer-methanol (92.5: 7.5, v/v). The detecting wavelength of ultraviolet was 236 nm. Standard curve was linear in the range of 1.5625–100 mg·L−1, and the average method recovery rate of three concentrations (3.125, 25, 50 mg/L) were 96.2%, 100.8% and 103.5%, respectively. The within-day relative standard deviation (RSD) was less than 3.24%, and between-day RSD less than 6.12%. The limit of detection (LOD) of the method was 0.4735 mg·L−1, and the limit of quantity (LOQ) was 1.5625 mg·L−1. After the fourth dose of continuous administration, the blood samples of vancomycin trough concentrations were obtained at 0–30 min before intravenous infusion. Blood samples should not be administered in the intravenous channel for vancomycin infusion. If the patient had not reached a steady-state dose adjustment, vancomycin trough concentrations could be administered according to the above rules after adjusting the dosage regimen and administering 2 or 3 doses. This study has been approved by the Ethics Committee of Xinhua Hospital affiliated to Shanghai Jiaotong University School of Medicine (XHEC-D-2020-157) and was performed in accordance with the Declaration of Helsinki, and informed consents have been exempted in the ethical approval documents.
Data Processing
After data cleaning of the vancomycin dataset, the target variable and the relevant important covariates were screened. Multivariate Imputation by Chained Equations (MICE) package in R language was used to fill the missing data, and a dataset of 407×24 was obtained. Based on the final dataset, we chose vancomycin trough concentrations as the target variable, and the whole dataset was divided into training group and testing group at the ratio of 80%: 20% (Figure 1), which were 325 and 82 cases, respectively. The datasets are available in the Supplementary Table 1.
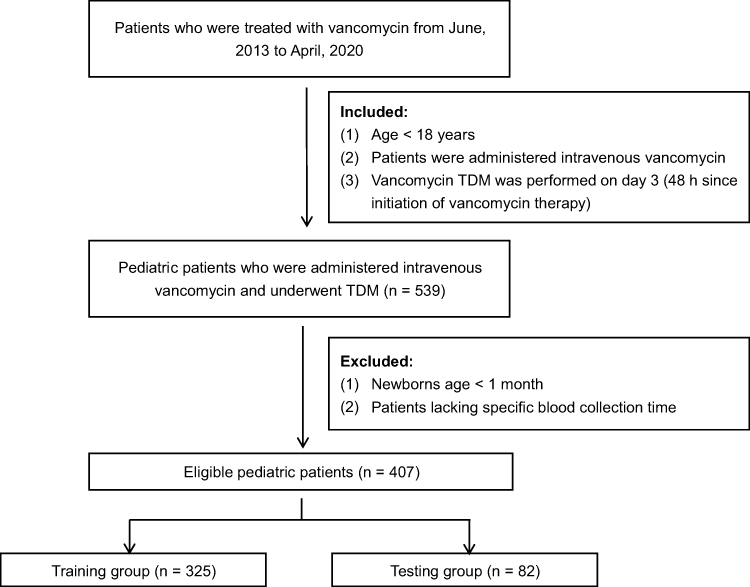 |
Figure 1 Flowchart of the process of including pediatric patients with intravenous vancomycin in this study. |
Algorithm Selection
We used eight different algorithms for modeling to compare the prediction abilities of different algorithms on vancomycin trough concentrations, including decision tree (DT), support vector regression (SVR), random forest (RF), Adaboost, Bagging, ExtraTree, GBRT and XGBoost. Algorithms with higher accuracy values were selected for the prediction model of vancomycin trough concentrations. The steps of processing and analyzing data are displayed in Figure 2.
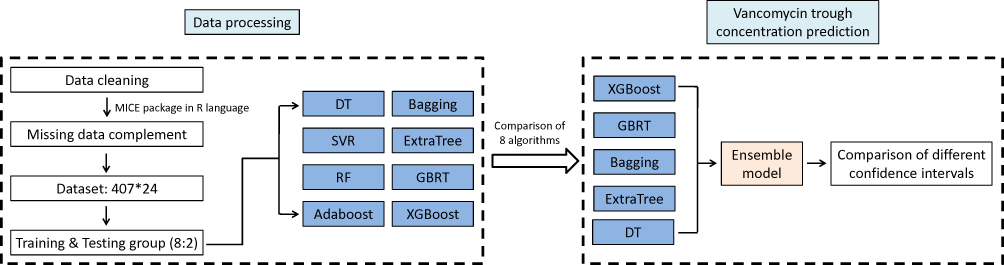 |
Figure 2 The workflow of data processing and algorithm selection. |
Ensemble Model
According to the ranking of the prediction results of different algorithms, the proportion of a single model in the final model was determined, and the final output result was the weighted average of selected models. Four evaluation metrics were used to evaluate the model prediction ability, including R-squared (R2), mean square error (MSE), root mean square error (RMSE) and mean absolute error (MAE); the calculating formulas are as follows:
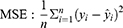
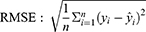
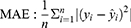
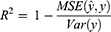
R2 represents the goodness of fit of the model, and the value range is 0–1. The larger the value, the better the fitting of the model. In terms of MSE, RMSE and MAE, when their values get smaller, the model has better goodness of fit.
Furthermore, another 20 patients’ data from the hospital were chosen as the validation group to validate the model prediction performance.
Comparison with PPK Model
The results of the ensemble model using machine learning were compared with the predicted values of drug trough concentration calculated by population pharmacokinetic model. When the administration reached steady state, the model for calculating the steady-state trough concentration was as follows:14,15
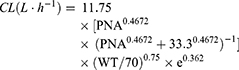

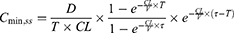
CL: clearance rate; PNA: postnatal age; WT: weight; V: volume of distribution; D: dose; T: infusion time; τ: intervals; Cmin,ss: steady-state serum trough concentration.
Statistical Analysis
In the comparison between training group and testing group, Mann–Whitney U-test was used to analyze the continuous variables. For the categorical variables, if the expected frequency (T) ≥ 5 and total sample size (n) ≥ 40, Pearson chi-square test was applied; if 1 ≤ T < 5 and n ≥ 40, continuous correction chi-square test was applied; and if T < 1 or n < 40, Fisher’s exact test was applied. SPSS 20 was used for statistical analysis, and the Bayesian analysis module in the NONMEM software was used to obtain the predicted value of the patient’s individual concentration and compare it with the measured value according to the vancomycin PPK model from literature.
Results
Study Population
A total of 407 pediatric patients who were treated with intravenous vancomycin were included in the study. The baseline information of 24 variables was described as frequencies (percentages) for categorical variables and median (interquartile range, IQR) for continuous variables, illustrated in Supplementary Table 1. The median (IQR) age and weight were 2 (0.63–5) years and 12 (7.8–19) kg. A comparison of patient characteristics between the training and testing groups is shown in Table 1, without any significant difference between variables of two groups (p > 0.01).
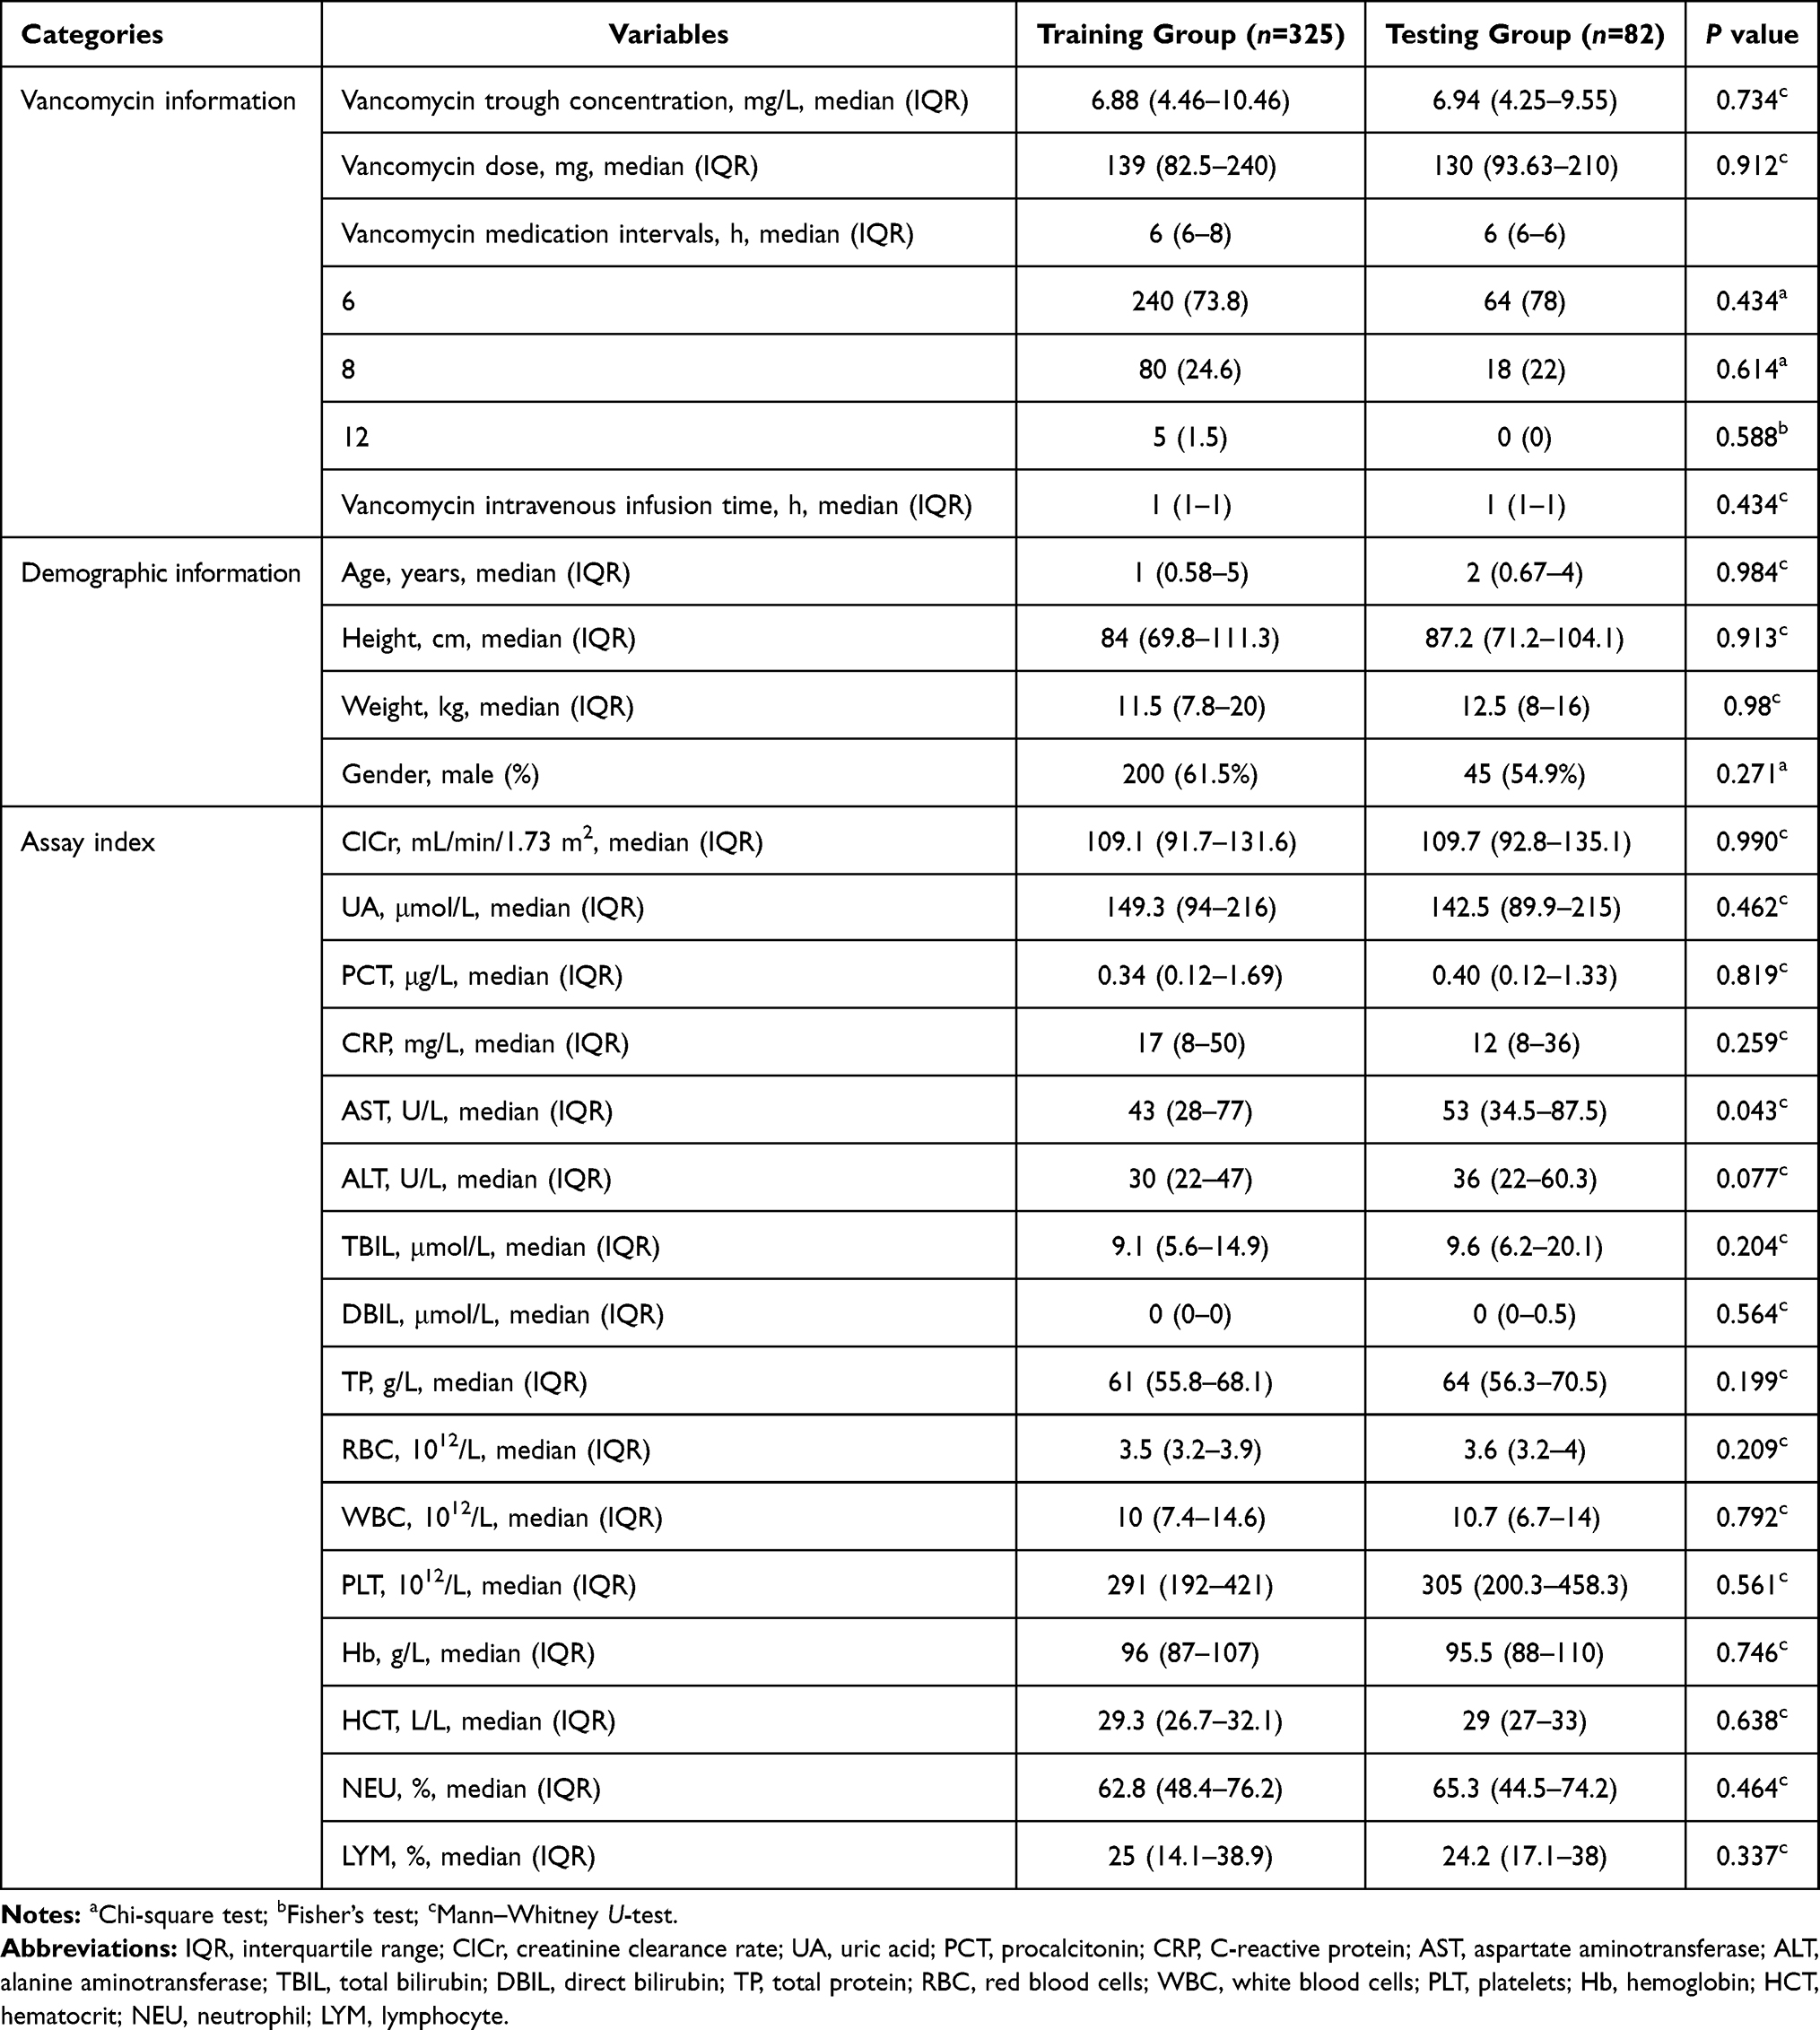 |
Table 1 Variable Characteristics in Training and Testing Groups |
Algorithm Selection
The prediction results of eight models using different algorithms are listed in Table 2. Among the eight algorithms, the algorithms for modeling with higher ideal predictive percentage were XGBoost (42.68%), GBRT (43.9%), ExtraTree (41.46%), Bagging (45.12%) and DT (42.68%). The five algorithms mentioned have a low prediction error in terms of MAE, MSE and RMSE. The degree of model fitting was evaluated using R2. XGBoost, GBRT, ExtraTree, Bagging and DT had high goodness of fit, which is 0.514, 0.657, 0.468, 0.425 and 0.450, respectively. Therefore, in general, these five algorithms with good performance were suitable for prediction in the task of estimating vancomycin concentration for children. Based on the comparison of algorithms, we selected the outperforming algorithms for subsequent experiment. Since there were some missing values, MICE package was used to impute the missing data, in order to improve the prediction accuracy and model fitting degree. Through comparison in Table 3 (take XGBoost as example), it can be seen that both R2 and the prediction accuracy of the dataset after imputation with missing values are considerably improved for prediction, and imputation error rate was 9.88%.
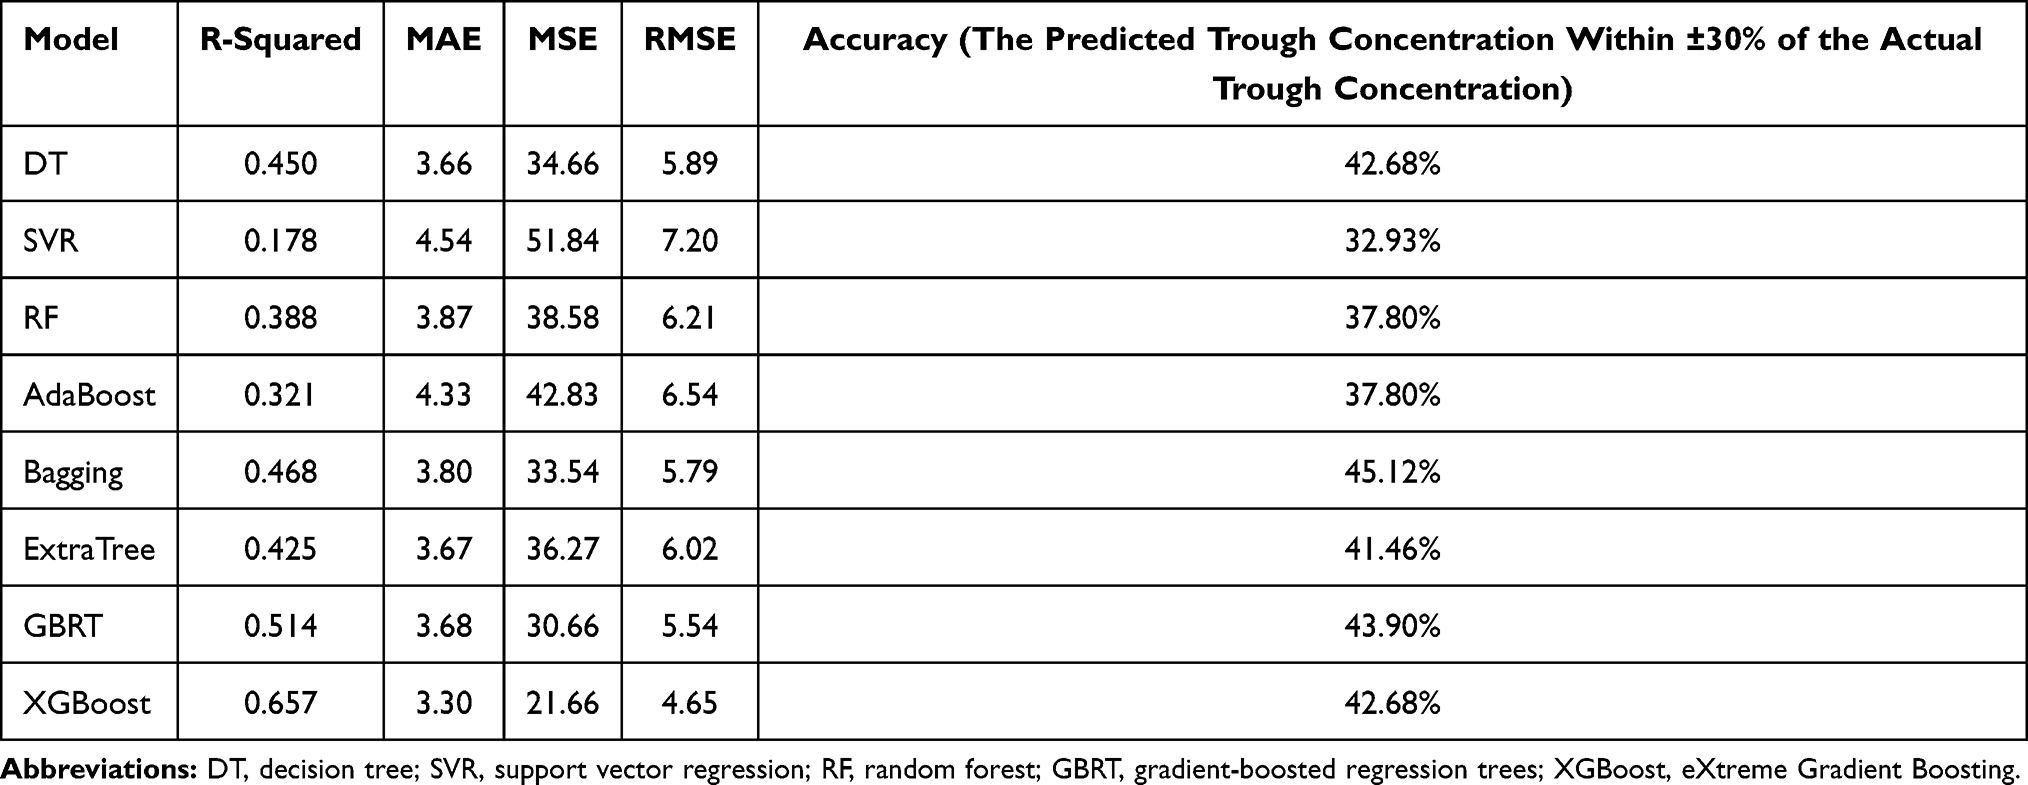 |
Table 2 Prediction Results of Eight Different Algorithms |
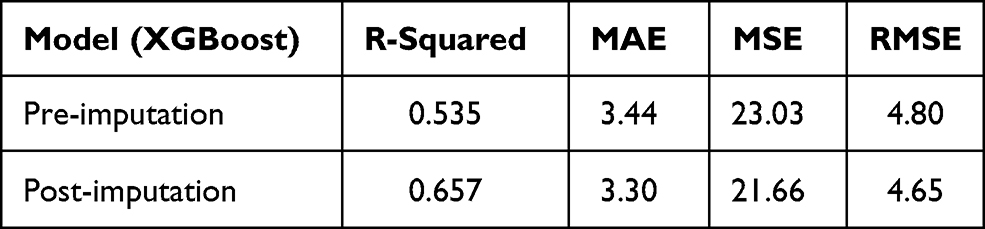 |
Table 3 Model Performance Metrics Pre- and Post-Imputation |
Modeling and Validation
Among the candidate algorithms, five machine learning models have high R2 (degree of model fitting), including XGBoost, GBRT, Bagging, ExtraTree and DT, and the output of the final ensemble model was account for their weight proportion. After adjustment, the ratio of XGBoost, GBRT, Bagging, ExtraTree and DT is 4:4:1:0.5:0.5. The importance scores of variables in each selected model were calculated and ranked. XGBoost model occupied a large proportion among the five models with the highest R2 (0.657), and its important variables include creatinine clearance rate (ClCr), procalcitonin (PCT), uric acid (UA) and weight. Among these, PCT, UA and weight were positively related to vancomycin trough concentration, whereas ClCr was negatively correlated. In the testing group of the final ensemble model, the R2 = 0.614 and the prediction accuracy within ±30% of the actual trough concentration was 51.22% (Table 4). In terms of the validation of the ensemble model, we collected another 20 patients’ data from the hospital as the validation group to analyze the prediction performance. As shown in Table 4, the accuracy of the predicted trough concentration within ±30% of the actual trough concentration in the ensemble model achieves 72.69%, much higher than the testing group (51.22%), and R2 in the ensemble model (0.622) is also slightly higher than in the testing group (0.614). We can see from the validation group that the ensemble model has a good prediction ability, even better than the testing group, indicating that the model has a strong capacity of generalization.
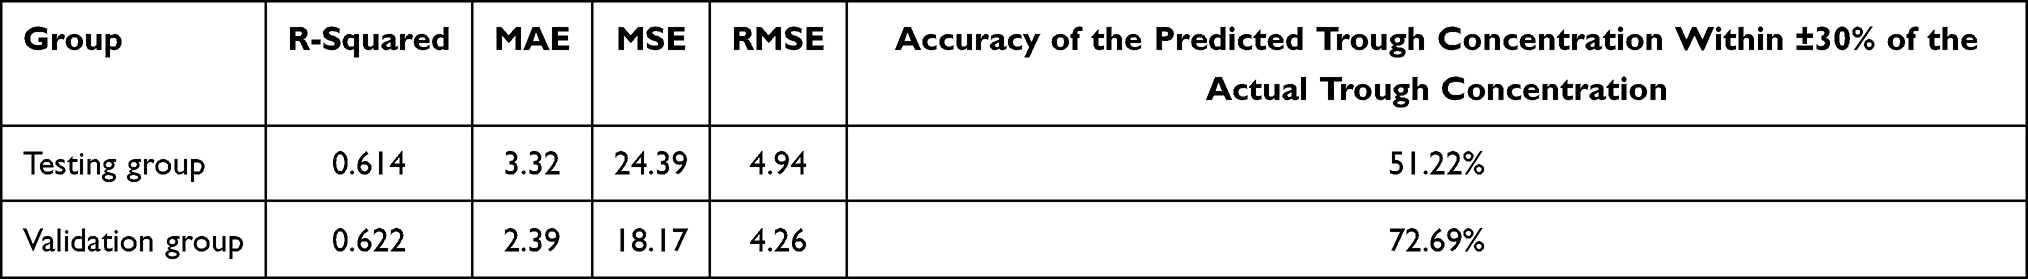 |
Table 4 Predicted Results of the Ensemble Model |
Based on the data of the testing group, the predicted and actual results of vancomycin in the models are respectively displayed to longitudinally compare the prediction performance (Figure 3). The five selected models have their own predictive advantages in different intervals, and the ensemble model shows predictive trough concentration closer to the true value than before ensemble.
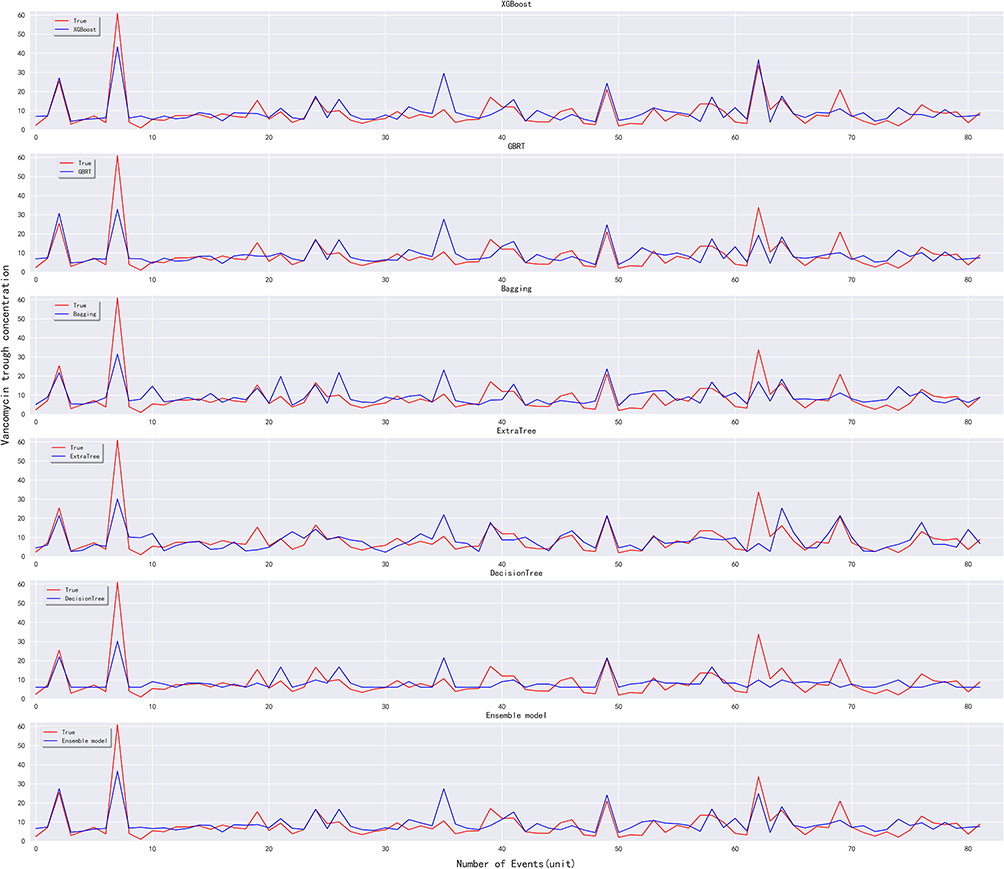 |
Figure 3 Comparison of vancomycin predicted and actual results in the models. The red curve indicates the actual trough concentration, and blue curve indicates the predicted trough concentration. |
Comparison with PPK Model
The predicted results of the ensemble model by using machine learning methods were visually compared with those using pharmacokinetic formulas, showing the accuracy of the predicted trough concentration within ±30% and ±50% of the actual trough concentration (Figure 4). As illustrated in Table 5, in comparison with the PPK model, the accuracy of the predicted trough concentration within ±30% of the actual trough concentration in the ensemble model was 51.22%, which outperforms the value of 36.59% in the PPK model. Generally, the results of machine learning models were superior to those of the PPK model. Moreover, the R2 of the model using pharmacokinetic formula (0.3) was lower than the ensemble model (0.614), showing poorer predictive ability.
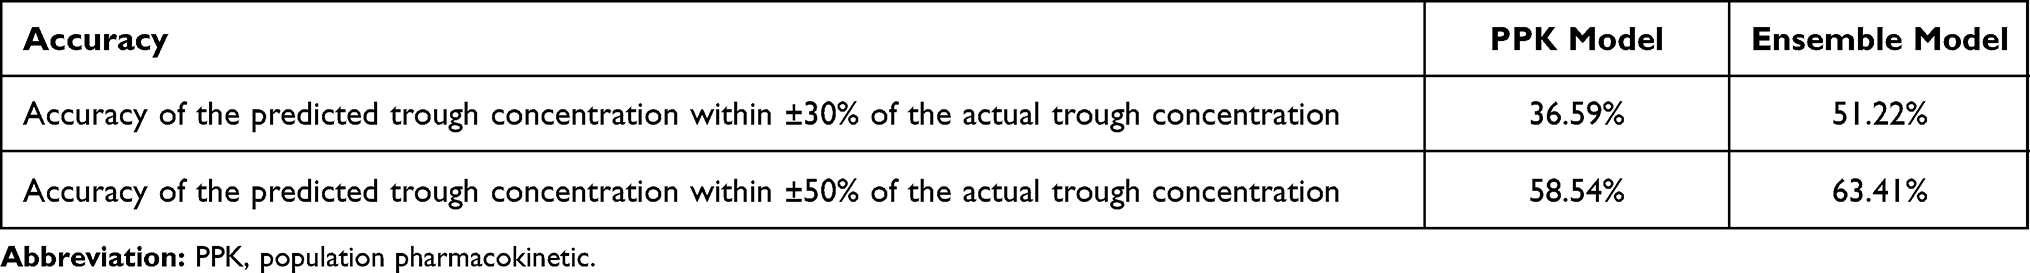 |
Table 5 Comparison of Prediction Accuracy Between the Ensemble Model and PPK Model |
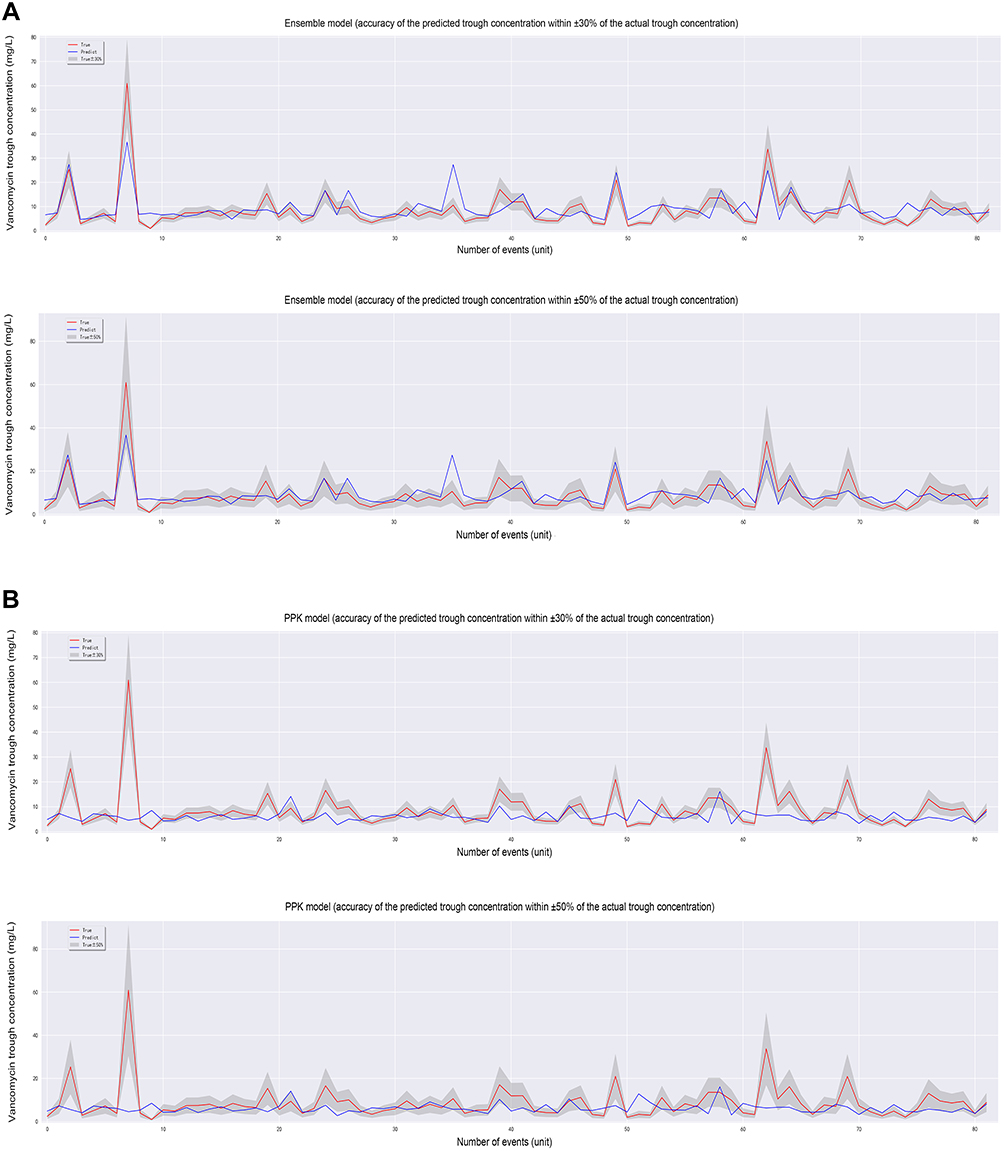 |
Figure 4 The prediction accuracy of the ensemble model and PPK model. The red curve indicates the actual trough concentration, the blue curve indicates the predicted trough concentration and the shadow represents ±30% (A) and ±50% (B) of the actual trough concentration, respectively. |
Discussion
In this study, we compared the prediction ability of vancomycin trough concentrations by applying eight machine learning techniques for pediatric patients. In terms of MSE, the ensemble model (MSE=24.39) outperforms other algorithms, excluding XGBoost (MSE=21.66). However, the accuracy of the predicted trough concentration within ±30% of the actual trough concentration in the ensemble model (51.22%) is superior to XGBoost (42.68%), and their values of R2 are close (0.657 and 0.614, respectively). The final selection of model depends not only on metric value, but also on clinical value, which is the ability to predict vancomycin trough concentration at a certain confidence interval. Therefore, the ensemble model was deemed as an optimal model for clinical use, better than a single algorithm model.
In the XGBoost model, the selected variables with substantial influences on vancomycin trough concentrations include ClCr, PCT, UA and weight. As the negative correlator for vancomycin trough concentrations, ClCr is a marker of renal function and has remarkable associations with drug exposure and clearance, and its reduction indicates kidney injury caused by vancomycin.7,16 A high UA represents poor kidney function, and PCT is highly correlated with severe infections, especially sepsis, both showing positive relationships with vancomycin trough concentrations.17
A proper initial dosing regimen can quickly make vancomycin concentration reach the ideal range, which is very important for the success of anti-infection against MRSA, but its clinical application is hard to realize. At present, clinicians commonly use fixed doses of 10–15 mg/kg q6h for children or use pharmacokinetic formulas to calculate the initial dosage regimen. However, most pharmacokinetic formulas involve only a few parameters such as age, weight, creatinine or creatinine clearance to calculate pharmacokinetic parameters. Hence, the process relies on suitable prior general PPK information, and a deviation from the actual situation of clinical patients is inevitable, leading to limited clinical applications. In the present study, with the application of machine learning methods, more variables were analyzed, and their remarkable relations with vancomycin trough concentrations were determined, thus improving the prediction.
In the era of health information technology, machine learning-based prediction has the advantage of scalability; for example, the prediction model is updated by automatically extracting electronic health records and continuously monitoring physiological data.18,19 In selecting the machine learning method to be applied in predictive modeling in continuous features, many factors can be considered. For instance, based on the advantages of XGBoost, it uses second-order Taylor series to estimate the value of the loss function, thus reducing the likelihood of overfitting by the application of regularization, and this method has an excellent performance for processing large-scale and high-dimensional data.7 Moreover, GBRT is an iterative algorithm, which combines several decision trees and often results in high accuracy, which cannot be obtained by using a single decision tree.20 The main motivation behind the ensemble model is that each model will provide complementary information and reduce bias.21 In most practical scenarios, the model that includes multiple algorithms results in a higher accuracy for each given dataset than does a single algorithm.22 In addition to the eight selected algorithms, artificial neural networks (ANN) have also been used, such as Enzo. However, in some cases, ANN can accurately adapt to the training group, but perform poorly in the testing group. ANN usually require more data than the commonly used machine learning algorithms, with thousands or even millions of pieces of data. Datasets in this study are small, hence the results of ANN are unstable and the training on small datasets is inadequate. In addition, support vector regression (SVR) can generate a good generalized model, but in our results, the SVR does not achieve the desired effect. We found the integrated learning method shows good performance in regression modeling and is superior to the single regression model in prediction by reducing bias and variance. The five selected models (XGBoost, GBRT, Bagging, ExtraTree and DT) have their own predictive advantages in different intervals, and the ensemble model shows predictive trough concentration closer to the true value than before integration. In the present study, based on the comparison with the PPK model, the ensemble model achieves higher prediction accuracy and R2 after dealing with large-volume and high-dimensional data. Overall, our study confirms that machine learning methods are suitable for high-dimensional clinical data modeling.
Currently, there are no accepted standards for the prediction accuracy. The accuracy of the predicted trough concentration within ±10% or ±20% of the actual trough concentration in both the PPK model and the ensemble model was low and close. Thus we only showed the accuracy of the predicted trough concentration within ±30% and ±50% of the actual trough concentration and chose ±30% as the main comparative indicator. Moreover, the variability of children is great, and it is hard to predict their situation, especially in severely infected children, therefore the accuracy of the predicted trough concentration within ±30% of the actual trough concentration is relatively low (51.22%), as in the PPK model.
According to a Revised Consensus Guideline and Review by the American Society of Health-system Pharmacists (ASHP), the Infectious Diseases Society of America (IDSA), the Pediatric Infectious Diseases Society (PIDS) and the Society of Infectious Diseases Pharmacists (SIDP) in 2020, the use of AUC to guide vancomycin regimen in adults and children is recommended, and indeed AUC is currently recognized to be superior to trough concentration in guiding drug use.1 At present, the methods of AUC estimation are mainly through first-order PPK equations or Bayesian software programs. Bayesian software programs are widely used in clinical practice, only using trough concentration, but the accuracy of AUC estimation is not high enough in special groups, such as children with severe infection, and there are few Bayesian software programs suitable for Chinese children. In addition, the first-order PPK equations can accurately estimate the AUC value not depending on PPK information, which is more suitable for special populations, but the AUC estimation requires the concentration of vancomycin at both peak and trough time points. In this study, we have collected some children’s peak–trough vancomycin data and estimated AUC through the first-order PPK equations, but the data are still not enough for machine learning.
Our study is to demonstrate the effectiveness and advantages of machine learning in this field by comparing with PPK methods. In the future, we will collect more data from pediatric patients and use machine learning methods to estimate AUC based on findings from this paper, which we believe is more meaningful. The study is also limited by the small sample size, thus limiting the advantage of machine learning. Despite this limitation, the results are still better than the PPK model in predicting vancomycin concentration. In future, a larger sample size should be used for model establishment to achieve optimal prediction effects.
Conclusion
In conclusion, our ensemble model is potentially useful for the vancomycin concentration prediction, especially in the population of children with great individual variation. This study aimed to lower the barriers to implementing machine learning methods in this field. As machine learning methods evolve, the principles for good practice reviewed in this article will likely serve health services researchers well into the future.
Data Sharing Statement
The datasets generated for this study are available from the Supplementary Table 1.
Ethics Approval
Our research was approved by the ethics committee of Xin Hua Hospital Affiliated to Shanghai Jiao Tong University School of Medicine (Approval No. XHEC-D-2020-0157) and was performed in accordance with the Declaration of Helsinki. All procedures performed in the present study involving human participants are in accordance with the ethical standards of the institutional research committees. The study data have been fully deidentified, and confidential information on patients has been deleted.
Acknowledgments
The authors would like to thank the Shanghai Jiaotong University School of Medicine for the help and support.
Author Contributions
Xiaohui Huang, Ze Yu and Zhiyan Lin designed the study. Xiaohui Huang and Jihui Chen collected the data and executed the study. Peng Yu and Zeyuan Wang were responsible for statistical analysis. Peng Yu, Zeyuan Wang, Xin Hao and Wenjun He drafted and wrote the manuscript. Shuhong Bu, Jian Zhang, Fei Gao, Xiaohui Huang, Ze Yu, Jihui Chen and Zhiyan Lin revised and reviewed the manuscript. All authors contributed to data interpretation. All authors agreed on the journal to which the article will be submitted, agreed the submission, reviewed and accepted the article for publication and agreed to take responsibility and be accountable for the contents of the article.
Funding
This work was partially supported by the National Key R&D Program of China (2020YFC2005502), the Innovation program of Shanghai Health Commission (No. 201840121) and the Clinical Pharmacy Innovation Institute, Shanghai Jiaotong University School of Medicine (No. CXYJY2019ZD001).
Disclosure
Ze Yu, Wenjun He, Peng Yu, Zeyuan Wang, and Fei Gao are affiliated with Beijing Medicinovo Technology Co. Ltd. Xin Hao is affiliated with Dalian Medicinovo Technology Co. Ltd. The authors declare that the research was conducted in the absence of any commercial or financial relationships that could be construed as a potential conflict of interest.
References
1. Rybak MJ, Le J, Lodise TP, et al. Therapeutic monitoring of vancomycin for serious methicillin-resistant Staphylococcus aureus infections: a revised consensus guideline and review by the American Society of Health-System Pharmacists, the Infectious Diseases Society of America, the Pediatric Infectious Diseases Society, and the Society of Infectious Diseases Pharmacists. Am J Health Syst Pharm. 2020;77(11):835–864.
2. Frymoyer A, Hersh AL, El-Komy MH, et al. Association between vancomycin trough concentration and area under the concentration-time curve in neonates. Antimicrob Agents Chemother. 2014;58(11):6454–6461. doi:10.1128/AAC.03620-14
3. Grimsley C, Thomson AH. Pharmacokinetics and dose requirements of vancomycin in neonates. Arch Dis Child Fetal Neonatal Ed. 1999;81(3):F221–7. doi:10.1136/fn.81.3.F221
4. Capparelli EV, Lane JR, Romanowski GL, et al. The influences of renal function and maturation on vancomycin elimination in newborns and infants. J Clin Pharmacol. 2001;41(9):927–934. doi:10.1177/00912700122010898
5. Frymoyer A, Guglielmo BJ, Hersh AL. Desired vancomycin trough serum concentration for treating invasive methicillin-resistant Staphylococcal infections. Pediatr Infect Dis J. 2013;32(10):1077–1079. doi:10.1097/INF.0b013e318299f75c
6. Ivanova X, Liu X, Tran N, et al. Influence of demographic and clinical variables on vancomycin trough values in pediatric burn patients. Am Burn Assoc. 2018.
7. Wilbaux M, Fuchs A, Samardzic J, et al. Pharmacometric approaches to personalize use of primarily renally eliminated antibiotics in preterm and term neonates. J Clin Pharmacol. 2016;56(8):909–935. doi:10.1002/jcph.705
8. Marsot A, Boulamery A, Bruguerolle B, et al. Vancomycin: a review of population pharmacokinetic analyses. J Clin Pharmacokinet. 2012;51(1):1. doi:10.2165/11596390-000000000-00000
9. Kobayashi R, Otomo S, Shiba Y, et al. Improvement of predictivity of teicoplanin serum trough concentrations at steady state calculated by vancomycin pharmacokinetic parameter. Pharm Soc Jpn. 2016;136(11):1557. doi:10.1248/yakushi.16-00025
10. Ohnishi A, Yano Y, Ishibashi T, et al. Evaluation of Bayesian predictability of vancomycin concentration using population pharmacokinetic parameters in pediatric patients. J Drug Metab Pharmacokinet. 2005;20(6):415–422. doi:10.2133/dmpk.20.415
11. Obermeyer Z, Emanuel EJ. Predicting the future - big data, machine learning, and clinical medicine. N Engl J Med. 2016;375(13):1216–1219. doi:10.1056/NEJMp1606181
12. Doupe P, Faghmous J, Basu S. Machine learning for health services researchers. Value Health. 2019;22(7):808–815. doi:10.1016/j.jval.2019.02.012
13. Li X, Wang F, Xu B, et al. Determination of the free and total concentrations of vancomycin by two-dimensional liquid chromatography and its application in elderly patients. J Chromatogr B Analyt Technol Biomed Life Sci. 2014;15(969):181–189. doi:10.1016/j.jchromb.2014.08.002
14. Liu T, Deng C, Cheng D, et al. Population pharmacokinetics of vancomycin in Chinese pediatric patients. Int J Clin Pharmacol Ther. 2017;55(6):509–516. doi:10.5414/CP202835
15. Guo Q, Liu T, Jing L, et al. Predictive performance and analysis of a vancomycin population pharmacokinetic model in Chinese pediatric patients. Acta Pharm Sin. 2019;54(3):528–532.
16. Gomes DM, Smotherman C, Birch A, et al. Comparison of acute kidney injury during treatment with vancomycin in combination with piperacillin-tazobactam or cefepime. J Pharmacother. 2014;34(7):662–669. doi:10.1002/phar.1428
17. Barati M, Alinejad F, Bahar MA, et al. Procalcitonin, C-reactive protein ESR and WBC count: marker of sepsis in burn patients. Int J Infect Dis. 2008;12(1).
18. Ting DSW, Cheung CY, Lim G, et al. Development and validation of a deep learning system for diabetic retinopathy and related eye diseases using retinal images from multiethnic populations with diabetes. JAMA. 2017;318(22):2211–2223. doi:10.1001/jama.2017.18152
19. Kolachalama VB, Singh P, Lin CQ, et al. Association of pathological fibrosis with renal survival using deep neural networks. Kidney Int Rep. 2018;3(2):464–475. doi:10.1016/j.ekir.2017.11.002
20. Huang Y, Liu Y, Li C, et al. GBRTVis: online analysis of gradient boosting regression tree. J Vis. 2018;22(1):125–140. doi:10.1007/s12650-018-0514-2
21. Matlock K, De Niz C, Rahman R, Ghosh S, Pal R. Investigation of model stacking for drug sensitivity prediction. BMC Bioinform. 2018;19(Suppl 3):71. doi:10.1186/s12859-018-2060-2
22. Stanfield Z, Coskun M, Koyutürk M. Drug response prediction as a link prediction problem. Sci Rep. 2017;7.
 © 2021 The Author(s). This work is published and licensed by Dove Medical Press Limited. The full terms of this license are available at https://www.dovepress.com/terms.php and incorporate the Creative Commons Attribution - Non Commercial (unported, v3.0) License.
By accessing the work you hereby accept the Terms. Non-commercial uses of the work are permitted without any further permission from Dove Medical Press Limited, provided the work is properly attributed. For permission for commercial use of this work, please see paragraphs 4.2 and 5 of our Terms.
© 2021 The Author(s). This work is published and licensed by Dove Medical Press Limited. The full terms of this license are available at https://www.dovepress.com/terms.php and incorporate the Creative Commons Attribution - Non Commercial (unported, v3.0) License.
By accessing the work you hereby accept the Terms. Non-commercial uses of the work are permitted without any further permission from Dove Medical Press Limited, provided the work is properly attributed. For permission for commercial use of this work, please see paragraphs 4.2 and 5 of our Terms.