")
Back to Journals » International Journal of Nanomedicine » Volume 9 » Issue 1
An ensemble method approach to investigate kinase-specific phosphorylation sites
Authors Datta S, Mukhopadhyay S
Received 13 November 2013
Accepted for publication 29 January 2014
Published 10 May 2014 Volume 2014:9(1) Pages 2225—2239
DOI https://doi.org/10.2147/IJN.S57526
Checked for plagiarism Yes
Review by Single anonymous peer review
Peer reviewer comments 3
Sutapa Datta, Subhasis Mukhopadhyay
Department of Biophysics, Molecular Biology and Bioinformatics and Distributed Information Centre for Bioinformatics, University of Calcutta, West Bengal, India
Abstract: Protein phosphorylation is one of the most significant and well-studied post-translational modifications, and it plays an important role in various cellular processes. It has made a considerable impact in understanding the protein functions which are involved in revealing signal transductions and various diseases. The identification of kinase-specific phosphorylation sites has an important role in elucidating the mechanism of phosphorylation; however, experimental techniques for identifying phosphorylation sites are labor intensive and expensive. An exponentially increasing number of protein sequences generated by various laboratories across the globe require computer-aided procedures for reliably and quickly identifying the phosphorylation sites, opening a new horizon for in silico analysis. In this regard, we have introduced a novel ensemble method where we have selected three classifiers (least square support vector machine, multilayer perceptron, and k-Nearest Neighbor) and three different feature encoding parameters (dipeptide composition, physicochemical properties of amino acids, and protein–protein similarity score). Each of these classifiers is trained on each of the three different parameter systems. The final results of the ensemble method are obtained by fusing the results of all the classifiers by a weighted voting algorithm. Extensive experiments reveal that our proposed method can successfully predict phosphorylation sites in a kinase-specific manner and performs significantly better when compared with other existing phosphorylation site prediction methods.
Keywords: post-translational modification, cell signaling, phosphate
Introduction
Protein phosphorylation, an important reversible post-translational modification, occurs due to the addition of a covalently bound phosphate group into certain acceptor residues (serine, threonine, and tyrosine) in the substrate sequence by a group of enzymes called kinases. It is one of the most ubiquitous post-transitional modifications, found across the phylogeny from prokaryotes to eukaryotes, and plays a major role in the broad range of critical cellular phenomenon such as metabolism,1 cell signalling,2,3 apoptosis,4 and cellular proliferation.3 It has been shown that almost 30%–50% of the eukaryotic proteins undergo phosphorylation.5
Kinases, by which the phosphorylation takes place, constitute one of the largest known protein superfamilies. About 1.7% of all the human genes encode as many as 518 different types of kinases, and they are classified into a hierarchical fashion with ten groups, 134 families, and 201 subfamilies primarily based on the homology of their catalytic domains.6 Therefore, the accurate recognition of phosphorylation sites along with the relevant kinase of a eukaryotic protein of interest is necessary to decipher the intracellular phenomenon.
Although mass spectrometry techniques are being used to detect the phosphorylation sites in a high-throughput manner, the ever-increasing number of protein sequences has rendered these methods to be prohibitively labor and cost intensive. As a result, the development of an accurate and automated in silico method for predicting phosphorylation sites based on the protein primary sequence information is desirable. A number of in silico methods have been proposed to predict phosphorylation sites; these methods can be roughly categorized into two groups. Some methods can only predict the phosphorylation sites, without providing any information about the specific kinase most likely to interact with the protein of interest; these methods include DISPHOS,7 CKSAAP_PhSite,8 PPRED,9 Netphos,10–12 PHOSIDA,13 and AMS.14 Other methods predict phosphorylation sites in a kinase-specific manner; in addition to predicting whether a candidate site is a phosphorylation site or not, they provide the kinase information of the target proteins. Such methods include Scansite,15 KinasePhos,16 NetphosK,17 PPSP,18 GPS,19,20 Postmod,21 BAE,22 AMS 4.0 Server,23 and Metapred.24 The details of these methods are discussed in a recent review by Trost et al.25 Most of the phosphorylation prediction methods use a single classifier; these methods sometimes do not produce satisfactory results due to their inherent limitations. In recent years, ensemble methods have received considerable attention in the machine learning community for increasing the effectiveness of a single classifier. A number of ensemble methods have been successfully applied in studying several biological problems such as predicting subcellular locations in proteins,26,27 gene expression analysis,28 protein–protein interaction site prediction,29 and prediction of siRNA efficacy.30 Some recent methods, such as Bagging-AdaBoost ensemble (BAE) proposed by Yu et al,22 PHOsphorylation Site FindER (PHOSFER) by Trost et al,31 and recently a method proposed by Gao et al,32 have also used ensemble methods to predict phosphorylation sites. BAE is based on the Bagging and Adaboost ensemble approach, whereas PHOSFER uses random forest algorithms to predict phosphorylation sites in an organism-specific way. The method proposed by Gao et al uses a multitask learning framework to predict the phosphorylation site of four kinase groups. Although much progress has been made in the prediction of phosphorylation sites using various ensemble methods, there still exists a wide scope for improvement. None of these methods uses more than one feature scheme to train the classifiers, but a specific type of feature encoding scheme for precisely predicting phosphorylation sites of a protein sequence is not fully exploited. Therefore, no single feature encoding scheme can absolutely differentiate the phosphorylation sites from nonphosphorylation sites for all the kinases. In our proposed method, we have used three types of features: physiochemical features of amino acids, dipeptide composition, and protein–protein scoring for encoding a protein sequence. In the next step, we have used a feature selection method to remove the redundant features without deteriorating the performance of the method. Also, in order to construct a good ensemble method, the ensemble needs to construct accurate and diverse classifiers and to combine outputs from the classifiers effectively. Selecting a set of diverse classifiers that perform individually well is a nontrivial problem. In our proposed algorithm, we have adopted k-Nearest Neighbor (K-NN), multilayer perceptron (MLP), and least square support vector machine (LSSVM) as three diverse classifiers. The cardinal problem in predicting phosphorylation sites is the very small size of the dataset, because the number of known phosphorylation sites is very limited as compared to the nonphosphorylation sites. To overcome this problem, we have incorporated bootstrap resampling techniques to construct a number of datasets. Each of the resampled datasets generated from three feature encoding parameters is used as input in each of these three classifiers separately. The final result is obtained by fusing all the results obtained from the three classifiers through weighted voting. It is empirically demonstrated that an ensemble method can improve the prediction accuracy of the single classifiers performing independently.
Materials and method
Data preparation
In order to evaluate the performance of our proposed method and to compare it with other existing methods, we have extracted the phosphorylation sites from Phospho.ELM database (version 9.0 [available from http://phospho.elm.eu.org]).33 Experimentally validated phosphorylation sites of eukaryotic cells for 299 types of different kinases are crated in Phospho.ELM database. Version 9.0 of this database contains 8,718 proteins from different vertebrate species covering 31,754 serine, 7,449 threonine, and 3,370 tyrosine instances. Each entry in the database provides information about the substrate proteins along with the exact positions of the residues phosphorylated by a given kinase. In our study, we have considered the kinase families having at least 100 known and experimentally validated phosphorylation sites. Nine kinase families, including eight serine/threonine kinase families (protein kinase A [PKA], protein kinase B [PKB], protein kinase C [PKC], casein kinase 2 [CK2], cyclin-dependent kinase 1 [CDK1], mitogen-activated protein kinase [MAPK], calmodulin-dependent protein kinase II [CAM KII], glycogen synthase kinase 3 [GSK-3]) and one tyrosine kinase family (SRC) were chosen. In this study, we have considered the phosphorylation sites for the vertebrates only. We extracted the 21-mer sequence including 10 bp upstream to 10 bp downstream from the phosphorylation site with the phosphorylated residue at the central position; ie, at position 11. If the phosphorylated residue (serine, S; threonine, T; tyrosine, Y) appears in the first ten residues or last ten residues, that is, if the distance between the phosphorylated residue and N or C terminal is less than 10-mer, an extra residue X (where X denotes any residue) is added before the first residue or after the last residue of the sequence in order to keep the protein sequence size at 21-mer and phosphorylated residue centered.
A negative dataset is prepared by taking the 21-mer peptides and centering all the nonphosphorylated S/T/Y residues of the substrate proteins corresponding to the nine kinase families mentioned above. We have taken nonphosphorylated S/T residues as negative control for the serine/threonine kinases in the PKA, PKB, PKC, CK2, CDK1, MAPK, CAM KII, GSK-3 kinase families and nonphosphorylated Y residues for tyrosine kinase family in SRC. In order to avoid the overestimation on accuracy while cross-validating, we have discarded the highly homologous sequences (ie, sequences having more than 60% similarity) from positive and negative datasets by using the CD-HIT clustering program.34
Furthermore, in context of the multiple kinase families the positive phosphorylation sites are outnumbered by the negative sites, resulting in an imbalanced dataset. As there are far more nonphosphorylated S/T/Y residues than phosphorylated residues, it is impractical to adopt whole nonphosphorylated sites as negative instances; it is preferable to select almost similar numbers of positive instances and negative instances. So in our study, the ratio of positive samples to negative samples is kept at 1:1.5 to avoid biased prediction. The number of positive phosphorylation sites and corresponding negative sites for the nine protein kinases are given in Table 1.
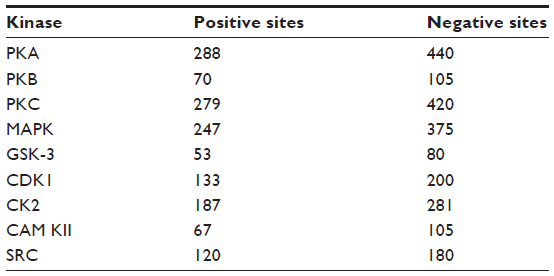 | Table 1 Number of positive and negative phosphorylation sites for nine protein kinases after removing the redundant data obtained from Phospho.ELM database version 9.0 |
Method
This section describes the general framework of the method proposed in this article. It first introduces the data encoding methods followed by feature selection, data resampling, classification, and weighted voting methods. Figure 1 shows the block diagram of the proposed method.
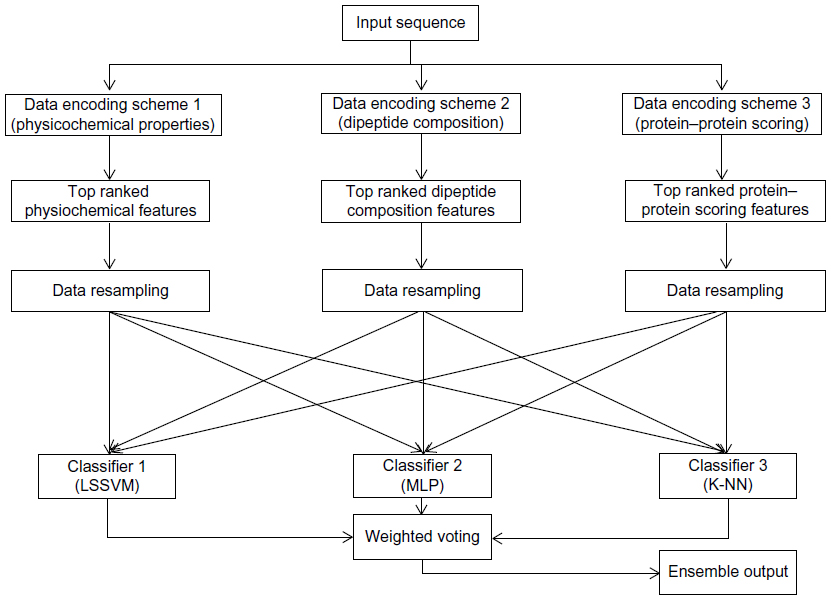 | Figure 1 Block diagram of the proposed ensemble method that uses protein sequences as input. |
Data encoding
Data encoding is one of the most crucial factors affecting the performance of the classifier as well as the ensemble architecture. This is the process through which a sequence is converted to its numerical form and is presented to the classifier. Hence, it is necessary to choose a high-quality data encoding method that possesses the salient features of the amino acid sequences, keeping the generated code compact in dimensionality. Instead of using a simple binary representation, we have adopted a variety of data encoding schemes that include three types of amino acids features: physicochemical features, dipeptide composition, and protein–protein similarity score.
Physicochemical features
The Amino Acid Index35 (AAindex) is a database composed of numerical indices of various physicochemical and biochemical properties of amino acids and amino acid pairs. The latest version (version 9.1) of the AAindex database is divided into three sections: AAindex1, AAindex2 and AAindex3. AAindex1 contains 544 amino acid indices, AAindex2 contains 94 amino acid mutation matrices, and AAindex3 contains 47 statistical protein contact potential matrices. Here we have considered only the 544 indices of AAindex1 for the protein representation; AAindex2 and AAindex3 are matrices, and are not suitable for the protein sequence representation. Among the 544 amino acid indices, 13 had incomplete data or an overrepresentation of zeroes and were removed, leaving 531 properties as potential features for protein sequence representation.
Each amino acid residue in a sequence of length L is represented by the corresponding numerical value of the 531 amino acid indices in the AAindex1 database. Hence, a single sequence is represented by a 531*L dimensional matrix. Although only a moderate correlation exists among various AAindex properties, a considerable correlation exists between the physicochemical property values corresponding to different amino acids.
In order to correlate the physicochemical property values of amino acids along a sequence, physicochemical distance transformation is carried out to represent the sequence order information as proposed by Liu et al36 in 2012. For a given protein sequence of length L, A1A2A3A4  AL, A1 is the amino acid at position 1, A2 at position 2, and so on. For an amino acid index j in AAindex1, the sequence order information associated with the jth physicochemical property can be given by the following equation:

where λ is the distance between two amino acids along a sequence. Dj(Ai, Ai+λ) is given by the following sequence:

where Ij(Ai) and Ij(Ai+λ) are the normalized physicochemical property value of the ith and (i + λ)th amino acid in jth index. Ij(Ai) and Ij(Ai+λ) are calculated using the following equation:

where represents the raw physiochemical property value of the amino acid Ai for index j, Īj is the mean of the jth index of 20 amino acids, and σ is the variance. Īj and σ are given by:

Using the above information, we have calculated the sequence order information δ for each physicochemical property in AAindex, taking λ=1, 2, and 3. We then averaged the three values of δ corresponding to λ=1, λ=2, and λ=3 to obtain δavg, which is then used as a feature vector for classification.
Dipeptide composition
Dipeptide composition is a simplistic descriptor of protein sequence features and a well-known technique for amino acid feature encoding. There are 441 combinations of dipeptides considering 21 amino acids (including one dummy amino acid). Dipeptide composition is defined as fr(r,s) = Nrs/(N – 1), where r,s =1,2,3, … 20 and Nrs is the number of dipeptides of amino acid type r and s.37 The value of each component of the dipeptide composition gives the fraction of the corresponding amino acid pairs in the sequence fragment. Here we have used dipeptide composition to represent the protein sequences in numerical form and have used as an input feature vector for further classification.
Sequence similarity scoring scheme
Another very popular sequence encoding method used in this study is the protein–protein sequence similarity scores. This scoring scheme is based on the hypothesis that the peptides having high similarity provide high scores; ie, if a peptide sequence receives a high score with another peptide, they are likely to be phosphorylated by the same kinase. It is assumed that the sequences having sequence similarity also bear similar structural and physicochemical properties. In our proposed method, we have used BLOSUM62 substitution matrix to calculate the similarity between two peptides.
The similarity score between two peptides A and B of length L is defined as

where Score(Ai,Bi) is the substitution score of amino acids Ai and Bi in the BLOSUM62 matrix. If S(A, B) <0, we have redefined it as S(A, B) =0. In this study, we have taken 10 bp upstream to 10 bp downstream of the phosphorylation site; ie, the length of each peptide sequence is L=21.
Feature selection
After encoding the protein sequences into its corresponding numerical form using three feature encoding schemes, we have applied a feature selection method in order to improve the performance of the classifiers because there may be some redundant and irrelevant features that may reduce the performance of the classifiers and increase the complexity. A feature is proved to be high quality if it not only can differentiate classes by itself or in combination with other features but if there remains no redundancy among the features. Here, we have adopted a method proposed by Mitra et al38 called Feature Selection using Feature Similarity (FSFS) for feature selection. The method uses similarity or correlation among features to remove the redundant one; it does not require any knowledge of class labels as FSFS is an unsupervised feature selection algorithm. FSFS selects features by clustering them into subsets and then chooses a representative feature from each cluster. Then a maximum information compression index is used for enumerating feature similarity measures. The method significantly reduces the dimensionality of the features. In our proposed method, the numbers of features are varied from 100% to 2% and the number of features that yields the best result is opted. We have shown variation of accuracy with the number of features in Figure 2. Based on the graph shown in Figure 2, we have selected 20% of features because for 20% and above, there is no significant change in the accuracy for all the kinases. The selected features are used to represent the protein sequences.
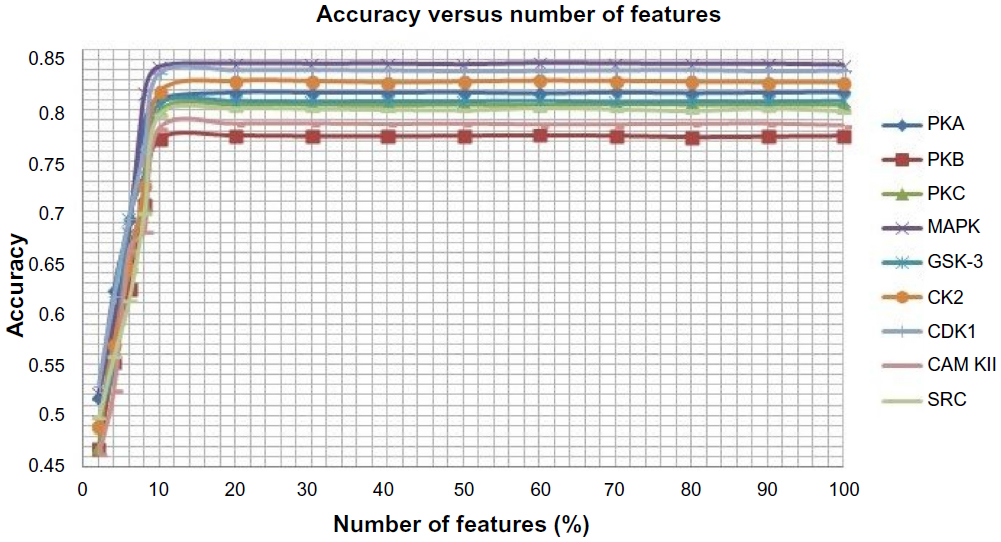 | Figure 2 Average accuracy versus number of features for each of the nine kinases families. |
Data resampling
The three feature datasets generated by three data encoding methods are then divided into a set of new datasets using a bootstrap resampling method. In bootstrap resampling, a number of resampled subsets of the original dataset are generated by random sampling with replacement (so individual instances may appear in the subsets more than once) such that the size of each resampled subset is equal to the size of the original dataset. From the original dataset D of size n, a set of new datasets {D1, D2, D3, D4 … Dm} is generated each of size such that .
In the next step, each of the datasets generated through bootstrap resampling is used as input to a set of classifiers {C1, C2 … Cl}. In this paper, we have used three supervised classifiers, LSSVM, MLP, and K-NN, for classification.
LSSVM
We have used LSSVM as a classifier. To avoid the high computational complexity of support vector machine for high-dimensional data, we have adopted the least square version of SVM. LSSVM simplifies the training procedure by avoiding the solving of quadratic programming problem.39,40 Let us consider a linearly separable binary classification problem:

where xi is an n-dimensional feature vector and yi is the label of this vector. LSSVM can be formulated as the optimization problem:

subject to the quality constraints

where C>0 is a regularization factor, b is a bias term, w is the weight vector, ei is the difference between the desired output and the actual output, and φ(xi) is a mapping function.
The Lagrangian for problem of Eq 8 is defined as follows:

where αi are Lagrange multipliers. The Karush–Kuhn–Tucker conditions for optimality,

are the solution to the following linear system:

For a given RBF kernel function K(x, xi) and a new test sample point x, the LSSVM classifier is given by

Multilayer perceptron
Feedforward MLP has also been used to predict the phosphorylation sites specific to a kinase label. Multilayer perceptron is the most commonly used feedforward neural network. MLP is the extended form of perceptron having one or more hidden layer. The nodes in the input layer are connected to the nodes of the hidden layer, which in turn are connected to the nodes of the output layer. Each connection is associated with a weight. In the input layer, a number of real valued inputs are given and MLP generates a single real values output according to an activation function applied to the weighted sum of the outputs of the units in the preceding layer. The feedforward neural network is trained with a back-propagation learning algorithm to optimize the classification accuracy. The final error E at the output layer is the sum of squared differences of the desired outputs di and the actually calculated outputs oi of each output unit i, and can be expressed as:

In this study, we have used Log sigmoid activation function in the hidden layer and linear activation function a=purelin(n) in the output layer. The network was initialized with random weights and biases and was trained using the Levenberg–Marquadart algorithm. We have tested the network by varying the number of iterations from 500 to 3,000 and the learning rate 0.1 to 0.5, and averaged all outcomes to obtain the best possible result. A momentum term of 0.95 was added to increase the learning rate with stability. The performance of the network was measured in terms of mean square error. The lower the mean square error, the better the network’s performance.
K-NN classifier
K-NN is one of the most fundamental and simple nonparametric methods used for classifying objects based on the closest training examples in the feature space. The K-NN algorithm works in two steps. First, for each query Q, the K-NNs from the training data are identified based on distance (Euclidean, Manhattan, etc). In our work we have used Euclidean distance to find the K-NNs of a given query. If X is a particular training sample with ith feature xi and Q is a query with ith feature qi, then the Euclidean distance between the training sample and query is given by

where n is the total number of features.
In the second step, the query is assigned to the class most common among its K-NNs by a majority voting. Once we have obtained K-NNs of query Q using Euclidean distance, it is time for the neighbors to vote in order to predict Q’s class. For each class cl, we count how many of the K neighbors have that class cl. If R(Q) denotes the class of the query Q, then

where S(F,cl) denotes the number of samples xh (xhϵ F, where F is the set of nearest neighbor of the sample Q) with label lh = cl.
Weighted voting
The set of newly generated m resampled datasets {D1, D2, D3, … Dm} for three types of features are given as input into the three individual classifiers. Since there are three different types of feature spaces generated by three sequence encoding methods and each feature space is divided into m resampled datasets, there are 3*m numbers of input datasets given to each of the classifiers, resulting in 9*m numbers of classifiers and 9*m numbers of outputs. The final output of the ensemble method is generated by fusing the outputs produced by 9*m numbers of individual classifiers through weighted voting.
Suppose that the classification results corresponding to the 9*m numbers of classifiers for a query protein sequence P are R1, R2, R3, …, R9m such that

where C1, C2, C3, …, C9 are the class levels corresponding to the protein sequences.
For a given query sequence P, the weighted sum of the base classifiers for each class is calculated by

where 9m is the number of classifiers, i = C1, C2, C3, …, C9 is the class levels, Rn is the predicted class level by the nth classifier, and wn is the weight associated with the nth classifier. Each classifier has been assigned a weight that would denote the contribution of the classifier to the prediction system. In this study, we have considered the overall accuracy of each classifier as the weight corresponding to that classifier.
The final classification result, the class associated with the sample P, is determined by the following equation:

where, Vj denotes the number of occurrence of each class level and is obtained from Eq 17.
Performance assessment
To evaluate the performance of the proposed method, a tenfold cross-validation is done. In tenfold cross-validation, each dataset is divided into ten equal subsets; nine subsets are used for training and one part is used for testing. This process was repeated for all ten parts.
The performance of the proposed method is measured by means of four parameters: recall, precision, F-measure, and accuracy. The measures are given by the following equations:

where TP, FP, TN, FN represent the number of true positives, false positives, true negatives and false negatives respectively.
Results and discussion
Positive and negative phosphorylation sites for each kinase family were downloaded from Phospho.ELM database and filtered using the CD-HIT clustering program to get a nonhomologous dataset. The number of positive phosphorylation sites and negative sites corresponding to the nine protein kinases after removing the homologous sequences and data imbalance correction are given in Table 1. As discussed in the previous section, three feature encoding schemes were used to convert the sequences into their numerical form, and each of the encoded datasets was resampled using the bootstrap resampling method. We varied the number of resampled datasets, taking B=10, B=15, and B=20, where B is the number of datasets obtained through bootstrap resampling. The resampled datasets were used as input to the three classifiers. The whole method was repeated by varying the window size from 5 to 21, taking all the odd numbers within the range as the window size with the phosphorylated residue at the center position. The variation of accuracy with various window sizes for all nine kinases is shown in Figure 3A–I, varying the number of resampled datasets (B=10, B=15, and B=20). Figure 3A–I clearly indicates that window size 11 yielded the best result for almost all the kinases. Therefore, an optimal window size of 11 with the phosphorylated residue S/T/Y at center position was taken for further examination. The performance of each individual classifier is annotated in Tables 2–4 in terms of accuracy for three different encoding schemes while varying the number of resampled datasets from 10, 15, and 20. In order to enhance the performance of individual classifiers, we undertook a weighted voting, took the result of each classifier as input, and obtained the final result of our proposed method by using Eq 18. Table 5 shows the result of the ensemble method corresponding to the number of resampled datasets (B=10, B=15, and B=20).
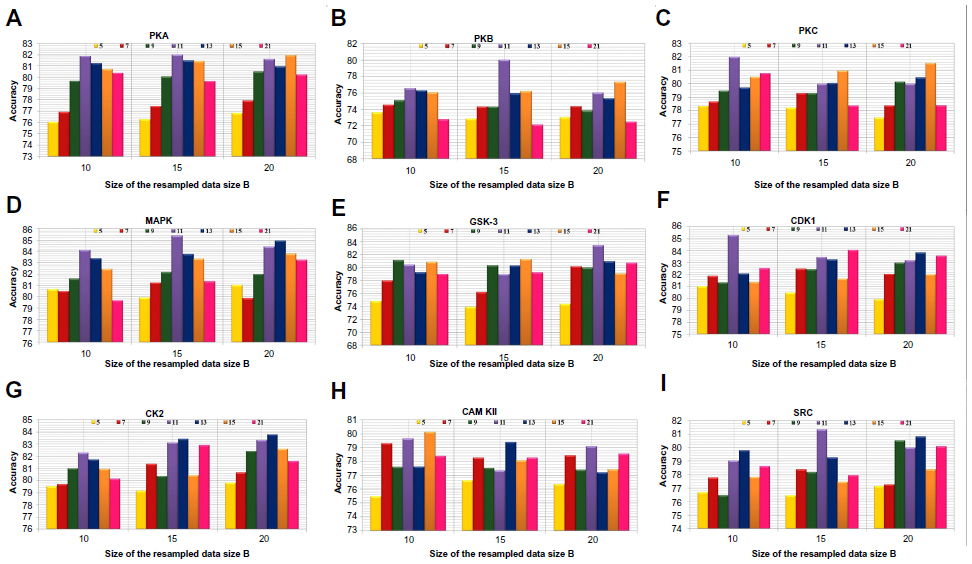 | Figure 3 Accuracy with various window sizes for all the nine kinases while varying the number of resample datasets. |
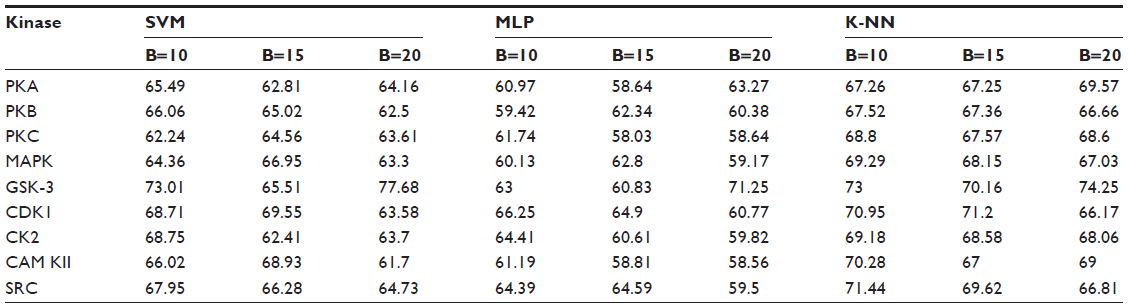 | Table 2 Performance of individual classifiers with different resampled data sizes in terms of accuracy (%) |
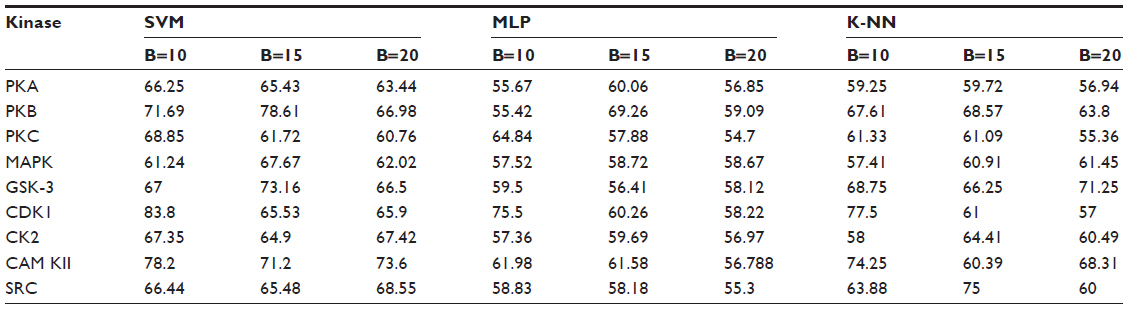 | Table 3 Performance of individual classifiers with different resampled data sizes in terms of accuracy (%) |
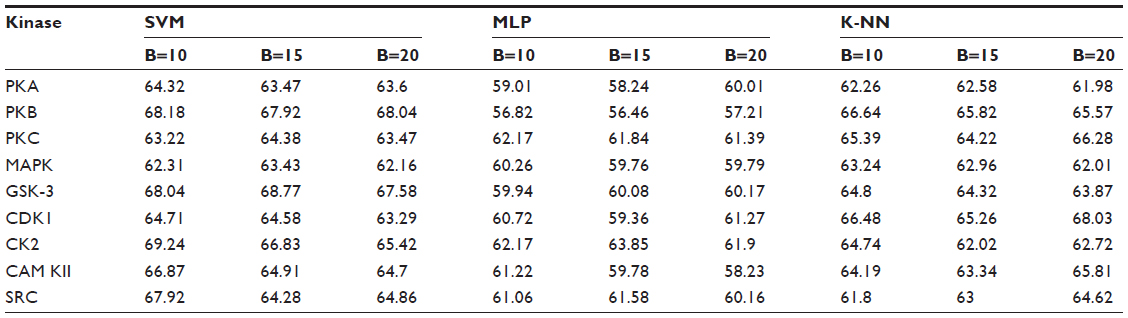 | Table 4 Performance of individual classifiers with different resampled data sizes in terms of accuracy (%) |
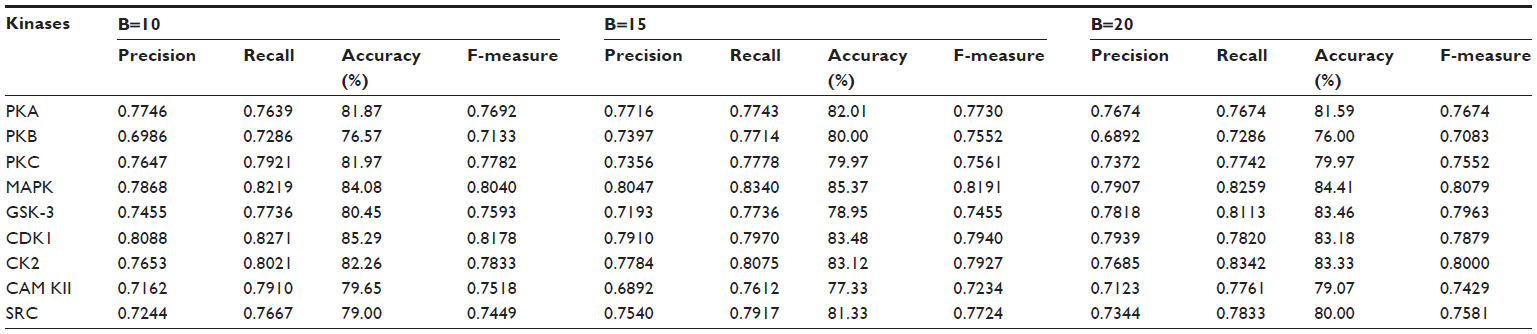 | Table 5 Results of the ensemble method through weighted voting on various resample data sizes for various kinases |
Evaluating different feature schemes on different classifiers
From Tables 2–4, we find that for the three different feature encoding schemes, none of the three classifiers individually performed extensively well in predicting the phosphorylation sites. On average, all three features performed similarly for most of the kinases. For some kinases the physicochemical features performed well, whereas for other kinases the dipeptide composition performed better. Performance of Protein–protein scoring was average for all the kinases. Tables 2–4 do not show any significant trend of dominance of any one feature in predicting phosphorylation sites. Although the performance of the individual classifiers varied a lot, none of the single classifiers showed any satisfactory result. LSSVM as an independent classifier yielded the highest accuracy, 83.8%, for kinase family CDK1 for B=10 when physicochemical properties were used for data encoding; for all other kinases, LSSVM gave an accuracy in the range of 65%–80%. K-NN gave an accuracy between 55%–75% for all the kinases. Among the three classifiers, MLP performed worst, with an accuracy ranging between 50%–65%. In order to circumvent this insufficiency and to improve our results, we applied the weighted voting method as discussed in the previous section.
Performance of the ensemble method with weighted voting
In weighted voting, the outputs from various classifiers are fused to obtain a final output for each query sequence. Here, instead of relying on the outputs of the classifier, we assigned a weight to each classifier, which implies that the greater the weight of a classifier; the greater its contribution towards predicting the right sequence.
Table 5 shows the result of the ensemble method, and a remarkable improvement can be seen for all the kinase families. For the kinase family CDK1, the ensemble method yielded 85.3%, 83.4%, and 83.1% accuracy for B=10, B=15, and B=20, respectively. For MAPK kinase, the proposed method yielded a quite impressive accuracy: 84%, 85.3%, and 84.4% for B=10, B=15, and B=20, respectively. Our method gives the lowest accuracy for the kinase family PKB. Table 5 also shows the change in precision, recall, accuracy, and F-measure for the different kinases when the number of resampled datasets was varied from B=10, B=15, and B=20. The result shows that a very small variation in accuracy is found in most of the kinases, including PKA, PKC, MAPK, CDK1, CK2, CAM KII, and SRC, with the change of B. The kinase families PKB and GSK-3 showed a slight variation in accuracy. For PKB, accuracy for B=10 and B=20 was 76.6% and 76%, respectively, which was almost the same; however, we got 80% accuracy for B=15. In the case of GSK-3, accuracy was 80.4%, 78.9%, and 83.5% for B=10, B=15, and B=20, respectively. However, none of these kinase families showed any trend of increase or decrease of accuracy corresponding with an increase or decrease of resampled data size. It might be possible that the presence of some atypical samples in these families increases the difference between resampled datasets and causes the variation of accuracy with the resampled datasets. Thus, the performance of the method is not affected by the number of the resampled datasets. Table 5 shows a balanced precision and recall, which means that the number of true positives is higher relative to the number of false positives and false negatives. As a result, a rather high F-measure is yielded for all the kinases using the proposed algorithm.
Performance comparison with other existing methods
In order to evaluate the performance of our method, we compared our method with five other open access kinase-specific phosphorylation site prediction methods. In most previous studies, these five methods were used because of their high performance. The five methods are PPSP,18 KinasePhos 2.0,16 GPS2.0,19 Scansite,15 and NetPhosK 1.0.17 Bayesian decision theory was used to develop PPSP. KinasePhos employs the hidden Markov model to predict kinase-specific phosphorylation sites. Scansite searches for motifs within proteins that are likely to be phosphorylated by specific protein kinases, using the scores calculated from position-specific score matrices. NetPhosK 1.0 uses an artificial neural network to predict 17 kinase-specific phosphorylation sites. The GPS2.0 server uses a modified version of a group-based scoring algorithm41,42 to predict PK-specific phosphorylation sites in the hierarchy. In this evaluation, we selected all kinase groups and the balance performance option for PPSP. In the case of NetPhosK, prediction without filtering and a threshold value of 0.5 was selected to predict phosphorylation sites. KinasePhos 2.0 was run with the option of default specificity for a specific kinase. In this work, Scansite 2.0 was run by searching all motifs, with the “high stringency level” setting selected. For GPS2.0, a medium threshold was selected for a particular kinase family.
To avoid biased prediction, we have considered a candidate site to be true positive only when the site is predicted correctly. The comparison is done on the basis of the parameter’s precision, recall, accuracy, and F-measure. Figures 4–7 show the performance comparison of our proposed method with other methods. Figures 6 and 7 illustrate that the proposed method achieves the best performance in terms of accuracy and F-measure for all nine kinase families. PPSP performance was the second best with respect to accuracy and F-measure. Upon evaluating the results of this comparison, we determined that GPS2.0 performed almost the same as PPSP except in the case of CAM KII, where its performance was the worst among all methods in terms of precision, recall, accuracy, and F-measure. Scansite performed similarly to GPS2.0 for all the kinases except CAM KII. Scansite performance was the second best in terms of precision, accuracy, and F-measure for SRC, while for other kinase families it gave an average performance. PPSP provided the highest precision value for CAM KII, followed by our method. But for kinases like PKA, PKB, PKC, MAPK, GSK-3, CDK1, CK2, and SRC, our proposed method outperformed the other methods in terms of precision. KinasePhos demonstrated the lowest precision value for all the kinase families except CAM KII. NetPhosK demonstrated better accuracy than KinasePhos, except for PKA and SRC, with an almost equal precision value to that of KinasePhos for PKA and a better precision value for PKB, PKC, MAPK, GSK-3, CDK1, CK2, CAM KII, and SRC. PPSP yielded the best recall values among all the methods, with the exception of CK2 and CAM KII. The proposed method comes next with respect to recall, which is almost equal to the prediction performance of PPSP; NetphosK demonstrated the worst performance.
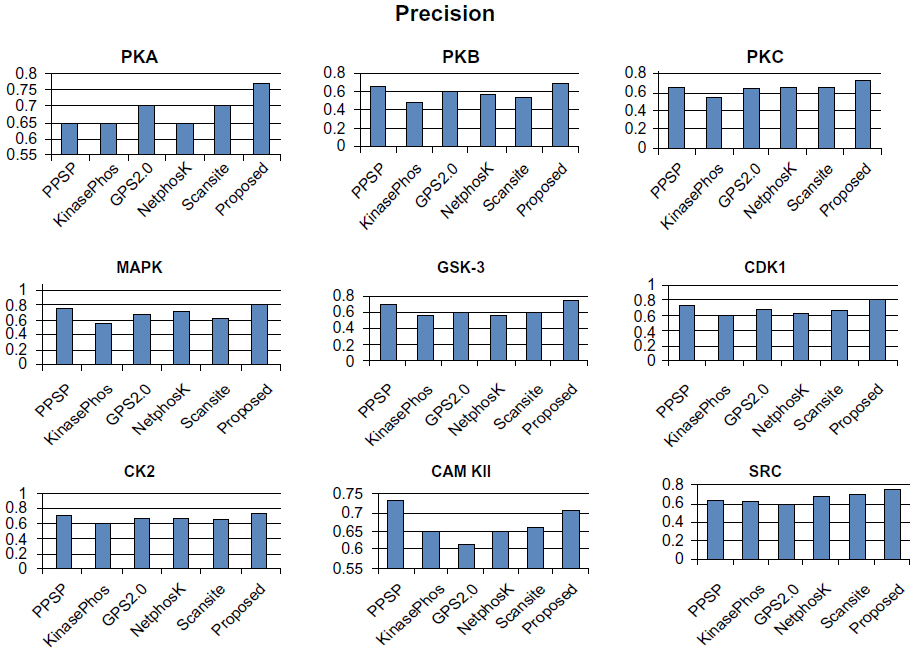 | Figure 4 Comparison of various kinase-specific phosphorylation site prediction methods (PPSP, KinasePhos, GPS2.0, Scansite, and NetphosK) with our proposed methods in terms of precision. |
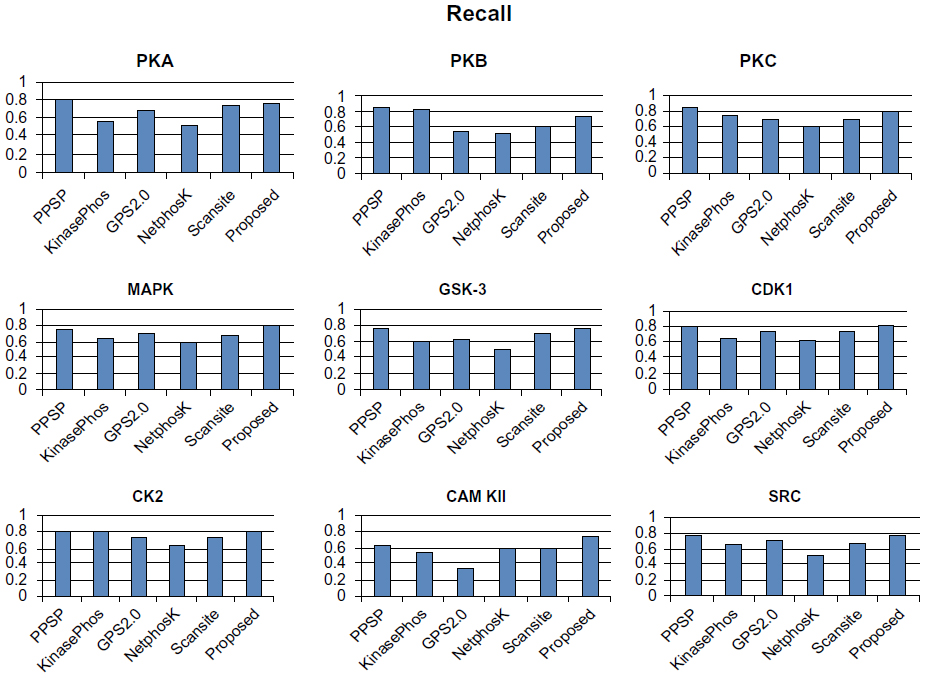 | Figure 5 Comparison of various kinase-specific phosphorylation site prediction methods (PPSP, KinasePhos, GPS2.0, Scansite, and NetphosK) with our proposed methods in terms of recall. |
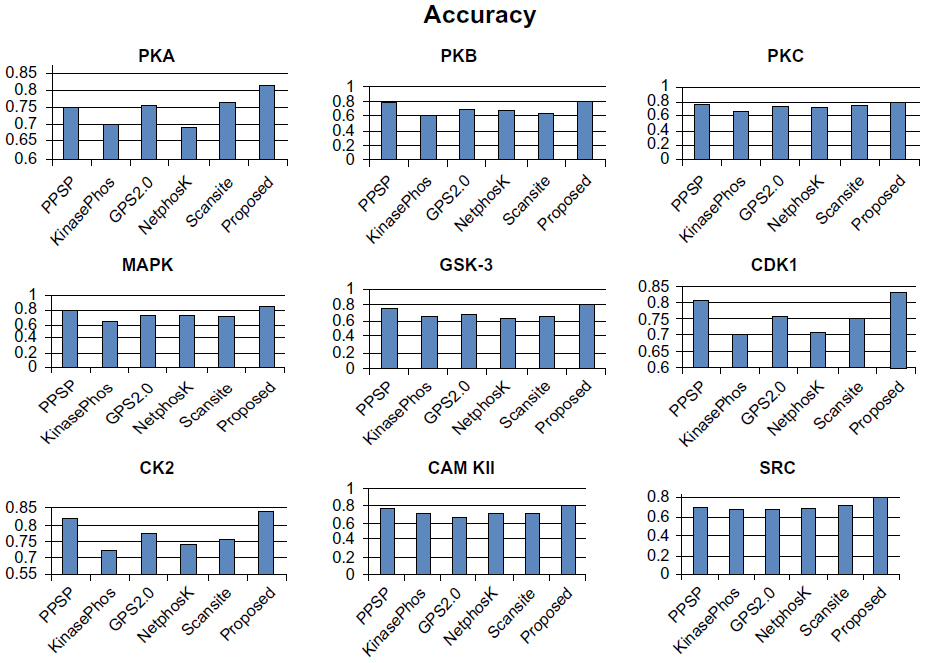 | Figure 6 Comparison of various kinase-specific phosphorylation site prediction methods (PPSP, KinasePhos, GPS2.0, Scansite, and NetphosK) with our proposed methods in terms of accuracy. |
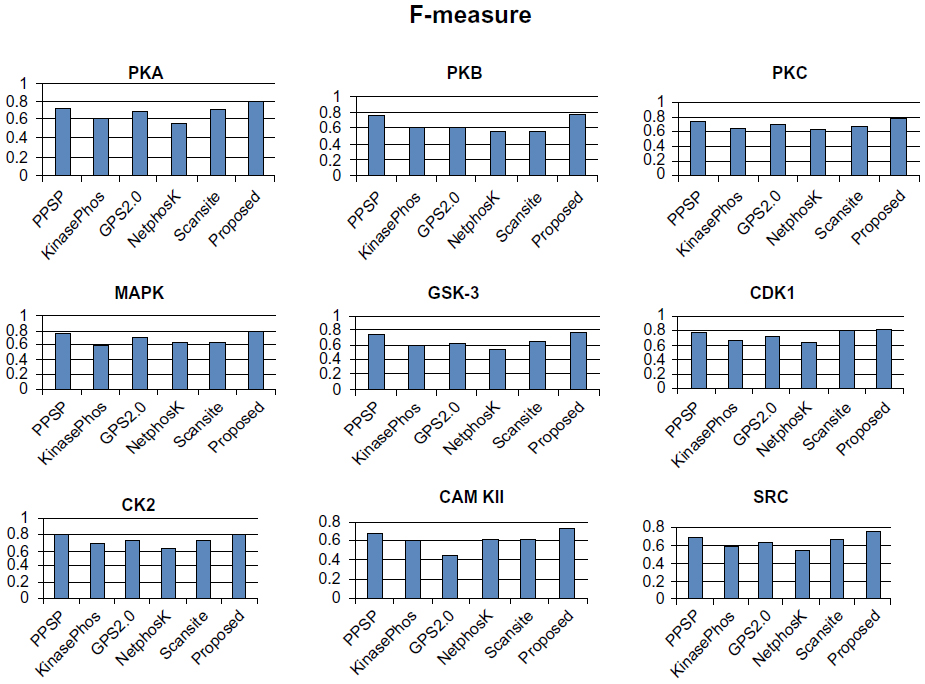 | Figure 7 Comparison of various kinase-specific phosphorylation site prediction methods (PPSP, KinasePhos, GPS2.0, Scansite, and NetphosK) with our proposed methods in terms of F-measure. |
We also applied our proposed method to predict the phosphorylation sites corresponding to serine, threonine, and tyrosine phospho residues in a nonkinase-specific manner. For this we prepared a new dataset comprising all the annotated S/T/Y sites as positive data in the database Phospho. Elm version 9.0. Negative data was prepared taking all the nonannotated S/T/Y sites from the same database. We took a 21-mer sequence centering at S/T/Y residues for both positive and negative data. In the dataset, positive to negative sequence ratios were kept at 1:1.5 to avoid any unnecessary biased predictions. To evaluate the performance of the proposed method for nonkinase-specific phosphorylation site prediction, we compared our method with three other well-known phosphorylation site prediction methods: DISPHOS,7 PPRED,9 and NetPhos.10 DISPHOS uses a position-specific amino acid composition and structural disorder information to predict phosphorylation sites. NetPhos uses an artificial neural network for prediction, whereas PPRED uses position-specific scoring matrices and support vector machines for distinguishing between phosphorylation and nonphosphorylation sites. The prediction accuracy comparison is shown in Figure 8. This figure shows that our proposed method outperforms the other methods in terms of accuracy to predict S/T/Y phosphorylation sites.
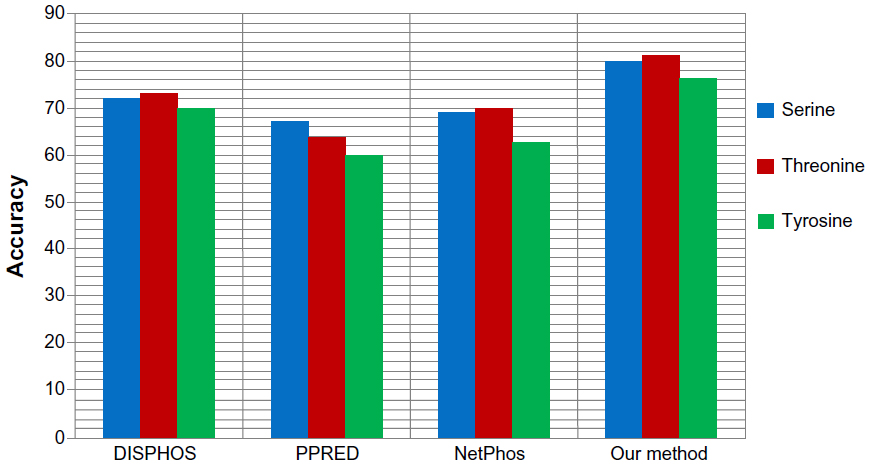 | Figure 8 Prediction accuracy comparison of our proposed method with various nonkinase-specific phosphorylation site prediction methods (DISPHOS, PPRED, NetPhos) for serine, threonine, and tyrosine phosphoresidues. |
Taking into consideration measures such as accuracy, precision and F-measure, our proposed method yielded the best performance. The reasonably high and balanced values of precision and recall indicate that our method can predict true positives as well as true negatives to a high extent, and yielded the best F-measure among all the methods. Our method outperformed the well-known existing methods and effectively distinguished the phosphorylation sites from nonphosphorylation sites in a kinase-specific manner compared to existing kinase-specific phosphorylation site prediction methods.
Conclusion
In this study, we used an ensemble method to predict kinase-specific phosphorylation sites in vertebrates only. Three types of strategies, physicochemical features, dipeptide composition, and protein–protein scoring, were taken to represent the protein sequences in their numerical forms, and three popular classifiers, LSSVM, K-NN, and MLP, were used in the proposed ensemble method. The three datasets composed of three different parameter systems were given as input to each classifier, and the final result was obtained by fusing the outputs of the above classifiers through weighted voting. Because of the relatively small data size, we incorporated data resampling so that vigorous experimentation could be performed. The ensemble method yields a better result than individual classifiers. While LSSVM, K-NN, and MLP were used in this work, other classifiers can also be used to form different ensemble methods. In summary, the results of the predictions through the proposed ensemble method indicate that our method is very promising in detecting protein phosphorylation sites and may serve as an important complement to existing methods.
Acknowledgments
The authors wish to thank the anonymous reviewers for their valuable remarks. The authors also acknowledge the computational facility of DIC and Department of Biophysics, Molecular Biology and Bioinformatics, University of Calcutta.
Disclosure
The authors report no conflicts of interest in this work.
References
Salway JG. Metabolism at a Glance. 2nd edition. Oxford, UK: Blackwell Science Ltd; 1999. | |
Li L, Shakhnovich EI, Mirny LA. Amino acids determining enzyme-substrate specificity in prokaryotic and eukaryotic protein kinases. Proc Natl Acad Sci U S A. 2003;100(8):4463–4468. | |
Matthews HR. Protein kinases and phosphatases that act on histidine, lysine, or arginine residues in eukaryotic proteins: a possible regulator of the mitogen-activated protein kinase cascade. Pharmacol Ther. 1995;67(3):323–350. | |
Kobayashi K, Nakano H, Hayashi M, et al. Association of phosphorylation site of tau protein with neuronal apoptosis in Alzheimer’s disease. J Neurol Sci. 2003;208(1–2):17–24. | |
Pinna LA, Ruzzene M. How do protein kinases recognize their substrates? Biochim Biophys Acta. 1996;1314(3):191–225. | |
Manning G, Whyte DB, Martinez R, Hunter T, Sudarsanam S. The protein kinase complement of the human genome. Science. 2002;298(5600):1912–1934. | |
Iakoucheva LM, Radivojac P, Brown CJ, et al. The importance of intrinsic disorder for protein phosphorylation. Nucleic Acids Res. 2004;32(3):1037–1049. | |
Zhao X, Zhang W, Xu X, Ma Z, Yin M. Prediction of protein phosphorylation sites by using the composition of k-spaced amino acid pairs. PLoS One. 2012;7(10):e46302. | |
Biswas AK, Noman N, Sikder AR. Machine learning approach to predict protein phosphorylation sites by incorporating evolutionary information. BMC Bioinformatics. 2010;11:273. | |
Blom N, Gammeltoft S, Brunak S. Sequence and structure-based prediction of eukaryotic protein phosphorylation sites. J Mol Biol. 1999;294(5):1351–1362. | |
MacDonald JA, Mackey AJ, Pearson WR, Haystead TA. A strategy for the rapid identification of phosphorylation sites in the phosphoproteome. Mol Cell Proteomics. 2002;1(4):314–322. | |
Mackey AJ, Haystead TA, Pearson WR. CRP: Cleavage of Radiolabeled Phosphoproteins. Nucleic Acids Res. 2003;31(13):3859–3861. | |
Gnad F, Ren S, Cox J, et al. PHOSIDA (phosphorylation site database): management, structural and evolutionary investigation, and prediction of phosphosites. Genome Biol. 2007;8(11):R250. | |
Plewczynski D, Tkacz A, Wyrwicz LS, Rychlewski L. AutoMotif server: prediction of single residue post-translational modifications in proteins. Bioinformatics. 2005;21(10):2525–2527. | |
Obenauer JC, Cantley LC, Yaffe MB. Scansite 2.0: Proteome-wide prediction of cell signaling interactions using short sequence motifs. Nucleic Acids Res. 2003;31(13):3635–3641. | |
Huang HD, Lee TY, Tzeng SW, Horng JT. KinasePhos: a web tool for identifying protein kinase-specific phosphorylation sites. Nucleic Acids Res. 2005;33(Web Server issue):W226–W229. | |
Blom N, Sicheritz-Pontén T, Gupta R, Gammeltoft S, Brunak S. Prediction of post-translational glycosylation and phosphorylation of proteins from the amino acid sequence. Proteomics. 2004;4(6):1633–1649. | |
Xue Y, Li A, Wang L, Feng H, Yao X. PPSP: prediction of PK-specific phosphorylation site with Bayesian decision theory. BMC Bioinformatics. 2006;7:163. | |
Xue Y, Ren J, Gao X, Jin C, Wen L, Yao X. GPS 2.0, a tool to predict kinase-specific phosphorylation sites in hierarchy. Mol Cell Proteomics. 2008;7(9):1598–1608. | |
Xue Y, Liu Z, Cao J, et al. GPS 2.1: enhanced prediction of kinase-specific phosphorylation sites with an algorithm of motif length selection. Protein Eng Des Sel. 2011;24(3):255–260. | |
Jung I, Matsuyama A, Yoshida M, Kim D. PostMod: sequence based prediction of kinase-specific phosphorylation sites with indirect relationship. BMC Bioinformatics. 2010;11 Suppl 1:S10. | |
Yu Z, Deng Z, Wong HS, Tan L. Identifying protein-kinase-specific phosphorylation sites based on the Bagging-AdaBoost ensemble approach. IEEE Trans Nanobioscience. 2010;9(2):132–143. | |
Plewczynski D, Basu S, Saha I. AMS 4.0: consensus prediction of post-translational modifications in protein sequences. Amino Acids. 2012;43(2):573–582. | |
Wan J, Kang S, Tang C, et al. Meta-prediction of phosphorylation sites with weighted voting and restricted grid search parameter selection. Nucleic Acids Res. 2008;36(4):e22. | |
Trost B, Kusalik A. Computational prediction of eukaryotic phosphorylation sites. Bioinformatics. 2011;27(21):2927–2935. | |
Xu Q, Pan SJ, Xue HH, Yang Q. Multitask learning for protein subcellular location prediction. IEEE/ACM Trans Comput Biol Bioinform. 2011;8(3):748–759. | |
Li L, Zhang Y, Zou L, et al. An ensemble classifier for eukaryotic protein subcellular location prediction using gene ontology categories and amino acid hydrophobicity. PLoS One. 2012;7(1):e31057. | |
Zhang K, Gray JW, Parvin B. Sparse multitask regression for identifying common mechanism of response to therapeutic targets. Bioinformatics. 2010;26(12):i97–i105. | |
Deng L, Guan J, Dong Q, Zhou S. Prediction of protein-protein interaction sites using an ensemble method. BMC Bioinformatics. 2009;10:426. | |
Liu Q, Xu Q, Zheng VW, Xue H, Cao Z, Yang Q. Multi-task learning for cross-platform siRNA efficacy prediction: an in-silico study. BMC Bioinformatics. 2010;11:181. | |
Trost B, Kusalik A. Computational phosphorylation site prediction in plants using random forests and organism-specific instance weights. Bioinformatics. 2013;29(6):686–694. | |
Gao S, Xu S, Fang Y, Fang J. Using multitask classification methods to investigate the kinase-specific phosphorylation sites. Proteome Sci. 2012;10 Suppl 1:S7. | |
Dinkel H, Chica C, Via A, et al. Phospho.ELM: a database of phosphorylation sites – update 2011. Nucleic Acids Res. 2011;39(Database issue):D261–D267. | |
Li W, Godzik A. Cd-hit: a fast program for clustering and comparing large sets of protein or nucleotide sequences. Bioinformatics. 2006;22(13):1658–1659. | |
Kawashima S, Pokarowski P, Pokarowska M, Kolinski A, Katayama T, Kanehisa M. AAindex: amino acid index database, progress report 2008. Nucleic Acids Res. 2008;36(Database issue):D202–D205. | |
Liu B, Wang X, Chen Q, Dong Q, Lan X. Using amino acid physicochemical distance transformation for fast protein remote homology detection. PLoS One. 2012;7(9):e46633. | |
Li ZR, Lin HH, Han LY, Jiang L, Chen X, Chen YZ. PROFEAT: a web server for computing structural and physicochemical features of proteins and peptides from amino acid sequence. Nucleic Acids Res. 2006;34(Web Server issue):W32–W37. | |
Mitra P, Murthy CA, Pal SK. Unsupervised feature selection using feature similarity. IEEE Trans Pattern Anal Mach Intell. 2002;24(3):301–312. | |
Suykens JAK, Vandewalle J. Least squares support vector machine classifiers. Neural Process Lett. 1999;9(3):293–300. | |
Chowdhury M, Das S, Kundu MK. compact image signature generation: an application in image retrieval. Proc 5th International Conference on Computer Science and Information Technology CSIT 2013. Amman, Jordan: IEEE Press; 2013:1–7. | |
Zhou FF, Xue Y, Chen GL, Yao X. GPS: a novel group-based phosphorylation predicting and scoring method. Biochem Biophys Res Commun. 2004;325(4):1443–1448. | |
Xue Y, Zhou F, Zhu M, Ahmed K, Chen G, Yao X. GPS: a comprehensive www server for phosphorylation sites prediction. Nucleic Acids Res. 2005;33(Web Server issue):W184–W187. |
 © 2014 The Author(s). This work is published and licensed by Dove Medical Press Limited. The full terms of this license are available at https://www.dovepress.com/terms.php and incorporate the Creative Commons Attribution - Non Commercial (unported, v3.0) License.
By accessing the work you hereby accept the Terms. Non-commercial uses of the work are permitted without any further permission from Dove Medical Press Limited, provided the work is properly attributed. For permission for commercial use of this work, please see paragraphs 4.2 and 5 of our Terms.
© 2014 The Author(s). This work is published and licensed by Dove Medical Press Limited. The full terms of this license are available at https://www.dovepress.com/terms.php and incorporate the Creative Commons Attribution - Non Commercial (unported, v3.0) License.
By accessing the work you hereby accept the Terms. Non-commercial uses of the work are permitted without any further permission from Dove Medical Press Limited, provided the work is properly attributed. For permission for commercial use of this work, please see paragraphs 4.2 and 5 of our Terms.