")
Back to Journals » Drug Design, Development and Therapy » Volume 16
An Effective Glucagon-Like Peptide-1 Receptor Agonists, Semaglutide, Improves Sarcopenic Obesity in Obese Mice by Modulating Skeletal Muscle Metabolism
Authors Ren Q, Chen S, Chen X, Niu S, Yue L, Pan X, Li Z, Chen X
Received 7 July 2022
Accepted for publication 11 October 2022
Published 25 October 2022 Volume 2022:16 Pages 3723—3735
DOI https://doi.org/10.2147/DDDT.S381546
Checked for plagiarism Yes
Review by Single anonymous peer review
Peer reviewer comments 2
Editor who approved publication: Professor Anastasios Lymperopoulos
Qingjuan Ren,1,2 Shuchun Chen,1,3 Xing Chen,1 Shu Niu,4 Lin Yue,5 Xiaoyu Pan,1 Zelin Li,1 Xiaoyi Chen1
1Department of Internal Medicine, Hebei Medical University, Shijiazhuang, 050000, People’s Republic of China; 2Department of Geriatrics, Shijiazhuang People’s Hospital, Shijiazhuang, 050000, People’s Republic of China; 3Department of Endocrinology, Hebei General Hospital, Shijiazhuang, 050000, People’s Republic of China; 4Department of Endocrinology, Shijiazhuang People’s Hospital, Shijiazhuang, 050000, People’s Republic of China; 5Department of Endocrinology, The Third Hospital of Shijiazhuang, Shijiazhuang, 050000, People’s Republic of China
Correspondence: Shuchun Chen, Department of Endocrinology, Hebei General Hospital, No. 348, Heping West Road, Shijiazhuang, 050000, People’s Republic of China, Tel +86-13833166283, Email [email protected]
Purpose: This study aimed to investigate the effect of Semaglutide on skeletal muscle and its metabolomics.
Methods: A total of 18 male C57BL/6 mice were randomly divided into normal control (NC) group, high-fat diet (HFD) group and HFD+Semaglutide group, and were given standard diet, HFD diet, HFD diet plus Semaglutide, respectively. The body weight, gastrocnemius weight, serum lipid, blood glucose and inflammatory index levels of mice in each group were observed and compared, and the morphological and structural changes of gastrocnemius were also analyzed. Meanwhile, gastrocnemius metabolite changes were analyzed by untargeted metabolomics.
Results: After Semaglutide treatment, the food intake and body weight of mice were evidently decreased, while the relative gastrocnemius weight ratio were conversely increased. Meanwhile, the levels of TG, CHO, LDL, HDL, TNF-α, IL-6, IL-1β and HOMA-IR were all observed to decrease remarkably after Semaglutide intervention. Histological analysis showed that Semaglutide significantly improved the pathological changes of gastrocnemius, manifested as increased type I/type II muscle fiber ratio, total muscle fiber area, muscle fiber density, sarcomere length, mitochondrial number and mitochondrial area. Furthermore, metabolic changes of gastrocnemius after Semaglutide intervention were analyzed, and 141 kinds of differential metabolites were screened out, mainly embodied in lipids and organic acids, and enriched in 9 metabolic pathways including a variety of amino acids.
Conclusion: Semaglutide can significantly reduce the body weight and the accumulation of intramuscular fat, promote muscle protein synthesis, increase the relative proportion of skeletal muscle, and improve muscle function of obese mice, possibly by altering the metabolism of muscle lipids and organic acids.
Keywords: sarcopenic obesity, sarcopenia, glucagon-like peptide-1 receptor agonists, Semaglutide, metabonomics
Introduction
Due to an aging population, increasing prevalence of obesity, and lifestyle changes over the past few decades, sarcopenic obesity (SO) is now a major public health problem with a global epidemic.1,2 It was estimated that SO will affect 100–200 million people worldwide in the next 35 years.3 SO is a silent, progressive chronic disease with no specific symptoms, and as a result, it remains largely unsuspected and undiagnosed.4 Growing evidence suggests that SO is associated with increased risk of disability, frailty, cardiometabolic disease, loss of independence, impaired quality of life, and mortality, thereby placing a heavy burden on individuals, societies, and health-care systems.5,6 The pathogenesis of SO is multifactorial, among which age-related hormonal changes, sedentary lifestyle, insulin resistance, inflammation and oxidative stress all lead to loss of muscle mass and increase of fat mass.7 Therefore, an in-depth understanding of the underlying mechanism of SO has innumerable benefits for its accurate diagnosis and effective prevention and treatment.
Glucagon-like peptide-1 (GLP-1) is a gut-derived incretin hormone that inhibits glucagon secretion and can lead to weight loss with prolonged use.8,9 These mechanisms of action support the clinical development of anti-degradative glucagon-like peptide-1 receptor agonists (GLP-1RA) for the obesity, which was associated with type 2 diabetes mellitus, non-alcoholic fatty liver disease, and cardiovascular disease.10,11 Although there is evidence that GLP-1RA can reduce body weight, however, this weight loss may not be entirely attributable to fat mass, estimated to be approximately 25–33% including a reduction in lean body mass (LBM).12 The LBM is mainly composed of skeletal muscle, and lower skeletal muscle mass can lead to poorer glycemic control because it is the main site of glucose processing.13 Furthermore, the reduction in muscle mass is synergistically accompanied by the accumulation of fat mass in T2DM, leading to the so-called “SO”.14 Therefore, to maintain health, weight loss should be driven by clinically relevant reductions in fat mass and visceral fat, while maintaining LBM, skeletal muscle mass, and strength. However, it is controversial whether these drugs reduce muscle mass while losing weight. For example, Yajima et al proved that Liraglutide can increased the risk of sarcopenia in patients with type 2 diabetes,15 while Hong et al proved that Liraglutide can induce myogenesis and repair damaged muscle fibers.16
Semaglutide, a recently emerged GLP-1RA agonist with a persistent half-life of approximately one week, has been approved by the US Food and Drug Administration for the treatment of overweight/obese individuals with associated comorbidities.12,17 Available data indicated that Semaglutide has the most significant weight loss effect among GLP-1RAs, but its effect on muscle is unclear.18 Hence, in this study, we aimed to investigate the effect of Semaglutide on skeletal muscle mass and metabolomics of C57BL/6 mice treated with Semaglutide for 12 weeks, expecting to provide guidance for clinical medication.
Materials and Methods
Animals and Groups
A total of 18 male C57BL/6 mice, aged 6 weeks and weighing 20.19±1.49 g, purchased from Ex&Invivo Technology Co., Ltd. (Hebei) were included in this study. Mice were raised in an environment with a temperature of 22±2℃ and a humidity of 50±5%, and provided with sufficient food and water. After one week of adaptive feeding, the animals were randomly divided into normal control group (NC, n = 6) and high-fat diet group (HFD, n = 12). The NC group was fed a standard diet, 3.85 kcal/g, with a fat-to-energy ratio of 12%. The HFD group was fed with high-fat diet (5.24 kcal/g, 60% fat, 20% carbohydrate, 20% protein, fat-to-energy ratio of 60%). The feed was changed from 8 to 9 am every day, and the feed was weighed to calculate the food intake of mice. Besides, the mice were weighed weekly to monitor their weight gain. After 12 weeks (18 weeks of age), the mice were fasted for 12 h and weighed, and the weight of the HFD group exceeded the average weight of the NC group by 20% as the criterion for judging the successful modeling of obese mice. After successful modeling, mice in HFD group were randomly divided into HFD+Semaglutide group (HFD+S, n = 6) and HFD group (n = 6). The HFD+S group were fed with high-fat diet and Semaglutide (intraperitoneal injection from 8 to 9 a.m, 30 nmol/kg/day). The animal experiment was approved by the Animal Ethics Committee of Hebei General Hospital and complied with the International Laboratory Animal Management Regulations.
Assessment of Body Weight, Food Consumption, and Gastrocnemius Weight
Throughout the experiment, the body weight and food consumption of the mice were measured weekly. After the mice were anesthetized and sacrificed, gastrocnemius was quickly isolated, drained and weighed.
Biochemical Index Analysis
After 12 weeks of intervention by Semaglutide, mice were fasted for 12 h, and tail blood was taken to measure fasting blood glucose with a glucose meter (Accu-Chek; Roche Diagnostics GmbH, Germany). Mouse INS (Insulin) ELISA Kit (E-EL-M1382c, Elabscience Biotechnology Co., Ltd, China) was used to determine the level of Insulin. Fasting Insulin Resistance index (HOMA-IR) was also assessed: HOMA-IR=fasting glucose×fasting insulin/22.5. Then, the mice were anesthetized with 40 mg/kg pentobarbital sodium, and the blood from inner canthus was collected and centrifuged at 2000 r/min for 20 min. Finally, the plasma was separated and tested for lipid and inflammatory indexes, including: triglyceride (TG), serum cholesterol (CHO), low-density lipoprotein (LDL), high-density lipoprotein (HDL), tumour necrosis factor-ɑ (TNF-α), interleukin-6 (IL-6), and IL-1β. TG and CHO were detected by the GPO-PAP method (NanJing JianCheng Bioengineering Institute, China). LDL and HDL were measured by the terminal method. Mouse IL-1β ELISA Kit (70-EK201B/3-96, MultiSciences Biotech Co., Ltd., China), Mouse IL-6 ELISA Kit (70-EK206/3-96, MultiSciences Biotech Co., Ltd., China) and Mouse TNF-α ELISA Kit (70-EK282/4-96, MultiSciences Biotech Co., Ltd., China) was used to determine the level of IL-1β, IL-6 and TNF-α, respectively.
Hematoxylin-Eosin (H&E) Staining
The gastrocnemius tissues (1×5 mm) were routinely fixed, dehydrated, embedded and sectioned, and then stained with H&E for 10 min. Eclipse Ci-L microscope (Nikon, Japan) was used for imaging, and Image-Pro Plus 6.0 (Media Cybernetics, U.S.A.) was used for imaging analysis. The diameters of 5 muscle fibers, the total area of muscle fibers, the total number of muscle fibers, and the density of muscle fibers were calculated, respectively. The formula: muscle fibers density = total number of muscle fibers/the total area of muscle fibers.
Multiplex Immunofluorescence Analysis
Briefly, gastrocnemius tissues were routinely fixed, dehydrated, embedded and sectioned, and then fluorescently labeled with F-mshc and Ss-mhc. Eclipse Ci-L microscope (Nikon, Japan) was used for imaging, and Image-Pro Plus 6.0 (Media Cybernetics, U.S.A.) was used for imaging analysis. Type I and type II muscle fibers were counted in each photo, and the ratio of the two was calculated.
Transmission Electron Microscopy (TEM)
First, gastrocnemius specimens were fixed with 1% osmic acid and rinsed with 0.1 M phosphate-buffered saline. Then, the specimens were sequentially dehydrated in 50–70–80–90–95–100–100% alcohol-100% acetone-100% acetone. After embedding and sectioning (60–80 nm), the samples were double stained with uranium-lead. Images were acquired by transmission electron microscopy (HT7700, HITACHI) and analyzed using Image-Pro Plus 6.0 software. Mitochondrial density was counted, and myofibril diameter, sarcomere length, sarcoplasmic reticulum area, mitochondrial area were measured.
Untargeted Metabolomics Analysis
Briefly, the supernatant of gastrocnemius specimens was taken after grinding and centrifugation. LC-MS/MS analyses were performed using an ACQUITY UPLC system (Vanquish, Thermo Fisher Scientific) with an ACQUITY UPLC HSS T3 (2.1 mm×100 mm, 1.8 μm) coupled to Q Exactive plus mass spectrometer (Orbitrap MS, Thermo). Chromatographic conditions: column temperature: 45℃; Mobile phase: A-water (containing 0.1% formic acid), B-acetonitrile (containing 0.1% formic acid); Flow rate: 0.35 mL/min; sample volume: 2 μL. The raw data obtained were processed using Progenesis QI v2.3 software (Nonlinear Dynamics, Newcastle, UK), and the qualitative and quantitative analysis of compounds was performed using The Human Metabolome Database (HMDB), Lipidmaps (v2.3) and METLIN databases.
Further analysis of data: PCA was first used to observe the overall distribution of each sample and the stability of the whole analysis process. Then, PLS-DA and OPLS-DA were used to distinguish the overall differences of metabolic profiles between groups and screen differential metabolites between groups. The differentially expressed metabolites should meet the importance of the first principal component variable in the OPLS-DA model at projection VIP >1 and P<0.05. The metabolic pathways involved in different metabolites were analyzed on Kyoto Encyclopedia of Genes and Genomes (KEGG) website.
Statistical Analysis
SPSS 25.0 software was used to analyze the experimental results. Comparisons between groups were performed by one-way analysis of variance (ANOVA). P<0.05 was considered as statistically significant.
Results
Semaglutide Significantly Reduced Food Consumption and Body Weight, and Conversely Increased Gastrocnemius Weight in Obese Mice
As shown in Figure 1A, there was no significant difference in body weight between the NC group and the HFD group at the initial stage. However, after 3 weeks of feeding, there was a statistical difference between the two groups of mice, and the weight gain in the high-fat fed group was more pronounced. After feeding to the 12th week, the average body weight of the HFD group was significantly higher than that of the NC group, indicating that the obesity mouse model was successfully constructed. Surprisingly, after Semaglutide treatment, the food intake of mice in the HFD+S group was evidently lower than that of the HFD group from the 3rd week, and the food consumption of the HFD+S group was lower than that of the HFD group throughout the treatment cycle (Figure 1B). Correspondingly, after Semaglutide treatment for 4 weeks, the body weight of the mice in the HFD+S group showed a downward trend, and there was a significant difference between the two groups at the 5th week (Figure 1A). In addition, we analyzed the gastrocnemius-specific gravity among the three groups and found that the high-fat diet remarkably reduced the gastrocnemius weight, while Semaglutide significantly reversed the reduction of gastrocnemius weight affected by the high-fat diet (Figure 1C). Intuitively, the size of mice in HFD group was significantly bigger than that in NC group, and decreased evidently after Semaglutide intervention (Figure 1D).
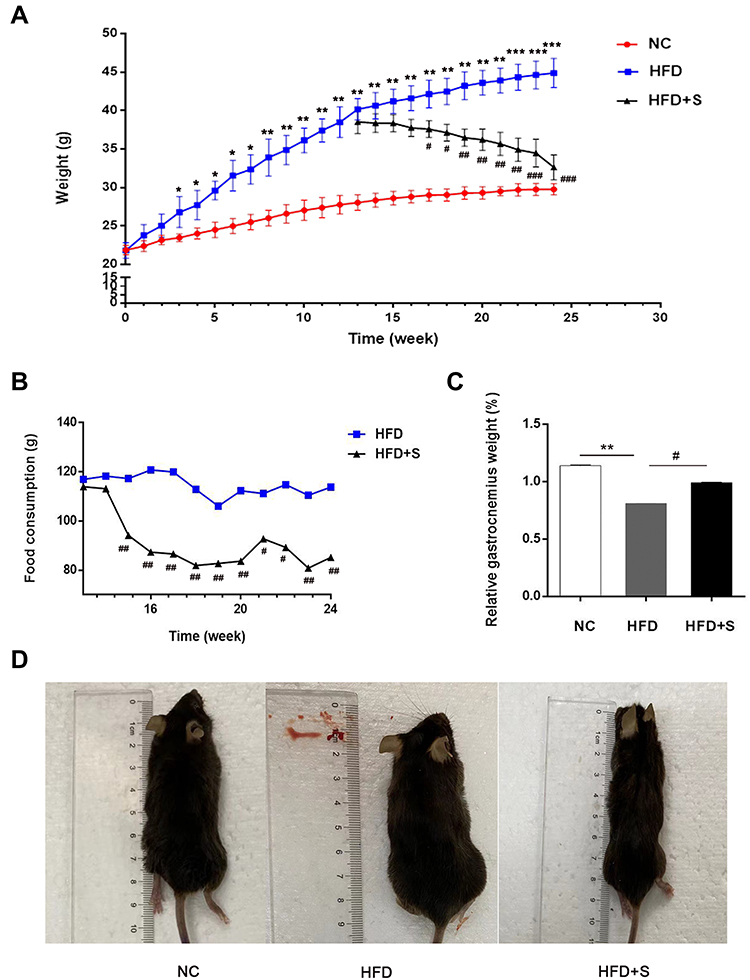 |
Figure 1 Semaglutide significantly reduced food consumption and body weight, and conversely increased gastrocnemius weight in obese mice. (A) The changes of body weight of mice in NC group, the HFD group and the HFD+S group; (B) the food consumption of mice in the HFD+S group and HFD group after Semaglutide treatment; (C) relative gastrocnemius weight in indicated groups; (D) the size of mice in indicated groups. *P < 0.05, **P < 0.01, ***P < 0.001 indicated vs NC group; #P < 0.05, ##P < 0.01 indicated vs HFD group. |
Semaglutide Significantly Reduced Fasting Glucose, Lipid and Inflammatory Indexes
In addition to comparing body weight, food consumption, and gastrocnemius weight between groups of mice, we also assessed changes in fasting glucose, lipid and inflammatory indexes. In Figure 2, we observed a significant increase in TG, CHO, LDL, HDL, TNF-α, IL-6, IL-1β and HOMA-IR in mice on a high-fat diet compared to the NC group. Interestingly, when the mice were intervened with Semaglutide, the above indicators were significantly reduced.
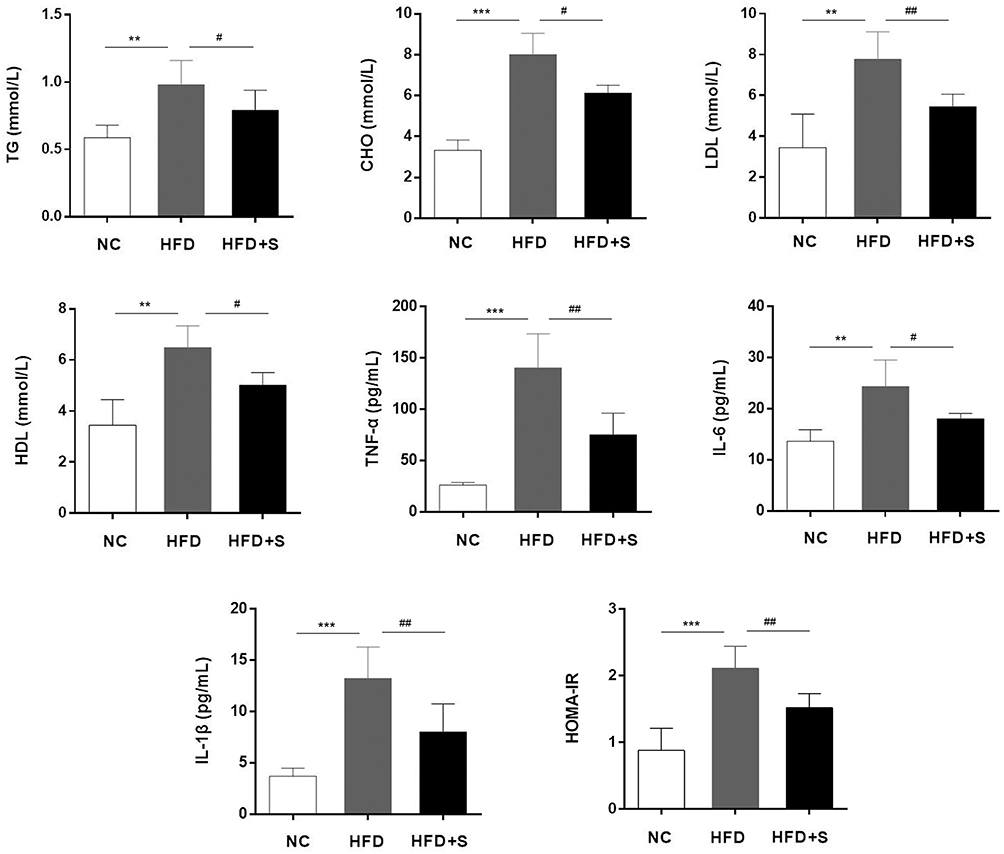 |
Figure 2 Semaglutide significantly reduced fasting glucose, lipid and inflammatory indexes. The levels of TG, CHO, LDL, HDL, TNF-α, IL-6, IL-1β and HOMA-IR in different groups were detected. **P < 0.01 or ***P < 0.001 indicated vs NC group; #P < 0.05 or ##P < 0.01 indicated vs HFD group. |
Semaglutide Significantly Improved the Lesions of Gastrocnemius
To observe the effect of Semaglutide on gastrocnemius, we first observed the pathological changes of gastrocnemius by H&E staining and fluorescent labeling. Through H&E staining, it was clearly observed that the cross-section of the muscle fibers in the NC group was round or oval, with regular edges, clear shapes, and neat arrangement. In the HFD group, the edges of the muscle fibers were irregular, the overall arrangement was sparse and disordered, and the distance between the muscle fibers expanded. However, after Semaglutide intervention, the muscle fibers in the HFD+S group were improved, and although some of the edges were irregular, the overall arrangement was tighter than that of the HFD group (Figure 3A). In addition, the composition of muscle fibers was analyzed by fluorescent labeling. As shown in Figure 3B, green fluorescence represented type I muscle fiber, while red fluorescence represented type II muscle fiber. Type I and type II muscle fiber were cross-distributed, with type II muscle fibers being the predominant. The high-fat diet reduced the distribution ratio of type I/II, while Semaglutide reversed the reduction of the high-fat diet to the type I/II ratio (Figure 4A).
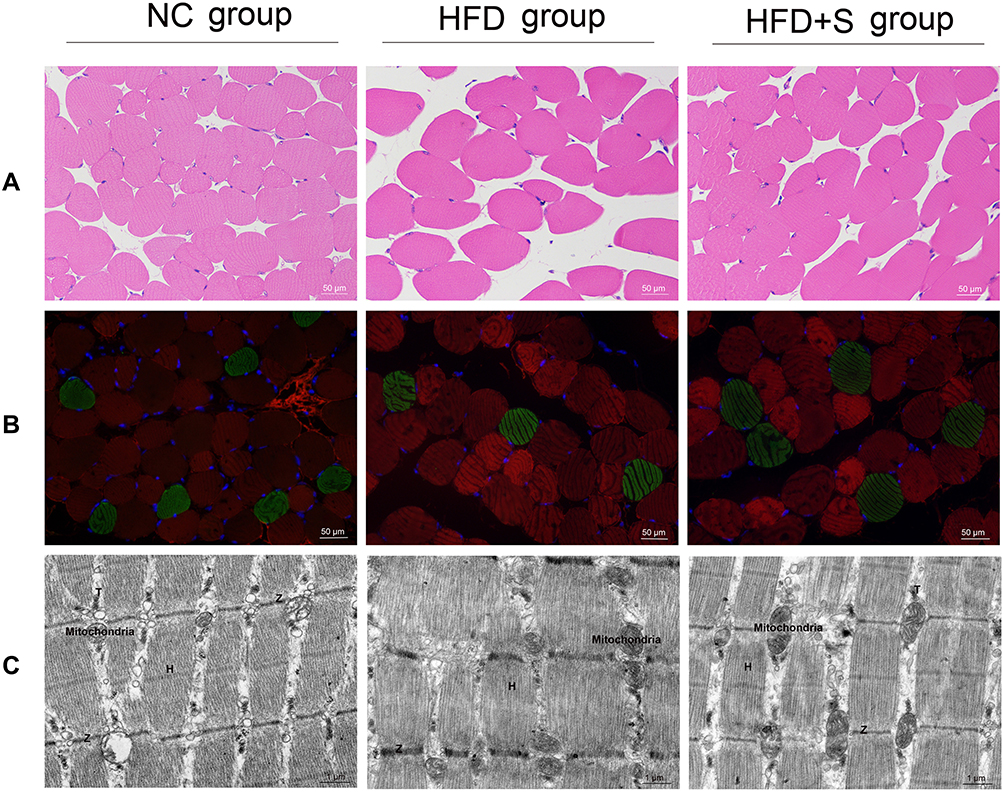 |
Figure 3 Semaglutide significantly improved the lesions and microstructure of gastrocnemius. (A) H&E staining of gastrocnemius tissues; (B) fluorescent labeling of gastrocnemius tissues; (C) the microstructure of gastrocnemius was observed via transmission electron microscopy. |
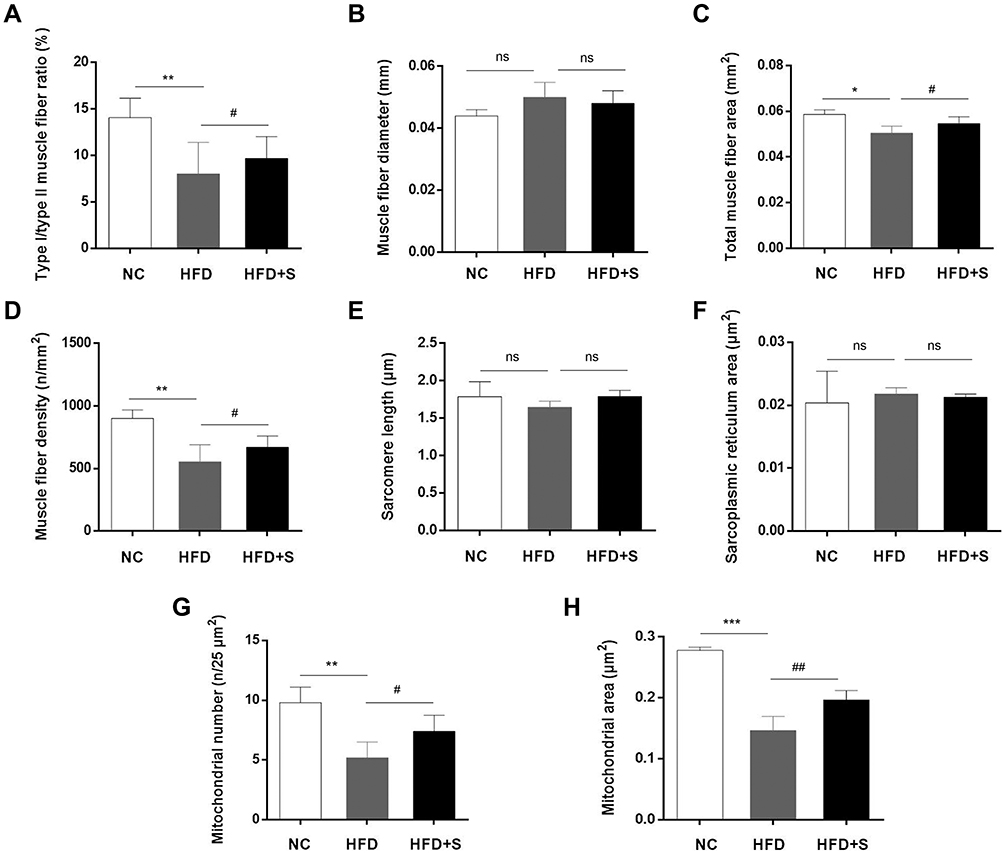 |
Figure 4 Semaglutide significantly improved the lesions and microstructure of gastrocnemius. Quantitative detection of (A) type I/type II muscle fiber ratio, (B) muscle fiber diameter, (C) total muscle fiber area, (D) muscle fiber density, (E) sarcomere length, (F) sarcoplasmic reticulum area, (G) mitochondrial area, and (H) mitochondrial number. *P < 0.05 or **P < 0.01 or ***P < 0.001 indicated vs NC group; #P < 0.05 or ##P < 0.01 indicated vs HFD group; ns indicated no statistical significance. |
Semaglutide Significantly Improved Microstructure of Gastrocnemius
Next, we analyzed the effect of Semaglutide on the microstructure of gastrocnemius (Figure 3C). In the NC group, the distribution of myofibrils was neat, and there was no breakage of myofilament. The number of mitochondria was abundant without swelling, the electron density of matrix was uniform, and the cristae were not broken. The transverse tubule (T) structure, the Z-line and the H-band were all clear. In the HFD group, myofilament rupture was seen. The number of mitochondria in the gastrocnemius was relatively reduced, and the degree of damage varies, showing matrix dissolution, cristae loss, and vacuolization. Meanwhile, mild dilation of the sarcoplasmic reticulum and a more indistinct H-band were observed. In HFD+S group, myofibrils were distributed neatly, and myofilaments were occasionally broken. Mitochondria were abundant, and a few of them were slightly swollen and enlarged, with uneven matrix electron density and cristae fracture and deletion. The sarcoplasmic reticulum was slightly dilated. Besides, the transverse tubule structure, the H-band and the Z-line were all clear, but the Z-line was locally discontinuous.
Except for the observation of the microscopic morphology, the muscle fiber diameter, total muscle fiber area, muscle fiber density, mitochondrial area, mitochondrial number, sarcomere length and sarcoplasmic reticulum area were analyzed quantitatively. The statistics data showed a significant increase of muscle fiber diameter and sarcoplasmic reticulum area, and a decrease of total muscle fiber area, muscle fiber density, sarcomere length, mitochondrial number and mitochondrial area after a high-fat diet. Interestingly, however, the addition of Semaglutide reversed the trend of the aforementioned indicators. Additionally, although muscle fiber diameter, sarcomere length and sarcoplasmic reticulum area showed a trend of change among the three groups, there was no statistical difference (Figure 4B-J).
Semaglutide Affected Gastrocnemius Metabolism
The multivariate statistical analysis depicted that the overall distribution among the samples was stable, and the OPLS-DA score plot showed that there was a significant separation between the different comparison groups (Figure 5A and Figure 5). To gain insight into how Semaglutide affected the gastrocnemius, the differential metabolites between NC and HFD groups and HFD and HFD+S groups were screened, and the associated enrichment pathways were analyzed simultaneously. As shown in Figure 5C and Figure 5, a total of 196 differential metabolites were screened out between the HFD group and the NC group. In these differential metabolites, there were 79 kinds of Lipids and lipid-like molecules, 25 kinds of Organic acids and derivatives, 12 kinds of Organoheterocyclic compounds, 11 kinds of Organic oxygen compounds, 11 kinds of Benzenoids, 8 kinds of Phenylpropanoids and polyketides, 7 kinds of Nucleosides, nucleotides and analogues, 4 kinds of Organic nitrogen compounds, 2 kinds of Alkaloids and derivatives, 1 kinds of Hydrocarbon derivatives, 1 kinds of Organosulfur compounds, and 35 kinds of unclassified. Besides, there are 30 kinds of fatty acyls and 16 kinds of glycerophospholipids among Lipids and lipid-like molecules that occupy a large proportion. Also, in the organic acids and derivatives that account for 13%, there are 24 kinds of Amino acids, peptides, and analogues, and 1 kind of Peptidomimetics. Through KEEG analysis, a total of 29 enriched pathways were obtained, which were Aminoacyl-tRNA biosynthesis, Choline metabolism in cancer, Histidine metabolism, Retrograde endocannabinoid signaling, Taste transduction, Glycerophospholipid metabolism, Ferroptosis, Protein digestion and absorption, Long-term depression, Necroptosis Purine metabolism, Pantothenate and CoA biosynthesis, Phenylalanine metabolism, beta-Alanine metabolism, Fc epsilon RI signaling pathway, Neuroactive ligand-receptor interaction, Serotonergic synapse, ABC transporters, Taurine and hypotaurine metabolism, Bile secretion, Arginine biosynthesis, Valine, leucine and isoleucine biosynthesis, Alanine, aspartate and glutamate metabolism, Antifolate resistance, Linoleic acid metabolism, Inflammatory mediator regulation of TRP channels, Apoptosis, Biosynthesis of unsaturated fatty acids and Central carbon metabolism in cancer (Figure 5G).
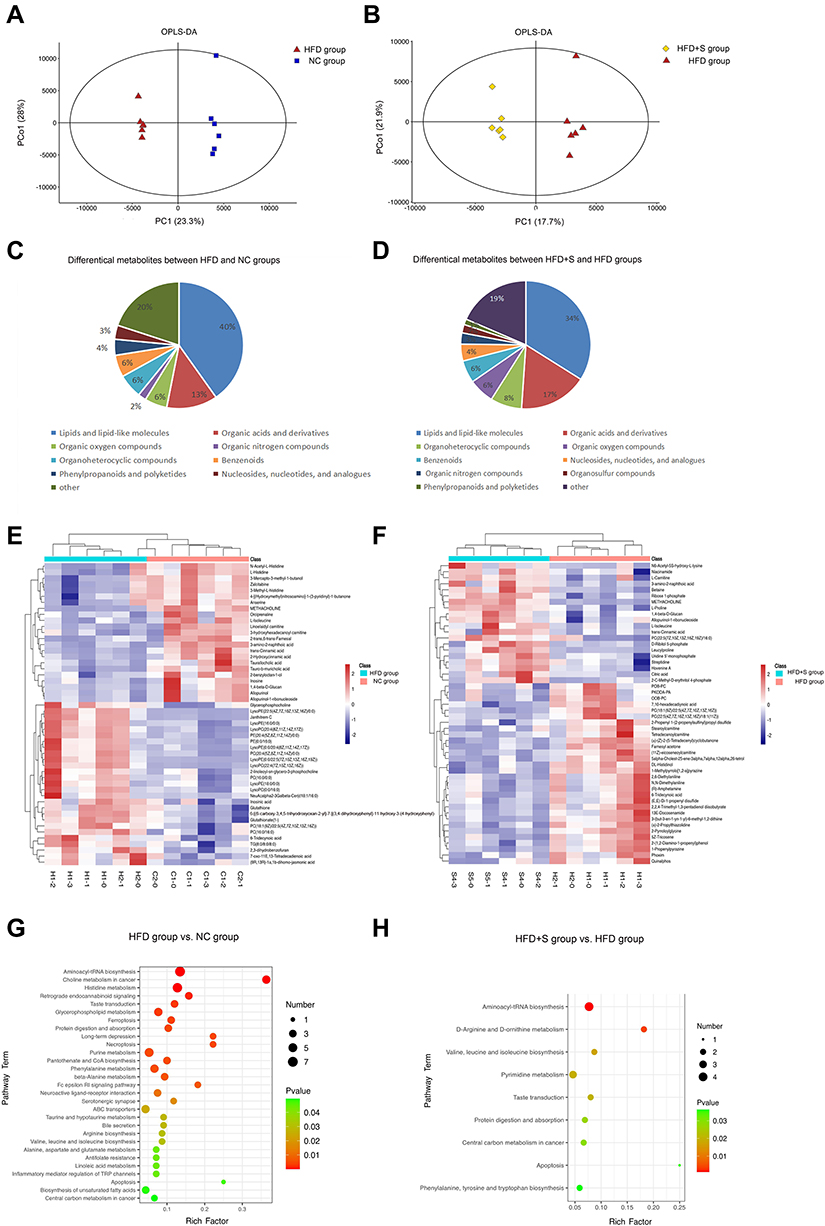 |
Figure 5 Semaglutide affected gastrocnemius metabolism. (A and B) The OPLS-DA score plot showed that there was a significant separation between the different comparison groups; (C and E) differential metabolites between NC and HFD groups; (D and F) differential metabolites between HFD and HFD+S groups; (G) the enriched pathways between NC and HFD groups; (H) the enriched pathways between HFD and HFD+S groups. |
A total of 141 differential metabolites were screened out between HDF+S group and HDF+C group, including 48 kinds of Lipids and lipid-like molecules, 24 kinds of Organic acids and derivatives, 11 kinds of Organoheterocyclic compounds, 9 kinds of Organic oxygen compounds, 8 kinds of Benzenoids, 6 kinds of Nucleosides, nucleotides, and analogues, 4 kinds of Organic nitrogen compounds, 3 kinds of Organosulfur compounds, 2 kinds of Phenylpropanoids and polyketides and 26 kinds of unclassified. Among them, Lipids and lipid-like molecules accounted for the largest proportion for 34%, including 22 fatty Acyls and 16 glycerophospholipids. Organic acids and derivatives account for 17%, including 20 Amino acids, peptides, and analogues (Figure 5D and Figure 5). Through KEEG analysis, a total of 9 enriched pathways were obtained, which were Aminoacyl-tRNA biosynthesis, D-Arginine and D-ornithine metabolism, Valine, leucine and isoleucine biosynthesis, Pyrimidine metabolism, Taste transduction, Protein digestion and absorption, Central carbon metabolism in cancer, Apoptosis, Phenylalanine, tyrosine and tryptophan biosynthesis (Figure 5H).
Discussion
Fat and skeletal muscle are important components of human body, and both play an indispensable role in body metabolism.19 Abnormal increase and distribution of adipose tissue can lead to the occurrence of obesity, and promote the secretion of various adipokines, resulting in the loss of body homeostasis, which has an important impact on the occurrence of insulin resistance and hyperglycemia.20 Skeletal muscle can participate in glucose and lipid metabolism by secreting a variety of myokines, and its insulin resistance is an important contributor to the pathogenesis of diabetes.21 Studies have suggested that obesity and sarcopenia may have a common pathogenesis and interact with each other. Excessive adipose tissue leads to immune cell infiltration, macrophage polarization, secretion of a variety of pro-inflammatory cytokines and adipokines, promoting the occurrence of local and systemic chronic low-grade inflammation and insulin resistance. Local adipokine infiltration in skeletal muscle may be the mechanism of obesity-induced sarcopenia.14,22 In addition, the activities of sarcopenia patients are reduced, and various factors secreted by their muscles, such as Myostatin, Irisin, IL-6, IL-8, IL-15, will in turn increase the degree of obesity.23,24 Both sarcopenia and obesity can independently increase the risk of adverse health outcomes. When the two conditions are combined, health risks can be synergistically amplified.7 Epidemiological data implied that SO was a better predictor of physical disability in older adults than sarcopenia or obesity alone.25 Therefore, maintaining muscle mass during weight loss treatment is particularly important. In this study, the gastrocnemius/body weight ratio of the HFD group was significantly lower than that of the NC group, and the destruction of the muscle fiber structure could also be observed under the light microscope, suggesting that there was a significant correlation between obesity and sarcopenia. The body weight of mice in the HFD+S group represented a downward trend from the 4th week, which was 29.67% lower than that in the HFD group by the end of the study, showing a significant weight loss effect. Meanwhile, a reduction in the food intake of the Semaglutide treated mice was observed, suggesting that Semaglutide can reduce body weight by suppressing appetite. Furthermore, we also focused on the effect of Semaglutide on muscle, and found that the relative weight of muscle in HFD+S group mice was significantly increased, indicating that Semaglutide reversed the muscle loss in obese mice. Collectively, we demonstrated that Semaglutide can evidently reduce body weight, increase muscle mass, and optimize body composition in obese mice.
The inflammatory environment and insulin resistance are the key links in the development of sarcopenia. Studies have shown that obesity can promote low levels of inflammation, which leads to the secretion of inflammatory factors such as TNF-α, IL-6, and IL-1β.26,27 All these secretory changes can cause insulin resistance, inhibit muscle fiber differentiation, change protein metabolism pathway, activate protein degradation system, and subsequently lead to muscle degeneration. In turn, muscle catabolism increased insulin resistance, thus resulting in fat mass gain.28 Accumulating data suggested that GLP-1RAs have anti-inflammatory and insulin resistance-modifying effects.29 Additionally, muscle-atrophy-related studies also suggested that these drugs can increase muscle mass, muscle fiber size and muscle function by inhibiting the expression of myostatin and muscle dystrophy factor, and improve muscle atrophy by enhancing myostatin through GLP-1R-mediated signaling pathway.16 Here, through our finding, we observed that TNF-α, IL-6, IL-1β, and HOMA-IR in the HFD+S group were significantly lower than those in the HFD group, suggesting that Semaglutide may have beneficial effects on muscle by reducing inflammatory response and insulin resistance, which was shown in significantly improved muscle fiber structure and increased number of mitochondria. Mitochondria are the main part of energy generation, and the number of mitochondria can directly affect muscle function.30 Therefore, Semaglutide was inferred to improve muscle function. Skeletal muscle is composed of different types of muscle fibers, and obesity can lead to fiber type switching.31 Fluorescence labeling represented a decrease in the proportion of type I/II muscle fibers in the HFD group, indicating that obesity led to a decrease in oxidative muscle fibers and an increase in glycolytic muscle fibers, which aggravated metabolic disorders. In our study, there was an exciting reversal in muscle fiber ratio after treatment with Semaglutide. Taken together, Semaglutide can reduce inflammatory state and insulin resistance, and improved muscle function of obese mice.
The gastrocnemius is the largest muscle in the hind limb of mice and plays an important role in the animal motor system. To understand the effect of Semaglutide on muscle metabolism, metabolomics analysis was performed. A total of 196 differential metabolites were screened out between the HFD group and the NC group, of which lipids and organic acids accounted for the largest proportions. Among lipids, we found increased levels of glycerophospholipids and long-chain fatty acids (LCFAs), while decreased long-chain acylcarnitines. Increased glycerophospholipids are thought to be associated with obesity and insulin resistance.32 LCFAs can lead to inflammatory responses, especially arachidonic acid (AA), as a bridge linking lipid metabolism with immunity and inflammation, and have obvious pro-inflammatory effects.33 The main function of long-chain acylcarnitines in muscle is to ensure the transport of long-chain fatty acids to mitochondria. Previous study has shown that long-chain acylcarnitines were increased in patients with type 2 diabetes, which can lead to inflammatory response and participate in insulin resistance.34 Conversely, the level of long-chain acylcarnitine in the muscle of the mice in this study decreased, which may indicate a decrease in the utilization of fatty acids by the muscle, but the specific mechanism remains to be further studied. Among the organic acids, Histidine, Isoleucine, Proline, Valine, and Phenylalanine were found to be reduced. Skeletal muscle is the main site of amino acid metabolism and plays an indispensable role in protein synthesis, muscle structure and function maintenance. A drop in their levels directly affects protein synthesis, leading to a loss of muscle mass.35 Therefore, we speculated that the possible metabolic factors for the occurrence of SO are abnormal metabolism of fat and organic acids in muscle tissues (Figure 6A).
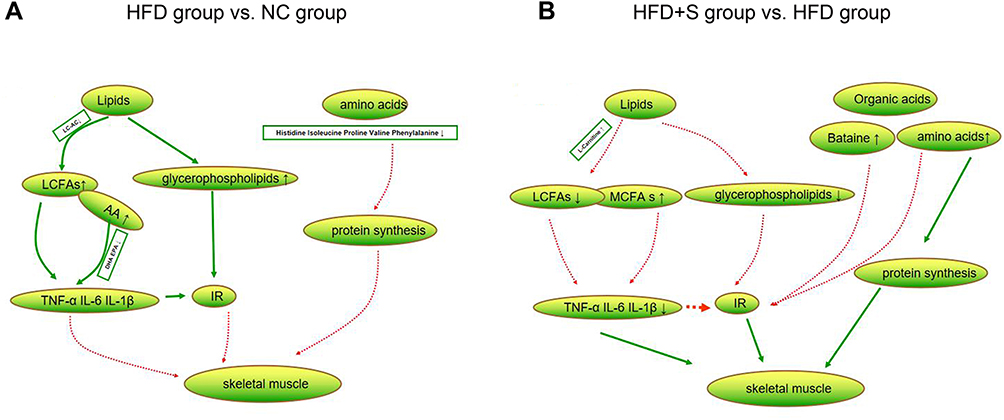 |
Figure 6 Changes of lipid and organic acid metabolites. (A) The difference metabolites of lipids and amino acids were compared between HFD group and NC group; (B) the difference metabolites of lipids and organic acids were compared between HFD+S group and HFD group. |
A total of 141 differential metabolites were screened out between HDF+S and HFD groups, and lipids and organic acids were still the most obvious metabolites. In terms of lipid metabolism, glycerophospholipid and LCFAs levels decreased, which may be related to the increase in L-Carnitine, as there are data showing that it can increase the transport and metabolism of LCFAs.36 Meanwhile, the decrease in glycerophospholipid and LCFAs concentrations alleviated the inflammatory response, which was confirmed by the decreased inflammatory markers in the HFD+S group. Besides, we found elevated concentrations of medium-chain fatty acids. Medium-chain fatty acids have been shown to promote lipid catabolism and stimulate thermogenesis in brown adipose tissue, thereby promoting body fat consumption.37 In terms of organic acids, the levels of Isoleucine, Proline, Valine, Arginine, Betaine, and Citric acid increased significantly. Among them, Isoleucine and Valine are branched chain amino acids, which can reduce muscle breakdown and promote muscle protein synthesis.38 In addition, adequate branched-chain amino acids also increase lipid oxidation and lipogenesis, maintaining normal lipid metabolism in muscles. Therefore, branched-chain amino acids have a synergistic role in lipid metabolism.39 Apart from the aforementioned anabolic effects of amino acids, Arginine may also affect skeletal muscle metabolism or improve insulin sensitivity by altering circulating concentrations of growth hormone.35 In both in vitro and in vivo studies, Betaine has been confirmed to promote myogenesis.40 Collectively, Sommarutide can reduce the risk of SO by regulating the lipids and organic acid metabolism of skeletal muscle (Figure 6B).
Conclusion
Semaglutide can significantly reduce body weight and intramuscular fat accumulation, promote muscle protein synthesis, increase skeletal muscle relative weight and improve muscle function of mice. Mechanistically, Semaglutide may reduce the risk of SO by altering the lipids and organic acid metabolism of muscle.
Data Sharing Statement
The datasets generated during and analyzed during the current study are available from the corresponding author on reasonable request.
Ethic Statement
Animal care and experimental treatment were approved by the animal ethics committee of Hebei General Hospital.
Author Contributions
All authors made a significant contribution to the work reported, whether that is in the conception, study design, execution, acquisition of data, analysis and interpretation, or in all these areas; took part in drafting, revising or critically reviewing the article; gave final approval of the version to be published; have agreed on the journal to which the article has been submitted; and agree to be accountable for all aspects of the work.
Funding
This work was supported by Hebei Provincial central leading Local Science and Technology Development funds Project (No. 206Z7702G).
Disclosure
The authors declare that they have no conflicts of interest in this work.
References
1. Polyzos SA, Margioris AN. Sarcopenic obesity. Hormones. 2018;17(3):321–331. doi:10.1007/s42000-018-0049-x
2. Stewart ST, Cutler DM, Rosen AB. Forecasting the effects of obesity and smoking on U.S. life expectancy. N Engl J Med. 2009;361(23):2252–2260. doi:10.1056/NEJMsa0900459
3. Lee DC, Shook RP, Drenowatz C, et al. Physical activity and sarcopenic obesity: definition, assessment, prevalence and mechanism. Future Sci OA. 2016;2(3):Fso127. doi:10.4155/fsoa-2016-0028
4. Koliaki C, Liatis S, Dalamaga M, et al. Sarcopenic obesity: epidemiologic evidence, pathophysiology, and therapeutic perspectives. Curr Obes Rep. 2019;8(4):458–471. doi:10.1007/s13679-019-00359-9
5. Flegal KM, Kruszon-Moran D, Carroll MD, et al. Trends in obesity among adults in the United States, 2005 to 2014. JAMA. 2016;315(21):2284–2291. doi:10.1001/jama.2016.6458
6. Finkelstein EA, Khavjou OA, Thompson H, et al. Obesity and severe obesity forecasts through 2030. Am J Prev Med. 2012;42(6):563–570. doi:10.1016/j.amepre.2011.10.026
7. Batsis JA, Villareal DT. Sarcopenic obesity in older adults: aetiology, epidemiology and treatment strategies. Nat Rev Endocrinol. 2018;14(9):513–537. doi:10.1038/s41574-018-0062-9
8. Müller TD, Finan B, Bloom SR, et al. Glucagon-like peptide 1 (GLP-1). Mol Metab. 2019;30:72–130. doi:10.1016/j.molmet.2019.09.010
9. McLean BA, Wong CK, Kaur KD, et al. Differential importance of endothelial and hematopoietic cell GLP-1Rs for cardiometabolic versus hepatic actions of semaglutide. JCI Insight. 2021;6(22). doi:10.1172/jci.insight.153732
10. Kushner RF, Calanna S, Davies M, et al. Semaglutide 2.4 mg for the treatment of obesity: key elements of the STEP Trials 1 to 5. Obesity. 2020;28(6):1050–1061. doi:10.1002/oby.22794
11. Newsome PN, Buchholtz K, Cusi K, et al. A placebo-controlled trial of subcutaneous semaglutide in nonalcoholic steatohepatitis. N Engl J Med. 2021;384(12):1113–1124. doi:10.1056/NEJMoa2028395
12. Magkos F, Fraterrigo G, Yoshino J, et al. Effects of moderate and subsequent progressive weight loss on metabolic function and adipose tissue biology in humans with obesity. Cell Metab. 2016;23(4):591–601. doi:10.1016/j.cmet.2016.02.005
13. DeFronzo RA, Tripathy D. Skeletal muscle insulin resistance is the primary defect in type 2 diabetes. Diabetes Care. 2009;32:S157–163. doi:10.2337/dc09-S302
14. Wang M, Tan Y, Shi Y, et al. Diabetes and sarcopenic obesity: pathogenesis, diagnosis, and treatments. Front Endocrinol (Lausanne). 2020;11:568. doi:10.3389/fendo.2020.00568
15. Yajima T, Yajima K, Takahashi H, et al. The effect of dulaglutide on body composition in type 2 diabetes mellitus patients on hemodialysis. J Diabetes Complications. 2018;32(8):759–763. doi:10.1016/j.jdiacomp.2018.05.018
16. Hong Y, Lee JH, Jeong KW, et al. Amelioration of muscle wasting by glucagon-like peptide-1 receptor agonist in muscle atrophy. J Cachexia Sarcopenia Muscle. 2019;10(4):903–918. doi:10.1002/jcsm.12434
17. Christou GA, Katsiki N, Blundell J, et al. Semaglutide as a promising antiobesity drug. Obesity. 2019;20(6):805–815.
18. Trujillo JM, Nuffer W, Smith BA. GLP-1 receptor agonists: an updated review of head-to-head clinical studies. Ther Adv Endocrinol Metab. 2021;12:2042018821997320. doi:10.1177/2042018821997320
19. JafariNasabian P, Inglis JE, Reilly W, et al. Aging human body: changes in bone, muscle and body fat with consequent changes in nutrient intake. J Endocrinol. 2017;234(1):R37–r51. doi:10.1530/JOE-16-0603
20. Barakat B, Almeida MEF. Biochemical and immunological changes in obesity. Arch Biochem Biophys. 2021;708:108951. doi:10.1016/j.abb.2021.108951
21. Kalra S, Bhattacharya S, Mittal R. The diabetic muscle. J Pak Med Assoc. 2021;71(5):1503–1505.
22. Kalinkovich A, Livshits G. Sarcopenic obesity or obese sarcopenia: a cross talk between age-associated adipose tissue and skeletal muscle inflammation as a main mechanism of the pathogenesis. Ageing Res Rev. 2017;35:200–221. doi:10.1016/j.arr.2016.09.008
23. Tournadre A, Vial G, Capel F, et al. Sarcopenia. Joint Bone Spine. 2019;86(3):309–314. doi:10.1016/j.jbspin.2018.08.001
24. Barazzoni R, Bischoff S, Boirie Y, et al. Sarcopenic obesity: time to meet the challenge. Obes Facts. 2018;11(4):294–305. doi:10.1159/000490361
25. Baumgartner RN, Wayne SJ, Waters DL, et al. Sarcopenic obesity predicts instrumental activities of daily living disability in the elderly. Obes Res. 2004;12(12):1995–2004. doi:10.1038/oby.2004.250
26. Schrager MA, Metter EJ, Simonsick E, et al. Sarcopenic obesity and inflammation in the InCHIANTI study. J Appl Physiol. 2007;102(3):919–925. doi:10.1152/japplphysiol.00627.2006
27. Forsythe LK, Wallace JM, Livingstone MB. Obesity and inflammation: the effects of weight loss. Nutr Res Rev. 2008;21(2):117–133. doi:10.1017/S0954422408138732
28. Zamboni M, Mazzali G, Fantin F, et al. Sarcopenic obesity: a new category of obesity in the elderly. NMCD. 2008;18(5):388–395. doi:10.1016/j.numecd.2007.10.002
29. Rakipovski G, Rolin B, Nøhr J, et al. The GLP-1 analogs liraglutide and semaglutide reduce atherosclerosis in ApoE(-/-) and LDLr(-/-) mice by a mechanism that includes inflammatory pathways. JACC. 2018;3(6):844–857. doi:10.1016/j.jacbts.2018.09.004
30. Frontera WR, Ochala J. Skeletal muscle: a brief review of structure and function. Calcif Tissue Int. 2015;96(3):183–195. doi:10.1007/s00223-014-9915-y
31. Schuler M, Ali F, Chambon C, et al. PGC1alpha expression is controlled in skeletal muscles by PPARbeta, whose ablation results in fiber-type switching, obesity, and type 2 diabetes. Cell Metab. 2006;4(5):407–414. doi:10.1016/j.cmet.2006.10.003
32. Ferrara PJ, Rong X, Maschek JA, et al. Lysophospholipid acylation modulates plasma membrane lipid organization and insulin sensitivity in skeletal muscle. J Clin Invest. 2021;131(8). doi:10.1172/JCI135963
33. Sonnweber T, Pizzini A, Nairz M, et al. Arachidonic acid metabolites in cardiovascular and metabolic diseases. Int J Mol Sci. 2018;19(11):3285. doi:10.3390/ijms19113285
34. Rutkowsky JM, Knotts TA, Ono-Moore KD, et al. Acylcarnitines activate proinflammatory signaling pathways. Am J Physiol Endocrinol Metab. 2014;306(12):E1378–1387. doi:10.1152/ajpendo.00656.2013
35. Thalacker-Mercer A, Riddle E, Barre L. Protein and amino acids for skeletal muscle health in aging. Adv Food Nutr Res. 2020;91:29–64.
36. Virmani MA, Cirulli M. The role of l-carnitine in mitochondria, prevention of metabolic inflexibility and disease initiation. Int J Mol Sci. 2022;23(5):2717. doi:10.3390/ijms23052717
37. Rial SA, Jutras-Carignan A, Bergeron KF, et al. A high-fat diet enriched in medium chain triglycerides triggers hepatic thermogenesis and improves metabolic health in lean and obese mice. Biochim Biophys Acta Mol Cell Biol Lipids. 2020;1865(3):158582. doi:10.1016/j.bbalip.2019.158582
38. Nishitani S, Ijichi C, Takehana K, et al. Pharmacological activities of branched-chain amino acids: specificity of tissue and signal transduction. Biochem Biophys Res Commun. 2004;313(2):387–389. doi:10.1016/j.bbrc.2003.11.023
39. Karvinen S, Fachada V, Sahinaho U-M. Branched-chain amino acid deprivation decreases lipid oxidation and lipogenesis in C2C12 myotubes. Metabolites. 2022;12(4):328. doi:10.3390/metabo12040328
40. Lee SS, Kim YA, Eun B, et al. Betaine, a component of Lycium chinense, enhances muscular endurance of mice and myogenesis of myoblasts. Food Sci Nutr. 2021;9(9):5083–5091. doi:10.1002/fsn3.2466
 © 2022 The Author(s). This work is published and licensed by Dove Medical Press Limited. The full terms of this license are available at https://www.dovepress.com/terms.php and incorporate the Creative Commons Attribution - Non Commercial (unported, v3.0) License.
By accessing the work you hereby accept the Terms. Non-commercial uses of the work are permitted without any further permission from Dove Medical Press Limited, provided the work is properly attributed. For permission for commercial use of this work, please see paragraphs 4.2 and 5 of our Terms.
© 2022 The Author(s). This work is published and licensed by Dove Medical Press Limited. The full terms of this license are available at https://www.dovepress.com/terms.php and incorporate the Creative Commons Attribution - Non Commercial (unported, v3.0) License.
By accessing the work you hereby accept the Terms. Non-commercial uses of the work are permitted without any further permission from Dove Medical Press Limited, provided the work is properly attributed. For permission for commercial use of this work, please see paragraphs 4.2 and 5 of our Terms.