")
Back to Journals » OncoTargets and Therapy » Volume 14
An Apoptotic Gene Signature for the Prognosis of Hepatocellular Carcinoma
Authors Chen K, Zhu P , Liao Y, Yan L, Feng R , Zhai W
Received 23 November 2020
Accepted for publication 6 February 2021
Published 2 March 2021 Volume 2021:14 Pages 1589—1604
DOI https://doi.org/10.2147/OTT.S293610
Checked for plagiarism Yes
Review by Single anonymous peer review
Peer reviewer comments 2
Editor who approved publication: Dr Arseniy Yuzhalin
Kunlun Chen,1,* Pengfei Zhu,1,* Yuan Liao,1 Lei Yan,2 Ruo Feng,3 Wenlong Zhai1
1Department of Hepatobiliary and Pancreatic Surgery, The First Affiliated Hospital of Zhengzhou University, Zhengzhou, Henan, 450052, People’s Republic of China; 2Department of Emergency Surgery, Henan Oilfield General Hospital, Nanyang, Henan, 473000, People’s Republic of China; 3Department of Histology and Embryology, School of Basic Medical Sciences, Zhengzhou University, Zhengzhou, Henan, 450052, People’s Republic of China
*These authors contributed equally to this work
Correspondence: Wenlong Zhai; Ruo Feng
Department of Hepatobiliary and Pancreatic Surgery, The First Affiliated Hospital of Zhengzhou University, No. 1 Jianshe East Road, Erqi, Zhengzhou, Henan Province, 450052, People’s Republic of China
Email [email protected]; [email protected]
Background: Hepatocellular carcinoma (HCC) is a major public health burden worldwide owing to high incidence and poor prognosis. Although numerous apoptotic genes were disclosed in HCC, the prognostic value and clinical utility of the genes remained unclear.
Methods: The differentially expressed genes (DEGs) were identified in the microarray and RNA sequencing data from public databases. The apoptosis-related differentially expressed genes (AR-DEGs) were selected to construct a Lasso-penalized Cox regression model. The signature including five apoptotic genes was used to calculate risk score. Then, the receiver operating characteristic (ROC) and survival analysis were conducted based on the signature. A nomogram containing the signature and clinical characteristics was plotted to visualized the prognosis prediction. Finally, the enrichment analysis was performed in the Gene Ontology (GO) to investigate the potential mechanism.
Results: Patients with high risk scores were related to worse overall survival than those with low risk. The 3-year and 5-year area under curve (AUC) values of the signature were above 0.7 in databases. And the nomogram presented reliable net benefits for the survival prediction. The nomogram was also tested by probability calibration curves and Decision Curve Analysis (DCA). Furthermore, the five differentially expressed genes were verified again in the HCC clinical specimens with real-time PCR and Western Blot.
Conclusion: Collectively, the present study formed a novel signature based on five apoptotic genes, and this possibly predicted prognosis and strengthened the communication with HCC patients about the likely treatment.
Keywords: hepatocellular carcinoma, apoptosis, signature, prognosis, nomogram
Introduction
Liver cancer is the sixth most frequently diagnosed malignant tumor and the fourth leading cause of cancer-related deaths worldwide, with about 841,000 new cases and 782,000 deaths per annum.1 Hepatocellular carcinoma (HCC) accounts for about 90% of cases of primary liver cancer; the remaining pathologic types are cholangiocarcinoma and mixed hepatocellular-cholangiocarcinoma.2 Surgical resection of the tumor completely and safely is the most effective treatment method for HCC, however, most patients are diagnosed at an advanced stage and become unresectable.3 And thus, the 5-year survival rate for HCC patients was reported to be less than 12%.4 Although drugs such as sorafenib and immune checkpoint inhibitors could improve patients’ prognoses, the effect is still unsatisfactory.5 Therefore, more sensitive biomarkers are earnestly required for the diagnosis and prognosis of HCC patients.
The initial events of HCC include uncontrolled proliferation and reduction in cell death.6 Apoptosis, also known as programmed cell death type I, is precisely regulated by numerous checkpoints to maintain equilibrium.7 Suppression of apoptosis was reported to cause cancers, autoimmune diseases, propagation of intracellular pathogens, and neurodegenerative diseases.8 An elevated level of apoptosis could be observed in acute liver injury, but apoptosis generally occurs to a lesser extent in non-alcoholic fatty liver disease and liver cancer.9–11 An early study demonstrated that overexpression of SMAD3 down-regulated Bcl-2 and sensitized hepatocytes to apoptosis through the TGF-β pathway in HCC.12 Remarkably, a decrease in apoptosis is not only responsible for HCC progression but also for tumor resistance to therapies.13 And the apoptosis-inducing therapy showed a potential treatment value for HCC, such as the TRAIL-mediated therapy and inhibition of the negative endogenous apoptosis regulators.14–16
In our present study, the apoptosis-related differentially expressed genes (AR-DEGs) were defined as the intersection of the DEGs and GSEA. A Lasso-COX regression model was then conducted with the AR-DEGs and survival data. When the partial likelihood deviance reached its minimum in the model, five genes (ie, SOX4, UNG, NRP1, IL2RB, and IVNS1ABP) were selected to calculate the risk score. Patients were divided into the high-risk group and low-risk group based on the median risk score. Also, univariate and multivariate COX regression models were conducted using risk scores and clinical characteristics. ROC curve, Calibration curve, and DCA certified the prognostic significance of models. Moreover, the signature including 5 genes was verified with 76 HCC patients in our center. Finally, protein-protein interaction (PPI) and Gene Ontology (GO) enrichment analysis were performed to investigate the potential mechanism. Briefly, we identified a novel apoptotic gene signature and it might serve as a tool for survival prediction, treatment adjustment, and even clinical classification.
Materials and Methods
Data Collection and Process
The GSE14520 dataset was obtained from the Gene Expression Omnibus (GEO) database and used as a training set. The training set consisted of 218 HCC and 221 adjacent normal tissues. All the microarray raw data in the training set were normalized and transformed with log2(x+1). The mRNA sequencing data of 364 patients with HCC and 50 normal samples were accessed from the UCSC Xena (https://tcga.xenahubs.net) and selected as a validation set. Meanwhile, the 1982 apoptotic genes list in “GO_APOPTOTIC_PROCESS” was downloaded from GSEA. Hepatocellular Carcinoma Expression Atlas Database (HCCDB) contained over 4000 clinical samples.17 Normalized microarray and sequencing data of GSE10143 (HCCDB7), GSE76427 (HCCDB17) and ICGC_LIRI_JP (HCCDB18) were downloaded to increase the validity of data.
Clinical Specimens
Total 76 HCC tissues were collected from the Department of Hepatobiliary and Pancreatic Surgery in The First Affiliated Hospital of Zhengzhou University, including 7 tumor tissues and paired adjacent normal tissues. The 76 HCC patients with follow-up information were defined as the test set. The clinical specimens were immediately stored in the liquid nitrogen for further qRT-PCR and Western blotting assays.
Identification of AR-DEGs
Based on the “Limma” R package, DEGs were obtained from the training and validation sets.18 And the cutoff values were set as follows: the adjusted P-value < 0.05 and |log2 fold change (FC)| > 1.5. Then, genes were defined as apoptosis-related differentially expressed genes (AR-DEGs) with the “Venn Diagram” R package and enrolled in the subsequent analysis, if they were the intersection of DEGs and apoptosis-related genes.
Construction of the Apoptotic Signature and Risk Score Calculation
A Lasso-penalized Cox regression model was applied in Rstudio software with AR-DEGs to shrink and choose variables further.19 The “glmnet” R package20 helped determine the optimal penalty parameter λ and partial likelihood deviance. And finally, a five-apoptotic-gene signature was conducted and the risk score was calculated. The calculation formula was as follows:
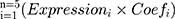
The Expressioni was the expression data of the five genes and Coefi represented the corresponding coefficient.
Evaluation of the Prognostic Value of the Apoptotic Gene Signature
The training set was equally divided into the high-risk group (n=109) and low-risk group (n=109) based on the median risk score. And the survival analysis between the high and low-risk groups was performed with the Log rank test. The receiver operating characteristic (ROC) curves were plotted to obtain the area under the curve (AUC) for 3-year and 5-year overall survival with “pROC” R package. Also, the validation set was divided into the high-risk group (n=182) and low-risk group (n=182), and then survival and ROC analyses were repeated for accuracy.
Assessment of the Apoptotic Signature in Subgroup Analysis
To identify the prognostic value of the signature in different populations, subgroup analysis was performed in the training set. The clinical characteristics were stratified into the following groups: male versus female, age younger than 50 years versus 50 years and older, AFP less than 300 ng/mL (low) versus higher than 300 ng/mL (high), ALT less than 50U/L (low) versus higher than 50U/L (high), early BCLC_stage (0+A) versus advanced BCLC_stage (B+C), main tumor size less than 5 cm versus main tumor size bigger than 5 cm, multinodular negative versus multinodular positive, cirrhosis negative versus cirrhosis positive, and early TNM_stage (I+II) versus advanced TNM_stage (ш+IV). Then, survival curves were drawn to compare the median survival time between the high-risk and low-risk subgroups.
Construction and Calibration of Nomogram
To determine the appropriate variables for nomogram, univariate and multivariate Cox regression analyses were conducted in the training and validation sets separately. Nomograms were widely used for cancer prognosis because of their ability to reduce complicated models into a single numerical estimate of the probability. Thus, the independent prognostic variables were included in the nomogram by the “rms” and “ggplot2” R packages.21 Then, calibration of the nomogram was assessed visually using 3-year and 5-year calibration plots. The 3-year and 5-year decision curves analysis (DCA) were used to evaluate the net benefits of risk score and traditional indicators.22 The x-axis in DCA was threshold probability, while the y-axis was net benefits.
Quantitative Real-Time PCR (qRT-PCR)
Trizol RNA isolation reagent (Invitrogen, Carlsbad, CA, USA) was used to isolate the total RNA. The samples were reverse transcribed into cDNA with cDNA Synthesis kit (Takara, Shiga, Japan). Then, the qRT-PCR was conducted to detected the gene expressions with SYBR Premix Ex Taq (Takara) and β-actin was chosen as internal reference. And the primers were shown as follows: β-actin, Forward (F): 5ʹ- GGAGCGAGATCCCTCCAAAAT-3ʹ, Reverse (R): 5ʹ-GGCTGTTGTCATACTTCTCATGG-3ʹ; SOX4, Forward (F): 5ʹ- AGCGACAAGATCCCTTTCATTC-3ʹ, Reverse (R): 5ʹ- CGTTGCCGGACTTCACCTT-3ʹ; NRP1, Forward (F): 5ʹ- GGCGCTTTTCGCAACGATAAA-3ʹ, Reverse (R): 5ʹ- TCGCATTTTTCACTTGGGTGAT-3ʹ; UNG, Forward (F): 5ʹ- CCCCACACCAAGTCTTCACC-3ʹ, Reverse (R): 5ʹ- TTGAACACTAAAGCAGAGCCC-3ʹ; IVNS1ABP, Forward (F): 5ʹ- GATGTTCGACTTCAGGTCTGTG-3ʹ, Reverse (R): 5ʹ- CGTGAGAAATTCCATGAGGATCA-3ʹ; IL2RB, Forward (F): 5ʹ- CTGCTTCACCAACCAGGGTTA-3ʹ, Reverse (R): 5ʹ- GGGGTCGTAAGTAAAGTACACCT-3ʹ.
Western Blotting
The samples were lysed in RIPA lysis buffer with protease inhibitor cocktail (Beyotime Biotechnology, Beijing, China) for 30 min on ice. The proteins were separated by SDS-PAGE and then transferred onto 0.45 μm NC membranes (Millipore) at 300 mA for 2 h. The membranes were blocked with 5% non-fat milk and then incubated with primary antibodies. Antibodies used were: GAPDH (60004-1-Ig, Proteintech), SOX4 (ab236557, Abcam), NRP1 (PA1-29513, Invitrogen™), UNG (PA5-20265, Invitrogen™), IVNS1ABP (ab127566, Abcam), and IL2RB (ab61195, Abcam). The membranes were then incubated with appropriate HRP-conjugated secondary anti-rabbit IgG antibodies for 1 h at room temperature after washed four times with TBST. The results were visualized by the ChemiDoc Imaging System (Bio-Rad, American).
Extra Validation of the Apoptotic Signature in HCCDB and Test Set
The signature was checked against the datasets containing follow-up information in the HCCDB (ICGC_LIRI_JP, GSE10143, and GSE76427). Based on the results of qRT-PCR, the risk score in the test set was calculated and the survival probabilities were computed by the Kaplan–Meier method. Furthermore, the genetic alterations and protein levels of the five apoptotic genes were investigated in the cBioPortal for Cancer Genomics and the Human Protein Atlas respectively.23,24
Protein-Protein Interaction, GO and KEGG Analysis
To uncover underlying mechanisms in the apoptotic gene signature, protein-protein interaction (PPI) prediction was performed and the analytical conditions were as follows: high confidence (interaction score>0.400) and no more than 20 interactors per shell.25 Then, the results of PPI were applied in Gene Ontology (GO) and Kyoto Encyclopedia of Genes and Genomes (KEGG).26 The outcome was visualized by Cytoscape (Version 3.72) and Rstudio (Version 1.2.5033).
Statistical Analysis
All the statistical analyses were processed with R software and SPSS (IBM, SPSS, version 22), and P-value < 0.05 was considered statistically significant unless otherwise specified. The least absolute shrinkage and selection operator (LASSO) regression was used to construct the apoptotic signature. The Log rank test was applied to analyze overall survival. Univariate and multivariate Cox proportional hazard models were constructed to obtain the hazard ratios and to select independent prognostic variables. The AUC value of greater than 0.70 was considered acceptable The nomogram was conducted with a multivariate Cox proportional hazard model and then visualized. When evaluating the nomogram, we have utilized the calibration curve and the DCA curve to justified the validity of the model.
Results
Identification of DEGs and Establishment of the Apoptotic Signature
According to the criterion, there were 415 DEGs in the training set and 666 DEGs in the validation set (Supplementary Figure 1A and B). The apoptosis-related differentially expressed genes (AR-DEGs) were defined as the intersection of DEGs and apoptotic genes (Figure 1A, Supplementary Table 1). The 36 AR-DEGs were considered as the key genes that played crucial roles in both HCC and apoptosis. Then, AR-DEGs, survival status, and survival time were used to construct Lasso-penalized Cox regression model (Figure 1B). When the partial likelihood deviance in model reached its minimum, the optimal model consisted of five genes, namely SOX4, UNG, NRP1, IL2RB and IVNS1ABP (Figure 1C). Based on the apoptotic signature, the risk score was calculated as follows: risk score=0.364×SOX4+ 0.2101×IVNS1ABP+0.0890×NRP1+0.1165×UNG+(−0.1386×IL2RB). The detailed description and coefficient of the five genes could be found in Supplementary Table 2. Also, unpaired Students t-test suggested that SOX4, UNG, NRP1 and IVNS1ABP were up-regulated and IL2RB was down-regulated in training and validation sets (Figure 1D and E).
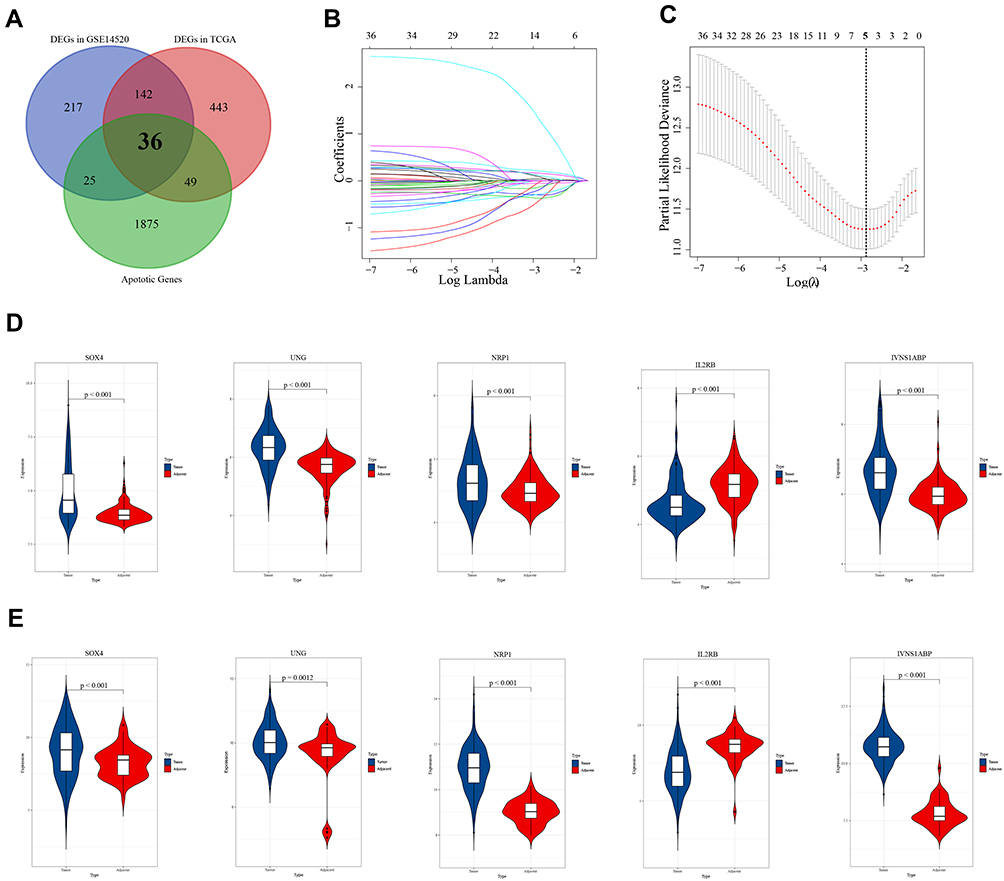 |
Figure 1 Construction and validation of the apoptotic signature. (A) Venn diagram of the apoptotic genes and differentially expressed genes (DEGs) in GSE14520 and TCGA_LIHC. Black bold fonts indicate the apoptosis-related differentially expressed genes (AR-DEGs). (B) Lasso-penalized Cox regression model to shrink and choose variables. (C) Five genes are selected from 36 AR-DEGs in the model when the partial likelihood deviance reached its minimum. The bold dash-dotted line represents the optimal parameter. (D) The mRNA expression levels of SOX4, UNG, NRP1, IL2RB and IVNS1ABP in the training set. (E) The mRNA expression levels of SOX4, UNG, NRP1, IL2RB and IVNS1ABP in the validation set. |
The Apoptotic Signature Predicted Survival in HCC
Patients were divided into two groups based on median risk score.
In the training set, HCC patients with high risk scores had shorter median survival time than those with low risk scores (Figure 2A, p<0.0001). And the 3-year AUC and 5-year AUC values were 0.805 and 0.836 respectively, both of which were above 0.7 (Figure 2B). As for the validation set, the low risk score group also tend to survive than the high risk score group (Figure 2C, p=0.0016). The time-dependent ROC revealed the prognostic accuracy of the signature was 0.751 at 3 years, and 0.821 at 5 years (Figure 2D). Moreover, the prognostic value of signature was checked in HCCDB again. The patients with high risk scores had poor prognosis in GSE10143, GSE76427 and ICGC_LIRI_JP (Supplementary Figure 2A–C, p=0.003, 0.00071 and 0.014, respectively). Taken together, the results demonstrated the prognostic value of the apoptotic gene signature in multiple sets.
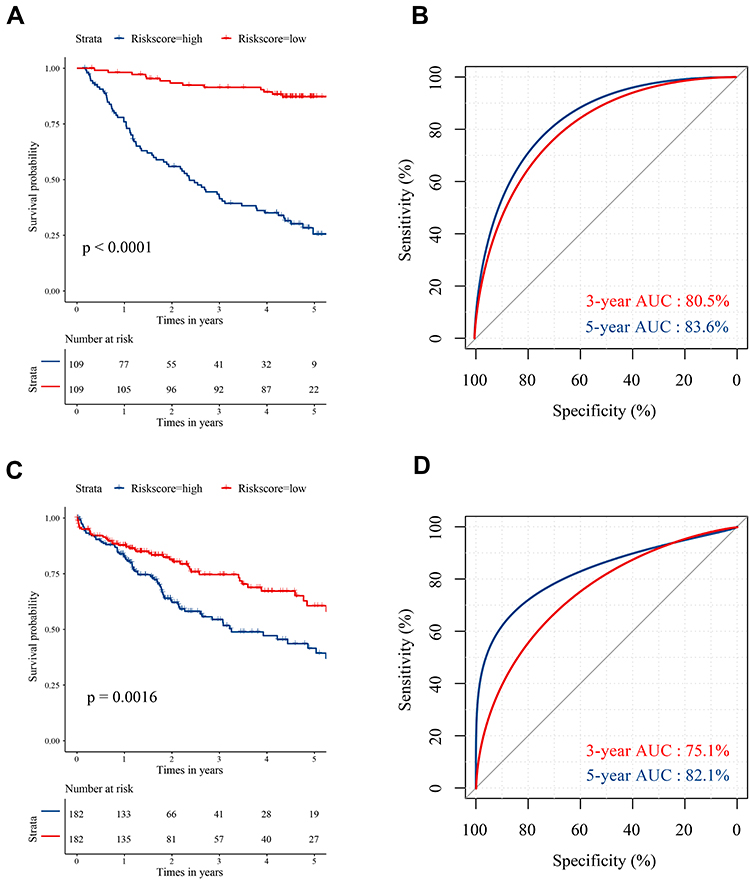 |
Figure 2 The survival analysis and time-dependent ROC curves based on the signature-derived risk score. (A) Kaplan–Meier plot reveals that patients at high risk have a worse prognosis in training set. (B) The 3-year and 5-year ROC curves of the risk score in training set. (C) Kaplan–Meier plot reveals that patients at high risk have a worse prognosis in validation set. (D) The 3-year and 5-year ROC curves of the risk score in validation set. |
Survival Analyses in Subgroup Using the Signature
The purpose of subgroup survival analysis was to detect whether the apoptotic signature could benefit specific populations. Based on the risk score, patients were stratified according to gender, age, tumor size, cirrhosis, multinodular, AFP, ALT, TNM_stage, and BCLC_stage. The prognostic value of the signature was identified in all the subgroup analyses (all p<0.01, Figure 3A–D, Supplementary Figure 3), except for female groups (Supplementary Figure 3D).
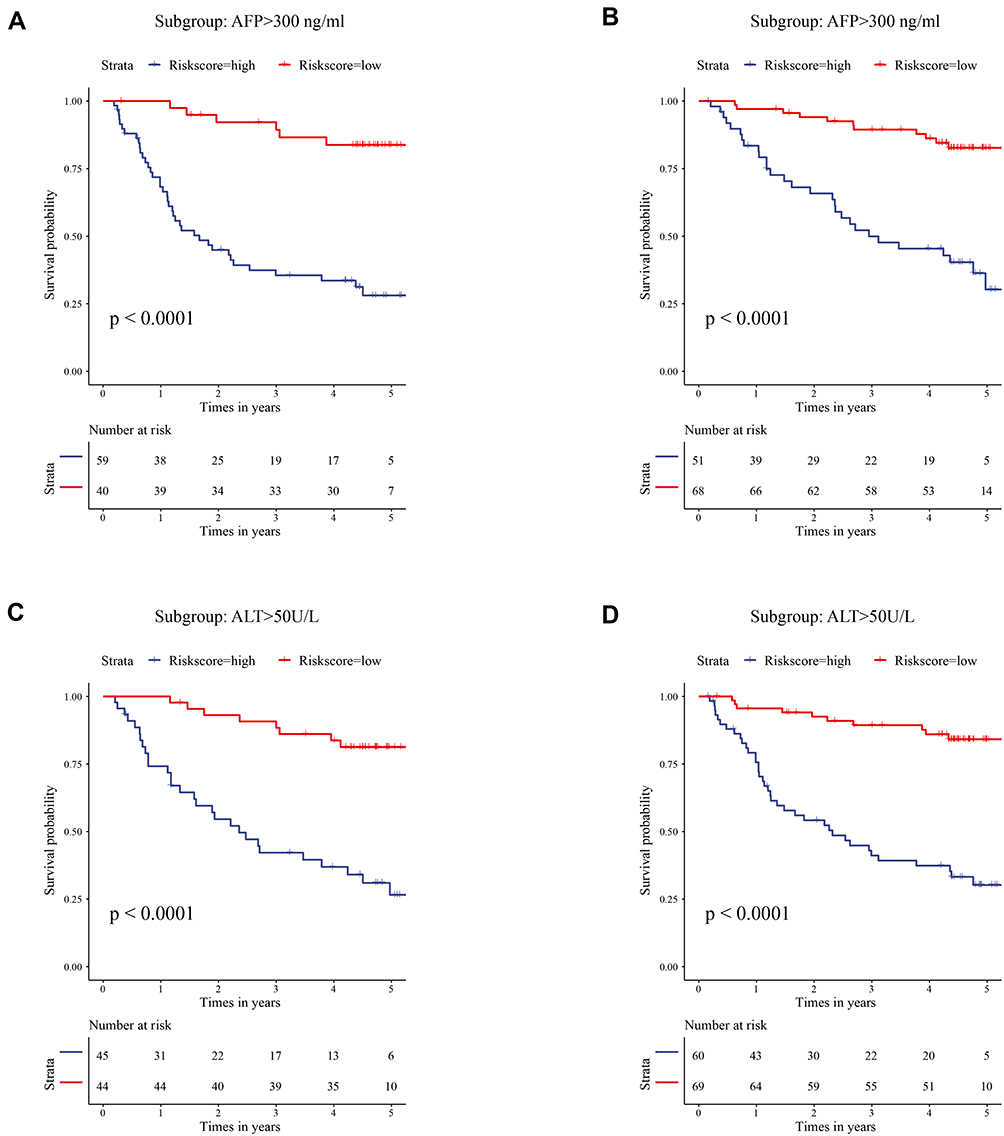 |
Figure 3 Subgroup survival analysis in specific populations. (A) Survival analysis in patients with high AFP level using risk score. (B) Survival analysis in patients with low AFP level using risk score. (C) Survival analysis in patients with high ALT level using risk score. (D) Survival analysis in patients with low ALT level using risk score. Abbreviations: AFP, alpha-fetoprotein; ALT, alanine aminotransferase. |
Construction and Validation of the Nomogram
In the training set, univariate Cox regression analysis revealed that tumor size, cirrhosis, pathological TNM_stage, BCLC_stage, AFP, and signature-derived risk score were the prognostic factor for survival (Table 1). The six significant variables were then included in multivariate Cox regression analysis but only BCLC_stage, cirrhosis, and risk score were still independent prognostic factors (Table 1). And the nomogram was constructed based on BCLC_stage, cirrhosis, and risk score (Figure 4A). When patients met specific conditions, they received corresponding points in the nomogram. The higher total points got, the worse outcome was. Compared with the BCLC_stage or cirrhosis, risk score showed higher net benefit at 3 years and 5 years whatever the threshold probability was (Figure 4B and C). Moreover, calibration curves containing three internal validation groups (70 samples per group) demonstrated that the nomogram performed well. The 45° dotted lines represented an ideal model and the nomogram almost approached the best prediction (Figure 4D and E).
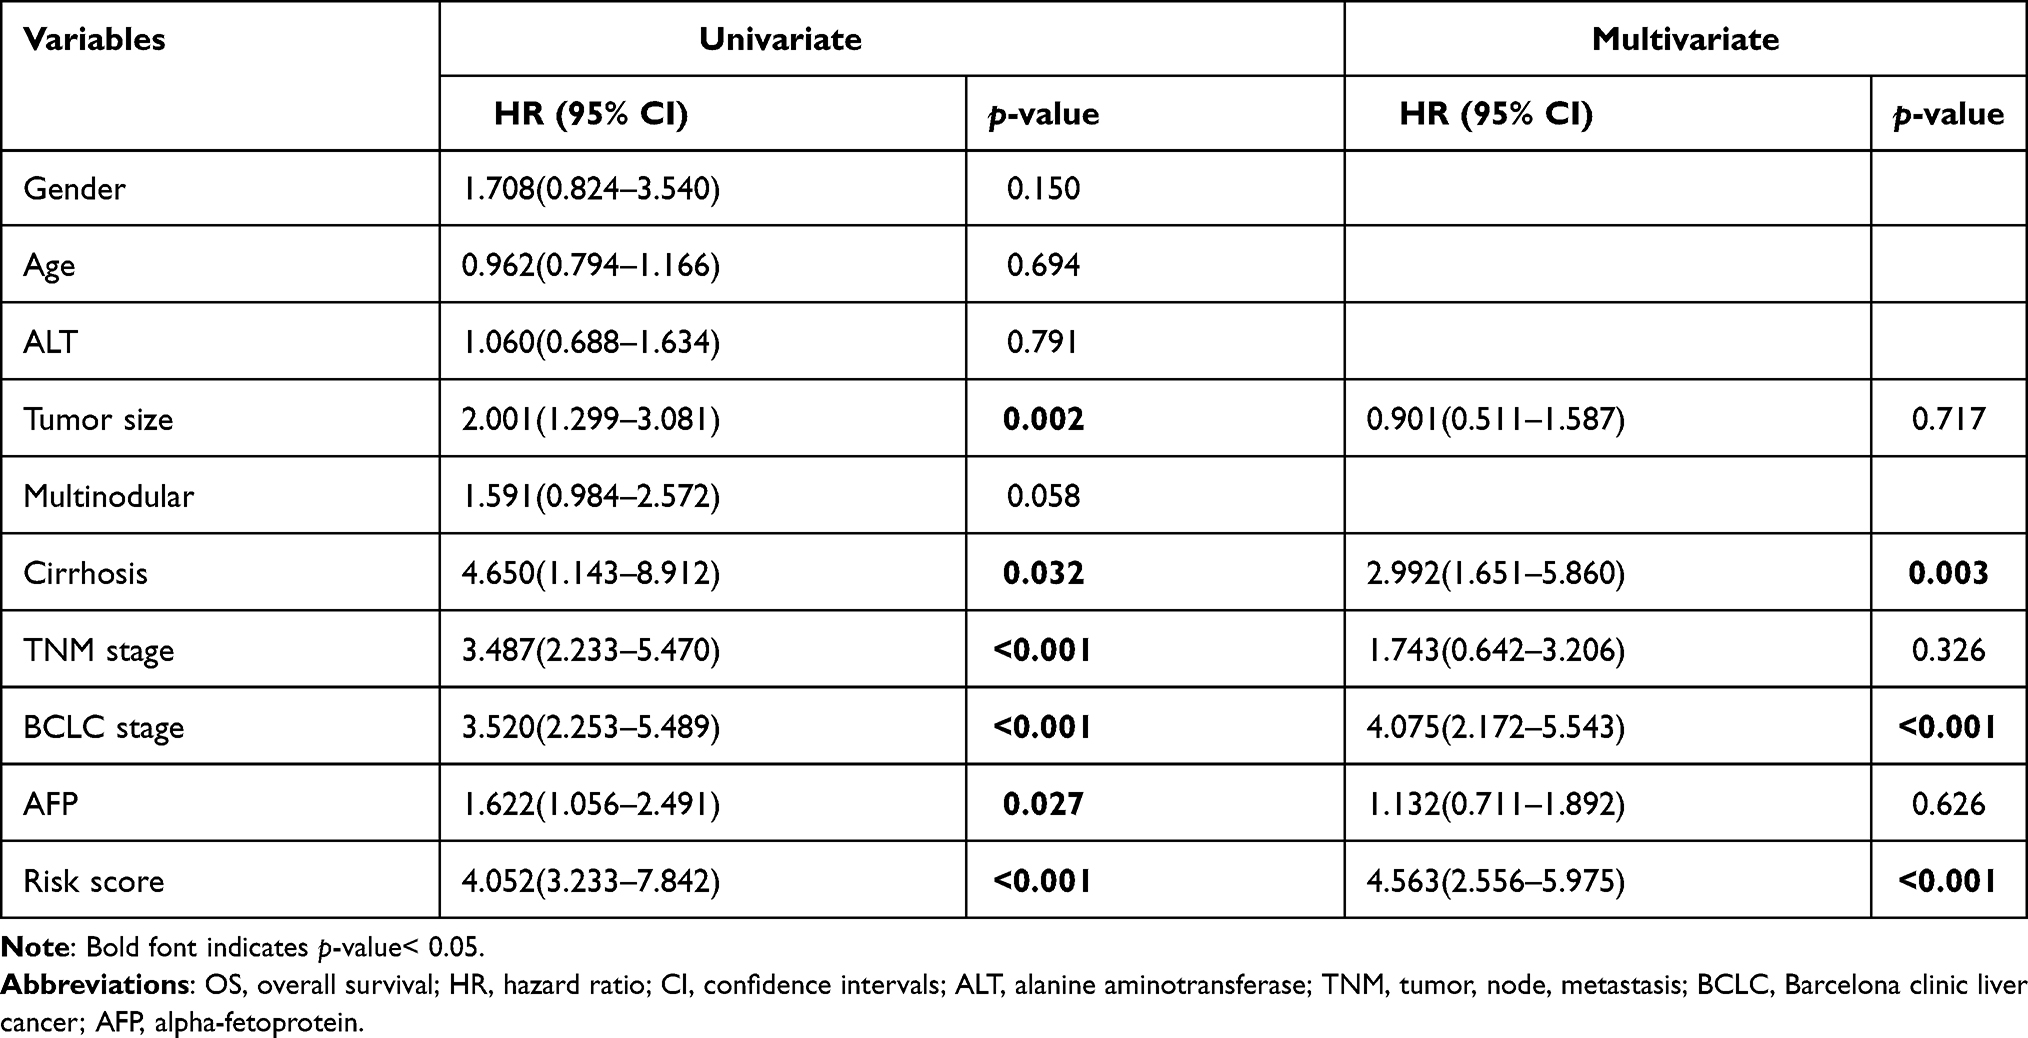 |
Table 1 Univariate and Multivariate Cox Regression Analyses of OS in GSE14520 |
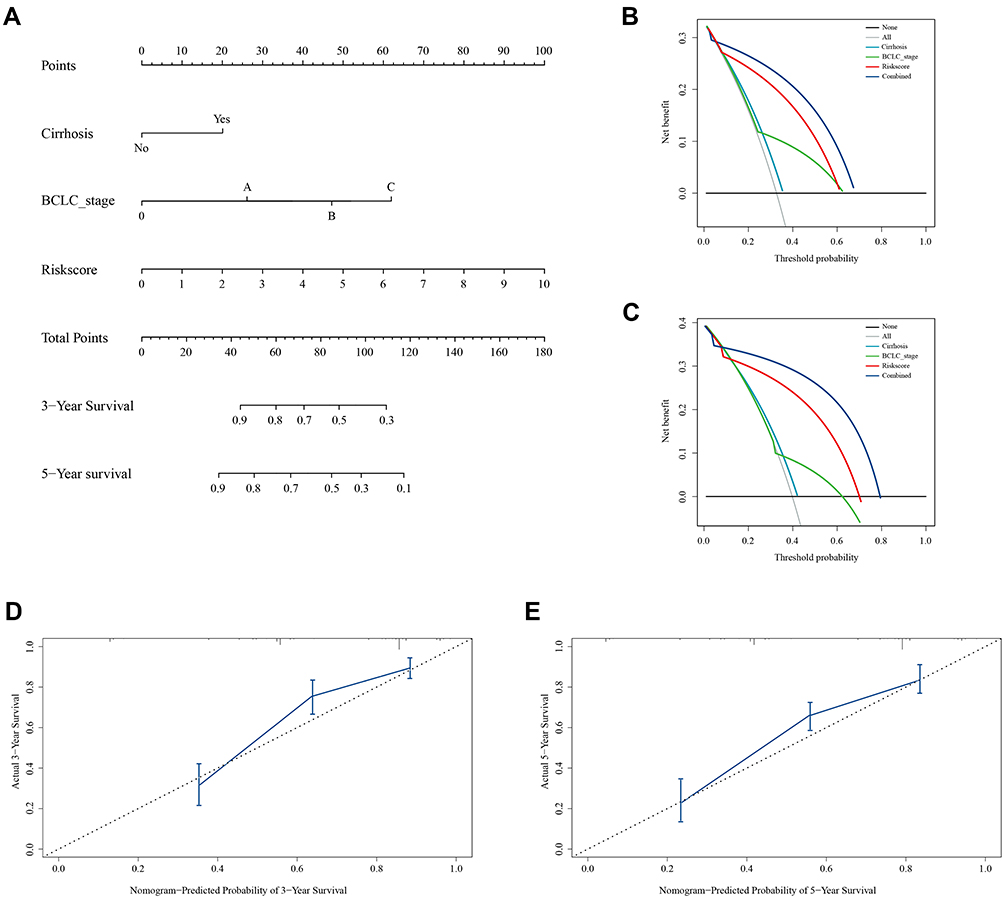 |
Figure 4 Nomogram, calibration curve and decision curve analyses (DCA) in the training cohort. (A) Construction of nomogram to predict overall survival at 3 years and 5 years. (B and C) DCA curves suggest that risk score has higher net benefit than cirrhosis status and BCLC_stage at 3 years and 5 years. (D and E) Calibration curves containing three internal validation groups demonstrate that the nomogram performs well. The 45° dotted lines represent an ideal model and the nomogram almost approaches the best prediction. |
Similarly, after the univariate and multivariate Cox regression analyses (Table 2), pathological N_stage, M_stage, and risk score were selected to build nomogram in validation set (Figure 5A). DCA curves at 3 years and 5 years also proved the theoretical accuracy and clinical utility of the apoptotic signature (Figure 5B and C). And we also generated three internal validation groups (120 samples per group) randomly to testify the deviations from the ideal model (Figure 5D and E).
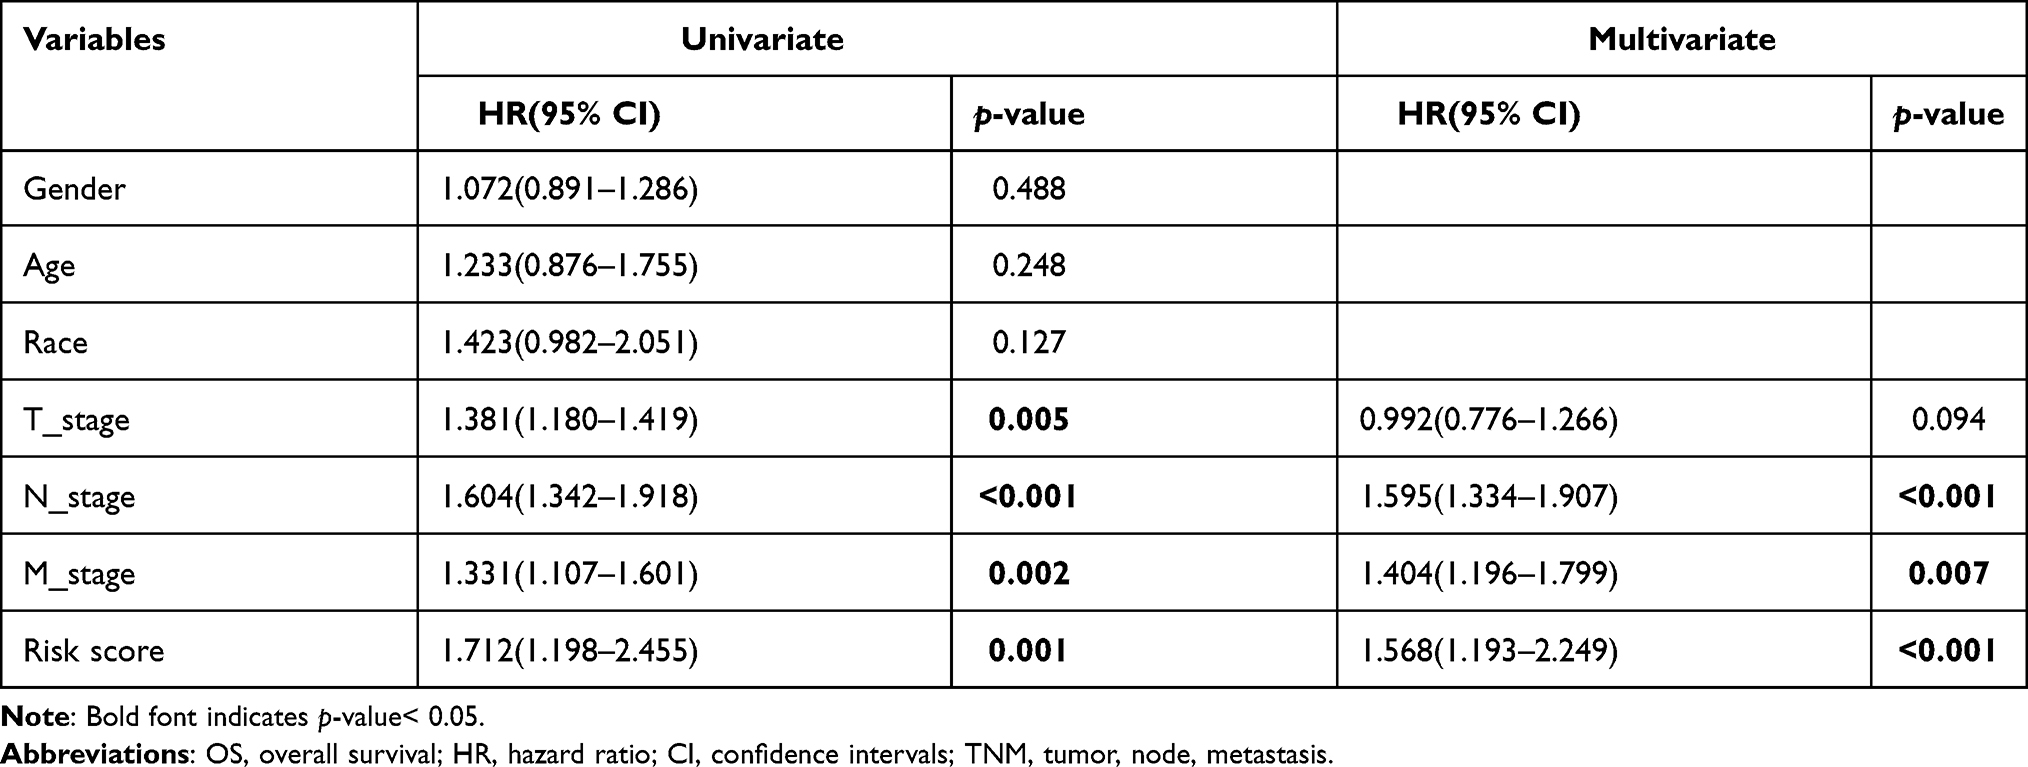 |
Table 2 Univariate and Multivariate Cox Regression Analyses of OS in TCGA |
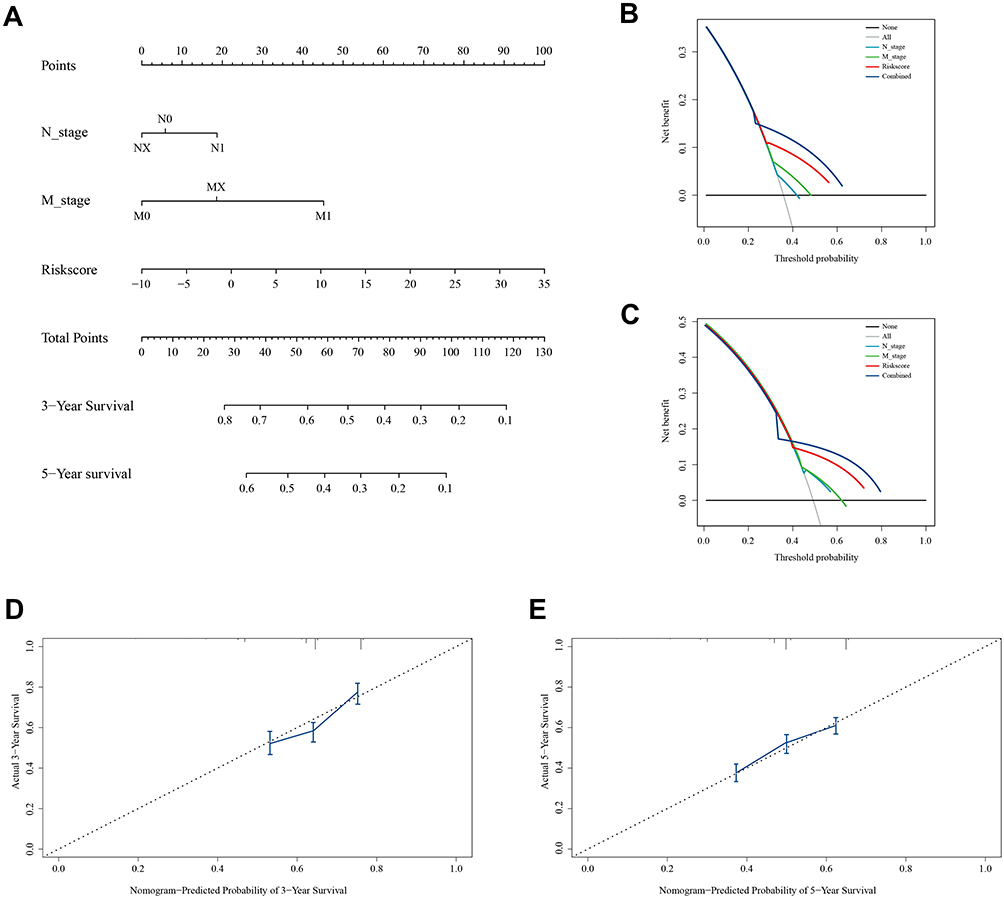 |
Figure 5 Nomogram, calibration and DCA curves in the validation cohort. (A) Construction of nomogram to predict overall survival in the validation cohort. (B and C) DCA curves suggest that risk score has a higher net benefit than pathological N_stage and M_stage for survival prediction. (D and E) Calibration curves reveal that the nomogram approaches the ideal model. |
Potential Mechanisms of the Apoptotic Signature
Protein-protein interaction prediction was performed using the STRING public database and the cut-off of the combined score was set at 0.4 (high). There were 42 nodes and 269 interactions in the interactome of SOX4, UNG, NRP1, IL2RB and IVNS1ABP (Supplementary Figure 4). The interacting proteins were then analyzed in Gene Ontology (GO) and KEGG databases. The GO provided structured and computable annotation regarding known genes. The potential interaction proteins were annotated in three aspects: cellular component (CC), molecular function (MF), and biological process (BP). The enrichment results suggested that the apoptotic signature mainly mapped to the chromosome and took part in growth factor, death receptor, tumor necrosis factor receptor binding, and so on (Figure 6A). KEGG was originally designed as an integrated database for the biological interpretation of completely sequenced genes. The KEGG enrichment revealed that the signature might play crucial roles in “PI3K−Akt signaling pathway”, “Apoptosis”, “Cell cycle”, “MAPK signaling pathway”, “TNF signaling pathway” and “Ras signaling pathway” (Figure 6B). These results suggested that the signature might participate in apoptosis and related pathways indirectly or directly.
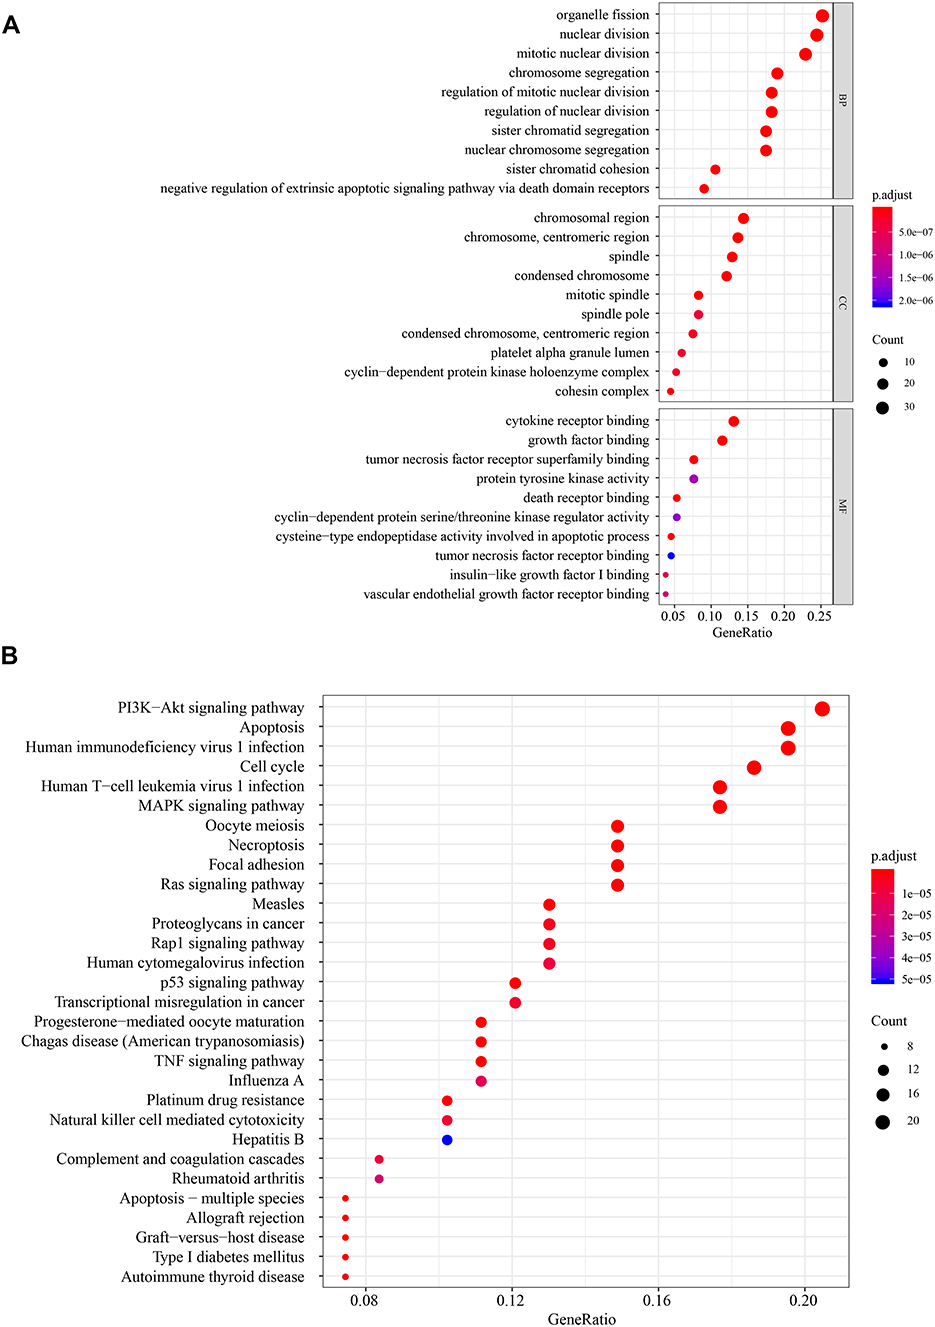 |
Figure 6 GO and KEGG analysis. (A) Molecular function, biological process, cellular component enrichment analysis. (B) KEGG enrichment analysis. |
Extra Validation of the Apoptotic Signature in the Test Set
In the test set, the mRNA expressions of SOX4, UNG, NRP1, IL2RB and IVNS1ABP were validated using qRT-PCR, and the protein expressions level with Western blotting (Figure 7A and B). And the expressions of SOX4, UNG, NRP1 and IVNS1ABP were significantly up-regulated in tumor tissues, while the IL2RB was down-regulated (Figure 7C). The Log rank test suggested that the low risk group also showed a better prognosis in the test set (Figure 7D, p=0.002). Briefly, the signature-derived risk score had a robust and reliable value for prognostic prediction in the training, validation, test and HCCDB sets. In the Human Protein Atlas (HPA), the protein expressions of IVNS1ABP, NRP1, SOX4, and UNG were significantly increased using immunohistochemistry (Supplementary Figure 5A). Unfortunately, the IL2RB was not recorded in HPA. Meanwhile, IVNS1ABP possessed the most frequent genetic alterations (8%), followed by SOX4 (2.4%), NRP1 (2.2%), IL2RB (1.9%) and UNG (0.5%). The most frequent alteration type was amplification and missense (Supplementary Figure 5B).
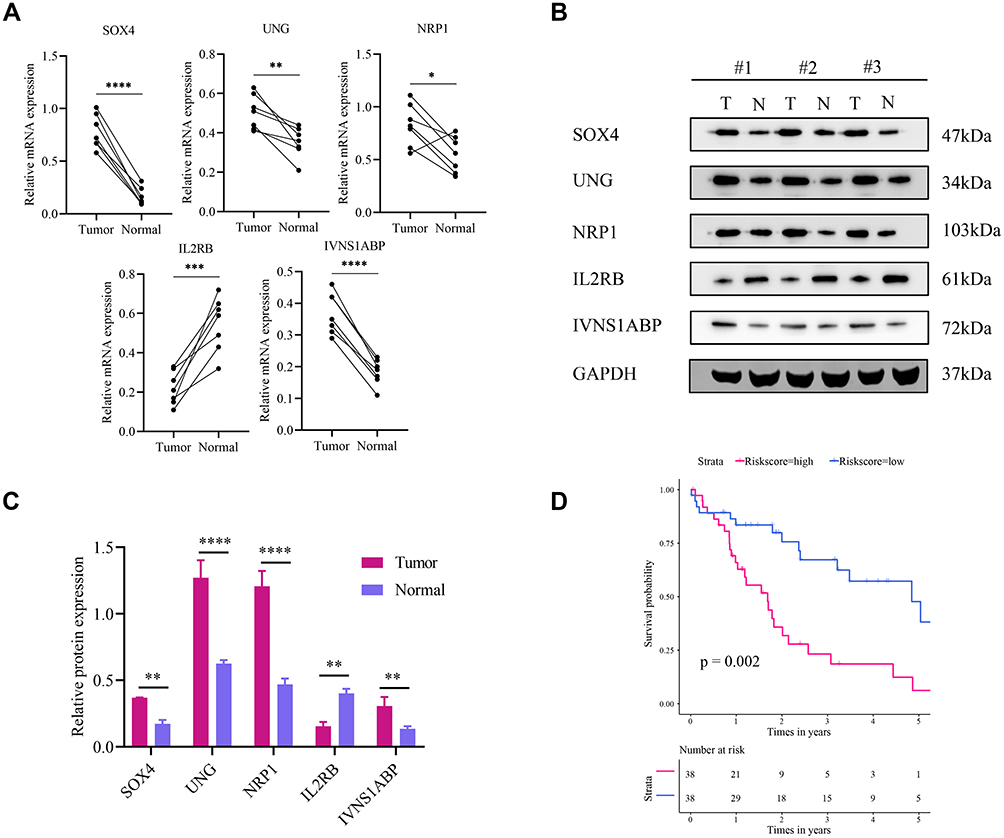 |
Figure 7 Extra validation in the test set. (A) Relative mRNA expression of SOX4, UNG, NRP1, IL2RB and IVNS1ABP in 7 HCC and paired normal tissues. (B) Representative Western blot images of the five proteins. (C) The Western blot results are normalized to GAPDH. (D) Survival analysis in the test set. *P<0.05; **P<0.01; ***P<0.001; ****P<0.0001. |
Discussion
According to the annual projections of the World Health Organization, over 1 million people will die from liver cancer in 2030.4 HCC is the second most lethal tumor after pancreatic cancer, with a 5-year survival rate less than 12%.27 Although the molecular mechanisms of HCC remain unclear, apoptosis plays a key role in tumorigenesis and cellular immortality.28 With the development of high-throughput sequencing, numerous biomarkers were reported,29 but only few studies highlighted the predictive value of multiple gene signatures, especially the apoptotic signature in HCC.
In our present study, AR-DEGs were identified and used to construct Lasso-penalized Cox regression model. The Lasso-COX model avoided the possible collinearity impact and selected five genes (SOX4, UNG, NRP1, IL2RB and IVNS1ABP) to build the apoptotic signature. In training and validation sets, the signature-derived risk score showed robust prognostic values and patients at low risk had longer median survival time than those at high risk (Figure 2). All the AUC values at 3 years and 5 years were over 0.7 in training and validation sets (0.805, 0.836; 0.751, 0.821, respectively), which suggested that the signature shown quite high prognostic accuracy. The signature was also effective in subgroup analyses (age, TNM_stage, BCLC_stage, etc.) and this would benefit specific populations. It is noteworthy that the signature does not perform well in the female population. And one possible reason may be the deficiency of samples to detect the statistical difference.
Our previous study already identified four genes for the prediction of HCC patient survival.30 However, the novel and effective nomogram was plotted and the signature was testified in a larger sample size (a total of 6 datasets) in the present study. The nomogram provides a potential method for surgeons to improve communication with patients. The numerical and visualized survival rate means a more intuitive interpretation of HCC prognosis. The patients who obtain high scores in the nomogram could receive more aggressive treatment approaches. With a nomogram, the outcome and treatment for each patient would be tailored regarding the personal score. In the training and validation sets, the nomogram was plotted respectively using risk score and traditional clinical characteristics (Figures 4A and 5A). And the complicated statistical predictive models were reduced into user-friendly graphical interfaces. The DCA curves at 3 years and 5 years revealed that the risk score had higher net benefit than traditional clinical characteristics at a certain threshold probability. The internal validation also suggested that the nomogram was very near to an ideal model for prognosis prediction (Figure 4D and E; Figure 5D and E). Therefore, the apoptotic signature might have clinical application in the prognosis evaluation when it was applied in nomogram.
In the subsequent research, GO and KEGG enrichment analyses were performed using the five apoptotic genes and their potential interactomes. The results suggested that the genes were enriched in several biological processes and pathways, including cell cycle, apoptosis, Hepatitis B, PI3K−Akt, MAPK, TNF and Ras signaling pathway. Previous studies demonstrated the above processes and pathways were involved in liver cancer.31–34 Also, the five apoptotic genes were reported to be correlated with HBV infection or liver cancer. Over-expression of SOX4 might promote HCC intrahepatic metastasis by targeting semaphorin 3C.35 And the upregulation of Neuropilin-1 (NRP-1) was related to the boost of arterial blood supply in primary carcinoma and it converted the hepatic vasculature to the arterial phenotype.36 The previous study demonstrated that the decrease of IL2RB might lead to the escape from immune surveillance in HCC.37 To increase the validity of data, the mRNA and protein expressions of the five genes were detected with traditional experimental methods. The results of qRT-PCR and Western blot analyses demonstrated that SOX4, UNG, NRP1 and IVNS1ABP were up-regulated in tumor tissues, while IL2RB was down-regulated (Figure 7A and B). The experimental verification of the five apoptotic genes was consistent with previous bioinformatic analyses.
However, there are still some weaknesses that deserve comment. First, given the complicated processes of HCC, some crucial apoptotic genes might be omitted and thus reduces the reliability of the signature. Then, the apoptotic signature needs to be verified in more independent validation sets with data integrity. This process might address the lack of samples in the subgroup (female, non-cirrhosis). Moreover, the basic experimental studies about the signature were warranted to investigate the elusive mechanisms of HCC.
Briefly, a novel signature was identified for the prognosis prediction of HCC patients (Figure 8). This five-gene signature might reflect the deregulation of apoptosis and provide prognostic biomarkers in HCC. Further basic research and clinical trials would be conducted to confirm our findings.
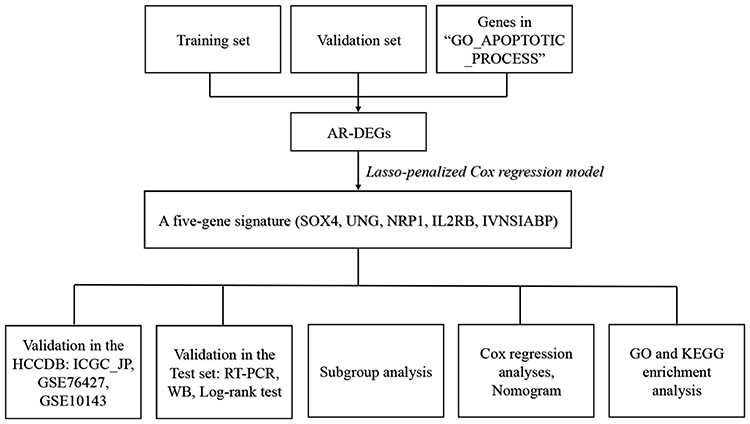 |
Figure 8 Flow chart for the experimental design. |
Abbreviations
HCC, hepatocellular carcinoma; TCGA, The Cancer Genome Atlas; GEO, Gene Expression Omnibus; DEGs, differentially expressed genes; KM, Kaplan–Meier; LASSO, Least Absolute Shrinkage and Selection Operator; OS, overall survival; FC, fold change; HR, hazard ratio; CI, confidence interval; ROC, receiver operating characteristic; GSEA, gene set enrichment analysis; GO, gene ontology; KEGG, Kyoto Encyclopedia of Genes and Genomes; DCA, Decision Curve Analysis; BCLC, Barcelona clinic liver cancer.
Data Sharing Statement
The datasets generated and analyzed during the current study are available from the corresponding author on a reasonable request.
Ethics Approval and Consent to Participate
The research protocol was approved by the Zhengzhou University First Affiliated Hospital Ethics Committee (Zhengzhou, China, 2018-KY-83). The experiment was conducted in accordance with the Declaration of Helsinki and the written informed consent was obtained from patients.
Acknowledgment
Peng-fei Zhu wants to give special thanks to Xuan Wang, M.D., for her passionate love and moral support. Besides, the authors are grateful for the selfless help from other members of the Department of Hepatobiliary and Pancreatic Surgery.
Author Contributions
Wenlong Zhai and Ruo Feng are corresponding authors and contributed equally to this work.
All authors made a significant contribution to the work reported, whether that is in the conception, study design, execution, acquisition of data, analysis and interpretation, or in all these areas; took part in drafting, revising or critically reviewing the article; gave final approval of the version to be published; have agreed on the journal to which the article has been submitted; and agree to be accountable for all aspects of the work.
Funding
The project was supported by the National Natural Science Foundation of China (No. 81702863).
Disclosure
The authors declare that they have no competing interests.
References
1. Bray F, Ferlay J, Soerjomataram I, Siegel RL, Torre LA, Jemal A. Global cancer statistics 2018: GLOBOCAN estimates of incidence and mortality worldwide for 36 cancers in 185 countries. CA Cancer J Clin. 2018;68(6):394–424. doi:10.3322/caac.21492
2. Chen W, Zheng R, Baade PD, et al. Cancer statistics in China, 2015. CA Cancer J Clin. 2016;66(2):115–132. doi:10.3322/caac.21338
3. Yang JD, Hainaut P, Gores GJ, Amadou A, Plymoth A, Roberts LR. A global view of hepatocellular carcinoma: trends, risk, prevention and management. Nat Rev Gastroenterol Hepatol. 2019;16(10):589–604. doi:10.1038/s41575-019-0186-y
4. Villanueva A, Longo DL. Hepatocellular carcinoma. N Engl J Med. 2019;380(15):1450–1462. doi:10.1056/NEJMra1713263
5. Cheng A-L, Hsu C, Chan SL, Choo S-P, Kudo M. Challenges of combination therapy with immune checkpoint inhibitors for hepatocellular carcinoma. J Hepatol. 2020;72(2):307–319. doi:10.1016/j.jhep.2019.09.025
6. Plati J, Bucur O, Khosravi-Far R. Apoptotic cell signaling in cancer progression and therapy. Integr Biol (Camb). 2011;3(4):279–296. doi:10.1039/c0ib00144a
7. Danial NN. BCL-2 family proteins: critical checkpoints of apoptotic cell death. Clin Cancer Res. 2007;13(24):7254–7263. doi:10.1158/1078-0432.CCR-07-1598
8. Singh R, Letai A, Sarosiek K. Regulation of apoptosis in health and disease: the balancing act of BCL-2 family proteins. Nat Rev Mol Cell Biol. 2019;20(3):175–193. doi:10.1038/s41580-018-0089-8
9. Schwabe RF, Luedde T. Apoptosis and necroptosis in the liver: a matter of life and death. Nat Rev Gastroenterol Hepatol. 2018;15(12):738–752. doi:10.1038/s41575-018-0065-y
10. Luedde T, Kaplowitz N, Schwabe RF. Cell death and cell death responses in liver disease: mechanisms and clinical relevance. Gastroenterology. 2014;147(4). doi:10.1053/j.gastro.2014.07.018
11. Guicciardi ME, Malhi H, Mott JL, Gores GJ. Apoptosis and necrosis in the liver. Compr Physiol. 2013;3(2). doi:10.1002/cphy.c120020
12. Yang Y-A, Zhang G-M, Feigenbaum L, Zhang YE. Smad3 reduces susceptibility to hepatocarcinoma by sensitizing hepatocytes to apoptosis through downregulation of Bcl-2. Cancer Cell. 2006;9(6):445–457. doi:10.1016/j.ccr.2006.04.025
13. Pistritto G, Trisciuoglio D, Ceci C, Garufi A, D’Orazi G. Apoptosis as anticancer mechanism: function and dysfunction of its modulators and targeted therapeutic strategies. Aging (Albany NY). 2016;8(4):603–619. doi:10.18632/aging.100934
14. Wang F, Wang H, Sun X, Li M. Apoptosis-induction is a novel therapeutic strategy for gastrointestinal and liver cancers. Curr Gene Ther. 2015;15(2):193–200. doi:10.2174/1566523214666141224100801
15. Aronin A, Amsili S, Prigozhina TB, et al. Fn14•TRAIL effectively inhibits hepatocellular carcinoma growth. PLoS One. 2013;8(10):e77050. doi:10.1371/journal.pone.0077050
16. Li G, Chang H, Zhai Y-P, Xu W. Targeted silencing of inhibitors of apoptosis proteins with siRNAs: a potential anti-cancer strategy for hepatocellular carcinoma. Asian Pac J Cancer Prev. 2013;14(9):4943–4952. doi:10.7314/APJCP.2013.14.9.4943
17. Lian Q, Wang S, Zhang G, et al. HCCDB: a database of hepatocellular carcinoma expression atlas. Genomics Proteomics Bioinformatics. 2018;16(4):269–275. doi:10.1016/j.gpb.2018.07.003
18. Ritchie ME, Phipson B, Wu D, et al. limma powers differential expression analyses for RNA-sequencing and microarray studies. Nucleic Acids Res. 2015;43(7):e47. doi:10.1093/nar/gkv007
19. Tibshirani R. The lasso method for variable selection in the Cox model. Stat Med. 1997;16(4):385–395. doi:10.1002/(SICI)1097-0258(19970228)16:4<385::AID-SIM380>3.0.CO;2-3
20. Friedman J, Hastie T, Tibshirani R. Regularization paths for generalized linear models via coordinate descent. J Stat Softw. 2010;33(1). doi:10.18637/jss.v033.i01
21. Iasonos A, Schrag D, Raj GV, Panageas KS. How to build and interpret a nomogram for cancer prognosis. J Clin Oncol. 2008;26(8):1364–1370. doi:10.1200/JCO.2007.12.9791
22. Vickers AJ, Elkin EB. Decision curve analysis: a novel method for evaluating prediction models. Med Decis Making. 2006;26(6):565–574. doi:10.1177/0272989X06295361
23. Uhlen M, Oksvold P, Fagerberg L, et al. Towards a knowledge-based human protein atlas. Nat Biotechnol. 2010;28(12):1248–1250. doi:10.1038/nbt1210-1248
24. Gao J, Aksoy BA, Dogrusoz U, et al. Integrative analysis of complex cancer genomics and clinical profiles using the cBioPortal. Sci Signal. 2013;6(269):pl1. doi:10.1126/scisignal.2004088
25. Szklarczyk D, Morris JH, Cook H, et al. The STRING database in 2017: quality-controlled protein-protein association networks, made broadly accessible. Nucleic Acids Res. 2017;45(D1):D362–D368. doi:10.1093/nar/gkw937
26. Yu G, Wang L-G, Han Y, He Q-Y. Clusterprofiler: an R package for comparing biological themes among gene clusters. OMICS. 2012;16(5):284–287. doi:10.1089/omi.2011.0118
27. Craig AJ, von Felden J, Garcia-Lezana T, Sarcognato S, Villanueva A. Tumour evolution in hepatocellular carcinoma. Nat Rev Gastroenterol Hepatol. 2020;17(3):139–152. doi:10.1038/s41575-019-0229-4
28. Marquardt JU, Edlich F. Predisposition to apoptosis in hepatocellular carcinoma: from mechanistic insights to therapeutic strategies. Front Oncol. 2019;9:1421. doi:10.3389/fonc.2019.01421
29. Schulze K, Imbeaud S, Letouzé E, et al. Exome sequencing of hepatocellular carcinomas identifies new mutational signatures and potential therapeutic targets. Nat Genet. 2015;47(5):505–511. doi:10.1038/ng.3252
30. Wang F, Dong J, Zhang Y, et al. Identification of novel diagnostic and prognostic biomarkers for hepatocellular carcinoma. Oncol Rep. 2020;43(1):87–98. doi:10.3892/or.2019.7415
31. Jing Y, Sun K, Liu W, et al. Tumor necrosis factor-α promotes hepatocellular carcinogenesis through the activation of hepatic progenitor cells. Cancer Lett. 2018;434:22–32. doi:10.1016/j.canlet.2018.07.001
32. Min X, Wen J, Zhao L, et al. Role of hepatoma-derived growth factor in promoting de novo lipogenesis and tumorigenesis in hepatocellular carcinoma. Mol Oncol. 2018;12(9):1480–1497. doi:10.1002/1878-0261.12357
33. Wei J-C, Meng F-D, Qu K, et al. Sorafenib inhibits proliferation and invasion of human hepatocellular carcinoma cells via up-regulation of p53 and suppressing FoxM1. Acta Pharmacol Sin. 2015;36(2):241–251. doi:10.1038/aps.2014.122
34. Lim CJ, Lee YH, Pan L, et al. Multidimensional analyses reveal distinct immune microenvironment in hepatitis B virus-related hepatocellular carcinoma. Gut. 2019;68(5):916–927. doi:10.1136/gutjnl-2018-316510
35. Liao YL, Sun YM, Chau GY, et al. Identification of SOX4 target genes using phylogenetic footprinting-based prediction from expression microarrays suggests that overexpression of SOX4 potentiates metastasis in hepatocellular carcinoma. Oncogene. 2008;27(42):5578–5589. doi:10.1038/onc.2008.168
36. Zhang Y, Liu P, Jiang Y, et al. High expression of neuropilin-1 associates with unfavorable clinicopathological features in hepatocellular carcinoma. Pathol Oncol Res. 2016;22(2):367–375. doi:10.1007/s12253-015-0003-z
37. Campbell TM, Bryceson YT. Maintains immune harmony. J Exp Med. 2019;216(6):1231–1233. doi:10.1084/jem.20190546
 © 2021 The Author(s). This work is published and licensed by Dove Medical Press Limited. The full terms of this license are available at https://www.dovepress.com/terms.php and incorporate the Creative Commons Attribution - Non Commercial (unported, v3.0) License.
By accessing the work you hereby accept the Terms. Non-commercial uses of the work are permitted without any further permission from Dove Medical Press Limited, provided the work is properly attributed. For permission for commercial use of this work, please see paragraphs 4.2 and 5 of our Terms.
© 2021 The Author(s). This work is published and licensed by Dove Medical Press Limited. The full terms of this license are available at https://www.dovepress.com/terms.php and incorporate the Creative Commons Attribution - Non Commercial (unported, v3.0) License.
By accessing the work you hereby accept the Terms. Non-commercial uses of the work are permitted without any further permission from Dove Medical Press Limited, provided the work is properly attributed. For permission for commercial use of this work, please see paragraphs 4.2 and 5 of our Terms.