")
Back to Journals » International Journal of Nanomedicine » Volume 13
Amyloid-like staining property of RADA16-I nanofibers and its potential application in detecting and imaging the nanomaterial
Authors Chen Y , Hua Y , Zhang W, Tang C, Wang Y, Zhang Y, Qiu F
Received 14 December 2017
Accepted for publication 17 February 2018
Published 23 April 2018 Volume 2018:13 Pages 2477—2489
DOI https://doi.org/10.2147/IJN.S159785
Checked for plagiarism Yes
Review by Single anonymous peer review
Peer reviewer comments 3
Editor who approved publication: Dr Linlin Sun
Yongzhu Chen,1 Yusi Hua,2 Wensheng Zhang,3 Chengkang Tang,4 Yan Wang,4 Yujun Zhang,3 Feng Qiu3
1Periodical Press of West China Hospital, Sichuan University, Chengdu, China; 2Department of Anesthesiology, West China Hospital, Sichuan University, Chengdu, China; 3Laboratory of Anaesthesia and Critical Care Medicine, Translational Neuroscience Centre, West China Hospital, Sichuan University, Chengdu, China; 4Core Facility of West China Hospital, Sichuan University, Chengdu, China
Background: Designer self-assembling peptide nanofibers (SAPNFs) as a novel kind of emerging nanomaterial have received more and more attention in the field of nanomedicine in recent years. However, a simple method to monitor and image SAPNFs is still currently absent.
Methods: RADA16-I, a well-studied ionic complementary peptide was used as a model to check potential amyloid-like staining properties of SAPNFs. Thioflavin-T (ThT) and Congo red (CR) as specific dyes for amyloid-like fibrils were used to stain RADA16-I nanofibers in solution, combined with drugs or cells, or injected in vivo as hydrogels. Fluorescent spectrometry and fluorescent microscopy were used to check ThT-binding property, and polarized light microscopy was used to check CR-staining property.
Results: ThT binding with the nanofibers showed enhanced and blue-shifted fluorescence, and specific apple-green birefringence could be observed after the nanofibers were stained with CR. Based on these properties we further showed that ThT-binding fluorescence intensity could be used to monitor the forming and changing of nanofibers in solution, while fluorescent microscopy and polarized light microscopy could be used to image the nanofibers as material for drug delivery, 3D cell culture, and tissue regeneration.
Conclusion: Our results may provide convenient and reliable tools for detecting SAPNFs, which would be helpful for understanding their self-assembling process and exploring their applications.
Keywords: self-assembling peptides, nanofibers, amyloid fibrils, thioflavin-T, Congo red
Introduction
Self-assembling peptide nanofibers (SAPNFs) are a category of fibril nanomaterial formed by the self-assembly of designer short peptides. Ever since their appearance about two decades ago, SAPNFs have become one of the widely explored nanomaterials in the intersection of biomaterials and nanomedicine due to their intrinsic advantages such as controllability in synthesis and biocompatibility in application.1–3 Applied in the form of nanofiber scaffolds or hydrogel, several well-known SAPNF systems such as ionic complementary peptides,4–6 peptide amphiphiles,7–9 and Q11 peptide10–12 have been extensively investigated as advanced nanomaterials for wound healing, tissue engineering, 3D cell culture, controlled drug release, antigen epitope delivery, and so on. Considering the wide and increasing application of these SAPNFs, it would be advantageous if we could monitor the formation and degradation of nanofibers in a real-time manner and image the structure of them together with embedded cell/drug or surrounded tissue. However, due to the lack of a specific labeling tool for SAPNFs, related techniques have been pitifully absent in this field so far.
The most popular method to detect macromolecular biomolecules might be labeling with fluorescent dyes through chemical conjugation, which has been widely used for polymers and proteins.13,14 However, only very few fluorescently labeled SAPNFs have been reported to date,15 indicating it may not be an ideal strategy for SAPNFs. One possible technical reason for this is that the building blocks of SAPNFs are very short peptides with relatively low molecular weight. Unlike macromolecular polymers, their self-assembling ability might be vulnerable upon the addition of fluorophores, which might change too much of the peptides’ molecular weight, intramolecular or intermolecular space, or overall charge distribution, and eventually alter or even eliminate the self-assembly. On the other hand, fluorescent labeling of peptides could also be limited by the unavailability of a conjugating site on the peptide side, or at least it would inevitably raise the cost of peptide synthesis, preventing it from becoming a regular method for the labeling of SAPNFs. Most importantly, detecting fluorescently labeled peptide monomers may not necessarily reflect the real state of the self-assembling nanofibers, which is the essential element for almost all functions of this type of nanomaterial.
An alternative strategy is staining. If we can find a dye that could specifically bind with SAPNFs, then it could be detected using conventional devices such as a spectrometer and a microscope. Peptides and nanofibers, the two keywords for SAPNFs, linked these nanomaterials to pathogenic amyloid fibrils. Amyloid fibrils are nanofibers formed by abnormal aggregation of natural proteins, or the self-assembly of some derived or designer peptides.16–18 It is well known that amyloid fibrils can be specifically stained by thioflavin-T (ThT) or Congo red (CR), which have been used as golden standards for the identification of amyloid fibrils and diagnosis of related diseases very early. Recently, ThT has also been widely used to detect the formation of and monitor the growth of amyloid fibrils in solution, or even to visualize the detailed structure of these nanofibers.19,20 Obviously, the two dyes could also be used for studying SAPNF nanomaterials as long as they possess similar amyloid-like staining properties. Actually, considering the architecture of nanofibers and the secondary structure of the β-sheet of many SAPNFs, their potential amyloid-like property has already been realized by some researchers.21 However, ThT-binding and CR staining featuring amyloid-like staining properties have not yet been well studied for SAPNF nanomaterials.
In this paper, we took ionic complementary peptide RADA16-I, one of the most widely investigated SAPNF nanomaterials, as a model and carried out ThT and CR-binding experiments on it to prove its amyloid-like staining properties. We also explored the application of these properties for detecting and imaging this nanomaterial.
Materials and methods
Materials
RADA16-I (peptide sequence Ac-RADARADARADARADA-CONH2) was purchased from Shanghai Bootech BioScience & Technology Co., Ltd (Shanghai, China) as lyophilized dry powder with purity over 95%. ThT, CR, pyrene, doxorubicin hydrochloride (Dox), and Rhodamine B (RhoB) were purchased from Sigma-Aldrich Co. (St Louis, MO, USA). Other chemicals were of analytical grade, and sterile Milli-Q water was used for the preparation of all solutions unless specified otherwise.
Transmission electron microscopy (TEM)
To study the effect of ThT-binding on the formation and morphology of RADA16-I nanofibers, the peptide was dissolved in water at a concentration of 1 mg/mL and incubated with or without 10 μM ThT at room temperature (RT) overnight. The overnight incubation is a routine treatment for RADA16-I because the self-assembling system generally needs some time to reach a relatively equilibrium state. For TEM observation, 20 μL of each sample was dropped onto a 400-mesh copper grid covered by Formvar and carbon films, incubated for 5 min to load the sample, and excess liquid was blotted with filter paper. Then 2% phosphotungstic acid was dropped onto the grid to stain the sample for 2 min, and excess liquid was blotted with filter paper. The grid was air-dried and observed with TEM (Tecnai G2 F20; FEI, Hillsboro, OR, USA).
ThT-binding test
RADA16-I was dissolved in water at a concentration of 1 mg/mL and incubated at RT overnight before testing. ThT stock solution (1 mM in water) was mixed with the peptide solution to obtain a final ThT concentration of 10 μM, and fluorescence spectra between 460 and 600 nm were collected using a Fluorolog spectrometer (HORIBA Ltd, Kyoto, Japan) with an exciting wavelength of 450 nm. To test the stability of ThT-binding fluorescence, spectra were collected at 0, 2, 5, 10, 30, and 60 min after ThT was added. Water solution of ThT (10 μM in Milli-Q water) was used as control. Each sample was measured three times to obtain an averaged fluorescence value at 495 nm.
Peptide concentration sweeping
To study the relationship between the amount of nanofibers and ThT-binding fluorescence, 1 mg/mL RADA16-I was diluted in water to a final concentration of 0.01–1 mg/mL and incubated at RT overnight before binding with ThT. ThT stock solution was then added into the peptide solutions to obtain a final ThT concentration of 10 μM, mixed, and incubated at RT for 10 min. Fluorescence spectra were collected as described earlier.
Kinetics study and ultrasound treatment
To study the self-assembling kinetics, RADA16-I solution with a concentration of 1 mg/mL was freshly prepared and incubated at RT. At different time points (0–16 h) an aliquot of sample was taken out and the ThT-binding test was carried out as described earlier. To monitor the disassembly and reassembly of peptide after mechanical destruction, 1 mg/mL RADA16-I in water was incubated at RT overnight and then treated by ultrasound for 30 min to break the self-assembling nanofibers, followed by incubating the sample at RT. At different time points (0–8 h) after the ultrasound treatment, an aliquot of solution was taken out and the ThT-binding test was carried out as described earlier.
Kinetics study with pH variation
RADA16-I stock solution with concentration of 10 mg/mL was prepared in water and incubated at RT for 24 h. The stock solution was then diluted into buffers with different pH (2.0, 4.0, 6.0, and 8.0) to a final peptide concentration of 1 mg/mL and incubated at RT. At different time points (0–16 h) after the peptide was diluted, an aliquot of each sample was taken out for the ThT-binding test as described earlier. At the end point, ie, 16 h after RADA16-I stock solution was diluted into different buffers, TEM samples from different solutions were prepared and TEM images were collected as described earlier. Circular dichroism (CD) measurement was also carried out by further diluting the peptide solutions to a final concentration of 0.1 mg/mL with corresponding buffers and collecting the far-ultraviolet CD spectra between 185 and 260 nm with a Model 400 CD spectrophotometer (Aviv Biomedical Inc., Lakewood, NJ, USA).
Light microscope imaging
A drop of water solution of RADA16-I (1 mg/mL) was spread on a glass slide and air-dried, followed by staining with ThT (10 μM) or CR (saturated in 80% ethanol) for 10 min. The slides were gently rinsed with water and air-dried before observation with a DM4000 B microscope (Leica Microsystems, Wetzlar, Germany). For samples stained with ThT, a blue–green channel under the fluorescence mode was used. For samples stained with CR, a polarizing stage equipped on the microscope was used to obtain images under polarized light.
Drug encapsulation and imaging
Pyrene and Dox were used as models for hydrophobic and hydrophilic drugs, respectively. Encapsulation of insoluble pyrene was carried out using a previously described method with minor modification.22 Briefly, 5 mg of pyrene was added into 10 mL of RADA16-I solution (1 mg/mL) in a scintillation vial and stirred vigorously for 24 h to obtain a milky suspension. ThT was added into the suspension to a final concentration of 10 μM to stain the sample for 10 min. A drop of stained sample was then spread on a glass slide, air-dried, and observed under a fluorescent microscope using a violet–blue channel for pyrene and a blue–green channel for ThT-binding nanofibers. Encapsulation of soluble Dox was carried out using a previously described method for the encapsulation of other soluble molecules.23 Briefly, Dox stock solution (2 mg/mL in water) was diluted into freshly prepared RADA16-I solution (10 mg/mL) to a final drug concentration of 0.2 mg/mL. The mixture was incubated at RT overnight to form a self-supporting hydrogel with Dox encapsulated. A small piece of hydrogel was immersed into 10 μM ThT for 10 min, transferred onto a glass slide, and observed under a fluorescent microscope, using a green–red channel for Dox and a blue–green channel for ThT-binding nanofibers.
3D cell culture and imaging
PC12 cells were commercially purchased from American Type Culture Collection (ATCC, Manassas, VA, USA) and conventionally cultured in RPMI 1640 medium supplemented with 10% horse serum and 5% fetal bovine serum. One day before 3D cell culture, 20 mg/mL RADA16-I solution was prepared and incubated at RT to form a viscous hydrogel. PC12 cells cultured in a flask were stained with 0.2 mg/mL RhoB for 10 min, followed by trypsinization and resuspension in full medium. Resuspended cells were then mixed with RADA16-I hydrogel at a volume ratio of 1:1. The mixture was then incubated in a humidified incubator with 5% CO2 at 37°C for 1 h. An aliquot of cell-containing hydrogel was then incubated with 1 μM ThT for 10 min and spread on top of a glass slide and observed under a fluorescent microscope. A green–red channel was used for RhoB-stained cells and a blue–green channel was used for ThT-binding RADA16-I hydrogel.
In vivo injection and tissue slice staining
Adult male Sprague Dawley rats provided by the Animal Center of the Sichuan University were used for in vivo experiment as approved by the Committee of Animal Care of West China Hospital, Sichuan University, and all animal experiments were carried out under the Guide for the Care and Use of Laboratory Animals published by the US National Institutes of Health. The rat was anesthetized by intraperitoneal injection of pentobarbital, after which 200 μL of RADA16-I (10 mg/mL) was injected into the cavity around the sciatic nerve. One day after the injection, the animal was euthanized with isoflurane and tissue at the injection site was conventionally fixed, embedded, and sectioned. The tissue slice was then stained with CR solution (saturated in 80% ethanol) for 10 min, rinsed with water, air-dried, and observed under polarized light as described earlier.
Results and discussion
RADA16-I nanofiber and its ThT-binding fluorescence
Firstly, TEM was used to investigate the existence and morphology of nanofibers in RADA16-I solution with or without ThT. As shown in Figure 1A, in 1 mg/mL water solution, RADA16-I self-assembles into a network of cross-linking nanofibers as previously reported.24 Binding with ThT seems not to change the morphology of its nanostructure, as Figure 1B reveals a similar nanofiber network formed by ThT-binding RADA16-I. This is not surprising since the molecular mechanism of ThT-binding has been reported as the insertion of ThT monomer into amyloid-like fibrils.25 This result suggested that ThT had minimal effect on the self-assembling process of RADA16-I, making it an ideal fluorescent dye to monitor the formation and growth of the nanofibers in a long-term and real-time manner. We then checked the fluorescence of ThT bound with RADA16-I and compared it with free ThT. As shown in Figure 1C, free ThT showed a very weak innate peak around 530 nm, and when it was bound with RADA16-I nanofibers a dramatically enhanced and blue-shifted peak appeared around 495 nm, which has been well known as one of the most typical features of amyloid-like nanofibers. A similar ThT-binding property of a RADA16-I derivative with unprotected N and C terminals has also been reported in a recent study.21 Although nanofibers formed by RADA16-I were morphologically different from typical amyloid fibrils, which were usually believed to be smooth and unbranched nanofibers, some branched amyloid fibrils have also been reported in recent years.26 We further examined ThT-binding fluorescence at different time points after the dye was bound with RADA16-I nanofibers, which showed that the fluorescent peak value rapidly increased to a maximum within 10 min and kept stable for at least 1 h (Figure 1D). This is also why we incubated ThT with RADA16-I for 10 min before fluorescence measurement in the following experiments. This feature allows ThT-binding to be a fast and reliable staining method to study RADA16-I nanofibers.
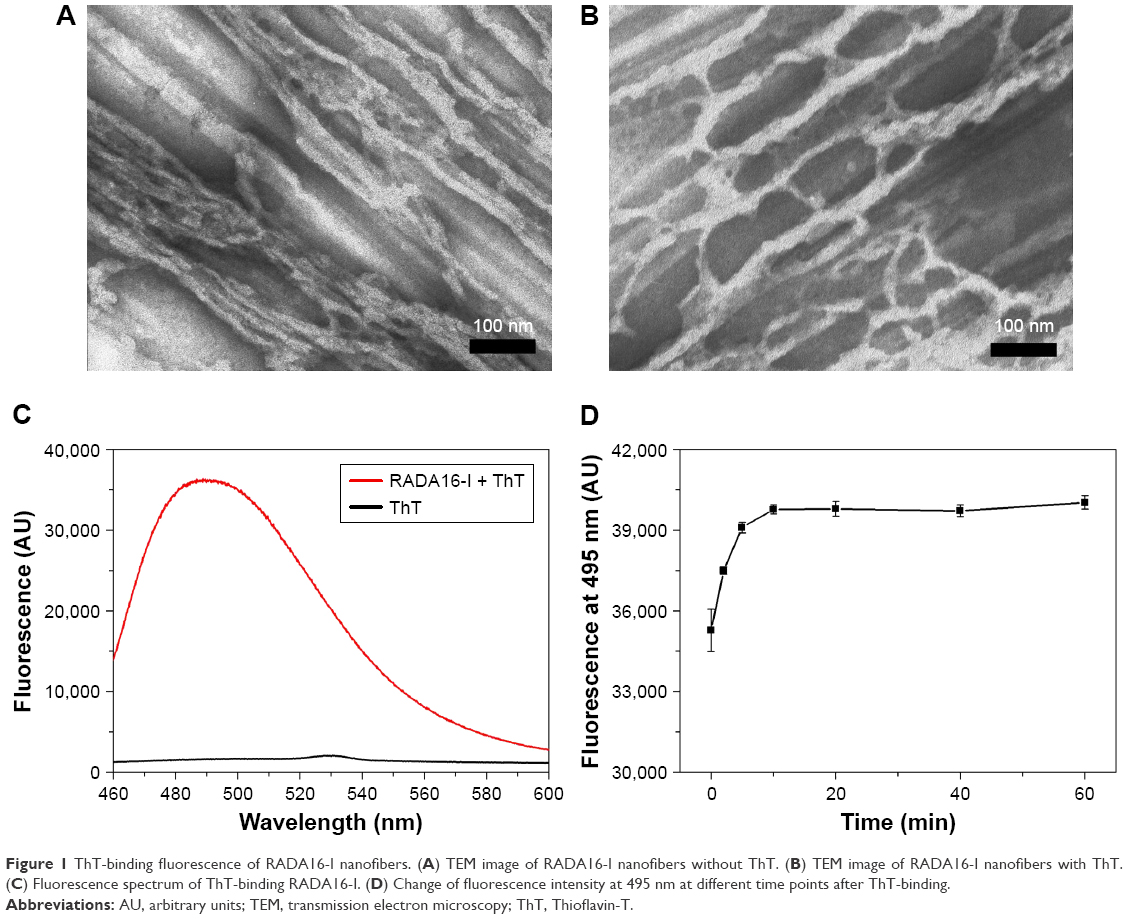 | Figure 1 ThT-binding fluorescence of RADA16-I nanofibers. (A) TEM image of RADA16-I nanofibers without ThT. (B) TEM image of RADA16-I nanofibers with ThT. (C) Fluorescence spectrum of ThT-binding RADA16-I. (D) Change of fluorescence intensity at 495 nm at different time points after ThT-binding. |
ThT-binding fluorescence reflecting the amount of nanofibers
As a potential dye for quantitatively analyzing SAPNFs, ThT-binding fluorescence should be able to reflect the amount of nanofibers in solution. To approve this, the first step is to directly change the concentration of RADA16-I so as to change the amount of nanofibers. As shown in Figure 2, the peak values of ThT-binding fluorescence changed as a function of peptide concentration, suggesting that the intensity of fluorescence is associated with the amount of nanofibers determined by the peptide concentration. The implication of this finding is that a critical aggregating concentration (CAC) could be estimated around 0.2 mg/mL, which means the peptide began to undergo well-ordered self-assembly above this concentration. As we know, this is the first estimate of the CAC value of a self-assembling peptide with a spectrometry method, which could provide important information for clarifying the self-assembling mechanism and exploring the application of the material.
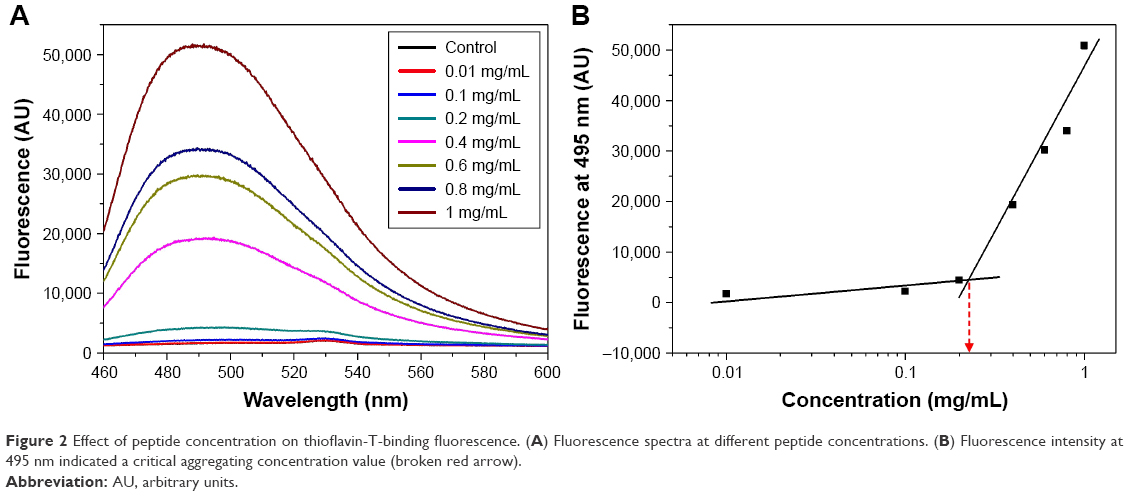 | Figure 2 Effect of peptide concentration on thioflavin-T-binding fluorescence. (A) Fluorescence spectra at different peptide concentrations. (B) Fluorescence intensity at 495 nm indicated a critical aggregating concentration value (broken red arrow). |
In order to confirm that the ThT-binding fluorescence intensity is associated with the amount of nanofibers instead of peptide monomers, we then measured the kinetic ThT-binding fluorescence of RADA16-I solution. As shown in Figure 3A, the ThT-binding fluorescence of freshly prepared RADA16-I gradually increased from a relatively low value to a plateau after 8–16 h, which was coincident with the general expectation that self-assembly of RADA16-I was a slow process and thus overnight incubation was necessary to prepare a relatively stable sample. On the other hand, it has been previously reported that RADA16-I nanofibers could be mechanically broken by ultrasound and then undergo a reassembling process to recover the nanostructure of fibers, although during this whole process the peptide’s β-sheet conformation kept unchanged.27 These results were also coincident with our ThT-binding fluorescence data shown in Figure 3B where the ThT-binding fluorescence of RADA16-I dropped significantly after ultrasound treatment, and then gradually increased to near the original value after 8 h, providing a measurable parameter for quantitatively analyzing this disassembling–reassembling process.
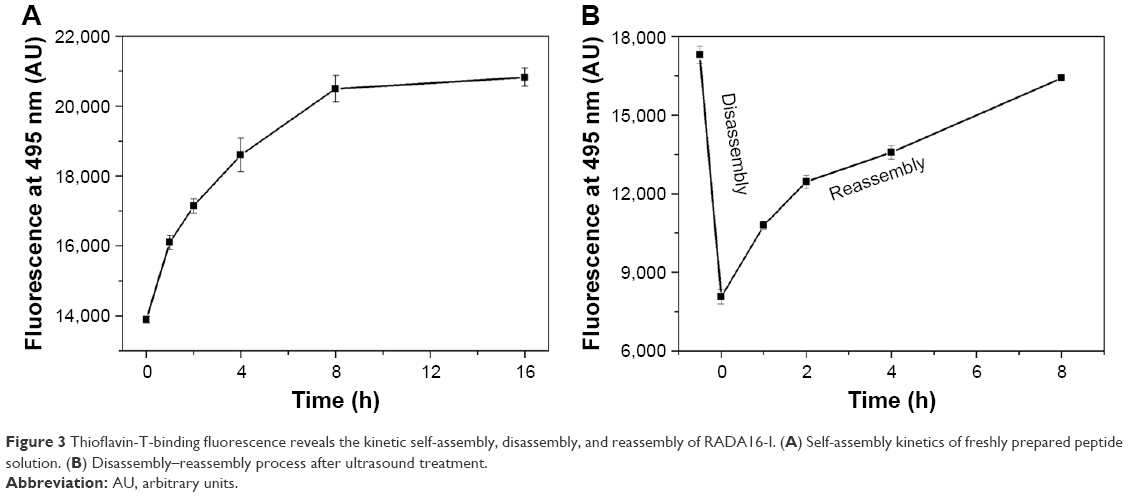 | Figure 3 Thioflavin-T-binding fluorescence reveals the kinetic self-assembly, disassembly, and reassembly of RADA16-I. (A) Self-assembly kinetics of freshly prepared peptide solution. (B) Disassembly–reassembly process after ultrasound treatment. |
ThT-binding fluorescence monitoring the change of nanofibers at different pH
Since it has been reported earlier that self-assembly of RADA16-I would be significantly affected by pH change,28 we then carried out a study to further confirm that ThT-binding fluorescence could be used to monitor the change of nanofibers in solutions with different pH. As shown in Figure 4A, when RADA16-I nanofibers in stock solution (10 mg/mL in water) were diluted into buffers with different pH, the ThT-binding fluorescence underwent different changes. At pH 4.0, which was close to the peptide’s native pH in water (about 3.57), the fluorescence kept almost unchanged, indicating no significant change happened to the nanofibers. At pH 2.0 the fluorescence dropped quickly, while at pH 6.0 the fluorescence increased quickly, indicating the disassembly and growth of nanofibers respectively. At pH 8.0, RADA16-I immediately lost its ThT-binding fluorescence, indicating the complete disassembly of nanofibers. We also measured ThT-binding fluorescence of RADA16-I directly dissolved in buffers with different pH and results similar to the end point of this study were obtained (Figure S1). Since the self-assembly of RADA16-I was based on its β-sheet secondary structure, we then studied CD spectra of the peptide at different pH. As shown in Figure 4B, RADA16-I at pH 4.0 showed a characteristic β-sheet signal, which decreased at pH 2.0 while increased at pH 6.0. And at pH 8.0 the peptide lost its β-sheet conformation and took an unordered secondary structure. These results demonstrated the conformational basis of how RADA16-I nanofibers changed at different pH as revealed by ThT-binding fluorescence. TEM images in Figure 4C also confirmed these changes caused by pH, where RADA16-I at pH 4.0 or 6.0 showed a similar nanofiber network, while at pH 2.0 only short nanofibers were formed. It should be noticed that although ThT-binding fluorescence and CD spectra suggested that RADA16-I formed more nanofibers at pH 6.0 than at pH 4.0, this change was not reflected by TEM, which is a morphological technique instead of a quantitative one. On the other hand, at pH 8.0 the peptide did not form any nanostructure at all (data not shown).
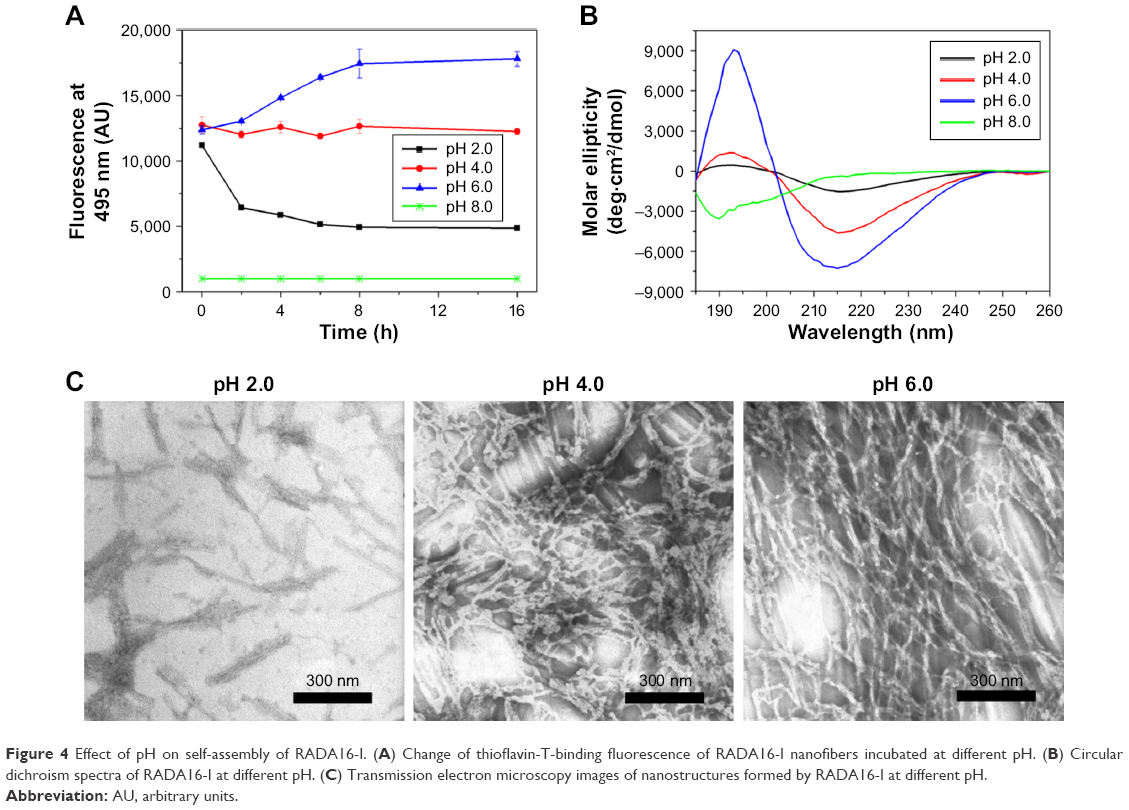 | Figure 4 Effect of pH on self-assembly of RADA16-I. (A) Change of thioflavin-T-binding fluorescence of RADA16-I nanofibers incubated at different pH. (B) Circular dichroism spectra of RADA16-I at different pH. (C) Transmission electron microscopy images of nanostructures formed by RADA16-I at different pH. |
Since the peptide concentration kept unchanged in the pH variation experiment described earlier, and in the disassembling–reassembling experiment even the peptide’s β-sheet conformation kept unchanged, it could be further confirmed that the ThT-binding fluorescent intensity of RADA16-I is directly associated with the nanofibers instead of the peptide monomer or its secondary structure. So, ThT-binding fluorescence could be a useful indicator to monitor the forming, growing, and degrading of nanofibers in a real-time manner during the preparation and application of this type of material. Actually, a similar method has already been commonly used to monitor the formation of pathogenic amyloid fibrils in solution.29 This method would be very useful for developing new RADA16-I analogs with minor amino acid substitution or their derivatives modified with different functional groups, because it could quickly imply whether the new peptide can still undergo self-assembly to form nanofibers, or easily find out the proper condition for self-assembly.
Microscope imaging of nanofiber scaffold as drug carrier
Since ThT-binding RADA16-I nanofibers showed a fluorescent peak value around 495 nm, a fluorescent microscope could be used to image this nanomaterial. As shown in Figure 5A, under excitation by blue laser, ThT-binding RADA16-I showed intensive green fluorescence, and the image under higher magnification could even reveal the porous structure of nanofiber scaffold as shown in Figure 5B, suggesting that ThT could be used as a dye to stain RADA16-I nanofibers for imaging purposes. On the other hand, when RADA16-I was stained with CR, apple-green birefringence could be observed under polarized light, which is also a characteristic feature of amyloid fibrils (Figure 5C and D). Compared with ThT, the outcome of this staining technique is less uniform so that may not be good at discriminating the detailed structure of the material, but it could be a supplementary or backup because it is known that ThT will lose its specificity in some cases.
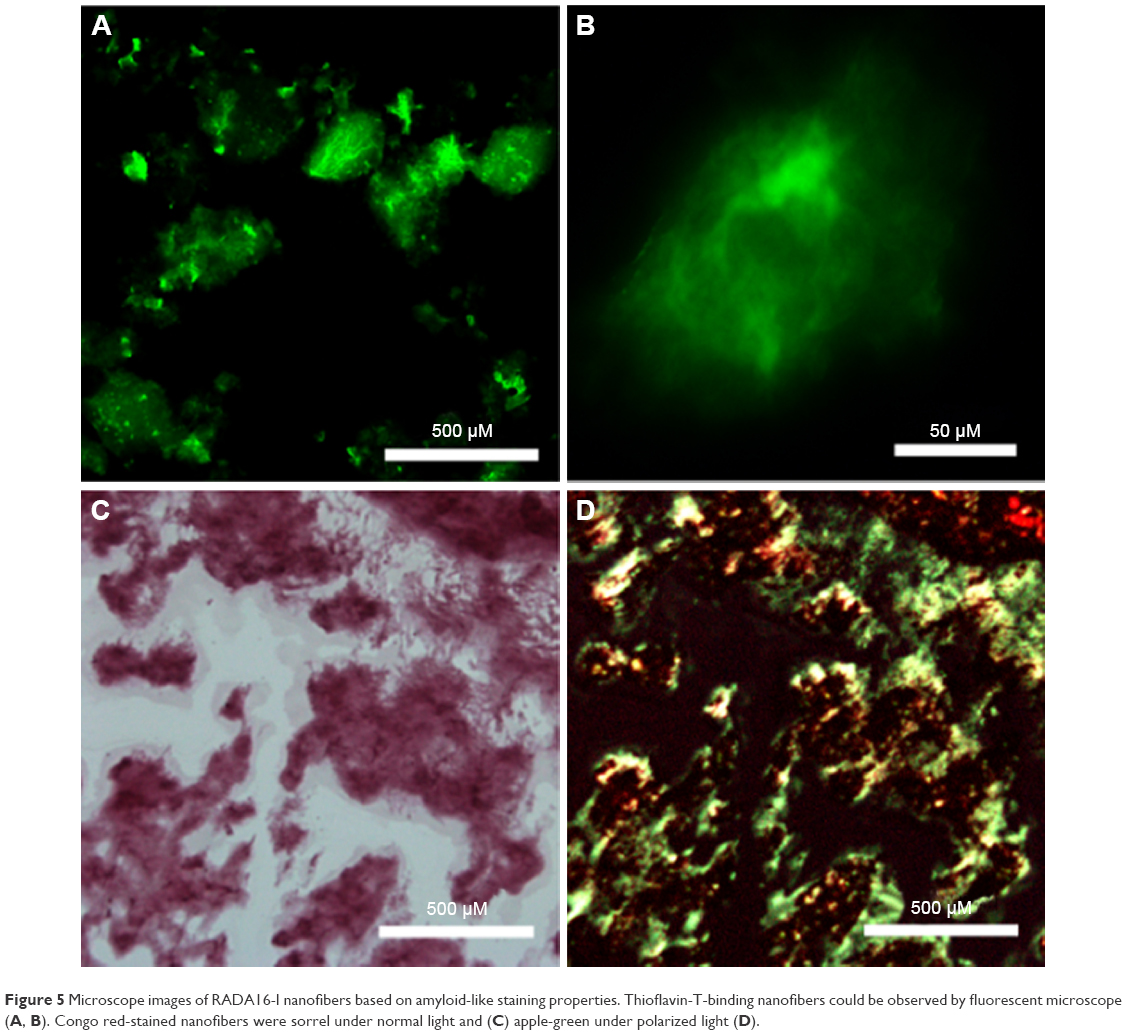 | Figure 5 Microscope images of RADA16-I nanofibers based on amyloid-like staining properties. Thioflavin-T-binding nanofibers could be observed by fluorescent microscope (A, B). Congo red-stained nanofibers were sorrel under normal light and (C) apple-green under polarized light (D). |
We then tested the feasibility of combining ThT fluorescence with other fluorescent molecules to see if it could be used for studying the drug distribution profile when RADA16-I nanofiber scaffold was used as a drug carrier. As shown in Figure 6A, water-insoluble pyrene was prepared as a suspension in RADA16-I solution. Microscope images of this suspension showed that pyrene microparticles were dispersed in the nanofiber scaffolds formed by the peptide, illustrating how this hydrophobic drug model was stabilized in the suspension. Alternatively, hydrophilic Dox was directly dissolved in concentrated RADA16-I which formed a drug-containing hydrogel. As shown in Figure 6B, red fluorescence from Dox completely overlapped with green fluorescence from ThT-binding RADA16-I, indicating that the hydrophilic drug was evenly distributed throughout the hydrogel. These results suggested that ThT could be used as a fluorescent label for RADA16-I nanofibers, and combining with the fluorescence from special drugs might make it possible to study how the drug is encapsulated in, interacting with, and released from the nanofiber scaffolds.
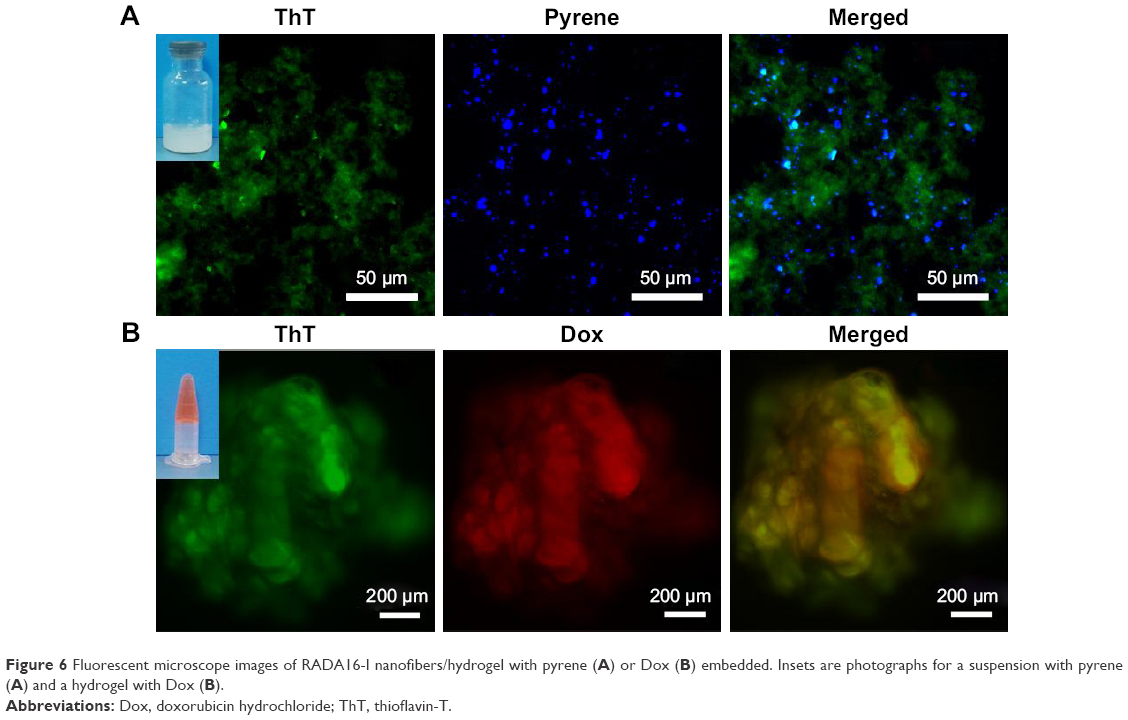 | Figure 6 Fluorescent microscope images of RADA16-I nanofibers/hydrogel with pyrene (A) or Dox (B) embedded. Insets are photographs for a suspension with pyrene (A) and a hydrogel with Dox (B). |
Microscope imaging of RADA16-I as 3D cell culture scaffold
Since RADA16-I hydrogel has also been widely investigated as scaffolds for 3D cell culture by providing an in vitro 3D environment mimicking the extracellular matrix in vivo, it would be interesting if we could label the cells and the scaffolds, respectively, and discriminate them by optical microscope. As shown in Figure 7, when PC12 cells were stained with RhoB and RADA16-I hydrogel was stained with ThT, a fluorescent microscope revealed that the cells were embedded in the scaffold of nanofibers. As indicated by arrows in Figure 7, it is clearly visible that some cells began to stretch out and intrude into the surrounding scaffold. It is expectable that this staining method could be used to explore more advanced microscopy techniques, which might be helpful to reveal more detailed information about the cells’ adherence, growth, proliferation, and even differentiation inside the scaffold of RADA16-I nanofibers.
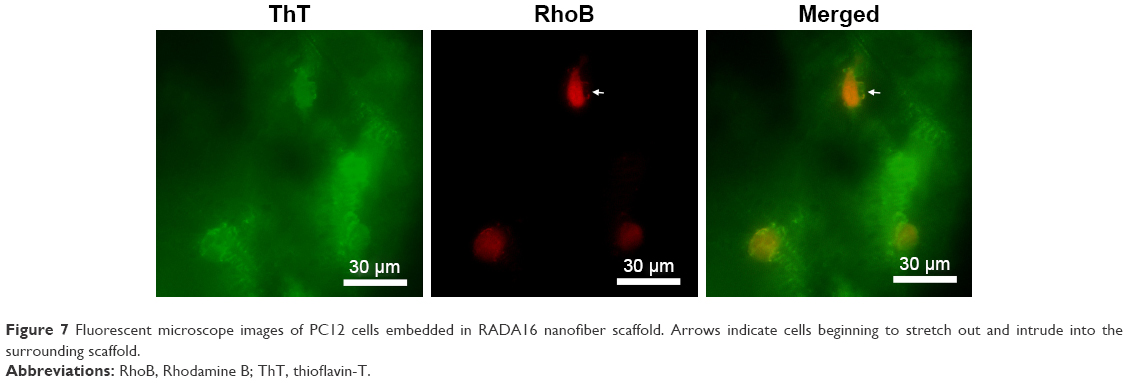 | Figure 7 Fluorescent microscope images of PC12 cells embedded in RADA16 nanofiber scaffold. Arrows indicate cells beginning to stretch out and intrude into the surrounding scaffold. |
CR staining revealed in vivo distribution of RADA16-I hydrogel
As an injectable and biodegradable hydrogel material, RADA16-I could provide a 3D scaffold in situ for the migration, proliferation, and differentiation of cells near the wound site, so it has been widely used for tissue regeneration in vivo. However, how the hydrogel is tightly connected with surrounding tissue and how it is gradually degraded during the regeneration process has not been described yet due to the lack of staining technique for the material. In our study, we carried out an animal experiment to see if the amyloid-like staining property of RADA16-I hydrogel could be used for imaging the material in vivo, which could be very useful to monitor its distribution and degradation. Our study revealed that ThT could unspecifically bind with nearly all kinds of tissue (Figure S2), suggesting it is not suitable for this purpose. Alternatively, CR staining was used to identify RADA16-I nanofibers in vivo and showed very good specificity. As shown in Figure 8, the image under polarized light clearly showed an apple-green region around the sciatic nerve, indicating that injected hydrogel was exactly distributed at the target site. To the best of our knowledge, this is the first experiment to show the distribution of injectable SAPNFs by tissue section, and it may be used as a convenient method for monitoring the distribution and degradation of the material in vivo.
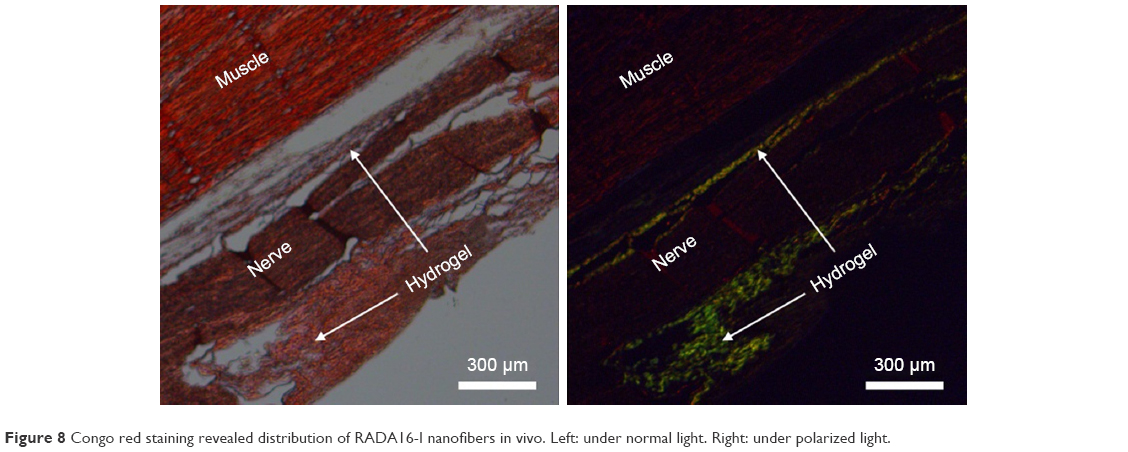 | Figure 8 Congo red staining revealed distribution of RADA16-I nanofibers in vivo. Left: under normal light. Right: under polarized light. |
Conclusion
In this study, we revealed the amyloid-like staining properties of RADA16-I nanofibers, ie, specific ThT-binding fluorescence and apple-green birefringence after CR staining. Fluorescence spectrometry based on ThT-binding could be used to quantify the amount of nanofibers in solution, making it a potential method to monitor the forming, growing, and degrading of nanofibers in a real-time manner. Based on these properties, RADA16-I nanofiber could be stained by ThT or CR for imaging purposes, creating supportive research tools for its application as a drug carrier, 3D cell culture scaffold, or tissue-repairing hydrogel. Considering the easy availability of the dyes and simplicity of the staining protocols, our findings could provide convenient and reliable tools for developing novel ionic complementary SAPNFs and exploring their applications, which has been a hot spot in the field of nanomedicine in recent years.30–33 Furthermore, although we only introduced ionic complementary RADA16-I as an example in this study, a similar amyloid-like staining property might be a ubiquitous feature for other SAPNFs. In our succeeding research, Q11 peptide nanofiber, a material widely investigated in the field of peptide antigen delivery, has also shown similar staining properties (Figure S3). It is promising that similar techniques could be widely employed for the fast-growing field of SAPNFs, boosting their application as advanced materials for nanomedicine. On the other hand, the amyloid-like property of RADA16-I nanofibers could also add some new insight for investigating the molecular basis of the formation of amyloid fibrils, which has very important pathological implication.
Acknowledgment
The authors are grateful for the financial support from the National Natural Science Foundation of China (No 81000658 and No 31100565).
Disclosure
The authors report no conflicts of interest in this work.
References
Pugliese R, Gelain F. Peptidic biomaterials: from self-assembling to regenerative medicine. Trends Biotechnol. 2017;35(2):145–158. | ||
Acar H, Srivastava S, Chung EJ, et al. Self-assembling peptide-based building blocks in medical applications. Adv Drug Deliv Rev. 2017;110–111:65–79. | ||
Koutsopoulos S. Self-assembling peptide nanofiber hydrogels in tissue engineering and regenerative medicine: progress, design guidelines, and applications. J Biomed Mater Res A. 2016;104(4):1002–1016. | ||
Wang TW, Chang KC, Chen LH, Liao SY, Yeh CW, Chuang YJ. Effects of an injectable functionalized self-assembling nanopeptide hydrogel on angiogenesis and neurogenesis for regeneration of the central nervous system. Nanoscale. 2017;9(42):16281–16292. | ||
Li R, Pang Z, He H, et al. Drug depot-anchoring hydrogel: a self-assembling scaffold for localized drug release and enhanced stem cell differentiation. J Control Release. 2017;261:234–245. | ||
Phipps MC, Monte F, Mehta M, Kim HK. Intraosseous delivery of bone morphogenic protein-2 using a self-assembling peptide hydrogel. Biomacromolecules. 2016;17(7):2329–2336. | ||
Fleming S, Ulijn RV. Design of nanostructures based on aromatic peptide amphiphiles. Chem Soc Rev. 2014;43(23):8150–8177. | ||
Cinar G, Ozdemir A, Hamsici S, et al. Local delivery of doxorubicin through supramolecular peptide amphiphile nanofiber gels. Biomater Sci. 2016;5(1):67–76. | ||
Choe S, Bond CW, Harrington DA, Stupp SI, McVary KT, Podlasek CA. Peptide amphiphile nanofiber hydrogel delivery of sonic hedgehog protein to the cavernous nerve to promote regeneration and prevent erectile dysfunction. Nanomedicine. 2017;13(1):95–101. | ||
Chesson CB, Huelsmann EJ, Lacek AT, et al. Antigenic peptide nanofibers elicit adjuvant-free CD8+ T cell responses. Vaccine. 2014;32(10):1174–1180. | ||
Rudra JS, Tian YF, Jung JP, Collier JH. A self-assembling peptide acting as an immune adjuvant. Proc Natl Acad Sci U S A. 2010;107(2):622–627. | ||
Mora-Solano C, Wen Y, Han H, et al. Active immunotherapy for TNF-mediated inflammation using self-assembled peptide nanofibers. Biomaterials. 2017;149:1–11. | ||
Albright V, Zhuk I, Wang Y, et al. Self-defensive antibiotic-loaded layer-by-layer coatings: imaging of localized bacterial acidification and pH-triggering of antibiotic release. Acta Biomater. 2017;61:66–74. | ||
Guan A, Li Z, Phillips KS. The effect of fluorescent labels on protein sorption in polymer hydrogels. J Fluoresc. 2014;24(6):1639–1650. | ||
da Silva RM, van der Zwaag D, Albertazzi L, Lee SS, Meijer EW, Stupp SI. Super-resolution microscopy reveals structural diversity in molecular exchange among peptide amphiphile nanofibres. Nat Commun. 2016;7:11561. | ||
Ke PC, Sani MA, Ding F, et al. Implications of peptide assemblies in amyloid diseases. Chem Soc Rev. 2017;46(21):6492–6531. | ||
Chiti F, Dobson CM. Protein misfolding, amyloid formation, and human disease: a summary of progress over the last decade. Annu Rev Biochem. 2017;86:27–68. | ||
Landreh M, Sawaya MR, Hipp MS, Eisenberg DS, Wüthrich K, Hartl FU. The formation, function and regulation of amyloids: insights from structural biology. J Intern Med. 2016;80(2):164–176. | ||
Ban T, Goto Y. Direct observation of amyloid growth monitored by total internal reflection fluorescence microscopy. Methods Enzymol. 2006;413:91–102. | ||
Ban T, Hamada D, Hasegawa K, Naiki H, Goto Y. Direct observation of amyloid fibril growth monitored by thioflavin T fluorescence. J Biol Chem. 2003;278(19):16462–16465. | ||
Bagrov D, Gazizova Y, Podgorsky V, et al. Morphology and aggregation of RADA-16-I peptide studied by AFM, NMR and molecular dynamics simulations. Biopolymers. 2016;106(1):72–81. | ||
Li F, Wang J, Tang F, et al. Fluorescence studies on a designed self-assembling peptide of RAD16-II as a potential carrier for hydrophobic drug. J Nanosci Nanotechnol. 2009;9(2):1611–1614. | ||
Nagai Y, Unsworth LD, Koutsopoulos S, Zhang S. Slow release of molecules in self-assembling peptide nanofiber scaffold. J Control Release. 2006;115(1):18–25. | ||
Holmes TC, de Lacalle S, Su X, Liu G, Rich A, Zhang S. Extensive neurite outgrowth and active synapse formation on self-assembling peptide scaffolds. Proc Natl Acad Sci U S A. 2000;97(12):6728–6733. | ||
Khurana R, Coleman C, Ionescu-Zanetti C, et al. Mechanism of thioflavin T binding to amyloid fibrils. J Struct Biol. 2005;151(3):229–238. | ||
Andersen CB, Yagi H, Manno M, et al. Branching in amyloid fibril growth. Biophys J. 2009;96(4):1529–1536. | ||
Yokoi H, Kinoshita T, Zhang S. Dynamic reassembly of peptide RADA16 nanofiber scaffold. Proc Natl Acad Sci U S A. 2005;102(24):8414–8419. | ||
Ye Z, Zhang H, Luo H, et al. Temperature and pH effects on biophysical and morphological properties of self-assembling peptide RADA16-I. J Pept Sci. 2008;14(2):152–162. | ||
Schlein M. Insulin formulation characterization-the thioflavin T assays. AAPS J. 2017;19(2):397–408. | ||
Li X, Cheng S, Wu Y, et al. Functional self-assembled peptide scaffold inhibits tumor necrosis factor-alpha-induced inflammation and apoptosis in nucleus pulposus cells by suppressing nuclear factor-κB signaling. J Biomed Mater Res A. 2018;106(4):1082–1091. | ||
Chen S, Zhou A, He B, Zhao W, Chen X, Jiang D. Designer D-form self-assembling peptide scaffolds promote the proliferation and migration of rat bone marrow-derived mesenchymal stem cells. Int J Mol Med. 2017;40(3):679–688. | ||
He B, Ou Y, Chen S, et al. Designer bFGF-incorporated d-form self-assembly peptide nanofiber scaffolds to promote bone repair. Mater Sci Eng C Mater Biol Appl. 2017;74:451–458. | ||
Wang J, Zheng J, Zheng Q, et al. FGL-functionalized self-assembling nanofiber hydrogel as a scaffold for spinal cord-derived neural stem cells. Mater Sci Eng C Mater Biol Appl. 2015;46:140–147. |
Supplementary materials
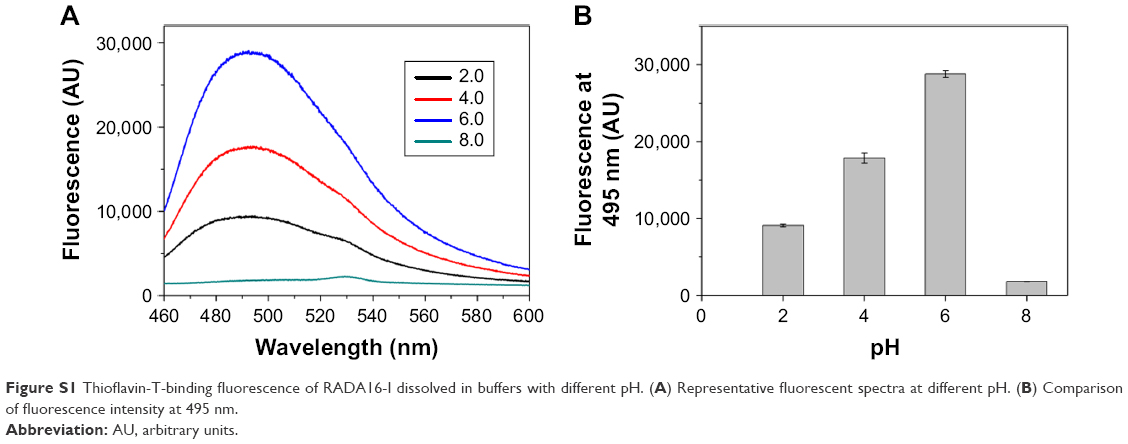 | Figure S1 Thioflavin-T-binding fluorescence of RADA16-I dissolved in buffers with different pH. (A) Representative fluorescent spectra at different pH. (B) Comparison of fluorescence intensity at 495 nm. |
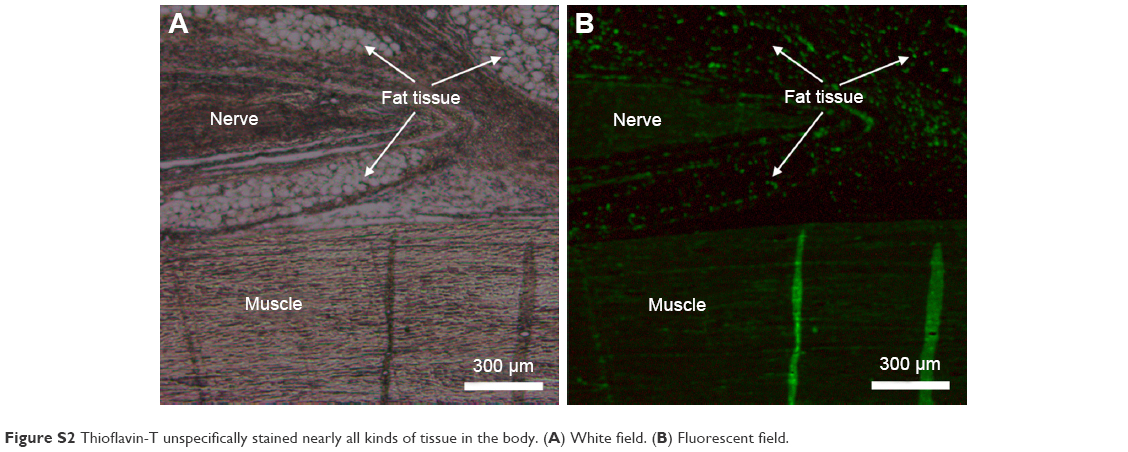 | Figure S2 Thioflavin-T unspecifically stained nearly all kinds of tissue in the body. (A) White field. (B) Fluorescent field. |
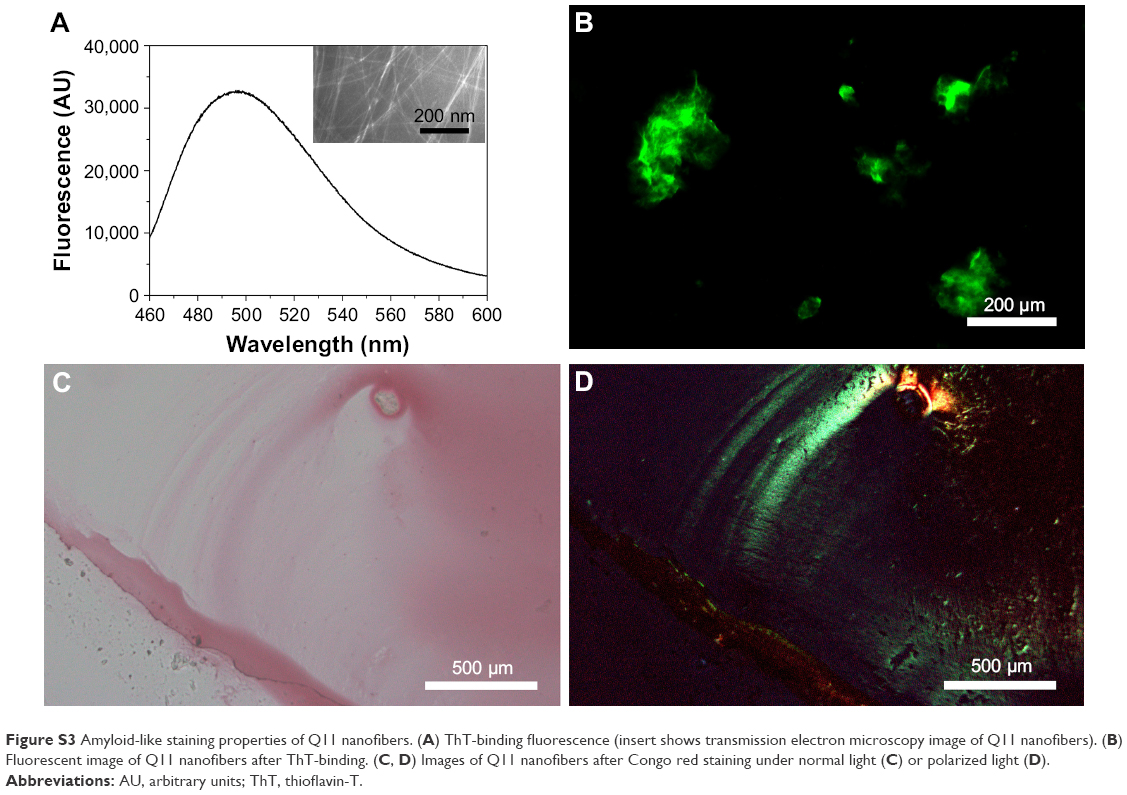 | Figure S3 Amyloid-like staining properties of Q11 nanofibers. (A) ThT-binding fluorescence (insert shows transmission electron microscopy image of Q11 nanofibers). (B) Fluorescent image of Q11 nanofibers after ThT-binding. (C, D) Images of Q11 nanofibers after Congo red staining under normal light (C) or polarized light (D). |
 © 2018 The Author(s). This work is published and licensed by Dove Medical Press Limited. The full terms of this license are available at https://www.dovepress.com/terms.php and incorporate the Creative Commons Attribution - Non Commercial (unported, v3.0) License.
By accessing the work you hereby accept the Terms. Non-commercial uses of the work are permitted without any further permission from Dove Medical Press Limited, provided the work is properly attributed. For permission for commercial use of this work, please see paragraphs 4.2 and 5 of our Terms.
© 2018 The Author(s). This work is published and licensed by Dove Medical Press Limited. The full terms of this license are available at https://www.dovepress.com/terms.php and incorporate the Creative Commons Attribution - Non Commercial (unported, v3.0) License.
By accessing the work you hereby accept the Terms. Non-commercial uses of the work are permitted without any further permission from Dove Medical Press Limited, provided the work is properly attributed. For permission for commercial use of this work, please see paragraphs 4.2 and 5 of our Terms.