")
Back to Journals » Diabetes, Metabolic Syndrome and Obesity » Volume 12
Ambient air pollution exposure and obesity-related traits in Korean adults
Authors Hwang SE , Kwon H , Jeong SM, Kim HJ, Park JH
Received 9 March 2019
Accepted for publication 23 July 2019
Published 9 August 2019 Volume 2019:12 Pages 1365—1377
DOI https://doi.org/10.2147/DMSO.S208115
Checked for plagiarism Yes
Review by Single anonymous peer review
Peer reviewer comments 2
Editor who approved publication: Professor Ming-Hui Zou
Seo Eun Hwang,*,1 Hyuktae Kwon,*,1 Su-Min Jeong,1 Hyun-Jin Kim,2 Jin-Ho Park1,3
1Department of Family Medicine, Seoul National University Hospital, Seoul, South Korea; 2Big Data Center, National Cancer Control Institute, National Cancer Center, Goyang, South Korea; 3Department of Family Medicine, Seoul National University College of Medicine, Seoul, South Korea
*These authors contributed equally to this work
Purpose: Although some studies have tried to determine the impact of long-term air pollution exposure on obesity, they have mainly focused on body mass index (BMI) and the results are inconsistent. Therefore, we investigated the association of annual ambient air pollution exposure with various obesity traits, including computed tomography-measured abdominal fatness, in a large Korean adult population.
Patients and methods: A total of 5,114 participants who underwent routine health check-ups at Seoul National University Hospital were included in the analysis. We calculated the annual average concentrations of ambient air pollutants, such as particulate matter ≤10 μm in diameter (PM10) and nitrogen dioxide (NO2), using the individual’s zip code. Obesity-related indicators included the BMI, waist circumference (WC), percent body fat (PBF), total adipose tissue (TAT), visceral adipose tissue (VAT), and subcutaneous adipose tissue (SAT).
Results: The mean age of the population was 53.5 and 70.9% were men. The mean annual concentrations of PM10 and NO2 were 49.4 μg/m3 and 30.3 ppb, respectively. In the full covariates model, adjusted for demographic and clinical variables, interquartile range increase in annual average concentration of PM10 and NO2 was not associated with any obesity-related phenotypes including BMI, WC, PBF, TAT, VAT, and SAT (all P>0.05). Likewise, no significant association between air pollutants and obesity-related traits was observed in any subgroups, stratified by sex and age (all P>0.05).
Conclusion: Annual exposure to ambient air pollution is not associated with any obesity-related traits in Korean adults.
Keywords: air, pollution, particulate, matter, obesity, abdominal adiposity
Introduction
Air pollution and obesity are becoming global problems worldwide. According to data from the WHO, nine out of ten people breath air containing high levels of pollution1 and one in nine deaths worldwide is caused by air pollution.2 Many studies have reported that ambient air pollution from smoking, vehicles, and indoor and industrial environment is a risk factor for several health outcomes such as respiratory disease,3,4 cardiovascular disease,5–7 cerebrovascular disease,8 various cancers, and cognitive disorders.9–12 Obesity, defined as abnormal or excessive fat accumulation, is also a well-documented risk factor for these diseases, leading to premature death.13
The fact that both long-term air pollution exposure and obesity share the same risk factors for previously mentioned chronic diseases implies meaningful clinical interplay between two factors. However, there are only a few studies which have investigated the association of air pollution with obesity, showing inconsistent findings. According to a recent systematic review regarding the impact of ambient air pollution on obesity, the reported association between air pollution and body weight status tends to vary by sex, age group (ie, children vs adults), and type of air pollutant.14 A study conducted in China showed a positive correlation between air pollution such as particulate matter ≤10 μm in diameter (PM10), nitrogen dioxide (NO2), and ozone (O3) and body mass index (BMI),15 but other studies did not show any relationship between ambient air pollution and obesity measured by BMI or waist circumference (WC).16,17 Furthermore, there is little published evidence regarding the association of air pollution with fat amount and distribution amount such as percent body fat (PBF) or abdominal adipose tissue area measured by computed tomography (CT).
In this context, we aimed to investigate the association of annual exposure of ambient air pollution with obesity traits using various parameters such as BMI, WC, PBF, and CT-measured abdominal fat mass in Korean adults.
Materials and methods
Study population
The participants were recruited at the two health care centers of Seoul National University Hospital from 2006–2014.18 They received periodic screening health check-ups and answered a questionnaire about their own and their family’s medical histories, current medication, and lifestyle. A total of 5,135 participants who underwent screening health check-upsincluding abdominal fat CT were included. Participants who did not undergo WC (N=10) and body composition (N=11) measurements were excluded. Therefore, a total of 5,114 samples were included in the final analysis. This study was approved by the Institutional Review Board of the Seoul National University Hospital Biomedical Research Institute and the Institutional Review Board waived the need for informed consent as the researchers accessed only de-identified databases for analytical purposes. This study was conducted in accordance with the Declaration of Helsinki.
Assessment of obesity
To assess obesity level, we included various obesity-related parameters, including BMI, WC, PBF, total adipose tissue (TAT), visceral adipose tissue (VAT), and subcutaneous adipose tissue (SAT). Height and body weight were measured using Inbody 720® (Biospace, Korea), and BMI was calculated as weight in kilograms (kg) divided by height in meters squared (m2). The WC was measured by a well-trained nurse at the midpoint between the lower costal margin and the iliac crest in centimeters. Total fat mass and PBF were measured by bioelectrical impedance analysis. TAT area and VAT area were measured at the umbilical level by CT. The cross-sectional surface area of abdominal fat was calculated using Rapidia 2.8 CT software (INFINITT, Seoul, Korea) automatically19 and the VAT area was defined as intra-abdominal fat bound by the parietal peritoneum or transversalis fascia, excluding the vertebral column and paraspinal muscle.20 The SAT was calculated by subtracting VAT area from the TAT area.19
Air pollution exposure
In order to estimate the level of exposure to ambient air pollution like PM10 and NO2, the real-time monitoring data of ambient air pollution collected from about 300 atmospheric monitoring sites nationwide by the Ministry of the Environment of Korea (https://www.airkorea.or.kr) were used. The number of nationwide monitoring sites has increased gradually from 250 in 2006 to 317 in 2014 (Table S1). The data included concentrations measured every 24 hours from January 1, 2006 to December 31, 2014 at each monitoring site. The annual average concentrations of ambient air pollutants at each monitoring site were calculated for each year, incorporating real-time monitoring data per hour (ie, 24 hours per day for 365 days). These average values were calculated after excluding the missing values in the air quality data. To estimate the level of exposure to ambient air pollution for each individual, the annual average concentration was calculated by matching each monitoring station nearest to the subject’s home via postal codes. We applied the annual average concentrations corresponding to each subject’s examination year. Because the postal codes used here reflect actual residence address, almost all subjects included in our study were local residents, not outlander.
Potential covariates
Potential covariates for the associations between ambient air pollution and obesity were investigated. Demographic data, including age, sex, smoking status, alcohol consumption, and regular physical activity were obtained via a questionnaire. Smoking status was classified into never-smoker, former-smoker, and current-smoker. Alcohol consumption was coded as one of three categories: never-, former-, and current-drinker. Regular physical activity was defined as engaging in high or moderate intensity level exercise at least once a week for 30 minutes or more. Underlying disease information was obtained via a questionnaire, physical examination by a family physician, and laboratory test. Blood pressure (BP) was measured in a sitting position after at least a 5-minute rest. Venous blood samples were taken from all examinees between 8:00 and 11:00 AM after a minimum 14-hour overnight fast. All biochemical determinations were conducted in the same laboratory with standard methods. Hypertension was defined as systolic BP ≥140 mmHg or diastolic BP ≥90 mmHg, or taking antihypertensive drugs. Diabetes was defined as fasting glucose ≥126 mg/dL or HbA1c ≥6.5%, or diabetes treatment including oral hypoglycemic agents or insulin. Dyslipidemia was defined as total cholesterol ≥240 mg/dL or taking lipid-lowering agents.
Statistical analysis
The continuous variables were presented with mean and SD, and a scale converted to the interquartile range (IQR) was added for PM10 and NO2 which do not follow normal distribution. The categorical variables were shown with number and percentage (%). A variable like age which is expected to have an effect on obesity-related traits was resorted to categorized variable and the characteristics of study participants according to various parameters of obesity were assessed by Pooled t-test or one-way ANOVA accordingly. The variables showing a correlation with any obesity-related parameters with P<0.05 were defined as confounding variables and included in further multiple linear regression analysis to identify the association between exposure to ambient air pollution and obesity-related parameters. The results were indicated as beta coefficients and 95% CIs for obesity in an unadjusted model and two adjusted models: Model 1, adjusted for age and sex, Model 2, adjusted for Model 1 plus smoking status (never-, former-, or current-smokers), alcohol consumption (never-, former-, or current-drinker), physical activity (yes or no) and underlying hypertension, diabetes, and dyslipidemia. To examine the effects of ambient air pollution on obesity according to sex and age, we performed subgroup analysis, stratified by two sex (men or women) groups and three age (<50, 50–65, or ≥65) levels. To determine whether the variable average air pollutants levels have resulted in the inconsistent relationships between air pollutants and obesity, we performed an additional analysis in extreme subgroup of lowest 10th percentile and highest 10th percentile of air pollution concentration distribution. All analyses were performed with STATA 14.0, and the statistical significance level was set at α=0.05.
Results
The detailed characteristics of the subjects (N=5,114) are shown in Table 1. Of the final study population, 3,625 (70.9%) were men and 1,489 (29.1%) were women, and the mean age was 53.5 (SD=9.2). Mean values for BMI, WC, and PBF were 24.2 kg/m2 (SD=3.0), 86.7 cm (SD=86.7), and 24.8% (SD=6.0), respectively. Approximately 61% were current-drinkers and 25.2% were current-smokers. More than half of the total (56.1%) was not doing regular exercise. The proportions of the population who had hypertension, diabetes, and dyslipidemia were 36.7%, 13.0%, and 23.2%, respectively. The mean concentrations of PM10 and NO2 were 49.5 μg/m3 (SD=7.9) and 30.3 ppb (SD=12.5), and the IQRs of each were 10 μg/m3 and 14 ppb, respectively.
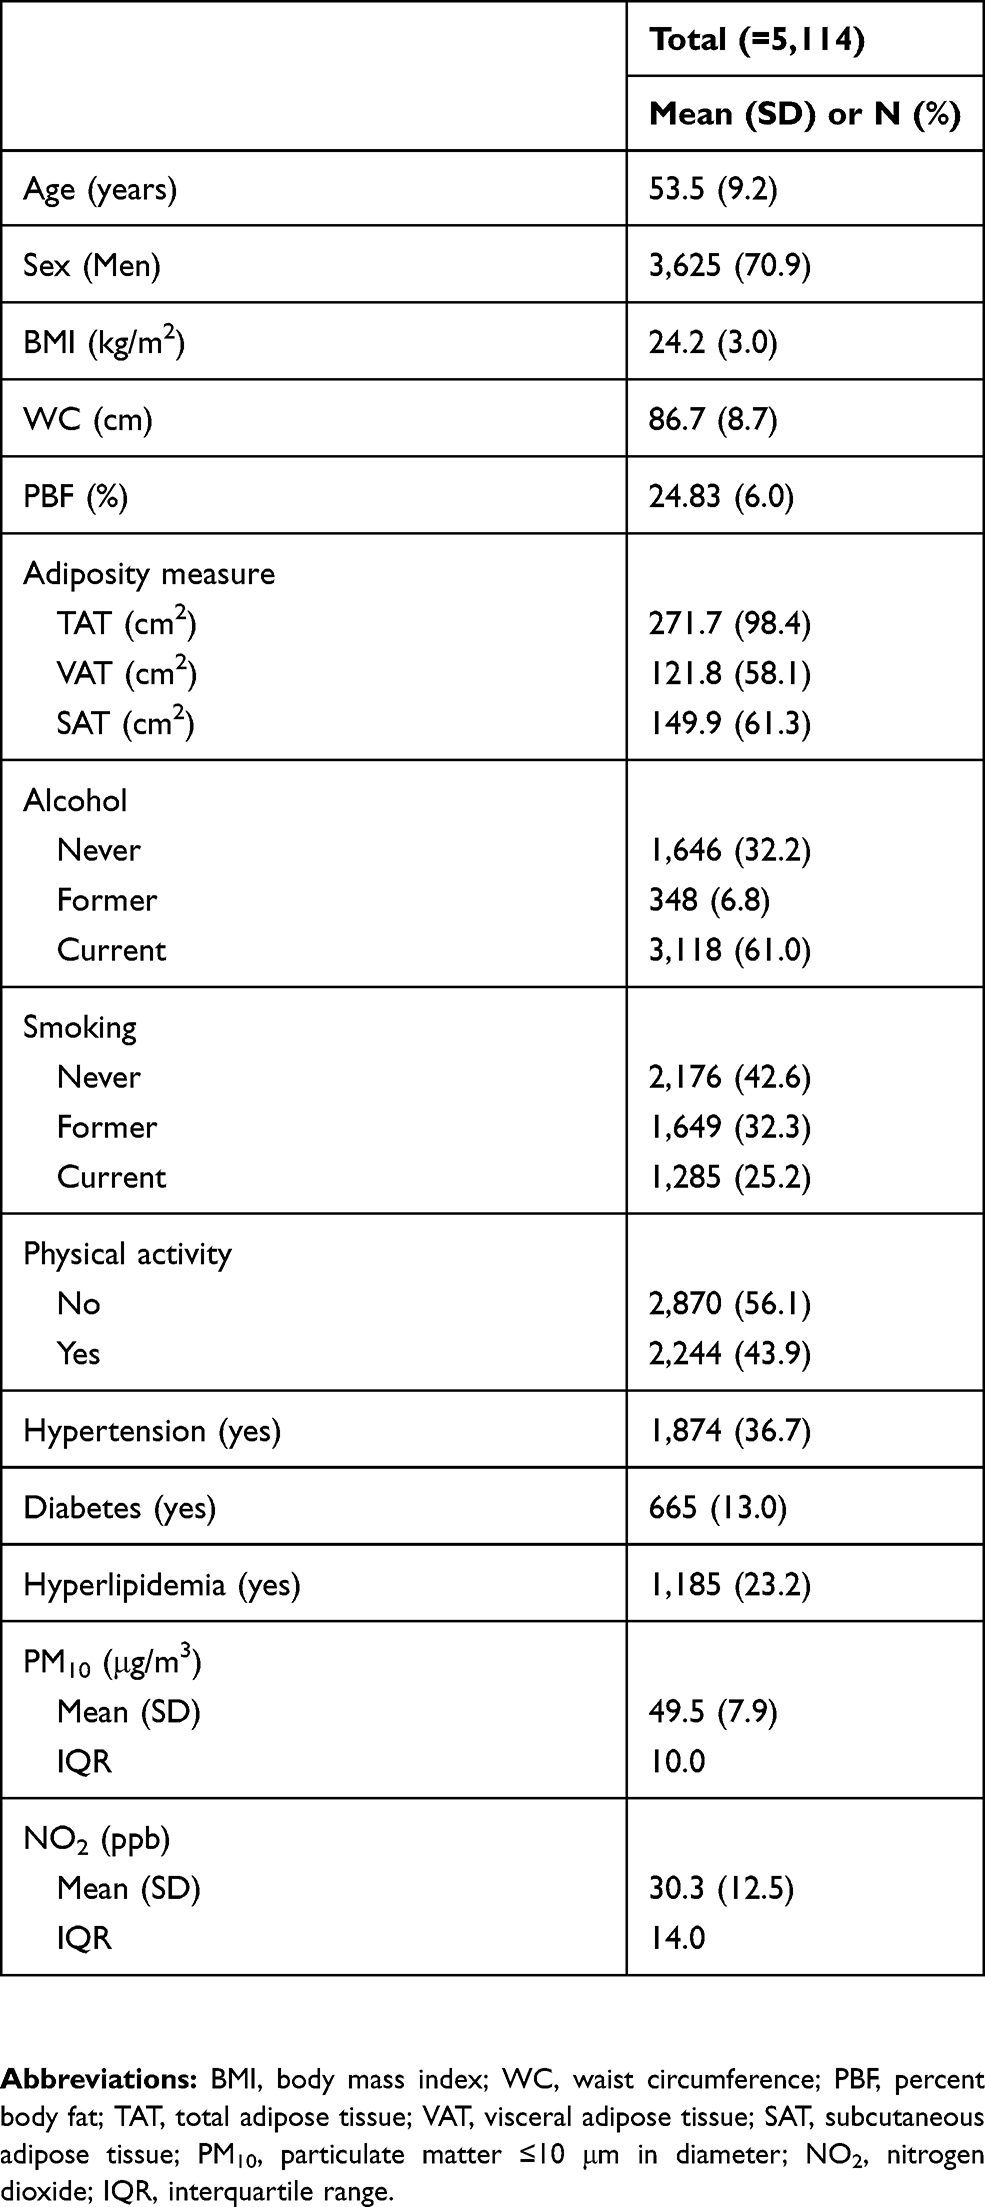 |
Table 1 Characteristics of study participants (N=5,114) |
Table 2 shows simple correlations between each demographic characteristic and obesity parameters. As age increased, BMI decreased and all the indicators of fatness except SAT increased. Men had higher BMI, WC, and VAT but women had higher PBF and SAT. Current-drinkers also had higher BMI, WC, TAT, and VAT but never-drinkers tended to have higher PBF and more subcutaneous fat. The population who did regular physical activity had significantly lower PBF and less TAT and SAT. The patients who had hypertension, diabetes or dyslipidemia tended to show a higher level of obesity parameters, and all were significant except SAT in diabetic participants.
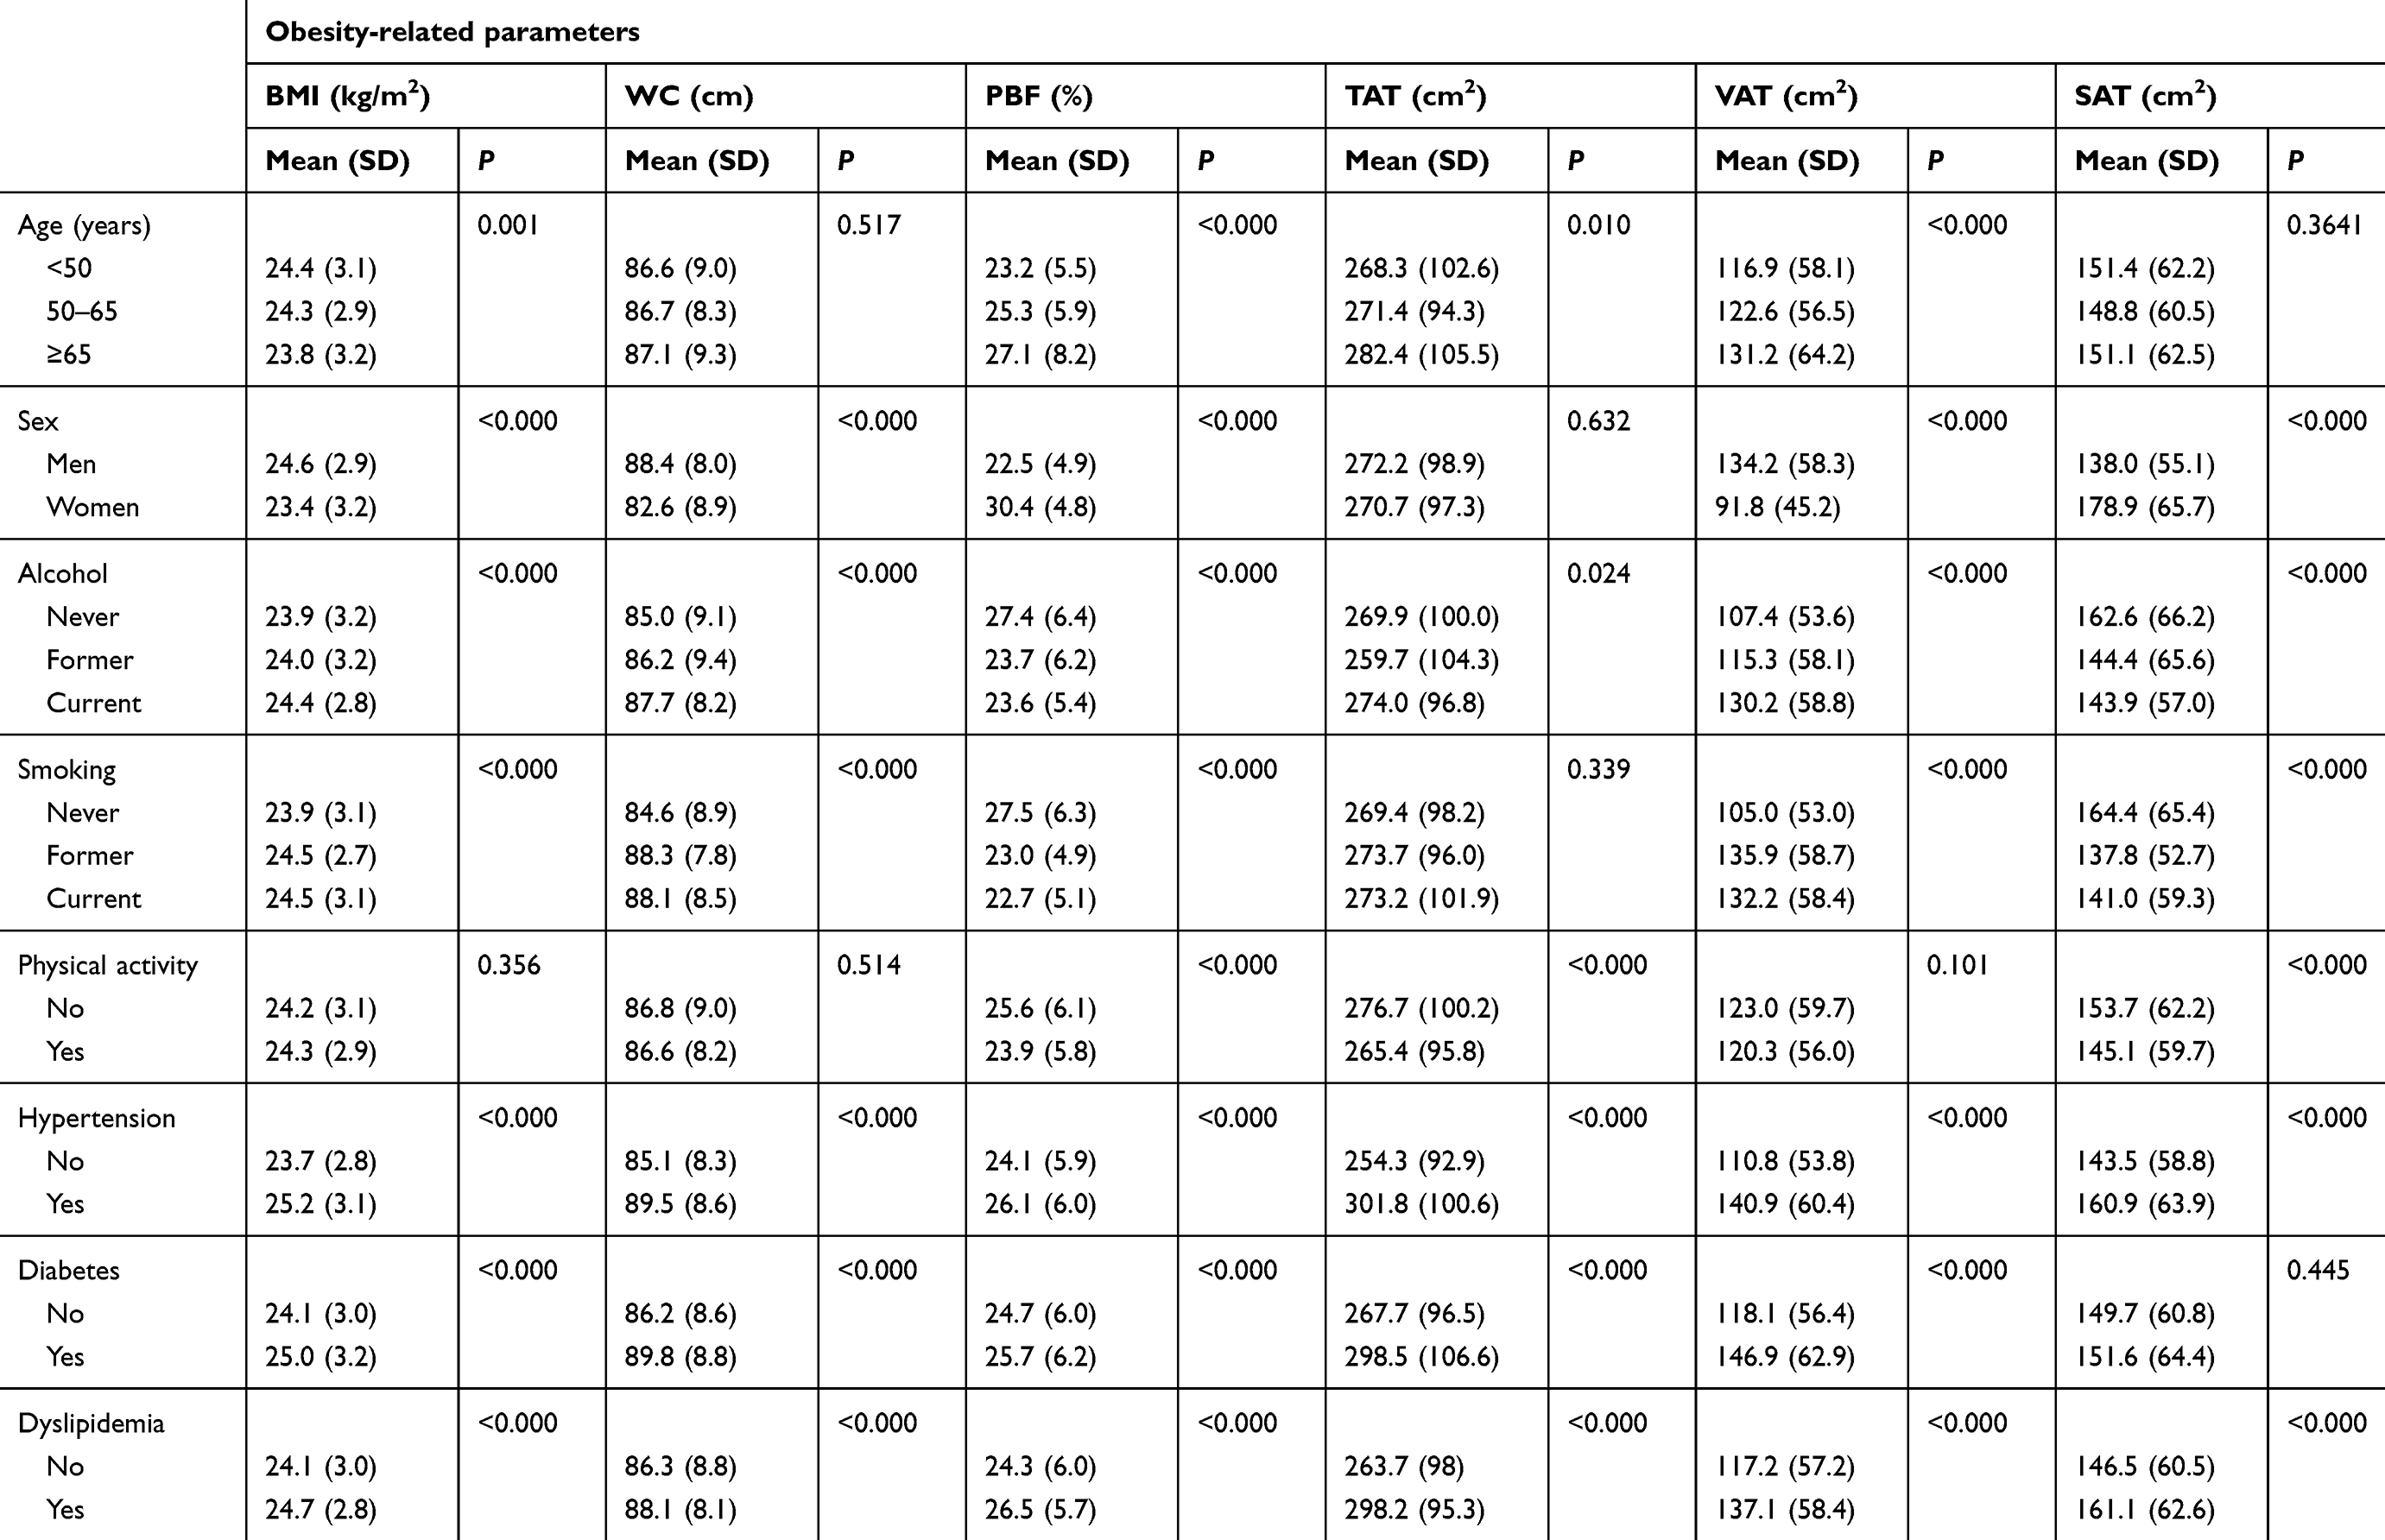 |
Table 2 Simple correlations between demographic characteristics and the degree of obesity |
The estimated associations between IQR increase in ambient air pollution and various obesity parameters were presented in Table 3. In univariate regression analysis, PM10 showed positive correlation with PBF, but it was no longer significant in the adjusted models. In multivariate linear regression analysis, two kinds of statistical adjustment models defined by the confounding variables levels were applied. In both adjustment models, both PM10 and NO2 levels had no significant association with any kind of obesity parameter including BMI, WC, PBF, TAT, VAT, and SAT (all P>0.05). In analysis further stratified by sex and age, there were positive correlations of PM10 with WC in women, and PBF and TAT in the elderly group aged 65 in unadjusted model. However, no significant interaction by sex or age was detected in the fully adjusted model (Tables 4 and 5). In addition, we identified the association for each extreme group of lower 10% and upper 10% of the air pollution concentration distribution (Tables S2 and S3). The average levels of PM10 in each group were 37.04 and 65.12 respectively, indicating the narrow range between both extreme groups. The association results in the two extreme groups were consistent, showing no statistical significance in both groups.
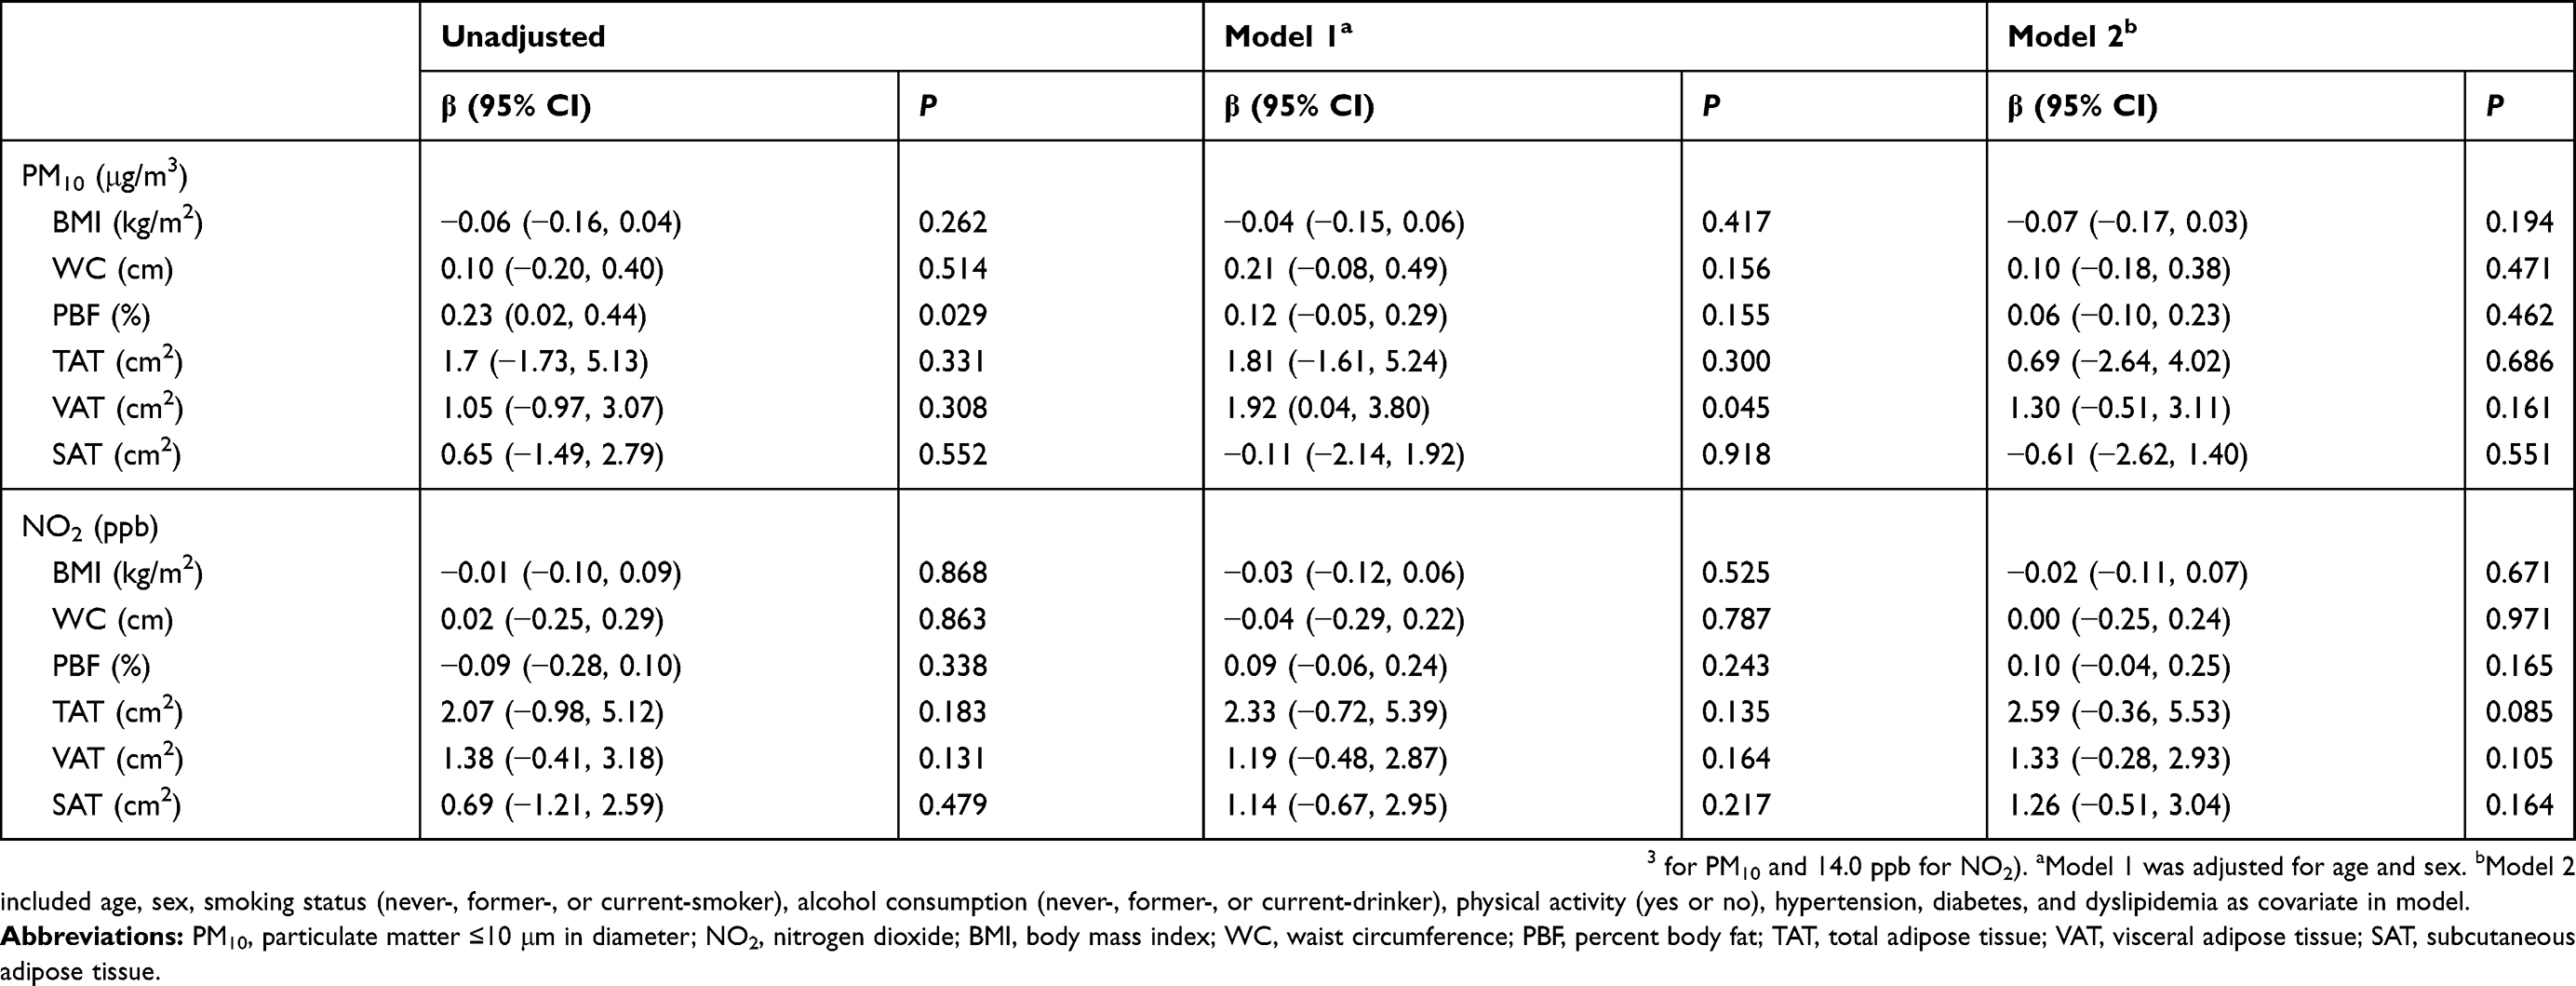 |
Table 3 Estimated associations of IQR increases in annual average air pollution and obesity scales |
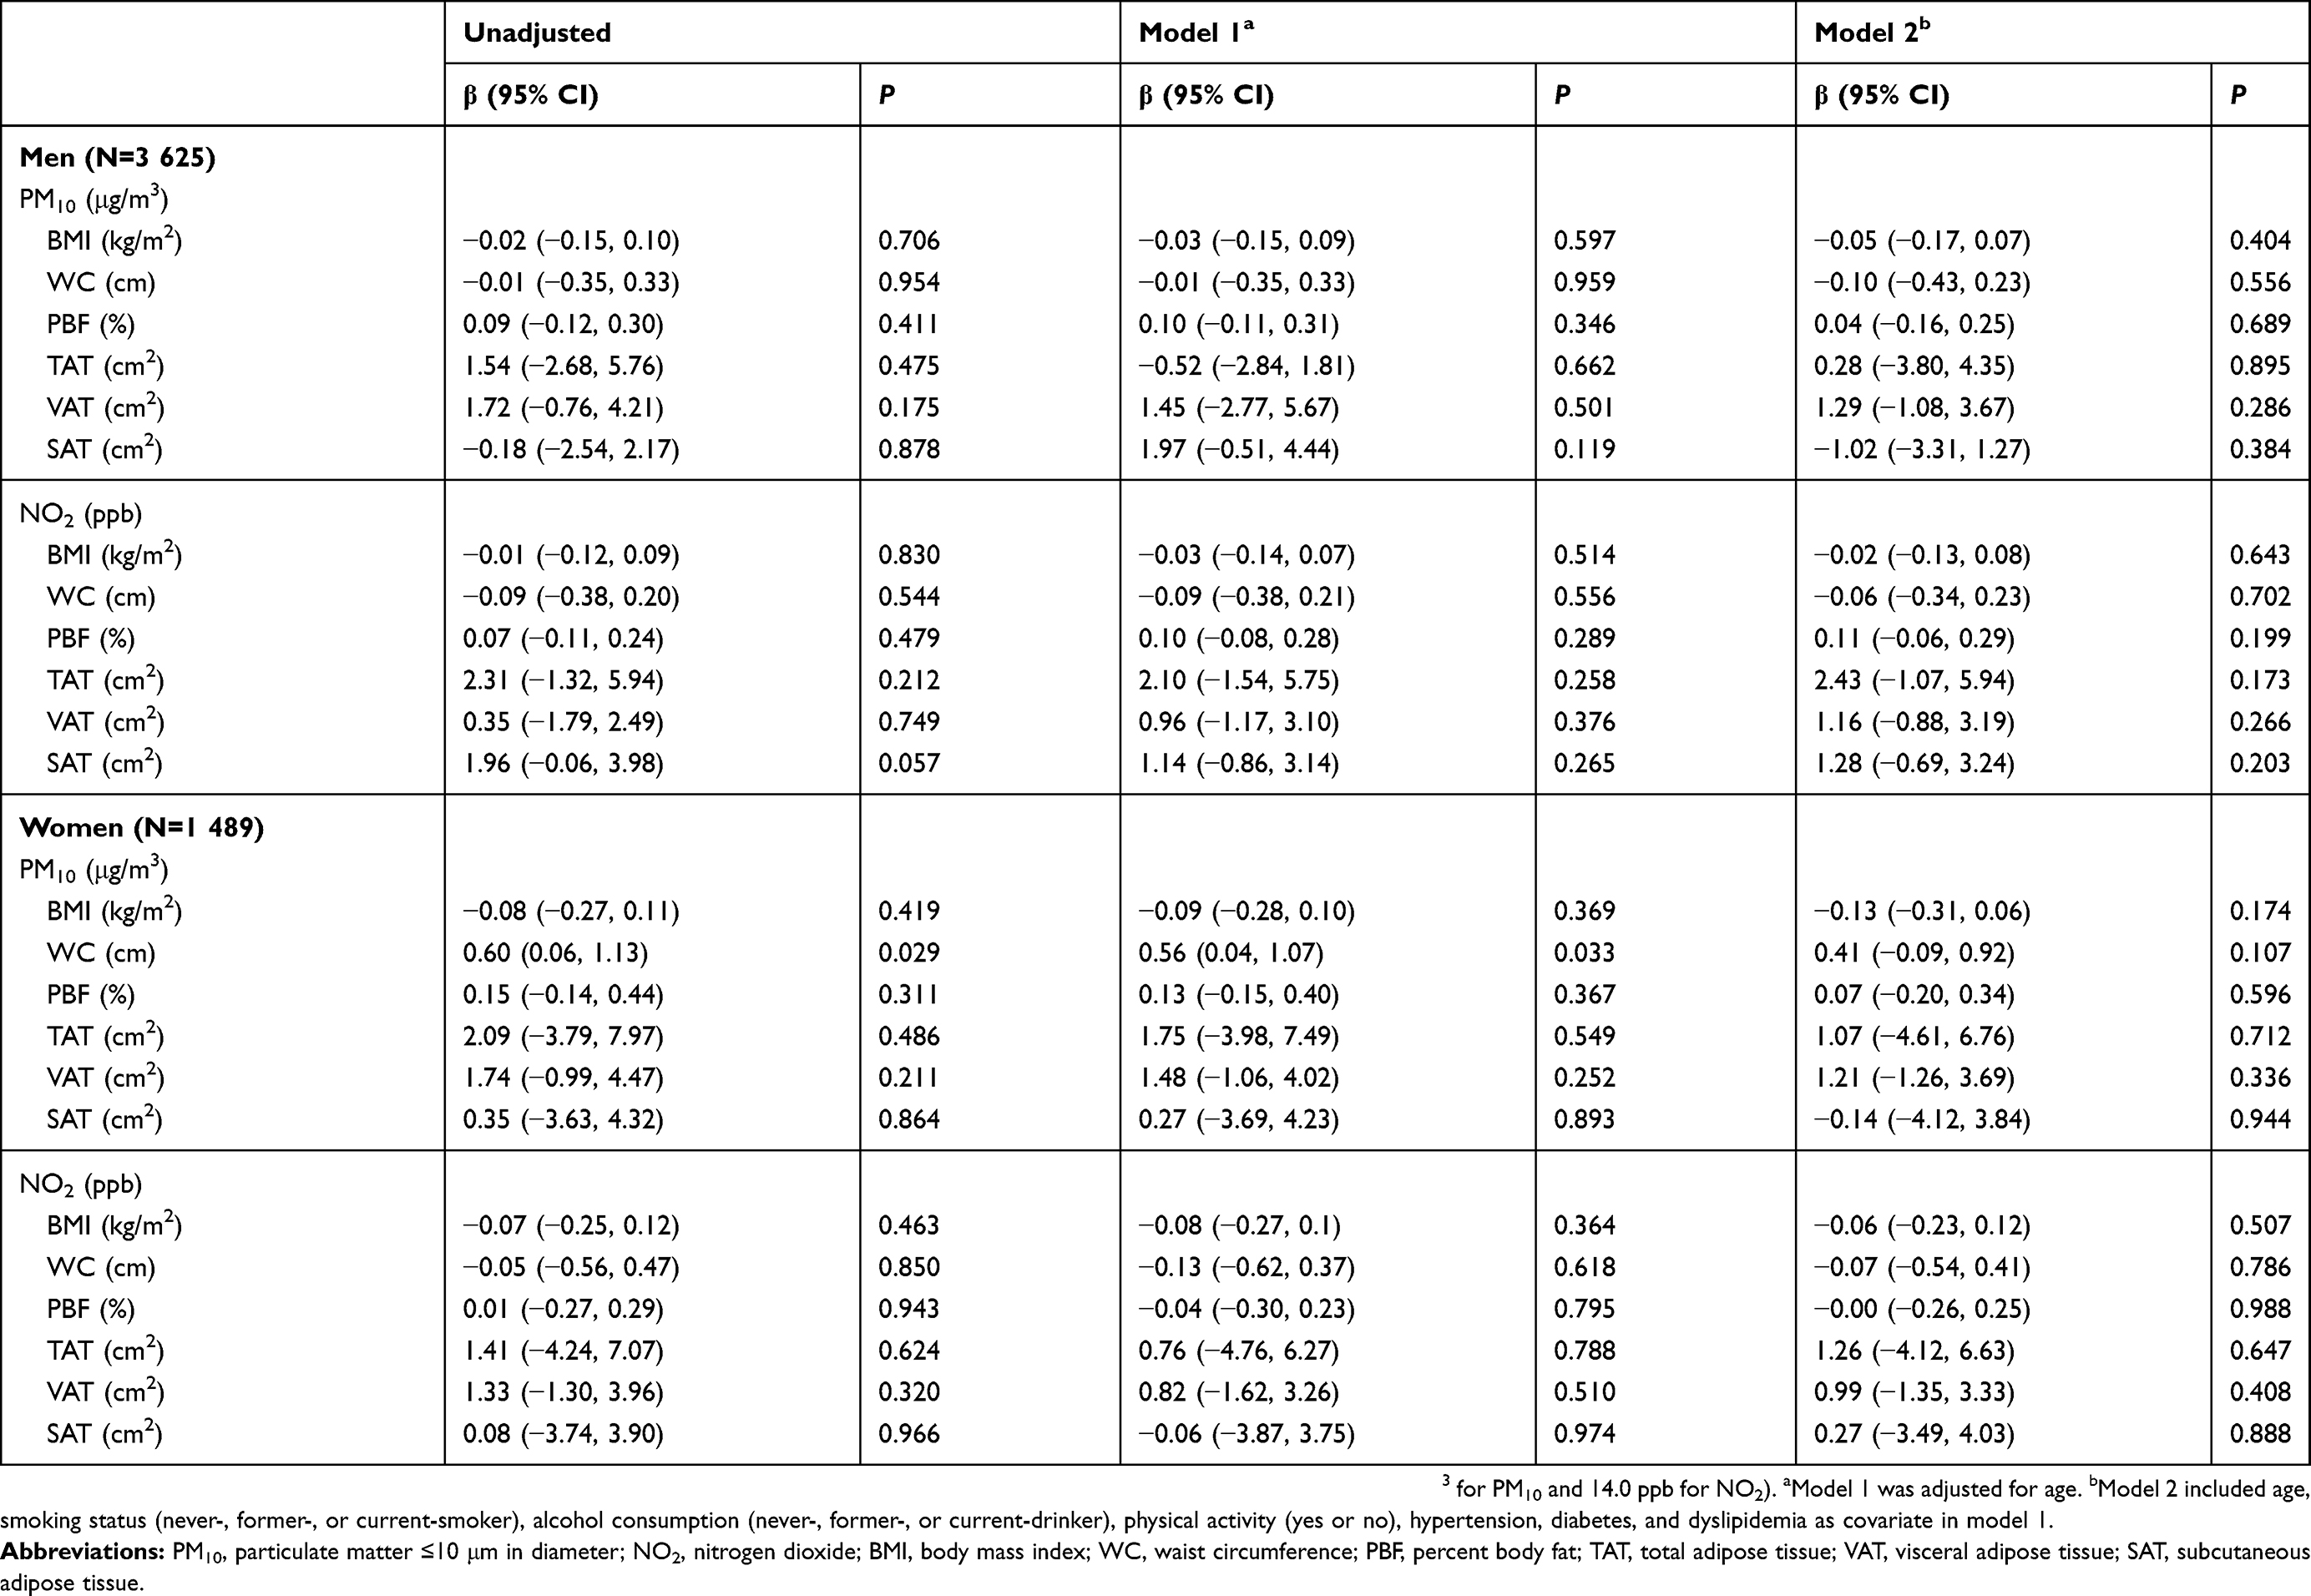 |
Table 4 Estimated associations of IQR increases in annual average air pollution and obesity scales by sex |
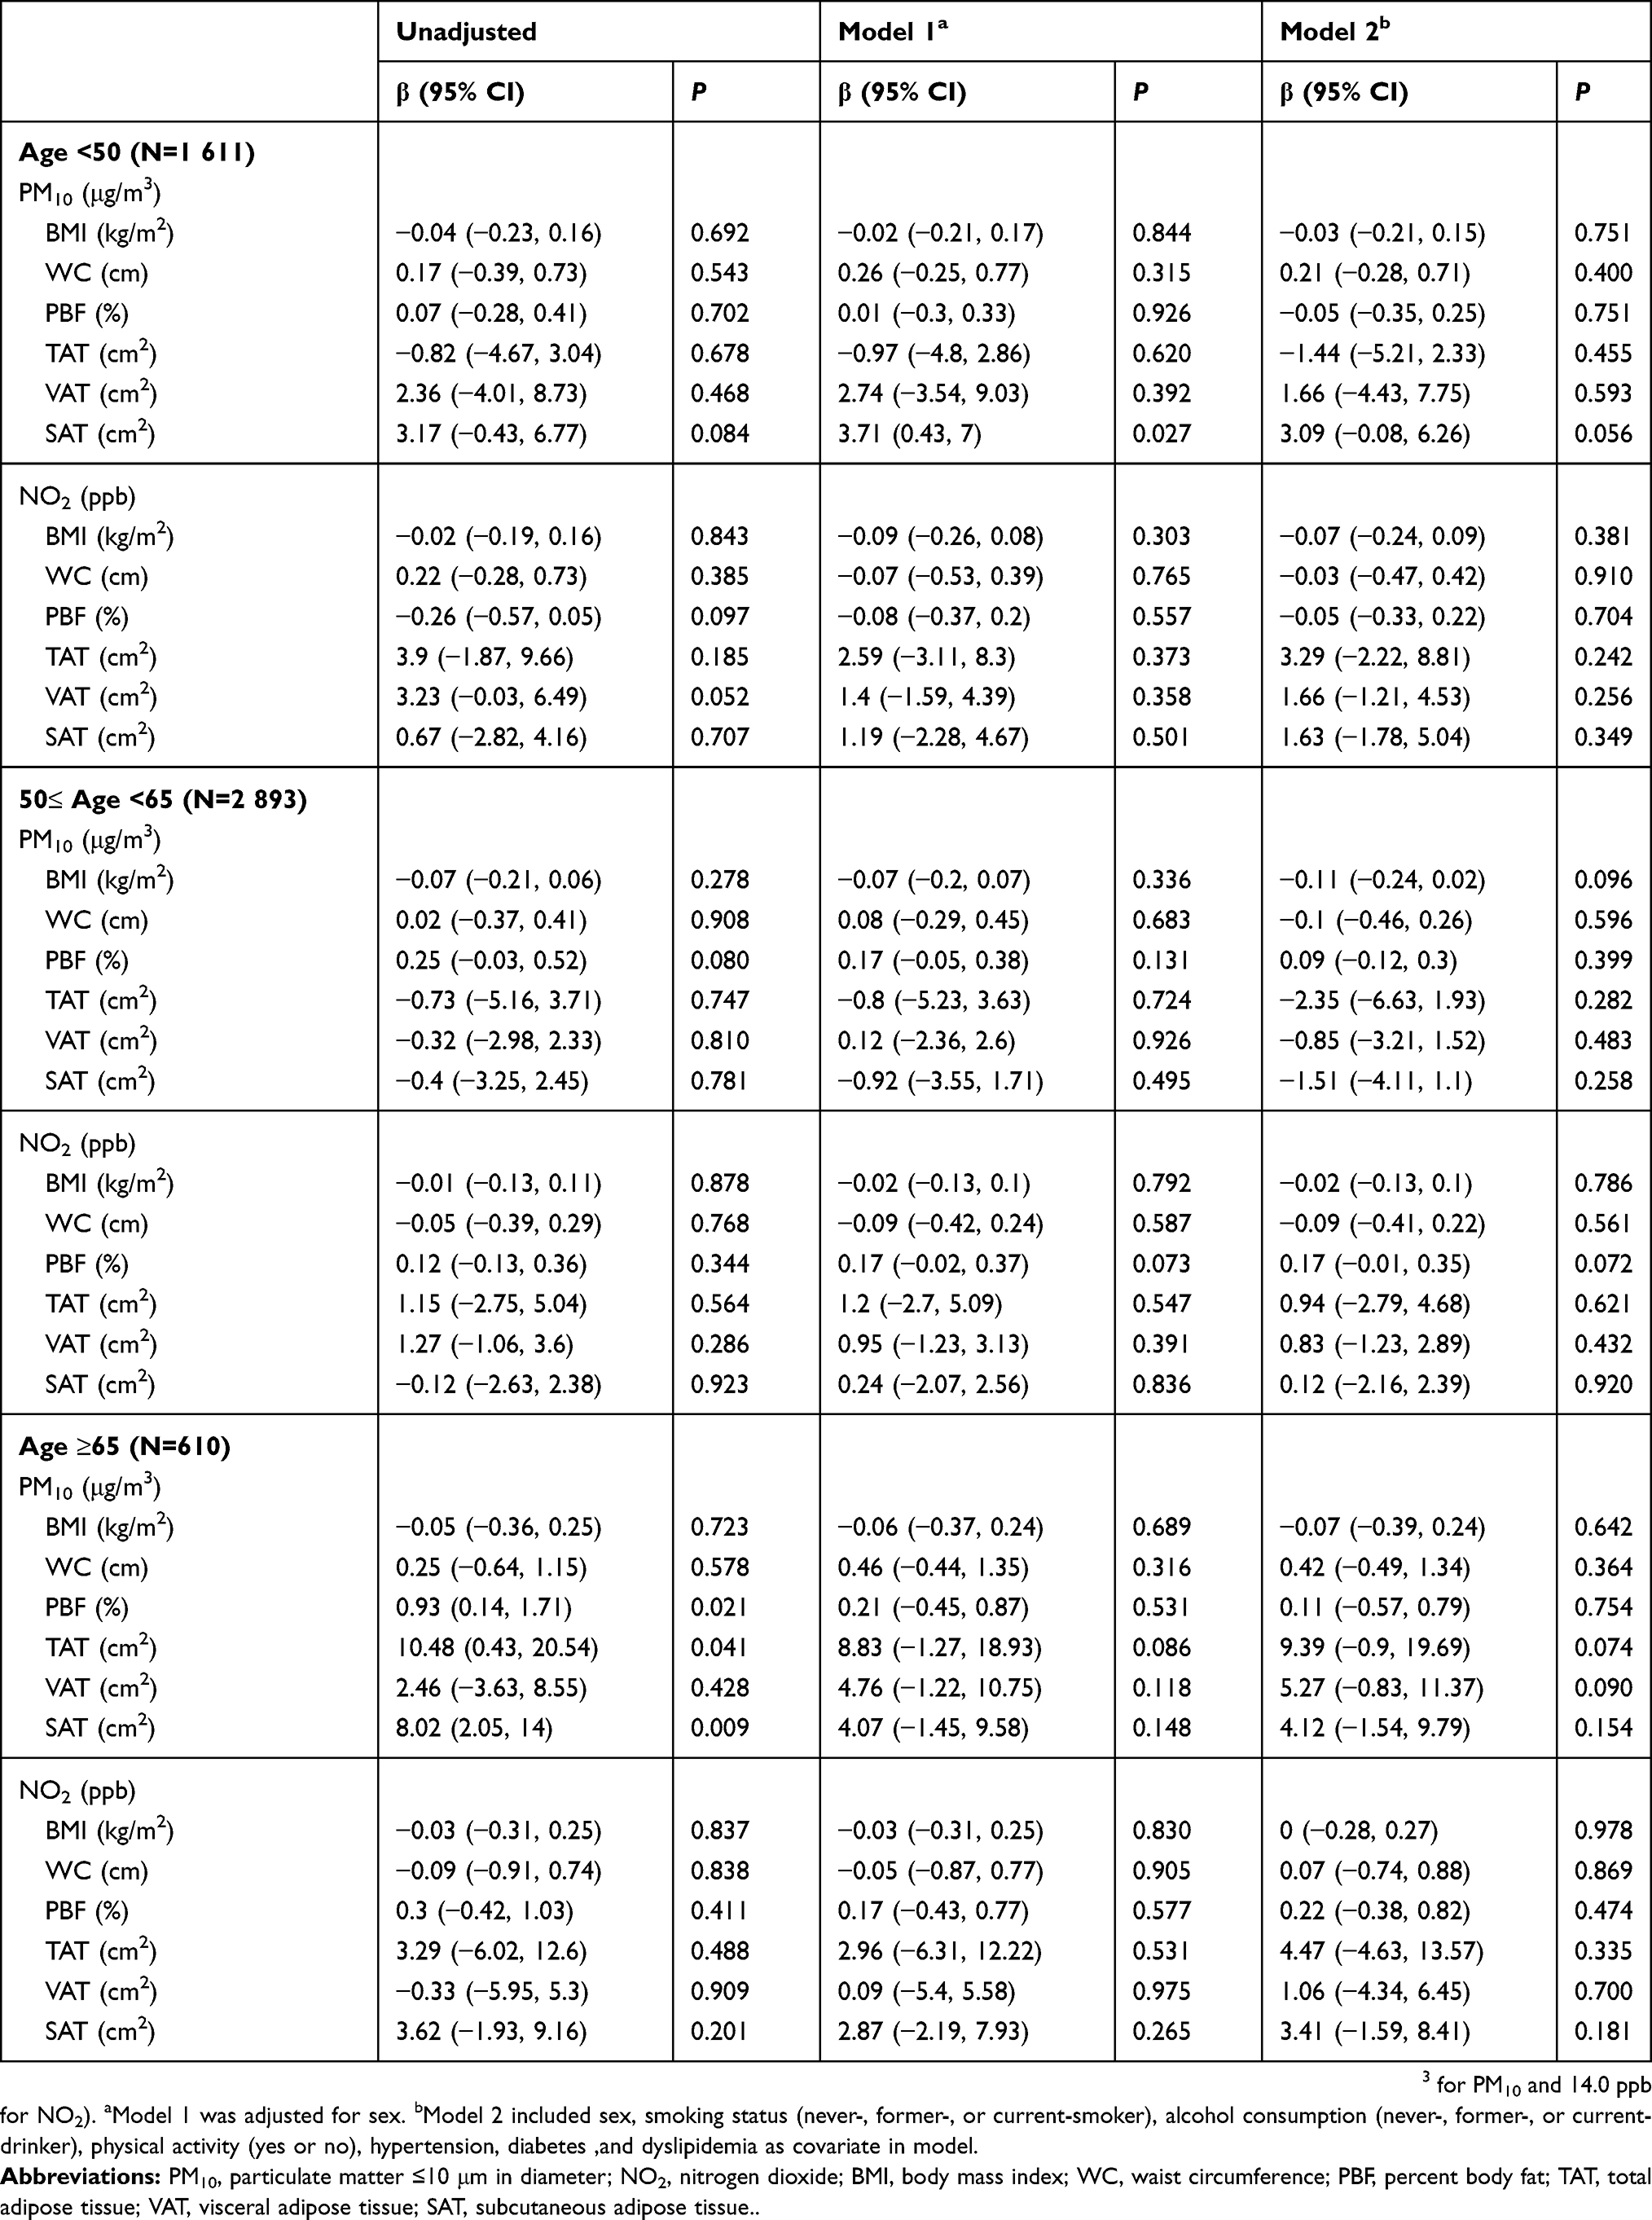 |
Table 5 Estimated associations of IQR increases in annual average air pollution and obesity scales by age |
Discussion
In this study, we investigated the associations between ambient air pollution and various parameters of obesity in Korean adults, and found only null associations between ambient air pollution and various kinds of obesity parameters. These results suggest ambient air pollution, including PM10 and NO2, does not directly affect obesity, including fat distribution.
Previous studies on the association between air pollution and obesity have reported inconsistent results.14–17 According to a recent systematic review, among a total of 66 reported associations between air pollutants including PM, NO2, sulfur dioxide, O3, and overall air quality and body weight status in 16 selected pieces of research, 29 (44%) showed positive correlations of air pollution regarding body weight, 29 (44%) reported null findings, and the other eight (12%) found negative associations.14 Although it was suggested that the results were different according to sex, age, and type of air pollutant, our study showed no difference according to the two types of air pollutants, sex, or different age groups in adults.
The average concentration level of air pollution, especially PM10, may explain the difference in the results of previous studies regarding the relationship between air pollution and obesity. Some studies in China showed that exposure to a higher level of PM10 was significantly correlated with higher obesity prevalence measured by BMI.15,21 In these studies, data were collected at some limited monitoring centers in a highly industrial area and the mean concentration of PM10 was higher than 120 μg/m3. However, other studies in Italy and Switzerland showed no association between PM10 and BMI or WC.22,23 The mean concentrations of PM10 in these studies were all around 50 μg/m3 or less. In our study, the mean level of PM10 was 49.5 μg/m3 which was much lower than those in Chinese studies and similar to those in the latter ones. To clarify the discrepancy of associations according to the air pollution level, we conducted stratification analysis in subgroups of both extremes of the air pollution distribution and found a consistent null association. This result may be due to the fact that even in the highest 10th percentile, the mean concentration of PM10 (65.12 μg/m3) was much lower than those in Chinese studies (>120 μg/m3),15,21 and this inconsistency could indicate that air pollution exposure affects obesity only at a very high level of air pollution beyond certain thresholds. Therefore, further association studies with high and low air pollution levels are needed.
Regarding the parameters of obesity, most previous studies analyzed the association between air pollution and BMI, weight or WC, and there are only a few studies on the association between air pollution and abdominal adipose tissue. A cohort study of children showed a positive association of exposure to NO2 and PM2.5 with more SAT, but there was no association with VAT.24 Another cross-sectional study on the association of distance to a major roadway and PM2.5 with adiposity measures in adults showed an association of higher SAT in those closer to a major roadway but no direct correlation with PM2.5.25 These studies showed the inconsistent correlation between air pollution and visceral adiposity, and the size of the study population was also relatively smaller than ours: 315 in the former and 2,372 in the latter. In our study of a large population of adults, it was identified that there was no association between air pollution and abdominal adipose tissue amount.
Although the biological mechanism underlying the association between air pollutants and obesity is unclear, there are some suggestions which may explain the mechanism. A study in mice suggested that the exposure to PM interacts with obesogenic nutrition to alter genes representing key response pathways such as inflammation and oxidative stress in adipose tissue.26 Another study by McConnell et al, interpreted the mechanism of the effect of air pollution on obesity as altered appetite and anxiety-associated overeating resulting in increased caloric intake or changes in basal metabolism by mitochondrial damage and increased accumulation of white adipose tissue.27 There is other evidence that the long-term exposure to ambient air pollution such as black carbon or PM2.5 is associated with higher leptin levels which is an inflammatory cytokine secreted by adipocytes and affects neuroendocrine function, immune function, metabolism, and appetite.28,29 However, this effect seems to take place only over extremely high value thresholds which are only seen in very limited areas such as certain regions of China, as previously mentioned.15,21 The null association of our study may be due to the relatively low level of air pollution in Korea. On the other hand, there is also the possibility that air pollution has no effect on meaningful fat metabolism leading to obesity. Additional mechanistic studies will help to better understand the relationship between air pollution exposure and obesity.
Although some studies indicate that air pollution directly affects obesity through inflammatory or oxidative stress mediators, air pollution seems to interact with obesity on other disease more likely rather than having direct influences on obesity, according to some studies. Similar to the mechanism of air pollution, obesity is also closely related with inflammation. As a large amount of adipose tissue disturbs adequate perfusion and undergoes apoptosis, adipose tissue-derived inflammatory mediators are generated and spill over and cause systemic inflammation.30 A study on the interaction of adiposity on the effect of air pollution showed that the effects of air pollution on lung function were significantly stronger in the high adiposity group, and suggested that the combined effects of adipose tissue and ambient air pollution on inflammation have a synergistic effect.12
There are some limitations to be addressed in this study. First, the subjects included in this study do not represent general Korean adults. Second, effects of the potential confounding factors including the nutritional intake in statistical adjustment models were insufficiently considered. Third, the air pollution level of each subject was estimated according to their residential region. In other words, it means that the possible diversity of exposure level, such as employment area, occupational exposure, in- or out-door daily activity, the distance from the monitoring station to the subjects’ home, or the residential period in the area, were not considered. Forth, we could not identify the association of PMs smaller than PM10 (eg, PM2.5) because of the lack of relevant data. Lastly, this study was conducted using a cross-sectional study design; therefore, the causality between the exposure to air pollution and obesity cannot be determined.
However, this study has elucidated several aspects. First, this study was conducted in a large population of adults not well-reported previously. Second, in contrast to most previous studies of air pollution and obesity in adults which considered only BMI or WC as obesity-related parameters, the current study showed the relationship with diverse parameters especially PBF, VAT, and SAT by using a CT scan for all. Third, we collected the concentrations of ambient air pollution at about 300 atmospheric monitoring sites nationwide so that the air pollution exposure level for each could be obtained more precisely.
In conclusion, we examined the relationship between air pollution and the diverse parameters of obesity such as BMI, WC, PBF, TAT, VAT, and SAT in Korean adults. This study demonstrated that PM10 and NO2 exposure were not significantly associated with obesity, especially abdominal fat distribution. Our findings provide the evidence that exposure to air pollution is not associated with any widely used obesity-measuring parameters. However, longitudinal studies using a more diverse level of concentration and precise air pollution exposure data consisting of both residential, employment, and leisure time activity should be conducted.
Disclosure
The authors report no conflicts of interest in this work.
References
1. Public Health, Social and Environmental Determinants of Health Department, World Health Organization.Exposure to Ambient Air Pollution from Particulate Matter for 2016. Geneva: World Health Organization; 2018.
2. Public Health, Social and Environmental Determinants of Health Department, World Health Organization.Burden of Disease from Ambient Air Pollution for 2016. Geneva: World Health Organization; 2018.
3. Stevanovic I, Jovasevic-Stojanovic M, Stosic JJ. Association between ambient air pollution, meteorological conditions and exacerbations of asthma and chronic obstructive pulmonary disease in adult citizens of the town of Smederevo. Vojnosanit Pregl. 2016;73(2):152–158.
4. Gan WQ, FitzGerald JM, Carlsten C, Sadatsafavi M, Brauer M. Associations of ambient air pollution with chronic obstructive pulmonary disease hospitalization and mortality. Am J Respir Crit Care Med. 2013;187(7):721–727.
5. Pope CA
6. Chen H, Goldberg MS, Burnett RT, Jerrett M, Wheeler AJ, Villeneuve PJ. Long-term exposure to traffic-related air pollution and cardiovascular mortality. Epidemiology. 2013;24(1):35–43.
7. Requia WJ, Adams MD, Arain A, Papatheodorou S, Koutrakis P, Mahmoud M. Global association of air pollution and cardiorespiratory diseases: a systematic review, meta-analysis, and investigation of modifier variables. Am J Public Health. 2018;108(Suppl 2):S123–S130.
8. Andersen ZJ, Kristiansen LC, Andersen KK, et al. Stroke and long-term exposure to outdoor air pollution from nitrogen dioxide: a cohort study. Stroke. 2012;43(2):320–325.
9. Oudin A, Forsberg B, Adolfsson AN, et al. Traffic-related air pollution and dementia incidence in northern sweden: a longitudinal study. Environ Health Perspect. 2016;124(3):306–312.
10. Chen H, Kwong JC, Copes R, et al. Exposure to ambient air pollution and the incidence of dementia: a population-based cohort study. Environ Int. 2017;108:271–277.
11. Pedersen M, Andersen ZJ, Stafoggia M, et al. Ambient air pollution and primary liver cancer incidence in four European cohorts within the ESCAPE project. Environ Res. 2017;154:226–233.
12. Lamichhane DK, Kim HC, Choi CM, et al. Lung cancer risk and residential exposure to air pollution: a korean population-based case-control study. Yonsei Med J. 2017;58(6):1111–1118.
13. Poirier P, Giles TD, Bray GA, et al. Obesity and cardiovascular disease: pathophysiology, evaluation, and effect of weight loss: an update of the 1997 American Heart Association Scientific Statement on Obesity and Heart Disease from the Obesity Committee of the Council on Nutrition, Physical Activity, and Metabolism. Circulation. 2006;113(6):898–918.
14. An R, Ji M, Yan H, Guan C. Impact of ambient air pollution on obesity: a systematic review. Int J Obes. 2018;42(6):1112–1126.
15. Li M, Qian Z, Vaughn M, et al. Sex-specific difference of the association between ambient air pollution and the prevalence of obesity in Chinese adults from a high pollution range area: 33 communities Chinese health study. Atmos Environ. 2015;117:227–233.
16. White LF, Jerrett M, Yu J, Marshall JD, Rosenberg L, Coogan PF. Ambient air pollution and 16-year weight change in African-American women. Am J Prev Med. 2016;51(4):e99–e105. doi:10.1016/j.amepre.2016.04.016
17. Wallwork RS, Colicino E, Zhong J, et al. Ambient fine particulate matter, outdoor temperature, and risk of metabolic syndrome. Am J Epidemiol. 2017;185(1):30–39.
18. Kim HJ, Park JH, Seo YS, et al. CYP1A1 gene polymorphisms modify the association between PM10 exposure and lung function. Chemosphere. 2018;203:353–359.
19. Kwon H, Kim D, Kim JS. Body fat distribution and the risk of incident metabolic syndrome: a longitudinal cohort study. Sci Rep. 2017;7(1):10955.
20. Nagata N, Sakamoto K, Arai T, et al. Visceral abdominal fat measured by computed tomography is associated with an increased risk of colorectal adenoma. Int J Cancer. 2014;135(10):2273–2281.
21. Dong GH, Qian Z, Liu MM, et al. Ambient air pollution and the prevalence of obesity in Chinese children: the seven northeastern cities study. Obesity. 2014;22(3):795–800.
22. Fioravanti S, Cesaroni G, Badaloni C, Michelozzi P, Forastiere F, Porta D. Traffic-related air pollution and childhood obesity in an Italian birth cohort. Environ Res. 2018;160:479–486.
23. Eze IC, Schaffner E, Foraster M, et al. Long-term exposure to ambient air pollution and metabolic syndrome in adults. PLoS One. 2015;10(6):e0130337.
24. Alderete TL, Habre R, Toledo-Corral CM, et al. Longitudinal associations between ambient air pollution with insulin sensitivity, beta-cell function, and adiposity in Los Angeles Latino children. Diabetes. 2017;66(7):1789–1796.
25. Li W, Dorans KS, Wilker EH, et al. Residential proximity to major roadways, fine particulate matter, and adiposity: the framingham heart study. Obesity. 2016;24(12):2593–2599.
26. Pardo M, Kuperman Y, Levin L, et al. Exposure to air pollution interacts with obesogenic nutrition to induce tissue-specific response patterns. Environ Pollut. 2018;239:532–543.
27. McConnell R, Gilliland FD, Goran M, Allayee H, Hricko A, Mittelman S. Does near-roadway air pollution contribute to childhood obesity? Pediatr Obes. 2016;11(1):1–3.
28. Calderon-Garciduenas L, Franco-Lira M, D’Angiulli A, et al. Mexico City normal weight children exposed to high concentrations of ambient PM2.5 show high blood leptin and endothelin-1, vitamin D deficiency, and food reward hormone dysregulation versus low pollution controls. Relevance for obesity and Alzheimer disease. Environ Res. 2015;140:579–592.
29. Wang Y, Eliot MN, Kuchel GA, et al. Long-term exposure to ambient air pollution and serum leptin in older adults: results from the MOBILIZE Boston study. J Occup Environ Med. 2014;56(9):e73–77.
30. Mancuso P. Obesity and lung inflammation. J Appl Physiol. 2010;108(3):722–728. doi:10.1152/japplphysiol.01233.2009
Supplementary materials
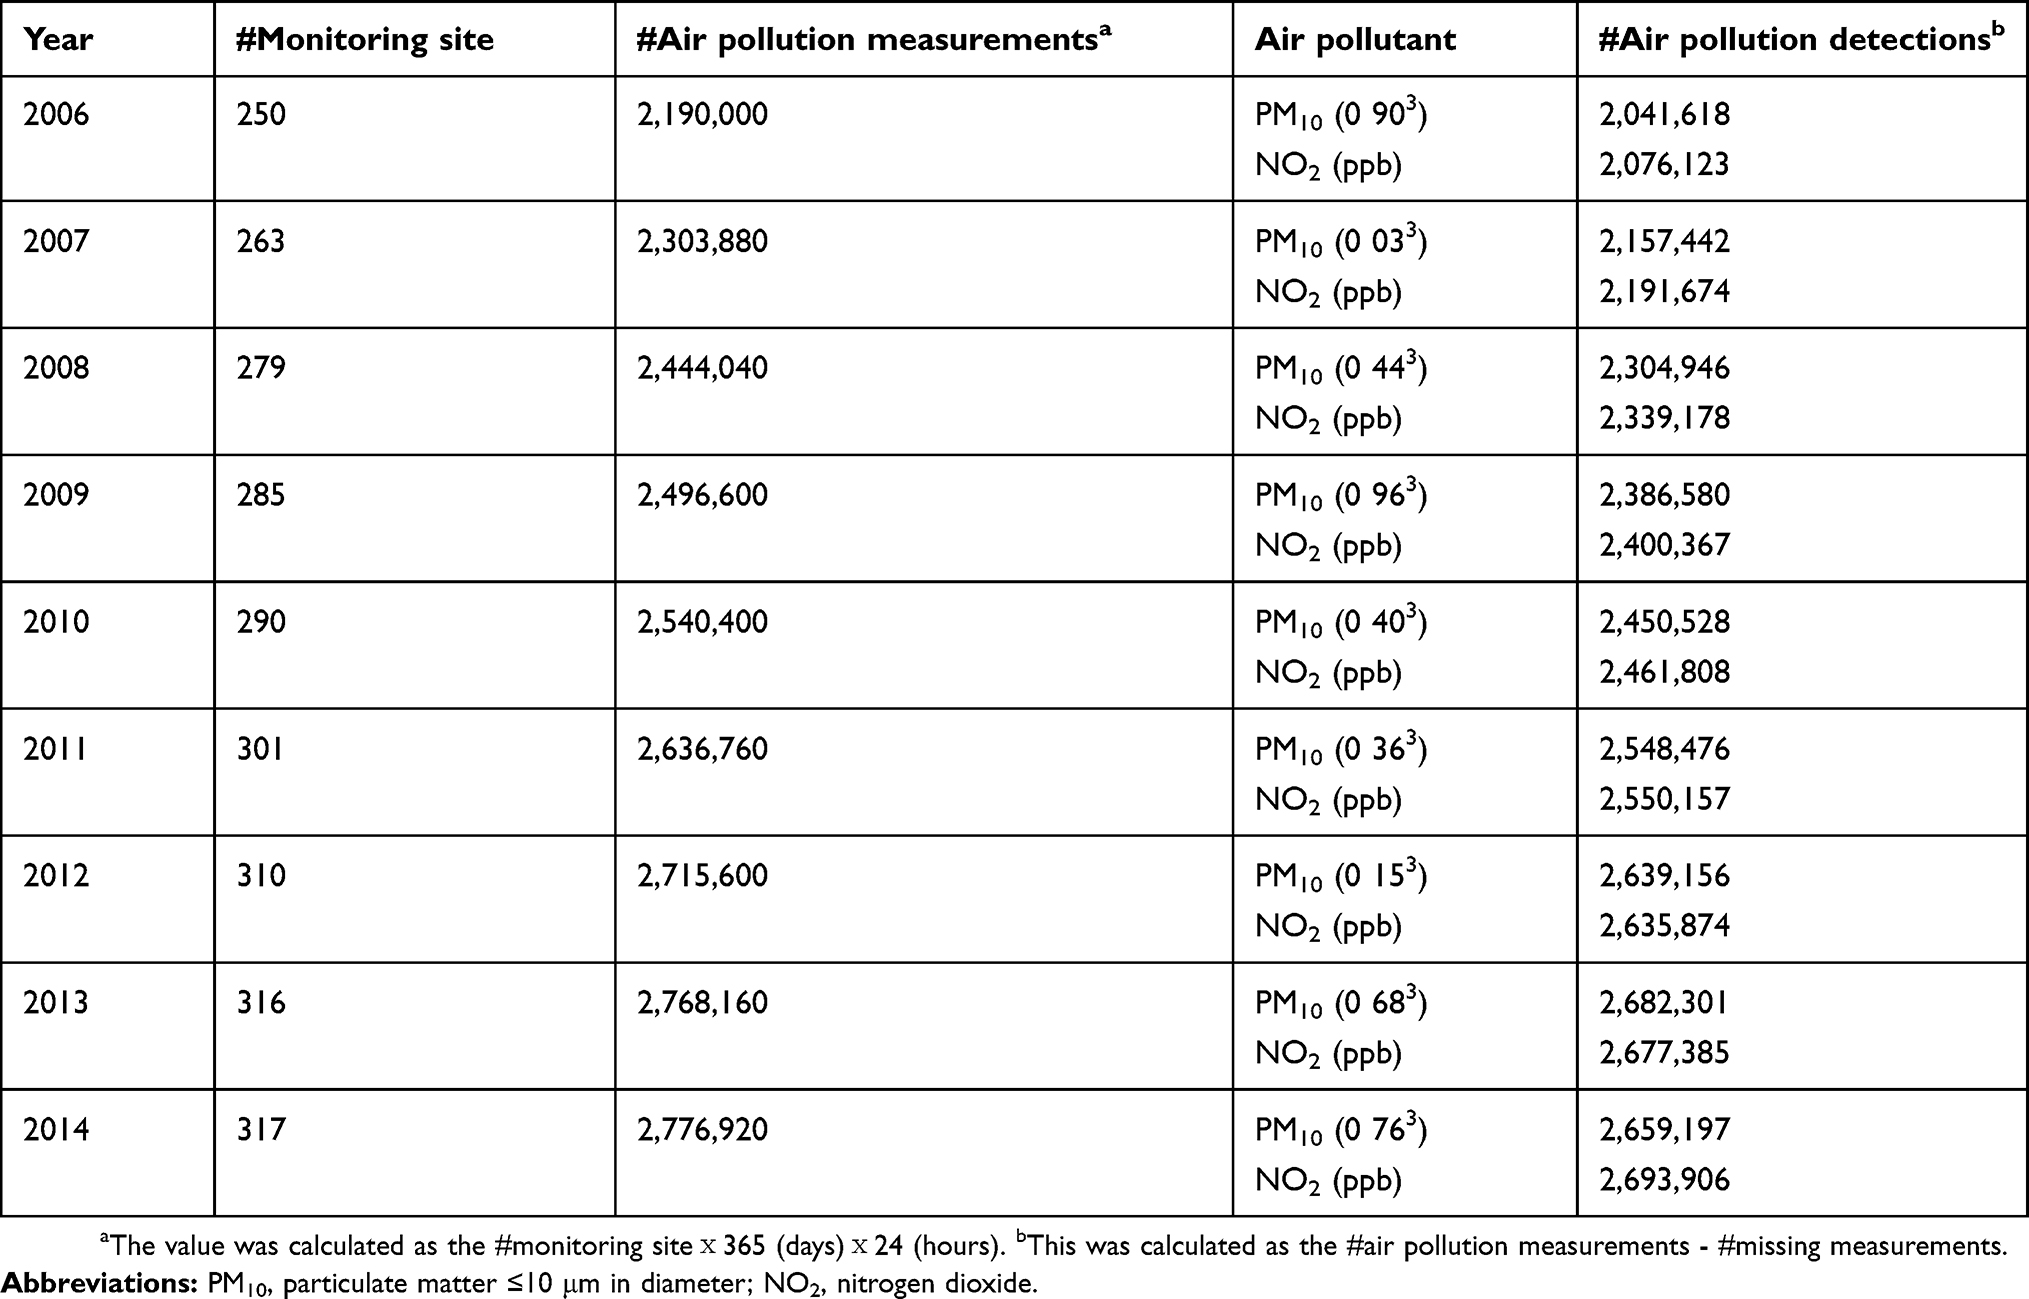 |
Table S1 Basic details of ambient air pollution measurement from the Ministry of the Environment of Korea |
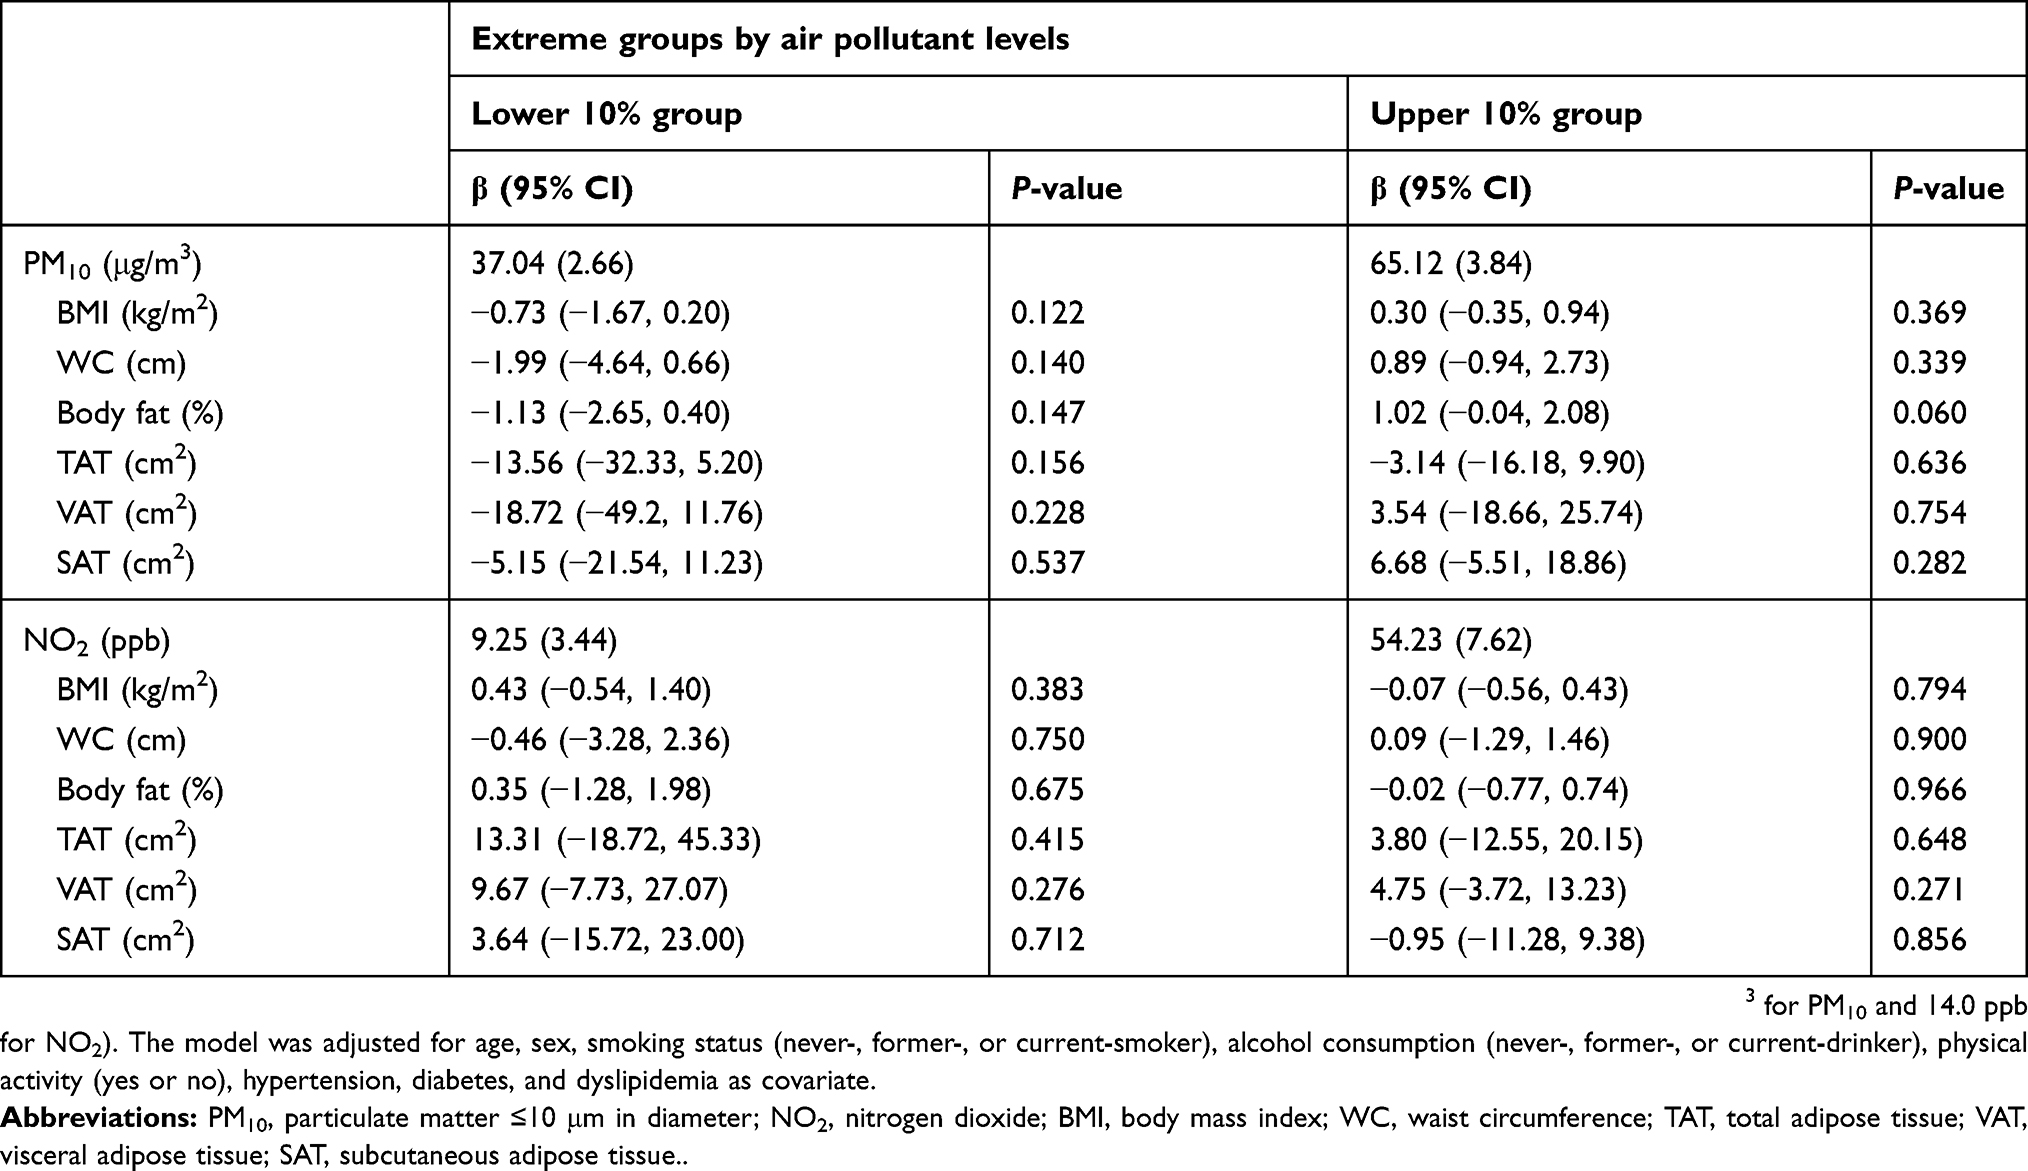 |
Table S2 Estimated associations of IQR increases in annual average air pollution and obesity scales in each extreme group of air pollutant levels |
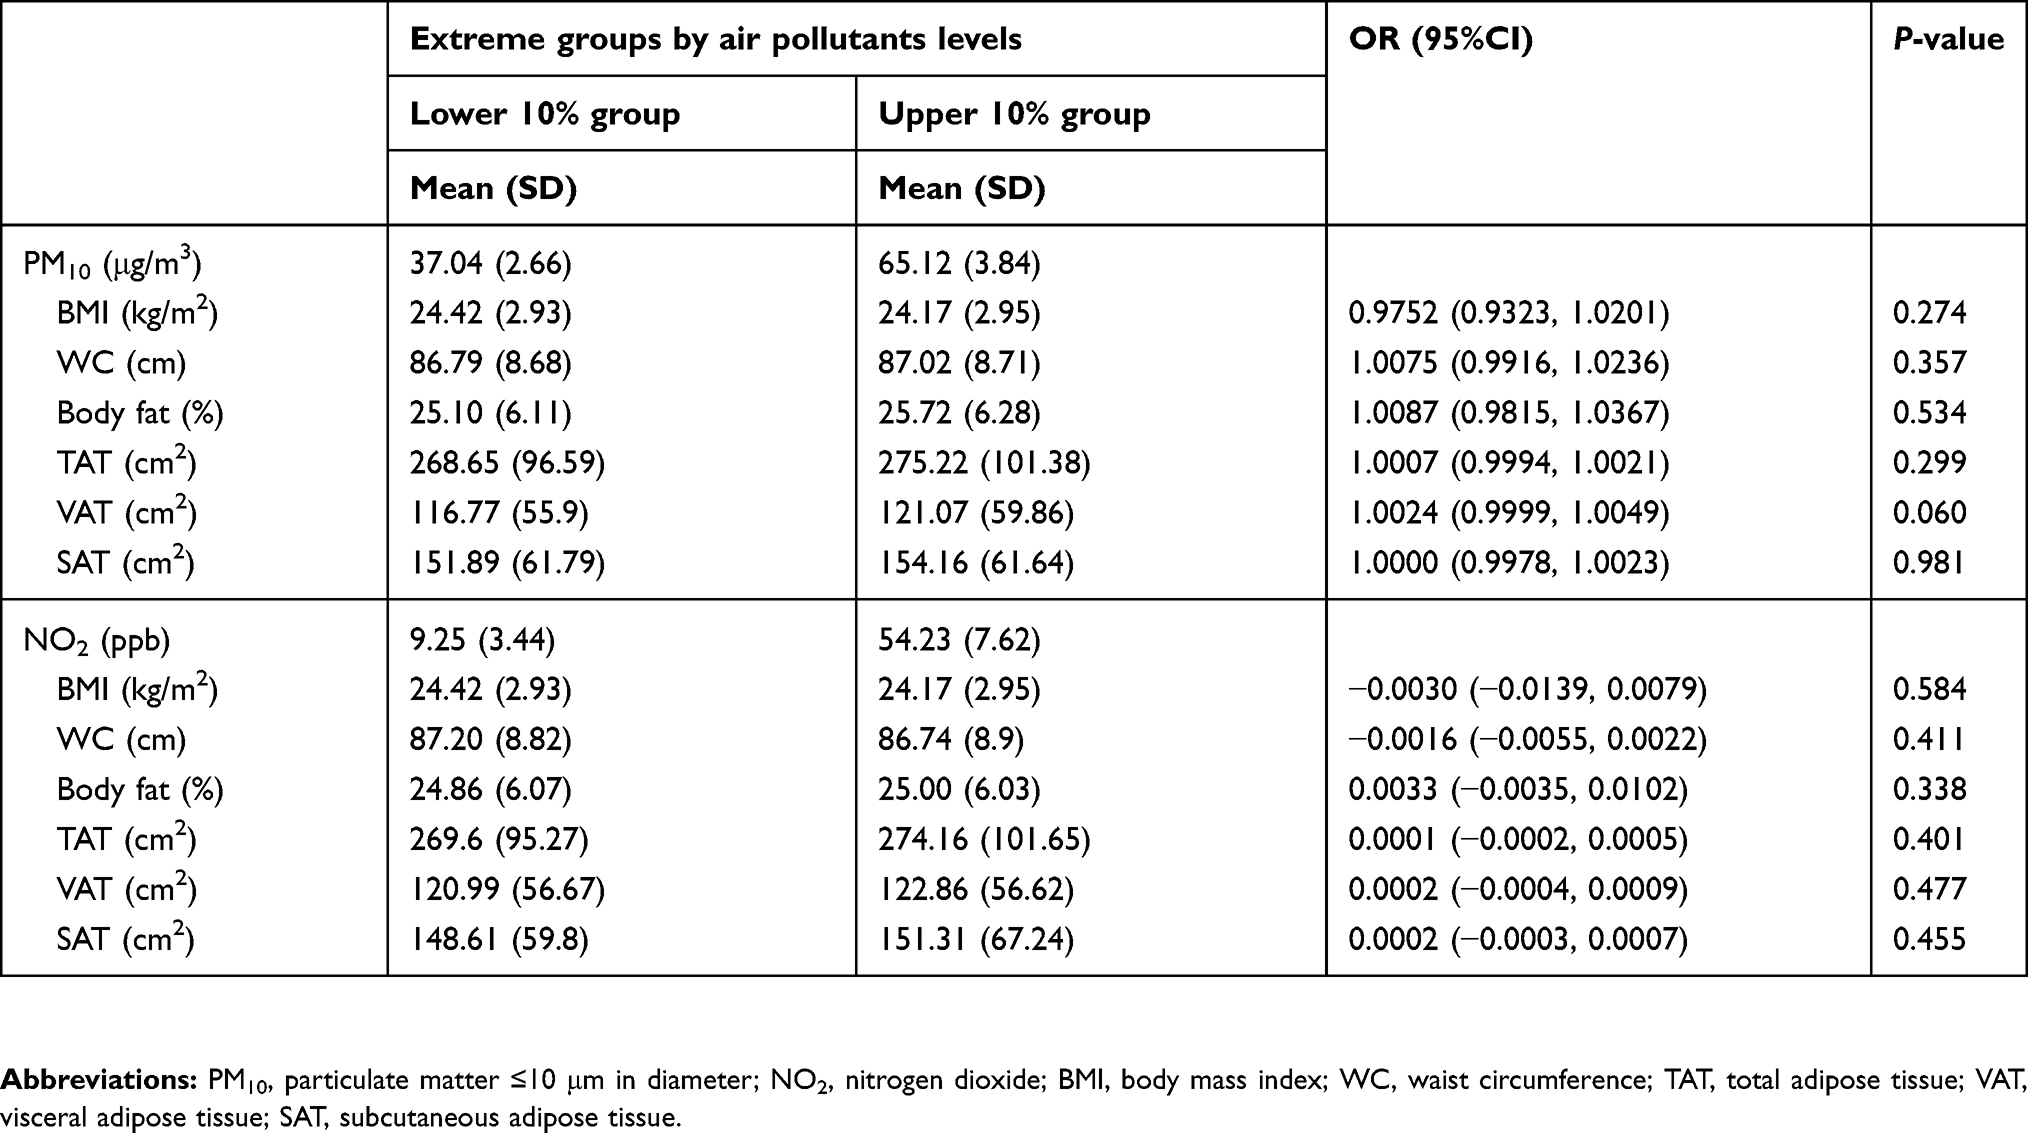 |
Table S3 ORs and 95% CIs from logistic regression for the relation between obesity indices and air pollutant level |
 © 2019 The Author(s). This work is published and licensed by Dove Medical Press Limited. The full terms of this license are available at https://www.dovepress.com/terms.php and incorporate the Creative Commons Attribution - Non Commercial (unported, v3.0) License.
By accessing the work you hereby accept the Terms. Non-commercial uses of the work are permitted without any further permission from Dove Medical Press Limited, provided the work is properly attributed. For permission for commercial use of this work, please see paragraphs 4.2 and 5 of our Terms.
© 2019 The Author(s). This work is published and licensed by Dove Medical Press Limited. The full terms of this license are available at https://www.dovepress.com/terms.php and incorporate the Creative Commons Attribution - Non Commercial (unported, v3.0) License.
By accessing the work you hereby accept the Terms. Non-commercial uses of the work are permitted without any further permission from Dove Medical Press Limited, provided the work is properly attributed. For permission for commercial use of this work, please see paragraphs 4.2 and 5 of our Terms.