")
Back to Journals » Neuropsychiatric Disease and Treatment » Volume 17
Altered Temporal Dynamics of Brain Activity in Multiple-Frequency Bands in Non-Neuropsychiatric Systemic Lupus Erythematosus Patients with Inactive Disease
Authors Chen L, Sun J, Wang Q, Hu L, Zhang Y, Ma H, Jia X, Yang X
Received 20 November 2020
Accepted for publication 15 March 2021
Published 7 May 2021 Volume 2021:17 Pages 1385—1395
DOI https://doi.org/10.2147/NDT.S292302
Checked for plagiarism Yes
Review by Single anonymous peer review
Peer reviewer comments 3
Editor who approved publication: Dr Yuping Ning
Liheng Chen,1 Jiawei Sun,2,3 Qiaohong Wang,1 Lingzhen Hu,1 Yi Zhang,1 Huibin Ma,2,3 Xize Jia,4,5 Xuyan Yang1
1Department of Rheumatology, Second Affiliated Hospital, College of Medicine, Zhejiang University, Hangzhou, 310009, People’s Republic of China; 2School of Information and Electronics Technology, Jiamusi University, Jiamusi, People’s Republic of China; 3Integrated Medical Research School, Jiamusi University, Jiamusi, People’s Republic of China; 4Institute of Psychological Sciences, Hangzhou Normal University, Hangzhou, People’s Republic of China; 5Zhejiang Key Laboratory for Research in Assessment of Cognitive Impairments, Hangzhou, People’s Republic of China
Correspondence: Xize Jia
Institute of Psychological Sciences, Hangzhou Normal University, Hangzhou, People’s Republic of China
Email [email protected]
Xuyan Yang
Department of Rheumatology, Second Affiliated Hospital, College of Medicine, Zhejiang University, 88 Jiefang Road, Hangzhou, 310009, People’s Republic of China
Email [email protected]
Purpose: In this study, we seek to investigate dynamic changes of brain activity in non-neuropsychiatric systemic lupus erythematosus (non-NPSLE) patients with inactive disease.
Patients and Methods: Thirty-one non-NPSLE patients with inactive disease and 20 matched healthy controls underwent the blood oxygenation level-dependent fMRI examination. Dynamic regional homogeneity (ReHo) and fractional amplitude of low-frequency fluctuations (fALFF) were used to analyze the brain activity in typical band (0.01– 0.08 Hz), slow-4 (0.027– 0.073 Hz) and slow-5 (0.01– 0.027 Hz). Pearson’s correlation analysis was performed to correlate dynamic regional homogeneity (dReHo) and dynamic fractional amplitude of low-frequency fluctuations (dfALFF) values for clusters of voxels where significant group differences were found with clinical variables in non-NPSLE patients with inactive disease.
Results: In typical band, non-NPSLE patients showed increased dReHo in left middle occipital gyrus (MOG) compared to healthy controls. Meanwhile, patients showed decreased dfALFF in right superior frontal gyrus (SFG) and bilateral middle frontal gyrus (MFG) in typical band. In slow-4, increased dReHo in left MOG was found in non-NPSLE patients. In slow-5, non-NPSLE patients showed increased dReHo in left MOG, left calcarine fissure and surrounding cortex, right precentral gyrus (PreCG) and left postcentral gyrus (PoCG). Meanwhile, non-NPSLE patients showed decreased dfALFF in left SFG, right MFG, and right PreCG in slow-5. Moreover, the glucocorticoid dose showed significantly negative correlations with dReHo values in right PreCG in slow-5, left PoCG in slow-5, and left MOG in typical band.
Conclusion: dReHo and dfALFF abnormalities in different frequency bands may be the key characteristics in the pathogenesis mechanism of non-NPSLE.
Keywords: systemic lupus erythematosus, non-neuropsychiatric systemic lupus erythematosus, dynamic fractional amplitude of low-frequency fluctuations, dynamic regional homogeneity, frequency bands, resting-state functional magnetic resonance imaging
Introduction
Systemic lupus erythematosus (SLE) is a chronic autoimmune disease that affects multiple organ systems, such as the nervous system.1 Neuropsychiatric SLE (NPSLE) is a common and dangerous complication of SLE. NP syndromes are estimated to exist in more than half of SLE patients and range from mild mood disorders to severe manifestations.2 Although the prognosis of SLE patients has greatly improved in recent years, NPSLE still remains a major cause of morbidity and mortality.3
Magnetic resonance imaging is an important imaging technique to reflect the diversity of underlying mechanisms in NPSLE and demonstrate diffuse periventricular white matter hyperintensity (WMHI), decreased white matter integrity and cortical atrophy in patients with NPSLE and even in SLE patients without overt NP manifestations.4–8 However, these assessments fail to explain the mechanisms in non-NPSLE patients.
With the development of blood oxygenation level-dependent functional magnetic resonance imaging, resting-state fMRI (RS-fMRI) has been used to explore the brain activity in several kinds of diseases since the first study reported that functionally related brain regions showed a correlation of low-frequency (typically 0.01–0.1 Hz) oscillations (LFO) in the resting-state with echo-planar MRI.9 To quantify local brain activity of human brain, several measurements were commonly applied in RS-fMRI studies in nervous system diseases, including regional homogeneity (ReHo), amplitude of low-frequency fluctuations (ALFF), and fractional amplitude of low-frequency fluctuations (fALFF).10−12 Currently, increasing evidence from fMRI studies shows that brain activity in non-NPSLE patients is aberrant. For example, researchers found increased standardized ALFF in the left inferior temporal gyrus and left putamen in patients with non-NPSLE and the significantly negative correlation between C3 and ALFF values in the left putamen was found in patients.13 Liu et al14 found abnormal ReHo in the parahippocampal gyrus, fusiform gyrus, and thalamus in non-NPSLE patients and ReHo values in the left postcentral gyrus were negatively correlated with anxiety depression symptoms. Yu et al15 found decreased ALFF in the precuneus and increased ALFF in the right cuneus and right calcarine fissure surrounding cortex in non-NPSLE patients. Zhang et al16 found alteration of ALFF and functional connectivity density coupling strengths in the left superior parietal gyrus and bilateral precuneus in non-NPSLE patients. Most RS-fMRI studies of ReHo focused on typical band (0.01–0.08 Hz) because this band was considered to reflect spontaneous neuronal activity of the brain.17,18 However, amounts of evidence showed that the pattern of intrinsic brain activity had differential spatial distribution of the LFO amplitudes.19 Researchers found that LFO amplitudes in slow-4 (0.027–0.073 Hz) were most robust in the basal ganglia and slow-5 (0.01–0.027 Hz) was more dominant within ventromedial prefrontal cortices than slow-4.19 Previous RS-fMRI studies in non-NPSLE patients focused on typical band (0.01–0.08 Hz), but few studies utilized the other oscillatory bands including slow-4 and slow-5 to analysis brain activity in non-NPSLE patients.
Most RS-fMRI studies suggested that functional brain activity is stationary through the entire resting scan, but ignored that the characteristics of spontaneous neuronal activity of the brain were not static but dynamic over time.20–22 Assessment of brain dynamic approaches from RS-fMRI studies improves our understanding of the brain. Besides, several studies stated that the functional activity over multiple time scales seems to be a reliable feature and this intrinsic feature could provide a novel method to investigate abnormal brain activity related with neuropsychiatric disorders.23,24 Moreover, recent studies demonstrated that the characteristic of dynamic functional connectivity significantly can provide macroscopic neural activity patterns which was better than the static descriptions of functional connectivity.23,25,26 Meanwhile, it is not enough to focus on dynamic functional connectivity, so regional approaches like dynamic ReHo have been used in several diseases to explore the dynamic variability of the local spontaneous neuronal brain activity.27–30 The increased or decreased dynamic local temporal variabilities might provide some new evidence to support alterations of dynamic neural activity in SLE patients. In recent years, researchers have focused on local temporal variability of functional activity in SLE patients, but there is still a lack of information regarding the dynamic local brain activity in SLE patients. Thus, we sought to determine whether altered dynamic ReHo (dReHo) and dynamic fALFF (dfALFF) were associated with non-NPSLE patients in this study.
Neuropsychiatric complications generally occur in the active disease phase of SLE patients.31,32 Researchers observed the abnormal brain activity in SLE patients was associated with the disease activity.14,33–35 Previous RS-fMRI studies mainly focused on non-NPSLE patients with active disease but a lack of studies in non-NPSLE patients with inactive disease. To address these issues, we sought to investigate the temporal variability of brain activity in non-NPSLE patients with inactive disease using dReHo and dfALFF in typical band (0.01–0.08 Hz), slow-4 (0.027–0.073 Hz), and slow-5 (0.01–0.027 Hz). Furthermore, the correlations between dReHo and dfALFF values for clusters of voxels where significant group differences were found and the clinical variables and neuropsychological factors of non-NPSLE patients were performed.
Materials and Methods
Participants
Thirty-one non-NPSLE patients with inactive disease were recruited at the Department of Rheumatology of the Second Affiliated Hospital, Zhejiang University, College of Medicine. All the patients fulfilled the American College of Rheumatology (ACR) diagnostic criteria of SLE and had no history of neuropsychiatric manifestations which were classified according to the ACR criteria.36,37 Disease activity was assessed by an independent physician using the SLE Disease Activity Index (SLEDAI).38 Inactive SLE was defined by SLEDAI <5 without organ damage within at least 6 months. The inclusion criteria for all the patients were as follows: 1) female gender, right-handedness, and age ranging from 15–45 years, 2) inactive SLE in a stable condition for at least 24 weeks, and 3) no organ damage. We recruited 20 sex-, age-, and education-matched healthy controls. The study protocol was approved by the Ethics Review Committee of the Hospital and was conducted in accordance with the Declaration of Helsinki. All subjects gave written informed consent before being included in the study.
The exclusion criteria for all subjects were as follows: 1) left-handed; 2) brain impairment, such as head trauma, tumor, cerebral infarction, and cerebral hemorrhage; 3) a history of drug abuse and alcohol abuse; 4) pregnancy; 5) major depression (defined as Beck Depression Inventory (BDI-II) -score >13);39,40 6) any physical condition, such as heart diseases, kidney diseases, hypertension, hepatitis, and diabetes; 7) positive antiphospholipid antibody (aPL) or a history of antiphospholipid syndrome; and 8) head movement larger than 3.0 mm of translation or 3.0° of rotation during functional MRI data acquisition. As a consequence, three patients were excluded for the severe head motion. The remaining 28 patients and 20 healthy controls were enrolled in this study.
Clinical Laboratory Data and Psychometric Tests
The medical history and blood samples of the patients were collected on the same day while the scans were performed. Serologic data including C3, C4, anti-dsDNA antibody, antinuclear antibody, and antiphospholipid antibody were collected. Self-assessment scale for each subject including Fatigue Severity Scale (FSS), Beck Depression Inventory-II (BDI-II) and Mini-mental state examination (MMSE) were obtained within half an hour after a scan examination.41,42
Data Acquisition
All image scans were performed on a 3.0 T MRI scanner (SIEMENS MAGNETOM Prisma) at the 3T MRI center, Zhejiang University, with a 64-channel phased array head coil to restrict the head and an earplug to reduce the effect of noise. The resting-state functional images were collected by an echo-planar imaging (EPI) sequence using the following parameters: TR=2,000 ms; TE=30 ms; field-of-view (FOV)=220×220 mm; flip angle=78°; slice thickness=3.4 mm; voxel size: 3.4×3.4×3.4 mm3; 32 axial slices covering the whole brain and 240 volumes obtained in 8 minutes. In addition, the T1 images were acquired to exclude obvious clinically silent lesions like tumor, atrophy, and cerebral infarction using a magnetization prepared rapid gradient echo (MP-RAGE) sequence (TR=2,300 ms; TE=2.26 ms; flip angle=8°; slice thickness=1 mm; field of view (FOV)=256×256 mm; voxel size=1×1×1 mm3). We did not scan the whole cerebellum of all the participants, so the cerebellum was not displayed in the results.
Data Preprocessing
Functional images were preprocessed using RESTplus V1.2443 (www.restfmri.net) and SPM12 (https://www.fil.ion.ucl.ac.uk/spm/).44 For each subject, the data preprocessing consisted of the following steps: 1) discarding the first 10 time points for steady-state magnetization and participant adaptation; 2) slice timing correction; 3) realign (head motion correction); 4) spatial normalization to the Montreal Neurological Institute (MNI) space via the deformation fields derived from tissue segmentation of structural images (resampling voxel size=3×3×3 mm); 5) linear detrending; and 6) nuisance covariates regression (Friston-24 head motion parameters, white matter signal and CSF signal).45 The mean value of the time series of each voxel was added back in this step. 7) Temporal filtering was conducted only for the computation of ReHo and dReHo in typical band (0.01–0.08 Hz), slow-4 (0.027–0.73 Hz), and slow-5 (0.01–0.027 Hz).
Computation of ReHo, fALFF, dReHo, and dfALFF
ReHo and fALFF analyses were performed using the RESTplus V1.24. RESTplus V1.24 was based on SPM12 and REST V1.8.43 In ReHo analysis, we calculated the Kendall’s coeffcient of concordance of the time course of every 27 nearest neighboring voxels.46 In fALFF analysis, the time series was converted to the frequency domain by a fast Fourier transform, and the power spectrum was estimated. The square root of power spectrum was computed at each frequency. The averaged square root value across the predefined frequency was taken as ALFF of each voxel. Then we calculated fALFF, the ratio of the ALFF of a given low frequency band to the sum of amplitudes across the entire frequency range detectable in a given signal. The ReHo and fALFF maps were smoothed with a Gaussian kernel of 6 mm full width at half-maximum (FWHM). The dynamic ReHo (dReHo) and dynamic fALFF (dfALFF) were computed using sliding-window analysis by the Temporal Dynamic Analysis (TDA) module of RESTplus V1.24.43 Firstly, the moderate-length sliding window size was selected as 32 TR for capturing brain dynamics and the step size of the window slid along time was set at 2TR (length of 75 TR window size and 20 TR step of window size were also applied to check the stability of the results). Secondly, the fALFF map and ReHo map for each sliding window were calculated to estimate dfALFF and dReHo for all windows. Thirdly, to investigate temporal variability of brain activity, we computed the coefficient of variation (CV) of dReHo and dfALFF maps across windows. At last, all the CV maps were smoothed with a Gaussian kernel of 6 mm full width at half-maximum (FWHM).
Statistical Processes
Two-sample t-tests were performed to evaluate the differences in age, duration of education, MMSE, FSS, and BDI–II between patients with non-NPSLE and healthy controls using SPSS (version 24.0, Armonk NY) with a threshold of p<0.05. The ReHo, fALFF, dReHo, and dfALFF in the two groups were compared using RESTplus V1.24 and we think the p-value of years of education between two groups is not big enough (p=0.215), so the years of education was regressed in the two-sample t-test to avoid the influence. The resultant T-maps were corrected for multiple comparisons using the Gaussian random field (GRF) theory (voxel p<0.005, cluster p<0.05, two tailed).
Results
Demographic Data and Clinical Characteristics
A total of 28 patients with non-NPSLE and 20 healthy controls were enrolled in this study. Demographic data and clinical characteristics of all the subjects are displayed in Table 1. No significant difference in age and duration of education was found between non-NPSLE patients with inactive disease and healthy controls. The disease duration of patients was 7.71±5.58 years and all the patients have been in a stable condition for at least 6 months, which was defined by SLEDAI<5 without organ damage. There was a significant difference in FSS between non-NPSLE patients with inactive disease and healthy controls (p<0.001). However, no significant difference in BDI-II scale and MMSE was found between non-NPSLE patients and healthy controls (both p>0.05).
 |
Table 1 Demographic and Clinical Information in Patients and Healthy Controls |
Group Differences in ReHo, fALFF in Different Frequency Bands
Compared with healthy controls, non-NPSLE patients displayed decreased ReHo in bilateral calcarine fissure and the surrounding cortex (CAL) and increased ReHo in right middle frontal gyrus (MFG) in both typical band and slow-4. Meanwhile, increased ReHo in left MFG was found in the typical band in non-NPSLE patients. Compared with healthy controls, increased fALFF in right MFG in three frequency bands was found in non-NPSLE patients. Non-NPSLE patients showed increased fALFF in the right caudate nucleus in the typical band, decreased fALFF in the right CAL in slow-4 and increased fALFF in the right inferior frontal gyrus, orbital part in slow-5 (Supplementary materials Tables 1 and 2, Supplementary materials Figures 1 and 2).
Group Differences in dReHo in Different Frequency Bands
Compared with healthy controls, non-NPSLE patients showed increased dReHo in the left middle occipital gyrus in three frequency bands and increased dReHo in the left CAL, right precentral gyrus (PreCG), and left postcentral gyrus (PoCG) in slow-5 (Table 2, Figure 1). The results of the group differences in dReHo in length of 75 TR window size and 20 TR step of window size are shown in Supplementary materials Table 3 and Supplementary materials Figure 4.
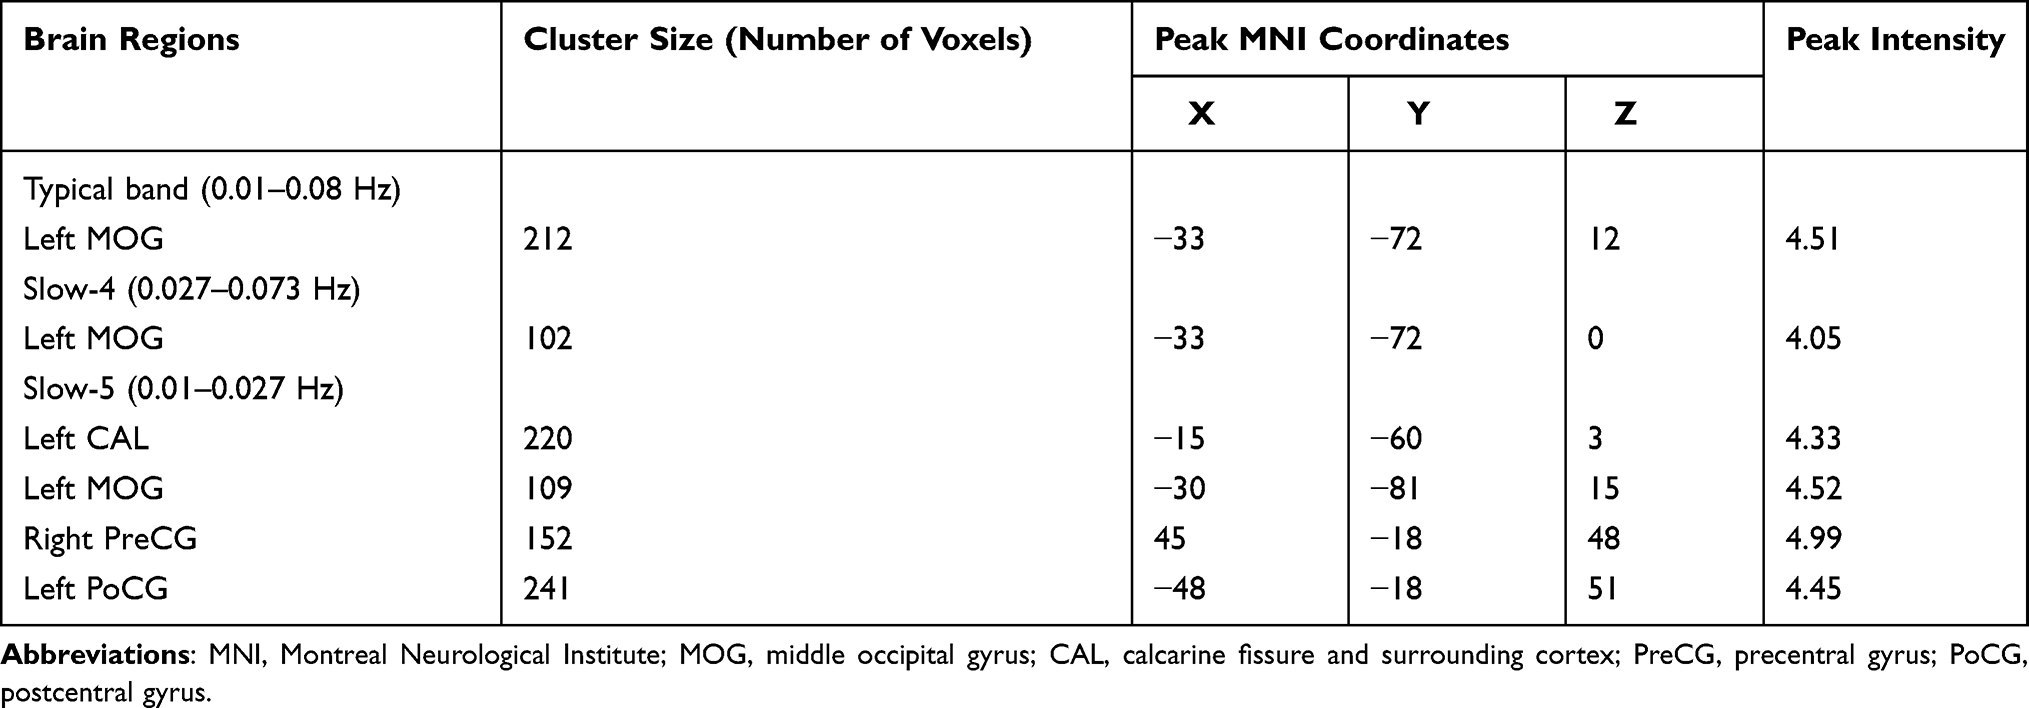 |
Table 2 The Difference in dReHo Value in Brain Regions between SLE and HCs |
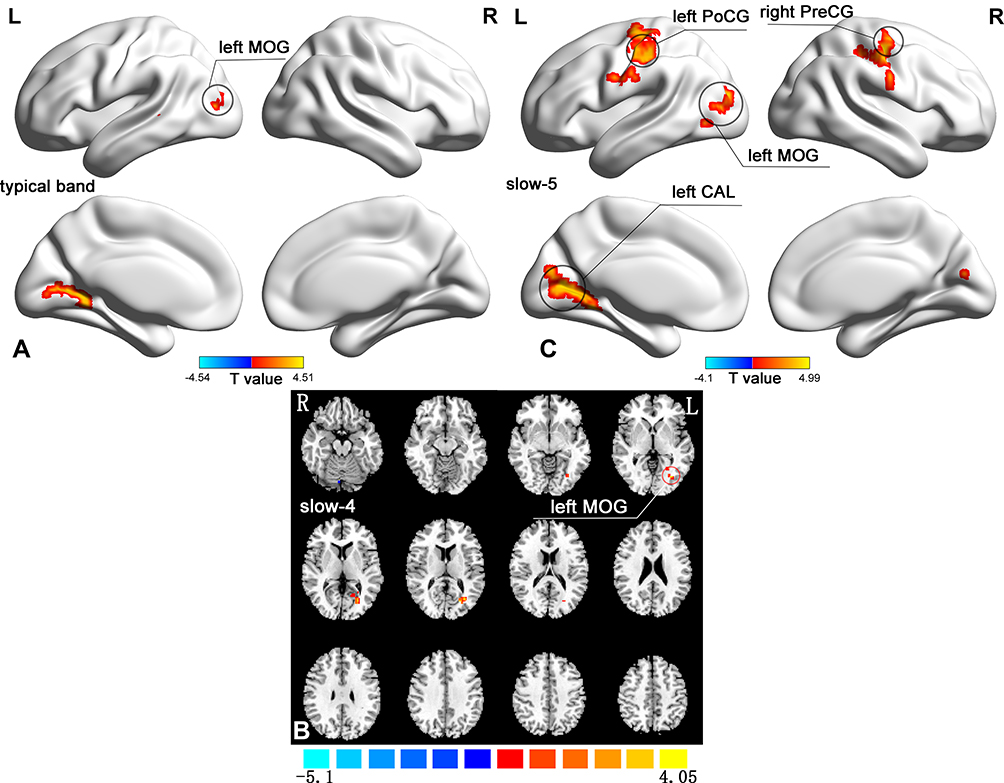 |
Figure 1 dReHo map of non-NPSLE patients versus healthy controls in different frequency bands. T-statistic dReHo maps of non-NPSLE patients versus healthy controls (HCs) (voxel p<0.005, cluster p<0.05, GRF corrected). (A) dReHo map of non-NPSLE patients versus healthy controls in typical band; (B) dReHo map of non-NPSLE patients versus healthy controls in slow-4; (C) dReHo map of non-NPSLE patients versus healthy controls in slow-5. Hot colors indicate increased dReHo in patients compared with HCs; cold colors indicate decreased dReHo in patients compared with HCs. Abbreviations: R, right hemisphere; L, left hemisphere; MOG, middle occipital gyrus; CAL, calcarine fissure and surrounding cortex; PreCG, precentral gyrus; PoCG, postcentral gyrus. |
Between-Group Differences in dfALFF in Different Frequency Bands
Compared with healthy controls, non-NPSLE patients showed decreased dfALFF in bilateral MFG and right superior frontal gyrus (SFG) in typical band and decreased dfALFF in left SFG, right MFG and right PreCG were found in slow-5 (Table 3, Figure 2). The results of the group differences in dfALFF in length of 75 TR window size and 20 TR step of window size are shown in Supplementary materials Table 4 and Supplementary materials Figure 5.
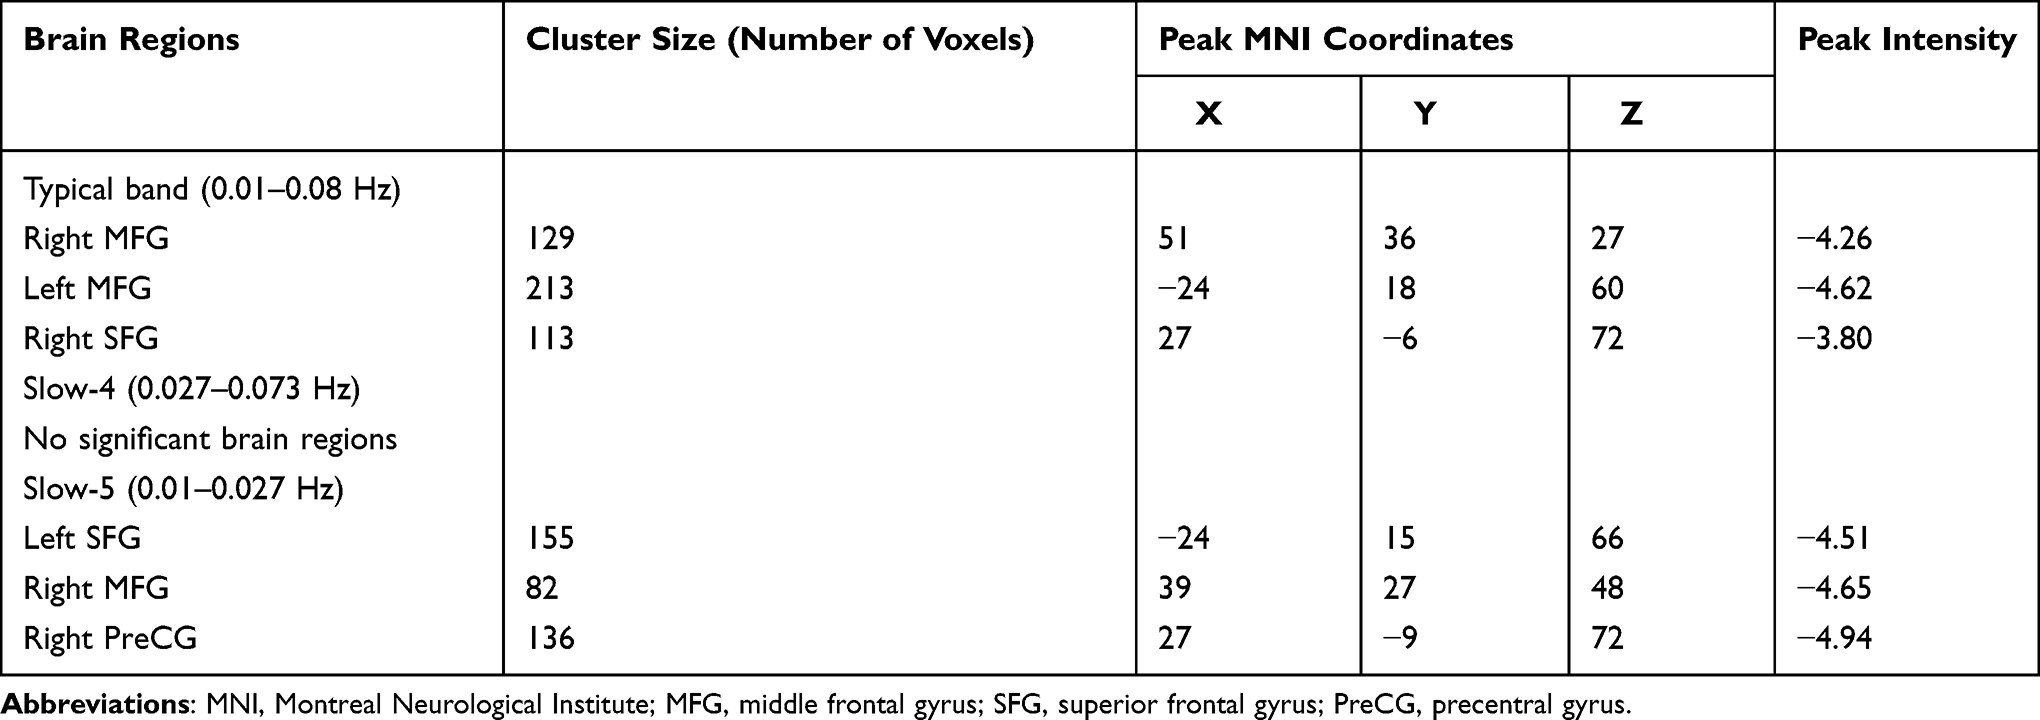 |
Table 3 The Difference in dfALFF Value in Brain Regions between SLE and HCs |
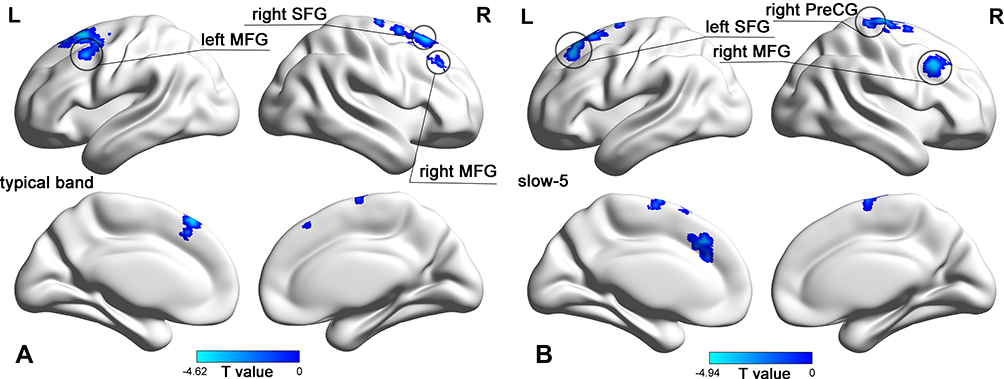 |
Figure 2 dfALFF map of non-NPSLE patients versus healthy controls in different frequency bands T-statistic dfALFF maps of non-NPSLE patients versus healthy controls (HCs) (voxel p<0.005, cluster p<0.05, GRF corrected). (A) dfALFF map of non-NPSLE patients versus healthy controls in typical band; (B) dfALFF map of non-NPSLE patients versus healthy controls in slow-5. Hot colors indicate increased dfALFF in patients compared with HCs; cold colors indicate decreased dfALFF in patients compared with HCs. Abbreviations: R, right hemisphere; L, left hemisphere; MFG, middle frontal gyrus; SFG, superior frontal gyrus; PreCG, precentral gyrus. |
Relationship Between ReHo, fALFF, dReHo, dfALFF, and Clinical Variables
The correlations between the ReHo values for clusters of voxels where significant group differences were found and clinical variables (C3, C4, SLEDAI, disease duration, glucocorticoid dose, psychometric scale FSS and BDI-II) in non-NPSLE patients with inactive disease were performed. Similar to ReHo, fALFF, dReHo, and dfALFF values for clusters of voxels where significant group differences were found were also correlated to the clinical variables using Pearson’s correlation analysis.
The correlation analysis revealed significantly negative correlations between the fatigue severity scale and ReHo values in bilateral MFG in typical band. The Beck Depression Inventory II showed significantly positive correlations with fALFF values in right CAL in slow-4 and right ORBinf in slow-5. A significantly negative correlation was found between SLEDAI score and fALFF values in right MFG in slow-5. Moreover, the glucocorticoid dose was negatively correlated with fALFF values in right MFG in slow-5 (Supplementary materials Figure 3).
The correlation analysis revealed significantly negative correlations were found between the glucocorticoid dose and dReHo values in right PreCG in slow-5 (p=0.001, r=−0.613), dReHo values in left PoCG in slow-5 (p=0.022, r=−0.432), and dReHo values in left MOG in typical band (p<0.001, r=−0.659). No significant correlation was found between dReHo, dfALFF values, and C3, C4, SLEDAI, disease duration, psychometric scale FSS, and BDI-II in the three different bands (Figure 3).
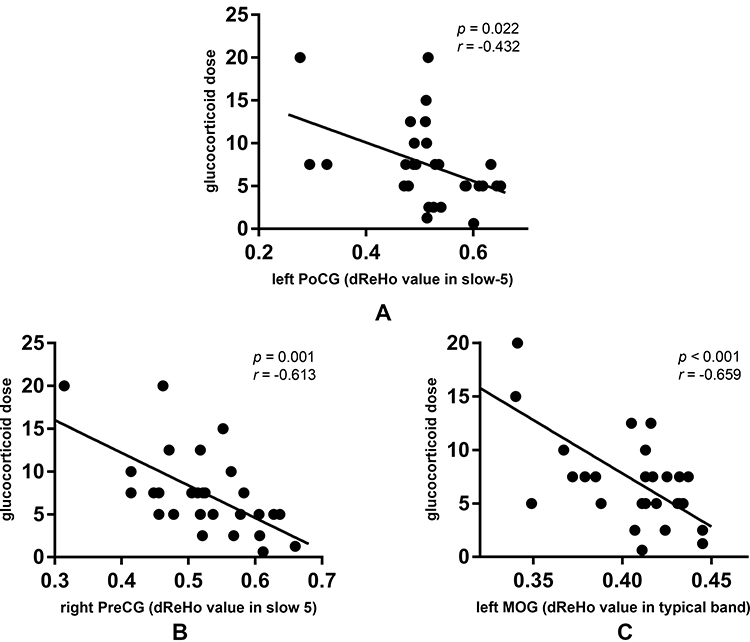 |
Figure 3 Correlation analysis. The correlation analysis showed significantly negative correlations between the glucocorticoid dose and dReHo values in right PreCG in slow-5 (B), dReHo values in left PoCG in slow-5 (A), and dReHo values in left MOG in typical band (C). |
Discussion
In the current study, we assessed the dynamic characteristics of the human whole-brain activity in non-NPSLE patients with inactive disease and healthy controls in three different frequency bands (typical band=0.01–0.08 Hz; slow-4=0.027–0.073 Hz; slow-5=0.01–0.027 Hz) based on two approaches, dReHo and dfALFF. Our study demonstrated that non-NPSLE patients showed increased dReHo in the left middle occipital gyrus in three frequency bands and increased dReHo in the left CAL, right precentral gyrus (PreCG) and left postcentral gyrus (PoCG) in slow-5. Meanwhile, compared with healthy controls, decreased dfALFF in bilateral MFG and right superior frontal gyrus (SFG) in the typical band and decreased dfALFF in the left SFG, right MFG, and right PreCG was found in slow-5 in non-NPSLE patients. Negative correlations between dReHo in several brain regions and glucocorticoid dose were found. Our results suggested the alterations of dReHo and dfALFF in non-NPSLE patients with inactive disease were frequency-dependent and might be correlated to the brain dysfunction.
Consistent with previous investigations, we found altered brain activity in non-NPSLE patients in the typical band. At present, there is still a lack of consensus on the physiological significance of low-frequency bold oscillation signals in different frequency bands. Some scholars showed that different oscillation bands have different mechanisms and corresponding physiological functions.19 In other related studies, slow-4 and slow-5 have different sensitivity to spontaneous activity in different brain regions.17,47 In our study, we assumed that typical band, slow-4 and slow-5 can reflect the different spontaneous brain activity of non-NPSLE patients in order to observe the abnormal brain function of non-NPSLE patients from different perspectives. Conventional ReHo and fALFF can be regarded as a proxy for static brain activity. Several previous studies reported that static ReHo was altered in non-NPSLE patients.14,33 Specifically, active patients with SLE showed decreased ReHo in the right fusiform gyrus and increased ReHo in the left parahippocampal and right uncus.14,33 However, static ReHo can only reflect static local brain activity.46 With ReHo as a representative indicator of static brain activity, we often assumed that the neural activity in the brain is temporarily stable. However, many previous studies suggest that these studies have certain limitations, because a large number of studies showed that the intrinsic brain activity is dynamic over time.20,21 Sliding window analysis can be utilized to capture the time-varying information of the connectivity and describes the temporal energy consumption, which may be the result of higher demand.21,22 This novel temporal variability may be used as a feature for clinical characterization.
We demonstrated that the altered dfALFF in the middle frontal gyrus (MFG) in typical band and slow-5 in non-NPSLE patients with inactive disease. Our previous studies use the fALFF approach with different multiple correction and head motion correction but failed to find significant brain regions.48 The middle frontal gyrus (MFG) was considered to be a site of convergence of the dorsal and ventral attention networks.49 Previous studies found abnormalities in the middle frontal gyrus in SLE patients which were consistent with our findings. Yu et al15 found increased functional connectivity between the right MFG and left precuneus in non-NPSLE patients. Bonacchi et al50 used an independent component analysis approach, and found decreased functional connectivity in the right middle frontal gyrus in NPSLE and non-NPSLE patients. These findings suggest that abnormal brain activity of the middle frontal gyrus may occur in NPSLE patients, non-NPSLE patients with active disease, and non-NPSLE patients with inactive disease.
Based on the results, we demonstrated that the altered dReHo in MOG in three different frequency bands in inactive patients with non-NPSLE. Consistent with our findings, previous studies found abnormal brain activity in MOG in non-NPSLE patients. Yu et al15 found increased functional connectivity between left MOG and the left precuneus in non-NPSLE patients. Nystedt et al35 found decreased connectivity between MOG and the left insula in non-NPSLE patients. Previous studies demonstrated that MOG was preferentially activated by the spatial processing of nonvisual inputs.51,52 Most of the occipital cortex is deactivated under auditory and tactile conditions, but the right MOG is more activated during spatial tasks compared to non-spatial visual tasks.51 However, in previous task based fMRI studies, the MOG was not activated during spatial visual tasks in SLE patients, the cause of alteration of MOG in non-NPSLE patients may be complicated.53 Meanwhile, we found a significantly negative correlation between dReHo values in left MOG in typical band and glucocorticoid dose. Interestingly, all of our patients are in inactive disease phase and use a quite low glucocorticoid dose for at least 6 months. These findings suggest that the low-sustained dose of glucocorticoid may contribute to the compensatory mechanism of the left MOG in non-NPSLE patients. However, the molecular biological mechanism needs further investigation.
In the present study, decreased dfALFF in the left superior frontal gyrus (SFG) was found in typical band and slow-5. SFG is thought to play a role in cognitive functions, especially in working memory (WM).54 Cognitive dysfunction and memory impairments are prevalent in non-NPSLE patients without clinically overt neuropsychiatric symptoms.55 During task fMRI, non-NPSLE patients showed significantly increased activation in the SFG when they performed executive function tasks and working memory tasks like WCST.56–58 A RS-fMRI study showed altered functional connectivity and decreased cortical thickness in the superior frontal cortex in non-NPSLE patients.59 Our results further confirmed alterations in the SFG in non-NPSLE patients may be considered as an early compensatory mechanism to overcome subtle neuronal damage. Previous studies demonstrated neuronal damage may be due to ischemia caused by aPL or APS.60 In this study, the non-NPSLE patients with aPL or APS were excluded from this study. So the cause of neuronal damage may be complicated.
In addition, we found altered dReHo in the left CAL in slow-5, dReHo in the left postcentral gyrus (PoCG) in slow-5, and both dReHo and dfALFF in the right precentral gyrus (PreCG) in slow-5. Our results also showed a significantly negative correlation between glucocorticoid dose and dReHo values in left PoCG and right PreCG in non-NPSLE patients with inactive disease in slow-5. Previous studies exhibited that the calcarine fissure (CAL) was surrounded by the primary visual cortex (V1), which was related to the visual and emotional stimulus.61,62 The postcentral gyrus (PoCG) is the primary somatosensory cortex and the precentral gyrus (PreCG) is known as the motor strip or primary motor cortex, both of which are responsible for executing movements and part of the sensory motor network (SMN). Consistent with recent RS-fMRI studies, impaired SMN in patients with non-NPSLE was found using independent component analysis.35,63 In diffusion tensor imaging (DTI) studies of SLE patients, decreased fractional anisotropy (FA) in both PreCG and PoCG was found.64 Furthermore, we found the significantly negative correlations between glucocorticoid dose and dReHo values in PreCG and left PoCG. These findings suggested the low-sustained dose of glucocorticoid may also contribute to the compensatory mechanism of the left PoCG and right PreCG in non-NPSLE patients.
For active patients with non-NPSLE studies, SLEDAI score was correlated with significantly altered values in multiple brain regions.33,34 However, we did not find any positive or negative correlations between dReHo, dfALFF values in the significant brain regions and the SLEDAI score. This was mainly because the patients in the study were in an inactive condition (SLEDAI<5). Fatigue is a general complaint of SLE patients with or without overt neuropsychiatric syndrome.65,66 Our results also showed FSS was significantly different between non-NPSLE patients and healthy controls (p<0.001), which suggested SLE patients were prone to fatigue. The cause of fatigue in non-NPSLE patients may be multifactorial and remains as needing further study.
Conclusion
Our results showed that alterations of dReHo and dfALFF in non-NPSLE patients with inactive disease were frequency-dependent. There were significantly negative correlations between the glucocorticoid dose and several brain regions. Our study suggested that non-NPSLE patients with inactive disease may have abnormal brain activity. dReHo and dfALFF abnormalities in different frequency bands may be the key characteristics in the pathogenesis mechanism of non-NPSLE.
Data Sharing Statement
All the files (ReHo, fALFF, dReHo, dfALFF) used to support this study have been deposited in http://www.restfmri.net/SLE/rsfMRI_Data.zip.
Acknowledgments
We thank all of the participants in this study, and this work was supported by grants from Zhejiang Provincial Natural Science Foundation (No: LY20H100006 to Xuyan Yang), and the National Natural Science Foundation of China (No. 81571578 to Xuyan Yang, and the No. 82001898 to Xize Jia).
Disclosure
The authors declare that they have no conflicts of interest.
References
1. Zardi EM, Taccone A, Marigliano B, et al. Neuropsychiatric systemic lupus erythematosus: tools for the diagnosis. Autoimmun Rev. 2014;13(8):831–839. doi:10.1016/j.autrev.2014.04.002
2. Unterman A, Nolte JE, Boaz M, et al. Neuropsychiatric syndromes in systemic lupus erythematosus: a meta-analysis. Semin Arthritis Rheum. 2011;41(1):1–11. doi:10.1016/j.semarthrit.2010.08.001
3. Amin O, Kaul A, Smith TO, et al. Comparison of structural magnetic resonance imaging findings between neuropsychiatric systemic lupus erythematosus and systemic lupus erythematosus patients: a systematic review and meta-analysis. Rheumatol Pract Res. 2017;2(1–11):205990211666305. doi:10.1177/2059902116663058
4. Sarbu N, Toledano P, Calvo A, et al. Advanced MRI techniques: biomarkers in neuropsychiatric lupus. Lupus. 2017;26(5):510–516. doi:10.1177/0961203316674820
5. Luyendijk J, Steens S, Ouwendijk W, et al. Neuropsychiatric systemic lupus erythematosus: lessons learned from magnetic resonance imaging. Arthritis Rheum. 2011;63(3):722–732. doi:10.1002/art.30157
6. Nystedt J, Nilsson M, Jonsen A, et al. Altered white matter microstructure in lupus patients: a diffusion tensor imaging study. Arthritis Res Ther. 2018;20(1):21. doi:10.1186/s13075-018-1516-0
7. Schmidt-Wilcke T, Cagnoli P, Wang P, et al. Diminished white matter integrity in patients with systemic lupus erythematosus. NeuroImage. 2014;5:291–297. doi:10.1016/j.nicl.2014.07.001
8. Sibbitt WL
9. Biswal B, Yetkin F, Haughton V, et al. Functional connectivity in the motor cortex of resting human brain using echo-planar MRI. Magn Reson Med. 1995;34(4):537–541. doi:10.1002/mrm.1910340409
10. Wu T, Long X, Zang Y, et al. Regional homogeneity changes in patients with Parkinson’s disease. Hum Brain Mapp. 2009;30(5):1502–1510. doi:10.1002/hbm.20622
11. Egorova N, Veldsman M, Cumming T, et al. Fractional amplitude of low-frequency fluctuations (fALFF) in post-stroke depression. NeuroImage. 2017;16(C):116–124. doi:10.1016/j.nicl.2017.07.014
12. Hoptman MJ, Zuo XN, Butler PD, et al. Amplitude of low-frequency oscillations in schizophrenia: a resting state fMRI study. Schizophr Res. 2010;117(1):13–20. doi:10.1016/j.schres.2009.09.030
13. Yang L. Chen, et al. altered amplitude of low-frequency fluctuations in inactive patients with nonneuropsychiatric systemic lupus erythematosus. Neural Plast. 2019;2019:9408612. doi:10.1155/2019/9408612
14. Liu S, Cheng Y, Xie Z, et al. A Conscious resting state fMRI study in SLE patients without major neuropsychiatric manifestations. Front Psychiatry. 2018;9:677. doi:10.3389/fpsyt.2018.00677
15. Yu H, Qiu X, Zhang YQ, et al. Abnormal amplitude of low frequency fluctuation and functional connectivity in non-neuropsychiatric systemic lupus erythematosus: a resting-state fMRI study. Neuroradiology. 2019;61(3):331–340. doi:10.1007/s00234-018-2138-6
16. Zhang XD, Jiang XL, Cheng Z, et al. Decreased coupling between functional connectivity density and amplitude of low frequency fluctuation in non-neuropsychiatric systemic lupus erythematosus: a resting-stage functional MRI study. Mol Neurobiol. 2017;54(7):5225–5235. doi:10.1007/s12035-016-0050-9
17. Yu R, Chien YL, Wang HL, et al. Frequency-specific alternations in the amplitude of low-frequency fluctuations in schizophrenia. Hum Brain Mapp. 2014;35(2):627–637. doi:10.1002/hbm.22203
18. Zhan J, Gao L, Zhou F, et al. Amplitude of low-frequency fluctuations in multiple-frequency bands in acute mild traumatic brain injury. Front Hum Neurosci. 2016;10:27. doi:10.3389/fnhum.2016.00027
19. Zuo XN, Di Martino A, Kelly C, et al. The oscillating brain: complex and reliable. Neuroimage. 2010;49(2):1432–1445. doi:10.1016/j.neuroimage.2009.09.037
20. Liao X, Yuan L, Zhao T, et al. Spontaneous functional network dynamics and associated structural substrates in the human brain. Front Hum Neurosci. 2015;9:478. doi:10.3389/fnhum.2015.00478
21. Liao W, Li J, Ji GJ, et al. Endless fluctuations: temporal dynamics of the amplitude of low frequency fluctuations. IEEE Trans Med Imaging. 2019;38(11):2523–2532. doi:10.1109/TMI.2019.2904555
22. Calhoun VD, Miller R, Pearlson G, et al. The chronnectome: time-varying connectivity networks as the next frontier in fMRI data discovery. Neuron. 2014;84(2):262–274. doi:10.1016/j.neuron.2014.10.015
23. Hutchison RM, Womelsdorf T, Allen EA, et al. Dynamic functional connectivity: promise, issues, and interpretations. NeuroImage. 2013. doi:10.1016/j.neuroimage.2013.05.079
24. Zhang Y, Guo G, Tian Y. Increased temporal dynamics of intrinsic brain activity in sensory and perceptual network of schizophrenia. Front Psychiatry. 2019;10. doi:10.3389/fpsyt.2019.00484
25. Rashid B, Arbabshirani MR, Damaraju E, et al. Classification of schizophrenia and bipolar patients using static and dynamic resting-state fmri brain connectivity. NeuroImage. 2016;134:645–657. doi:10.1016/j.neuroimage.2016.04.051
26. Deng L, Sun J, Cheng L, et al. Characterizing dynamic local functional connectivity in the human brain. Sci Rep. 2016;6:26976. doi:10.1038/srep26976
27. Wang P, Li R, Liu B, et al. Altered static and temporal dynamic amplitude of low-frequency fluctuations in the background network during working memory states in mild cognitive impairment. Front Aging Neurosci. 2019;11:152. doi:10.3389/fnagi.2019.00152
28. Liu H, Li W, Zhao M, et al. Altered temporal dynamics of brain activity in patients with generalized tonic-clonic seizures. PLoS One. 2019;14(7):e0219904. doi:10.1371/journal.pone.0219904
29. Li J, Duan X, Cui Q, et al. More than just statics: temporal dynamics of intrinsic brain activity predicts the suicidal ideation in depressed patients. Psychol Med. 2019;49(5):852–860. doi:10.1017/S0033291718001502
30. Chen J, Sun D, Shi Y, et al. Dynamic alterations in spontaneous neural activity in multiple brain networks in subacute stroke patients: a resting-state fMRI study. Front Neurosci. 2018;12:994. doi:10.3389/fnins.2018.00994
31. Bosma G, Rood M, Huizinga T, et al. Detection of cerebral involvement in patients with active neuropsychiatric systemic lupus erythematosus by the use of volumetric magnetization transfer imaging. Arthritis Rheum. 2000;43(11):2428–2436. doi:10.1002/1529-0131(200011)43:11<2428::AID-ANR9>3.0.CO;2-H
32. Wang M, Gladman DD, Ibanez D, et al. Long-term outcome of early neuropsychiatric events due to active disease in systemic lupus erythematosus. Arthritis Care Res. 2012;64(6):833–837. doi:10.1002/acr.21624
33. Lin Y, Zou QH, Wang J, et al. Localization of cerebral functional deficits in patients with non-neuropsychiatric systemic lupus erythematosus. Hum Brain Mapp. 2011;32(11):1847–1855. doi:10.1002/hbm.21158
34. Hou J, Lin Y, Zhang W, et al. Abnormalities of frontal-parietal resting-state functional connectivity are related to disease activity in patients with systemic lupus erythematosus. PLoS One. 2013;8(9):e74530. doi:10.1371/journal.pone.0074530
35. Nystedt J, Mannfolk P, Jonsen A, et al. Functional connectivity changes in systemic lupus erythematosus: a resting-state study. Brain Connect. 2018;8(4):220–234. doi:10.1089/brain.2017.0557
36. Hochberg MC. Updating the American College of Rheumatology revised criteria for the classification of systemic lupus erythematosus. Arthritis Rheum. 1997;40(9):1725. doi:10.1002/art.1780400928
37. Liang MH, Corzillius M, Bae SC, et al. The American College of Rheumatology nomenclature and case definitions for neuropsychiatric lupus syndromes. Arthritis Rheum. 1999;42(4):599–608.
38. Bombardier C, Gladman DD, Urowitz MB, et al. Derivation of the SLEDAI. A disease activity index for lupus patients. Arthritis Rheum. 1992;35(6):630–640. doi:10.1002/art.1780350606
39. Wang Z. Reliability and validity of the Chinese version of Beck Depression Inventory-II among depression patients (in chinese). Chin Mental Health J. 2011;25(6):476–480.
40. Beck AT, Steer RA, Ball R, et al. Comparison of Beck Depression Inventories-IA and-II in psychiatric outpatients. J Pers Assess. 1996;67(3):588–597. doi:10.1207/s15327752jpa6703_13
41. Krupp LB, LaRocca NG, Muir-Nash J, et al. The fatigue severity scale: application to patients with multiple sclerosis and systemic lupus erythematosus. Arch Neurol. 1989;46(10):1121–1123. doi:10.1001/archneur.1989.00520460115022
42. Folstein MF, Folstein SE, Mchugh PR, et al. Mini-Mental State: a practical method for grading the state of patients for the clinician. J Psychiatr Res. 1975;12(3):189–198. doi:10.1016/0022-3956(75)90026-6
43. Jia X-Z, Wang J, Sun H-Y, et al. RESTplus: an improved toolkit for resting-state functional magnetic resonance imaging data processing. ENCE Bulletin. 2019;64(14).
44. Friston KJ, Holmes AP, Worsley KJ, et al. Statistical parametric maps in functional imaging: a general linear approach. Hum Brain Mapp. 1994;2(4):189–210. doi:10.1002/hbm.460020402
45. Friston KJ, Williams S, Howard R, et al. Movement-related effects in fMRI time-series. Magn Reson Med. 1996;35(3):346–355. doi:10.1002/mrm.1910350312
46. Zang Y, Jiang T, Lu Y, et al. Regional homogeneity approach to fMRI data analysis. Neuroimage. 2004;22(1):394–400. doi:10.1016/j.neuroimage.2003.12.030
47. Han Y, Wang J, Zhao Z, et al. Frequency-dependent changes in the amplitude of low-frequency fluctuations in amnestic mild cognitive impairment: a resting-state fMRI study. Neuroimage. 2011;55(1):287–295. doi:10.1016/j.neuroimage.2010.11.059
48. Yu Y, Chen L, Wang Q, et al. Altered amplitude of low-frequency fluctuations in inactive patients with nonneuropsychiatric systemic lupus erythematosus. Neural Plast. 2019;2019:9408612. doi:10.1155/2019/9408612
49. Shruti J, Kelsey H, Satyshur MD, et al. A role of right middle frontal gyrus in reorienting of attention: a case study. Front Syst Neurosci. 2015;9:23.
50. Bonacchi R, Rocca MA, Ramirez GA. Resting state network functional connectivity abnormalities in systemic lupus erythematosus: correlations with neuropsychiatric impairment. Molecular Psychiatry. 2020. doi:10.1038/s41380-020-00907-z
51. Renier LA, Anurova I, De Volder AG, et al. Preserved functional specialization for spatial processing in the middle occipital gyrus of the early blind. Neuron. 2010;68(1):138–148. doi:10.1016/j.neuron.2010.09.021
52. Tu S, Qiu J, Martens U, et al. Category-selective attention modulates unconscious processes in the middle occipital gyrus. Conscious Cogn. 2013;22(2):479–485. doi:10.1016/j.concog.2013.02.007
53. Wu BB, Ma Y, Xie L, et al. Impaired decision-making and functional neuronal network activity in systemic lupus erythematosus. J Magn Reson Imaging. 2018;48(6):1508–1517. doi:10.1002/jmri.26006
54. Du Boisgueheneuc F, Levy R, Volle E, et al. Functions of the left superior frontal gyrus in humans: a lesion study. Brain. 2006;129(12):3315–3328. doi:10.1093/brain/awl244
55. Kozora E, Arciniegas DB, Filley CM, et al. Cognitive and neurologic status in patients with systemic lupus erythematosus without major neuropsychiatric syndromes. Arthritis Rheum. 2008;59(11):1639–1646. doi:10.1002/art.24189
56. Kozora E, Ulug AM, Erkan D, et al. Functional magnetic resonance imaging of working memory and executive dysfunction in systemic lupus erythematosus and antiphospholipid antibody-positive patients. Arthritis Care Res. 2016;68(11):1655–1663. doi:10.1002/acr.22873
57. Mak A, Ren T, Fu EH, et al. A prospective functional MRI study for executive function in patients with systemic lupus erythematosus without neuropsychiatric symptoms. Semin Arthritis Rheum. 2012;41(6):849–858. doi:10.1016/j.semarthrit.2011.11.010
58. Ren T. Ho RC and Mak A. Dysfunctional cortico-basal ganglia-thalamic circuit and altered hippocampal-amygdala activity on cognitive set-shifting in non-neuropsychiatric systemic lupus erythematosus. Arthritis Rheum. 2012;64(12):4048–4059. doi:10.1002/art.34660
59. Niu C, Tan X, Liu X, et al. Cortical thickness reductions associate with abnormal resting-state functional connectivity in non-neuropsychiatric systemic lupus erythematosus. Brain Imaging Behav. 2018;12(3):674–684. doi:10.1007/s11682-017-9729-4
60. Shapira-Lichter I, Vakil E, Litinsky I, et al. Learning and memory-related brain activity dynamics are altered in systemic lupus erythematosus: a functional magnetic resonance imaging study. Lupus. 2013;22(6):562–573. doi:10.1177/0961203313480399
61. Dougherty RF, Koch VM, Brewer AA, et al. Visual field representations and locations of visual areas V1/2/3 in human visual cortex. J Vis. 2003;3(10):586–598. doi:10.1167/3.10.1
62. Engel SA, Glover GH, Wandell BA. Retinotopic organization in human visual cortex and the spatial precision of functional MRI. Cereb Cortex. 1997;7(2):181–192. doi:10.1093/cercor/7.2.181
63. Nystedt J, Mannfolk P, Jonsen A, et al. Functional connectivity changes in core resting state networks are associated with cognitive performance in systemic lupus erythematosus. J Comp Neurol. 2019;527(11):1837–1856. doi:10.1002/cne.24656
64. Kozora E, Filley CM, Erkan D, et al. Longitudinal evaluation of diffusion tensor imaging and cognition in systemic lupus erythematosus. Lupus. 2018;27(11):1810–1818. doi:10.1177/0961203318793215
65. Wysenbeek AJ, Leibovici L, Weinberger A, et al. Fatigue in systemic lupus erythematosus. Prevalence and relation to disease expression. Br J Rheumatol. 1993;32(7):633–635. doi:10.1093/rheumatology/32.7.633
66. Tench CM, Mccurdie I, White PD, et al. The prevalence and associations of fatigue in systemic lupus erythematosus. Rheumatology. 2000;39(11):1249–1254. doi:10.1093/rheumatology/39.11.1249
 © 2021 The Author(s). This work is published and licensed by Dove Medical Press Limited. The full terms of this license are available at https://www.dovepress.com/terms.php and incorporate the Creative Commons Attribution - Non Commercial (unported, v3.0) License.
By accessing the work you hereby accept the Terms. Non-commercial uses of the work are permitted without any further permission from Dove Medical Press Limited, provided the work is properly attributed. For permission for commercial use of this work, please see paragraphs 4.2 and 5 of our Terms.
© 2021 The Author(s). This work is published and licensed by Dove Medical Press Limited. The full terms of this license are available at https://www.dovepress.com/terms.php and incorporate the Creative Commons Attribution - Non Commercial (unported, v3.0) License.
By accessing the work you hereby accept the Terms. Non-commercial uses of the work are permitted without any further permission from Dove Medical Press Limited, provided the work is properly attributed. For permission for commercial use of this work, please see paragraphs 4.2 and 5 of our Terms.