")
Back to Journals » Clinical Interventions in Aging » Volume 11
Altered spontaneous brain activity pattern in patients with late monocular blindness in middle-age using amplitude of low-frequency fluctuation: a resting-state functional MRI study
Authors Li Q, Huang X, Ye L, Wei R, Zhang Y, Zhong Y, Jiang N, Shao Y
Received 15 July 2016
Accepted for publication 27 October 2016
Published 5 December 2016 Volume 2016:11 Pages 1773—1780
DOI https://doi.org/10.2147/CIA.S117292
Checked for plagiarism Yes
Review by Single anonymous peer review
Peer reviewer comments 2
Editor who approved publication: Dr Zhi-Ying Wu
Qing Li,1,2,* Xin Huang,2,3,* Lei Ye,2 Rong Wei,2 Ying Zhang,2 Yu-Lin Zhong,2,4 Nan Jiang,2 Yi Shao2
1Department of Pharmacy, The Jiangxi Provincial People’s Hospital, Nanchang, Jiangxi, People’s Republic of China; 2Department of Ophthalmology, The First Affiliated Hospital of Nanchang University, Jiangxi Province Clinical Ophthalmology Institute and Oculopathy Research Centre, Nanchang, Jiangxi, People’s Republic of China; 3Department of Ophthalmology, The First People’s Hospital of Jiujiang City, Jiujiang, Jiangxi, People’s Republic of China; 4Department of Ophthalmology, The Affiliated Hospital of Jiujiang University, Jiujiang, Jiangxi, People’s Republic of China
*These authors contributed equally to this work
Objective: Previous reports have demonstrated significant brain activity changes in bilateral blindness, whereas brain activity changes in late monocular blindness (MB) at rest are not well studied. Our study aimed to investigate spontaneous brain activity in patients with late middle-aged MB using the amplitude of low-frequency fluctuation (ALFF) method and their relationship with clinical features.
Methods: A total of 32 patients with MB (25 males and 7 females) and 32 healthy control (HC) subjects (25 males and 7 females), similar in age, sex, and education, were recruited for the study. All subjects were performed with resting-state functional magnetic resonance imaging scanning. The ALFF method was applied to evaluate spontaneous brain activity. The relationships between the ALFF signal values in different brain regions and clinical features in MB patients were investigated using correlation analysis.
Results: Compared with HCs, the MB patients had marked lower ALFF values in the left cerebellum anterior lobe, right parahippocampal gyrus, right cuneus, left precentral gyrus, and left paracentral lobule, but higher ALFF values in the right middle frontal gyrus, left middle frontal gyrus, and left supramarginal gyrus. However, there was no linear correlation between the mean ALFF signal values in brain regions and clinical manifestations in MB patients.
Conclusion: There were abnormal spontaneous activities in many brain regions including vision and vision-related regions, which might indicate the neuropathologic mechanisms of vision loss in the MB patients. Meanwhile, these brain activity changes might be used as a useful clinical indicator for MB.
Keywords: ALFF, monocular blindness, resting state, spontaneous activity
Introduction
Blindness has become a global health problem. There were 32.4 million people suffering from blindness in 2010 globally.1 Blindness can be caused by several ocular diseases, such as glaucoma,2 cataract,3 and globe injury.4 Blindness not only causes difficulties in daily life5 but also results in serious psychological problems (such as anxiety, sadness, and depression) for blind patients.6 Meanwhile, blindness also imposes a heavy economic burden on society. Around $5.5 billion per year is spent on medical care and nursing of blind patients in the USA.7
The visual system consists of the eye, optic nerve, lateral geniculate body, and visual cortex, which are involved in processing visual information. Functional magnetic resonance imaging (fMRI) has been used to evaluate the brain activities in blindness. Blindness leads to abnormality of the visual pathway and visual cortex. Early blindness subjects showed thicker occipital cortex.8 Other studies reported that early blindness patients had stronger auditory and parietal networks and weaker vision-related occipital networks compared with sighted subjects.9 Moreover, the blindness subjects showed decreased voxel-based functional connectivity density in the primary visual cortex (V1) and the primary somatosensory.10 However, changes in spontaneous brain activity were less understood in late monocular blindness (MB).
Amplitude of low-frequency fluctuation (ALFF) is a useful resting-state fMRI analysis method to evaluate regional brain activity at rest. In our previous studies, the ALFF method was successfully used to assess neurological conditions in some eye diseases, such as optic neuritis,11 glaucoma,12 and comitant strabismus.13 ALFF is considered to be a reliable and sensitive measurement, which can be used to evaluate spontaneous neural activity accurately. There were no obvious differences in weight (P=0.704) and age (P=0.973) between the two groups. There were significant marked differences in best-corrected visual acuity (VA)-right (P<0.001), or best-corrected VA-left (P<0.001) between the MB patients and healthy controls (HCs) (Table 1). This study explores changes in brain activity in patients with late MB compared with sighted subjects and investigates its relationship with the clinical manifestations.
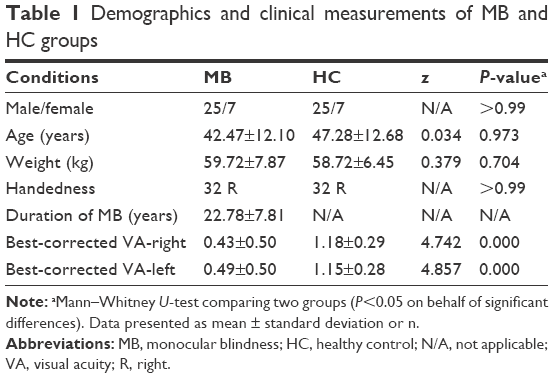 | Table 1 Demographics and clinical measurements of MB and HC groups |
Materials and methods
Subjects
A total of 32 patients with MB (25 males and 7 females) were recruited from the Ophthalmology Department of the First Affiliated Hospital of Nanchang University Hospital. The diagnostic criteria for MB were as follows: 1) late stage of MB (18 patients with ocular trauma and 14 patients with keratitis) and 2) normal contralateral eye without any ocular diseases (such as cataracts, glaucoma, optic neuritis, and retinal degeneration). The exclusion criteria were as follows: 1) bilateral congenital blindness, 2) bilateral late blindness, 3) a history of surgery in both eyes, 4) long-term medical treatment of blindness, and 5) psychiatric disorders (such as depression, bipolar disorder, and sleep disorder) and cerebral infarction diseases (such as cerebral hemorrhage, cerebral infarction, and cerebral vascular malformations).
Thirty-two HCs (25 males and 7 females) with similar age, sex, and education to subjects in the MB group were also recruited in this study. All HCs met the following criteria: 1) no ocular disease with uncorrected or corrected VA >1.0, 2) no psychiatric disorders (such as depression, bipolar disorder, and sleep disorder), and 3) able to be scanned with MRI (eg, no cardiac pacemaker or implanted metal devices). All research methods followed the Declaration of Helsinki and were approved by the Medical Ethics Committee of the First Affiliated Hospital of Nanchang University. Our study was approved by the Institutional Review Board of the First Affiliated Hospital of Nanchang University. All subjects participated voluntarily and were informed of the purposes, contents, and risks before signing an informed consent form.
Methods
MRI parameters
MRI scanning was performed on a 3-Tesla MR scanner (Trio; Siemens, Munich, Germany). The functional data were obtained with a spoiled gradient-recalled echo sequence with the following parameters: 176 images (repetition time =1,900 ms, echo time =2.26 ms, thickness =1.0 mm, gap =0.5 mm, acquisition matrix =256×256, field of view =250×250 mm, flip angle =9°). We also obtained 240 functional images (repetition time =2,000 ms, echo time =30 ms, thickness =4.0 mm, gap =1.2 mm, acquisition matrix =64×64, flip angle =90°, field of view =220×220 mm, 29 axial slices with gradient-recalled echo-planar imaging pulse sequence).
fMRI data analysis
Functional data were classified using MRIcro software (Nottingham University, Nottingham, UK), and incomplete data were removed. The rest of the data was preprocessed by DPARSFA (Institute of Psychology, CAS., Beijing, People’s Republic of China) software, including digital imaging and communications in medicine form transformation, slice timing, head-motion correction, spatial normalization, and smoothening with a Gaussian kernel of 6×6×6 mm3 full width at half maximum. The subjects who had more than 1.5 mm maximum shift in x, y, or z and 1.5° of angular motion were rejected. Friston six head-motion parameters were used to regress out head-motion effects based on recent work showing that higher-order models were more effective in removing head-motion effects.14 Linear regression was also applied to remove other sources of false variables, which contained the signal from ventricular regions of interest and from a region centered in the brain’s white matter.15 After head-motion correction, the functional images were spatially normalized to the Montreal Neurological Institute space using the standard echo-planar imaging template. The time series of the blood-oxygen level dependent signal was converted to the frequency domain using the fast Fourier transform. The square root of the power spectrum was then calculated and averaged across 0.01–0.08 Hz for each voxel. The averaged square root was defined as the ALFF at the given voxel.16 To reduce the global effects of variability across the participants, the ALFF of each voxel was divided by the global mean ALFF value for each participant.
Statistical analysis
Statistical analysis was performed with a general linear model analysis using the SPM8 toolkit (The MathWorks, Inc., Natick, MA, USA) to calculate the ALFF signal group differences in resting state between MB patients and HCs, after controlling for the effects of age. The significance level was set at P<0.05, Gaussian random field theory corrected, minimum z>2.3.
Brain-behavior correlation analysis
Brain areas with different ALFF findings between groups were classified as regions of interest with the resting-state fMRI data analysis toolkit software. Finally, the relationship between the mean ALFF value in each area in the MB group and behavioral performances was calculated using correlation analysis (P<0.05 significant differences).
Clinical data analysis
The cumulative clinical measurements, including the duration of the onset of MB and best-corrected VA, were recorded and analyzed in the study with independent sample t-test (P<0.05 significant differences).
Results
ALFF differences
Compared with HCs, MB patients showed lower ALFF values in the left cerebellum anterior lobe, right parahippocampal gyrus, right cuneus (most significant difference), and left precentral gyrus/paracentral lobule (Figure 1 [blue] and Table 2). In contrast, higher ALFF values in the MB group were observed in the right middle frontal gyrus (MFG), left MFG (most significant difference), and left supramarginal gyrus (SMG) (Figure 1 [red] and Table 2). The mean ALFF values between the two groups were shown in Figure 2. In the MB group, there was no significant correlation between the mean ALFF values in these regions and the clinical manifestations (P>0.05).
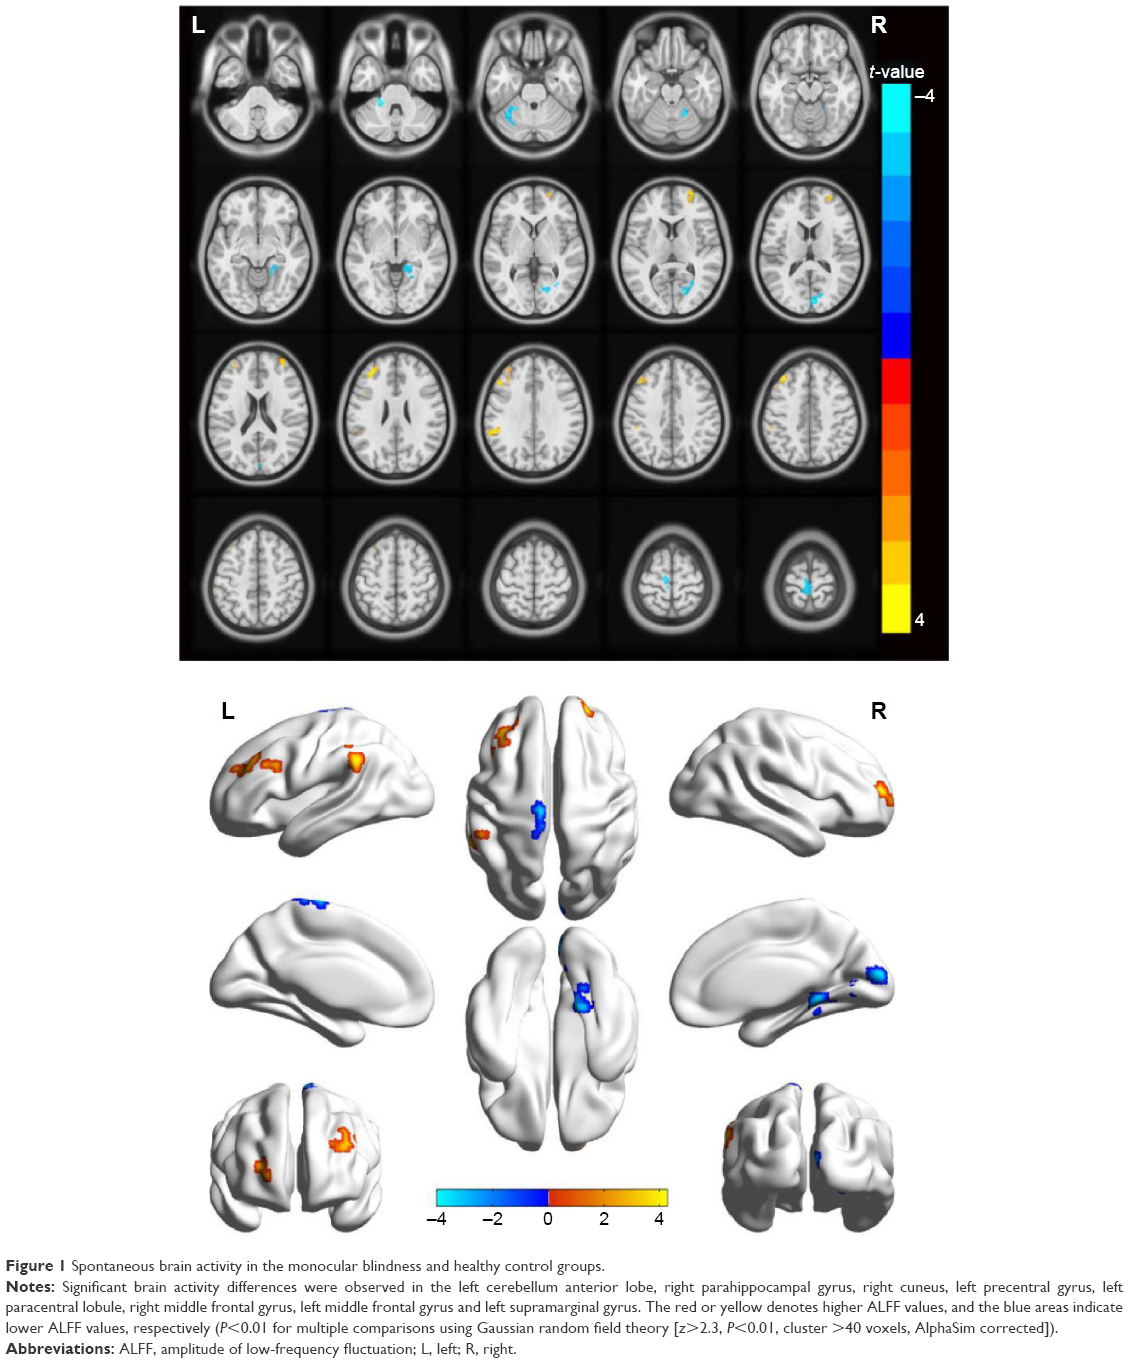 | Figure 1 Spontaneous brain activity in the monocular blindness and healthy control groups. |
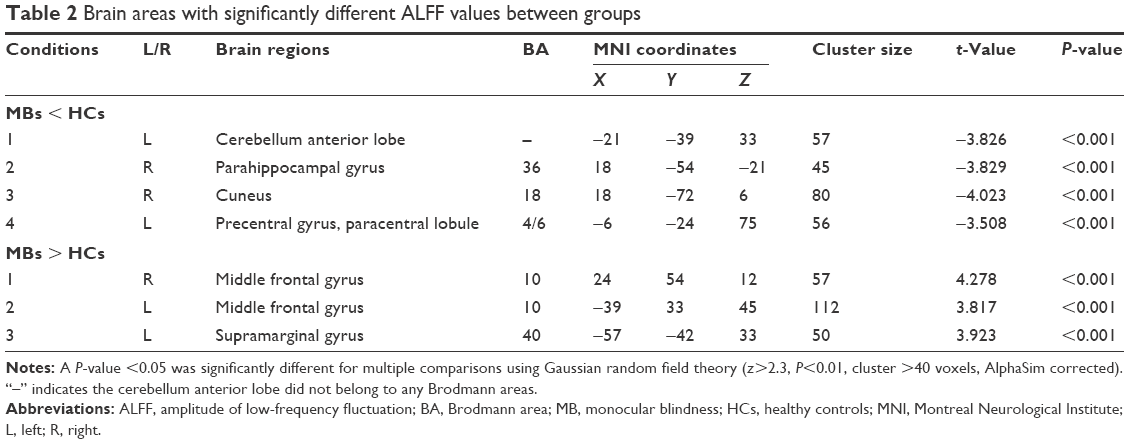 | Table 2 Brain areas with significantly different ALFF values between groups |
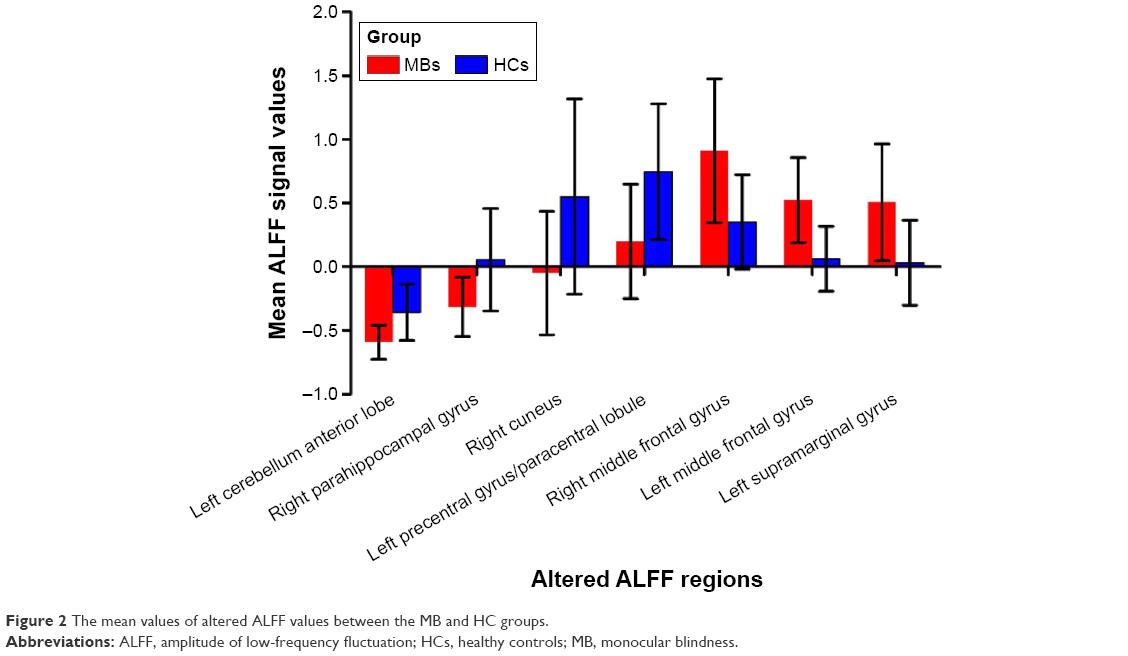 | Figure 2 The mean values of altered ALFF values between the MB and HC groups. |
Receiver operating characteristic curve
We hypothesized that the ALFF differences between the two groups might be useful diagnostic markers. The mean ALFF values in different brain regions were analyzed using the receiver operating characteristic (ROC) curves. When the area under the curve (AUC) is 0.5–0.7 it indicates accuracy is low, if it is 0.7–0.9 accuracy is certain. The AUCs for ALFF values were as follows: left cerebellum anterior lobe (0.824), right parahippocampal gyrus (0.796), right cuneus (0.731), and left precentral gyrus/left paracentral lobule (0.784) (MBs > HCs) (Figure 3A); right MFG (0.791), left MFG (0.868), and left SMG (0.819) (MBs < HCs) (Figure 3B).
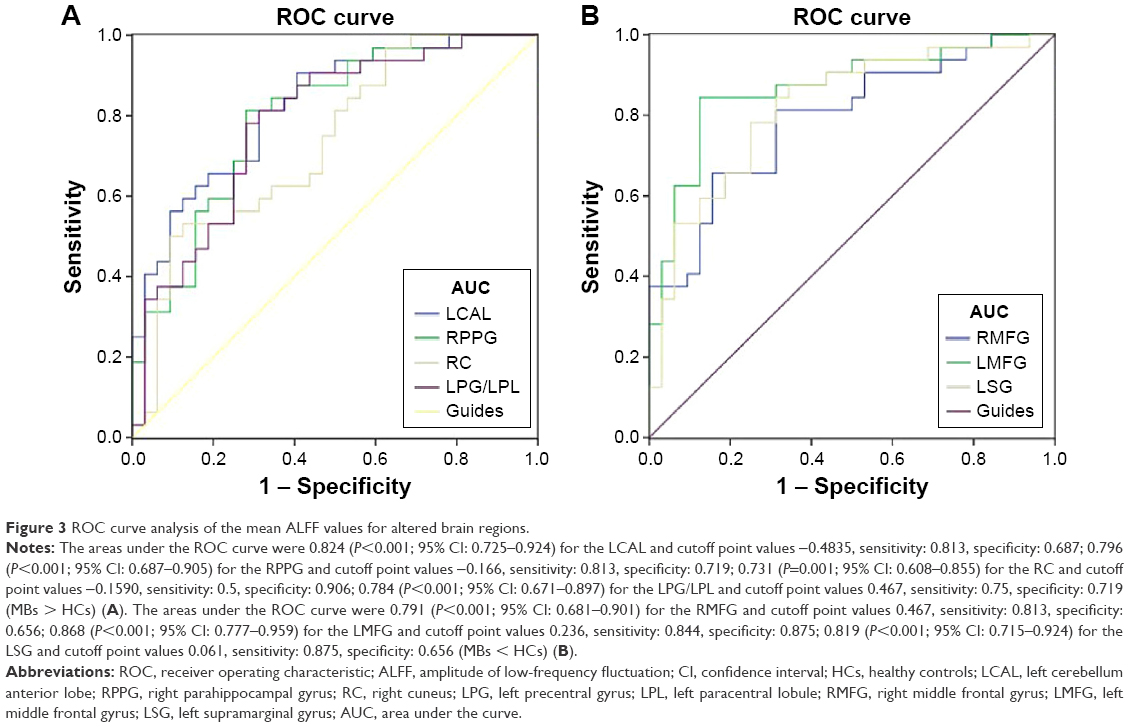 | Figure 3 ROC curve analysis of the mean ALFF values for altered brain regions. |
Discussion
Our study evaluates the effect of middle-aged late MB on resting-state brain activity using the ALFF technique. Compared with HCs, patients with MB had significantly lower ALFF values in the left cerebellum anterior lobe, right parahippocampal gyrus, right cuneus, left precentral gyrus, and left paracentral lobule, but higher ALFF values in the right MFG, left MFG, and left SMG.
Analysis of the decreased ALFF values in the MB
The cuneus is involved in receiving visual information from the retina and is located in the occipital lobe. In addition, the dysfunction of cuneus has been related to many diseases including trigeminal neuralgia17 and schizophrenia.18 A previous study reported significantly decreased functional connectivities in the occipital visual cortex in the early blind patients.19 However, in our study, we observed that late MB patients showed significantly decreased ALFF values in the right cuneus, indicating cuneus dysfunction. We speculated that the late MB might lead to the abnormalities of the cuneus.
The parahippocampal gyrus is located in the inferior temporo-occipital cortex, surrounding the hippocampus. The parahippocampal gyrus is involved in visual scenes,20 cognition,21 and spatial control.22 The parahippocampal gyrus has been suggested to control the processing of object and scene information.23 A previous study showed the activation of the parahippocampal gyrus when a three-dimensional spatial structure was presented.24 In addition, the dysfunction of the parahippocampal gyrus occurs in many diseases such as Alzheimer’s disease25 and schizophrenia.26 A previous report had demonstrated that MB patients showed less activity in the right dorsal parahippocampal gyrus compared with HCs.27 Consistent with these findings, we also found that there were significantly lower ALFF values in the right parahippocampal gyrus in the MB patients. These results suggested that the late stage MB might lead to the dysfunction of the parahippocampal gyrus.
The cerebellum is involved in the execution of motor control. In addition, the cerebellum also regulates cognition.28,29 The cerebellum has been shown to be involved in the execution of accurate eye movement.30 Moreover, dysfunction of the cerebellum has been shown in many diseases such as autism,31 schizophrenia,32 and ataxia.33 A pervious study showed that there is increased blood flow in early blindness.34 Another study reported that MB patients showed lower benzodiazepine receptor density in the cerebellum compared with HCs.35 In our study, we also found that MB patients had significantly lower ALFF values in the left cerebellum anterior lobe. Both MB and binocular blindness can lead to the dysfunction of the cerebellum. Thus, we speculated that MB might cause dysfunction of the cerebellum.
Analysis of the increased ALFF values in the MB
The MFG is one-third of the frontal lobe and is involved in the working memory36 and attention control.37 A previous study demonstrated that early blindness showed decreased functional connectivity between the right planum temporale and parietal and frontal areas.38 That is to say, bilateral blindness may lead to lower activation in frontal regions. In contrast, we found that MB patients showed significantly increased ALFF values in the MFG. Enhanced activity in MFG may result from the compensation of the contralateral vision eye. The results might indicate that MB patients have enhanced function of MFG to compensate for the monocular vision.
The SMG in the inferior lateral part of the parietal lobe is involved in phonological encoding.39 A previous study demonstrated that the SMG was activated when the healthy participants made phonological word decisions.40 In the meanwhile, the SMG is responsible for the visual word recognition41 and verbal working memory.42 A previous study demonstrated that congenital blindness patients showed increased functional connectivity in the SMG.43 In our study, we observed significantly higher ALFF values in the left SMG. MB can lead to the dysfunction of SMG overactive. We speculated that the function of phonological encoding and processing might be enhanced to compensate for the loss of vision in the MB patients.
Conclusion
In summary, our results showed that there were abnormal spontaneous activities in many brain regions including vision and vision-related regions, which might indicate the neuropathologic mechanisms of vision loss in the MB patients. In addition, these brain activity changes might be used as a useful clinical indicator for MB.
Prospects and limitations
The ALFF is a useful method that can be used to evaluate the whole-brain activity in patients. In addition, as a method of resting-state fMRI, the ALFF can be performed to scan the subject in the resting state. However, there are several limitations in our study. First, the inclusion criteria for MB are not strict. We included left eye or right eye blindness, which might affect the accuracy of the results. Second, MB patients recruited had different time course of the disease, which might also affect the accuracy of the results. Third, during the scanning process, some subjects had some physical movement, which might influence the scanning results. In future studies, we will comprehensively use various techniques for investigating the neuropathologic changes in MB patients.
Acknowledgments
This study was supported by the National Natural Science Foundation of China (81160118 and 81400372); Natural Science Key Project of Jiangxi Province (No: 20161ACB21017); Jiangxi Province Voyage Project (No: 2014022); Youth Science Foundation of Jiangxi Province (No: 20151BAB215016); and Technology and Science Foundation of Jiangxi Province (No: 20151BBG70223).
Disclosure
This was not an industry-supported study. The authors report no conflicts of interest in this work.
References
Stevens GA, White RA, Flaxman SR, et al. Global prevalence of vision impairment and blindness: magnitude and temporal trends, 1990–2010. Ophthalmology. 2013;120(12):2377–2384. | ||
Malihi M, MouraFilho ER, Hodge DO, Sit AJ. Long-term trends in glaucoma-related blindness in Olmsted County, Minnesota. Ophthalmology. 2014;121(1):134–141. | ||
Brian G, Taylor H. Cataract blindness – challenges for the 21st century. Bull World Health Organ. 2001;79(3):249–256. | ||
Yildiz M, Kivanç SA, Akova-Budak B, Ozmen AT, Çevik SG. An important cause of blindness in children: open globe injuries. J Ophthalmol. 2016;2016:7173515. | ||
Boulton M, Haines L, Smyth D, Fielder A. Health-related quality of life of children with vision impairment or blindness. Dev Med Child Neurol. 2006;48(8):656–661. | ||
Ishtiaq R, Chaudhary MH, Rana MA, Jamil AR. Psychosocial implications of blindness and low vision in students of a school for children with blindness. Pak J Med Sci. 2016;32(2):431–434. | ||
Frick KD, Gower EW, Kempen JH, Wolf JL. Economic impact of visual impairment and blindness in the United States. Arch Ophthalmol. 2007;125(4):544–550. | ||
Voss P, Zatorre RJ. Early visual deprivation changes cortical anatomical covariance in dorsal-stream structures. Neuroimage. 2015;108:194–202. | ||
Boldt R, Seppä M, Malinen S, Tikka P, Hari R, Carlson S. Spatial variability of functional brain networks in early-blind and sighted subjects. Neuroimage. 2014;95:208–216. | ||
Qin W, Xuan Y, Liu Y, Jiang T, Yu C. Functional connectivity density in congenitally and late blind subjects. Cereb Cortex. 2015;25(9):2507–2516. | ||
Huang X, Cai FQ, Hu PH, et al. Disturbed spontaneous brain-activity pattern in patients with optic neuritis using amplitude of low-frequency fluctuation: a functional magnetic resonance imaging study. Neuropsychiatr Dis Treat. 2015;11:3075–3083. | ||
Huang X, ZhongYL, Zeng XJ, et al. Disturbed spontaneous brain activity pattern in patients with primary angle-closure glaucoma using amplitude of low-frequency fluctuation: a fMRI study. Neuropsychiatr Dis Treat. 2015;11:1877–1883. | ||
Tan G, Huang X, Zhang Y, et al. A functional MRI study of altered spontaneous brain activity pattern in patients with congenital comitant strabismus using amplitude of low-frequency fluctuation. Neuropsychiatr Dis Treat. 2016;12:1243–1250. | ||
Satterthwaite TD, Elliott MA, Gerraty RT, et al. An improved framework for confound regression and filtering for control of motion artifact in the preprocessing of resting-state functional connectivity data. Neuroimage. 2013;64:240–256. | ||
Yan CG, Cheung B, Kelly C, et al. A comprehensive assessment of regional variation in the impact of head micromovements on functional connectomics. Neuroimage. 2013;76:183–201. | ||
Zang YF, He Y, Zhu CZ, et al. Altered baseline brain activity in children with ADHD revealed by resting-state functional MRI. Brain Dev. 2007;29:83–91. | ||
Parise M, Kubo TT, Doring TM, Tukamoto G, Vincent M, Gasparetto EL. Cuneus and fusiform cortices thickness is reduced in trigeminal neuralgia. J Headache Pain. 2014;15:17. | ||
Tanskanen P, Ridler K, Murray GK, et al. Morphometric brain abnormalities in schizophrenia in a population-based sample: relationship to duration of illness. Schizophrenia Bulletin. 2010;36(4):766–777. | ||
Liu Y, Yu C, Liang M, et al. Whole brain functional connectivity in the early blind. Brain. 2007;130(Pt 8):2085–2096. | ||
Mégevand P, Groppe DM, Goldfinger MS, et al. Seeing scenes: topographic visual hallucinations evoked by direct electrical stimulation of the parahippocampal place area. J Neurosci. 2014;34(16):5399–5405. | ||
Aminoff EM, Kveraga K, Bar M. The role of the parahippocampal cortex in cognition. Trends Cogn Sci. 2013;17(8):379–390. | ||
Aminoff E, Gronau N, Bar M. The parahippocampal cortex mediates spatial and nonspatial associations. Cereb Cortex. 2007;17(7):1493–1503. | ||
Staresina BP, Duncan KD, Davachi L. Perirhinal and parahippocampal cortices differentially contribute to later recollection of object– and scene-related event details. J Neurosci. 2011;31(24):8739–8747. | ||
Henderson JM, Larson CL, Zhu DC. Full scenes produce more activation than close-up scenes and scene-diagnostic objects in parahippocampal and retrosplenial cortex: an fMRI study. Brain Cogn. 2008;66(1):40–49. | ||
Echávarri C, Aalten P, Uylings HB, et al. Atrophy in the parahippocampal gyrus as an early biomarker of Alzheimer’s disease. Brain Struct Funct. 2011;215(3–4):265–271. | ||
Diederen KM, Neggers SF, Daalman K, et al. Deactivation of the parahippocampal gyrus preceding auditory hallucinations in schizophrenia.Am J Psychiatry. 2010;167(4):427–435. | ||
Jahn K, Wagner J, Deutschländer A, et al. Human hippocampal activation during stance and locomotion: fMRI study on healthy, blind, and vestibular-loss subjects. Ann N Y Acad Sci. 2009;1164:229–235. | ||
Buckner RL. The cerebellum and cognitive function: 25 years of insight from anatomy and neuroimaging. Neuron. 2013;80(3):807–815. | ||
Timmann D, Daum I. Cerebellar contributions to cognitive functions: a progress report after two decades of research. Cerebellum. 2007;6(3):159–162. | ||
Striemer CL, Chouinard PA, Goodale MA, de Ribaupierre S. Overlapping neural circuits for visual attention and eye movements in the human cerebellum. Neuropsychologia. 2015;69:9–21. | ||
Hampson DR, Blatt GJ. Autism spectrum disorders and neuropathology of the cerebellum. Front Neurosci. 2015;9:420. | ||
Andreasen NC, Pierson R. The role of the cerebellum in schizophrenia. Biol Psychiatry. 2008;64(2):81–88. | ||
Ahsgren I, Baldwin I, Goetzinger-Falk C, et al. Ataxia, autism, and the cerebellum: a clinical study of 32 individuals with congenital ataxia. Dev Med Child Neurol. 2005;47(3):193–198. | ||
Uhl F, Franzen P, Podreka I, Steiner M, Deecke L. Increased regional cerebral blood flow in inferior occipital cortex and cerebellum of early blind humans. Neurosci Lett. 1993;150(2):162–164. | ||
Sanabria-Bohórquez SM, De Volder AG, Arno P, et al. Decreased benzodiazepine receptor density in the cerebellum of early blind human subjects. Brain Res. 2001;888(2):203–211. | ||
Morgan HM, Jackson MC, van Koningsbruggen MG, Shapiro KL, Linden DE. Frontal and parietal theta burst TMS impairs working memory for visual-spatial conjunctions. Brain Stimul. 2013;6(2):122–129. | ||
Japee S, Holiday K, Satyshur MD, Mukai I, Ungerleider LG. A role of right middle frontal gyrus in reorienting of attention: a case study. Front Syst Neurosci. 2015;9:23. | ||
Dormal G, Rezk M, Yakobov E, Lepore F, Collignon O. Auditory motion in the sighted and blind: early visual deprivation triggers a large-scale imbalance between auditory and “visual” brain regions. Neuroimage. 2016;134:630–644. | ||
Sliwinska MW, Khadilkar M, Campbell-Ratcliffe J, Quevenco F, Devlin JT. Early and sustained supramarginal gyrus contributions to phonological processing. Front Psychol. 2012;3:161. | ||
Hartwigsen G, Baumgaertner A, Price CJ, Koehnke M, Ulmer S, Siebner HR. Phonological decisions require both the left and right supramarginal gyri. Proc Natl Acad Sci U S A. 2010;107(38):16494–16499. | ||
Stoeckel C, Gough PM, Watkins KE, Devlin JT. Supramarginal gyrus involvement in visual word recognition. Cortex. 2009;45(9):1091–1096. | ||
Deschamps I, Baum SR, Gracco VL. On the role of the supramarginal gyrus in phonological processing and verbal working memory: evidence from rTM Sstudies. Neuropsychologia. 2014;53:39–46. | ||
Heine L, Bahri MA, Cavaliere C, et al. Prevalence of increases in functional connectivity in visual, somatosensory and language areas in congenital blindness. Front Neuroanat. 2015;9:86. |
 © 2016 The Author(s). This work is published and licensed by Dove Medical Press Limited. The full terms of this license are available at https://www.dovepress.com/terms.php and incorporate the Creative Commons Attribution - Non Commercial (unported, v3.0) License.
By accessing the work you hereby accept the Terms. Non-commercial uses of the work are permitted without any further permission from Dove Medical Press Limited, provided the work is properly attributed. For permission for commercial use of this work, please see paragraphs 4.2 and 5 of our Terms.
© 2016 The Author(s). This work is published and licensed by Dove Medical Press Limited. The full terms of this license are available at https://www.dovepress.com/terms.php and incorporate the Creative Commons Attribution - Non Commercial (unported, v3.0) License.
By accessing the work you hereby accept the Terms. Non-commercial uses of the work are permitted without any further permission from Dove Medical Press Limited, provided the work is properly attributed. For permission for commercial use of this work, please see paragraphs 4.2 and 5 of our Terms.