")
Back to Journals » Diabetes, Metabolic Syndrome and Obesity » Volume 13
Altered Intrinsic Brain Activities in Patients with Diabetic Retinopathy Using Amplitude of Low-frequency Fluctuation: A Resting-state fMRI Study
Authors Qi CX , Huang X, Shen Y
Received 22 April 2020
Accepted for publication 10 July 2020
Published 13 August 2020 Volume 2020:13 Pages 2833—2842
DOI https://doi.org/10.2147/DMSO.S259476
Checked for plagiarism Yes
Review by Single anonymous peer review
Peer reviewer comments 2
Editor who approved publication: Prof. Dr. Antonio Brunetti
Chen-Xing Qi, Xin Huang, Yin Shen
Eye Center, Renmin Hospital of Wuhan University, Wuhan 430060, Hubei, People’s Republic of China
Correspondence: Yin Shen
Eye Center, Renmin Hospital of Wuhan University, No. 238, Jie Fang Road, Wu Chang District, Wuhan 430060, Hubei, People’s Republic of China
Tel +86 13871550513
Email [email protected]
Objective: The current study aimed to apply the amplitude of low-frequency fluctuation (ALFF) method for investigating the spontaneous brain activity alterations and their relationships with clinical features in patients with diabetic retinopathy (DR).
Patients and Methods: In total, 35 patients with DR (18 males and 17 females) and 38 healthy control (HC) subjects (18 males and 20 females) were enrolled in this study. All participants underwent resting-state functional magnetic resonance imaging (rs-fMRI) scanning, respectively. The ALFF method was used to assess the spontaneous brain activity, while the mean ALFF signal values of patients with DR and HCs were classified by the receiver operating characteristic (ROC) curve. Correlation analysis was performed to calculate the relationship between the observed mean ALFF values of the altered regions in patients with DR and their clinical features.
Results: Compared with the HCs, patients with DR had significantly lower ALFF values in the left and right middle occipital gyrus (MOG). In contrast, patients with DR showed higher ALFF values in the left cerebellum (CER), left inferior temporal gyrus (ITG) and left hippocampus (Hipp). However, no relationship was observed between the mean ALFF signal values of the altered regions and clinical manifestations in the patients with DR.
Conclusion: We mainly found that patients with DR showed abnormal intrinsic brain activities in the left and right MOG, left CER, left ITG and left Hipp, which might provide useful information for explaining neural mechanisms in patients with DR.
Keywords: diabetic retinopathy, amplitude of low-frequency fluctuations, resting state, functional magnetic resonance imaging
Introduction
Diabetic retinopathy (DR) is the leading cause of blindness in working-age adults and is expected to be an important future health concern due to the rising incidence of diabetes. DR can be categorized as nonproliferative and proliferative, based on clinical assessments of disease progression.1 Patients with nonproliferative DR show increased permeability of retinal vessels, as well as micro-aneurysms, exudate deposition, and microhemorrhages. Proliferative DR is more severe than nonproliferative DR; although affected patients exhibit clinical symptoms similiar to those of patients with nonproliferative DR, they also exhibit new blood vessels. These pathological blood vessels are fragile and tend to cause vitreous hemorrhage and tractional retinal detachment. Moreover, diabetic macular edema is a common clinical feature of proliferative DR, which can cause serious vision problems for patients with DR.2 There are several risk factors for DR, including hyperglycemia, hypertension, dyslipidemia, obesity, duration of diabetes, and pregnancy.3 The World Health Organization estimated that DR contributes to 4.8% of the cases of blindness worldwide.4 Currently, 92.6 million patients with diabetes are estimated to have any form of DR; the total number of people with DR will presumably continue to rise due to a lack of awareness regarding DR, particularly in low-middle-income countries.5
The retinal microvasculature is similar to the cerebral microvasculature in terms of anatomical, biological, and embryological features; thus, retinopathy is regarded as a biomarker of cerebrovascular abnormalities.6 DR patients might exhibit abnormalities in the central nervous system. A previous study noted that patients with diabetes who had an advanced retinopathy also showed increased focal cortical atrophy on brain magnetic resonance imaging (MRI).7 Lin et al found that alterations related to DR in brain metabolite levels were identified across most brain areas; these alterations were associated with peripheral glucose metabolism.8 There is compelling evidence that functional and structural cerebral changes in patients with DR may contribute to the progression of visual impairment.9,10 And growing evidence demonstrated that DR might be a potential predictor of cognitive decline progression in diabetes patients.11,12 In addition, retinal microvascular abnormalities constitute useful clinical biomarkers for cognitive decline.13 Gupta et al demonstrated that strategies focusing on DR screening and prevention of DR progression may reduce the risk of cognitive impairment in patients with diabetes mellitus (DM).14 Dai et al reported that patients with DR showed altered brain functional networks, with specific decline in cognition, visual function, and motor function.15
The studies mentioned above have shown that patients with DR exhibit the altered structural and functional changes in brain regions. However, it is largely unknown whether and how the spontaneous brain activity changes in patients with DR; the relationship of spontaneous brain activity with clinical manifestations in these patients is also unclear. The human brain is a complex dynamic system capable of generating low-frequency oscillations (LFOs) at rest. The pathophysiology of many human brain disorders may be associated with changes in spontaneous low-frequency (0.00–0.08 Hz) blood oxygenation level-dependent (BOLD) fluctuations measured during a resting state. Electrophysiological studies have shown that LFOs may reflect spontaneous neuronal activity, which manifests as rhythmic activity between interconnected brain regions.16 LFOs (0.01–0.08 Hz) of BOLD signals in the brain are physiologically important, especially in terms of visual and cognitive functions.17 The spatial distribution of LFOs constitutes the basis of the structure and functional organization of the human brain, where higher LFO frequency power is present in the cortical region, while lower LFO frequency power is present in the subcortical region.18 Resting-state functional MRI (rs-fMRI) is a reliable and noninvasive technique that has a good signal-to-noise ratio, requires minimal subject compliance, and is well suited for exploring the brain and central nervous system. Amplitude of low-frequency fluctuation (ALFF) is a useful rs-fMRI analytic method for assessment of the activity of brain regions by measuring LFOs (0.01–0.08 Hz) in BOLD signals at rest.19 From an intraregional perspective, ALFF is an advanced approach for analysis of rs-fMRI data that uses voxel-based analysis and directly reflects the intensity of spontaneous neuronal activity in the baseline state.20 The ALFF method has been successfully applied to evaluate the neural mechanisms of eye diseases including glaucoma,21 retinitis pigmentosa,22 and retinal vein occlusion.18 Here, we aimed to determine whether patients with DR show abnormal spontaneous brain activity compared to healthy controls (HCs) using the ALFF method. We investigated the relationships between the mean ALFF signal values and clinical features, including duration of DM, fasting blood glucose, and best-corrected visual acuity (BCVA). We hypothesized that patients with DR would show altered spontaneous brain activity in several brain regions associated with visual and cognitive functions. Our findings might provide new insights into underlying neural mechanisms in DR.
Patients and Methods
Participants
A total of thirty-five patients with DR treated at the eye center of Renmin Hospital of Wuhan University between December 2018 and July 2019 were enrolled in the study. Thirty-eight HCs that were matched with the DR patients in terms of age, gender, and handedness were also recruited from the local community. All of the subjects participated in the study met the following criteria: (1) capable of undergoing MRI scanning (no cardiac pacemaker, insulin pump or implanted metal devices); (2) no history of psychiatric disease, claustrophobia or cardiovascular disease; (3) no apparent cerebral diseases based on T1-weighted images (T1WI); (4) no drugs or alcohol addiction; (5) right-handed.
All the patients fulfilled the criteria for nonproliferative DR diagnosed by two experienced ophthalmologists according to the International Clinical Diabetic Retinopathy Disease Severity Scale.23 Inclusion criteria for DR subjects were as follows: (1) caused by type 2 diabetes mellitus (T2DM) (T2DM was diagnosed using the criteria established by the American Diabetes Association: fasting plasma glucose ≥7.0 mmol/L, random plasma glucose ≥11.1 mmol/L or two hours glucose ≥11.1 mmol/L); (2) based on funduscopy and fundus fluorescein angiography, nonproliferative DR exhibited signs of retinal hemorrhage, microaneurysm and hard exudates; (3) fMRI was performed prior to DR surgery and laser treatment.
The exclusion criteria of individuals with DR in the present study were: (1) DR accompanied by diabetic nephropathy (urinary albumin/creatinine ratio >30 mg/g for more than three months), diabetic neuropathy (the presence of pain, numbness, paresthesia, as well as abnormal nerve conduction function); (2) the presence of additional ocular-related complications (eg cataract, glaucoma, corneal ulcer, optic neuritis, and retinal detachment); (3) those with psychiatric disorders (eg depression, sleep disorders, and bipolar disorders); (4) those with cerebral diseases (including cerebral infarction, cerebral hemorrhage, cerebrovascular malformation, brain tumor, cerebral trauma, and surgery history).
All HCs in the study must fulfill the following criteria: (1) no ocular disease with uncorrected or corrected VA ≥1.0; (2) no type of diabetes mellitus and autoimmune diseases; (3) those who were not pregnant or breastfeeding at the time of the study.
The protocol of the research was in accordance with the Declaration of Helsinki and was formally approved by the Ethical Committee for Medicine of the Renmin Hospital of Wuhan University, Hubei Province, People’s Republic of China. All participants enrolled in the study of their own accord and provided written informed consent.
MRI Parameters
All brain MR imaging was acquired using a 3-Tesla MR scanner (Discovery MR 750W system;GE Healthcare, Milwaukee, WI, USA) with an eight-channel phased-array head coil. During the whole MRI scanning, subjects were required to keep their eyes closed while awake and keep their mind blank. We used earplugs and foam pads to minimize scanner noise and head motion. 3D T1WI with three-dimensional fast spoiled gradient-echo sequences was scanned prior to BOLD-fMRI sequence. The respective scanning parameters were shown in Table 1.
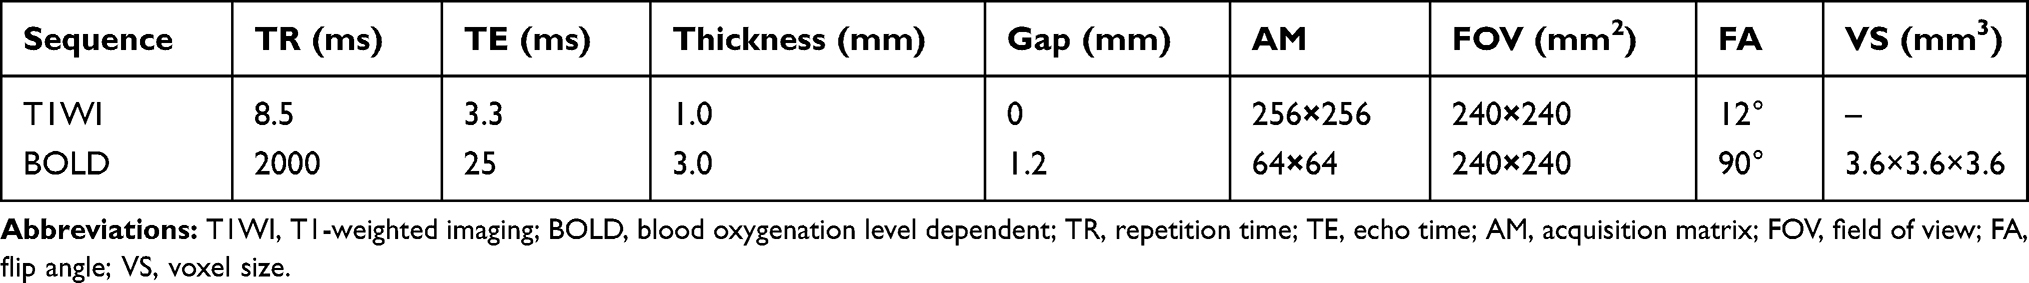 |
Table 1 Scanning Parameters of T1WI and BOLD Sequence |
MRI Data Processing
All functional images were preprocessed employing the Data Processing & Analysis of Brain Imaging (DPABI, http://www.rfmri.org/dpabi) toolbox, and Statistical Parametric Mapping (SPM8, http://www.fil.ion.ucl.ac.uk/spm/software/spm8) implemented in MATLAB 2013a (MathWorks, Natick, MA, USA). Standard preprocessing steps were conducted on the rs-fMRI data sets, described in the following steps: (1) data format was converted to NIFTI format, and the first ten time-point images were discarded to achieve steady-state magnetization equilibration; (2) then, corrected for slice timing and head motion. We removed those movements more than 2 mm or rotation exceeded 2° during scanning; (3) the remaining functional images were spatially normalized using an echo-planar imaging standard template from the Montreal Neurological Institute (MNI) with s resolution of 3×3×3 mm3; (4) estimated smoothness was used to spatially smooth the images, after regressing out several nuisance signals (including global mean signals, six head motion parameters, cerebrospinal fluid signals, and white matter signals); (5) finally, linear detrending and temporal bandpass filtering (0.01–0.08 Hz) were applied to reduce the effects of physiological noise.
ALFF Calculation
ALFF is thought to reflect spontaneous neural activity in humans. After the preprocessing, the time series of each voxel was transformed to the frequency domain with a Fast Fourier Transform and the power spectrum was then obtained based on DPABI software. The square root of the power spectrum was z-transformed with Fisher’s r-to-z transformation to reduce the global impact of variability across the participants. This finally created a standardized whole-brain ALFF map.
Statistical Analysis
Variables of the demographic and clinical features of the DR and HC groups were analyzed using the SPSS software version 16.0 (SPSS Inc, Chicago, Illinois, USA) via chi-squared test and independent-samples t-test. P value <0.05 was considered to have a significant statistical difference.
A one-sample t-test was performed to assess the mean ALFF results within each group using the SPM8 software. The mean ALFF values in each voxel of the two groups were compared by a two-sample t-test based on the SPM8 software (two-tailed, voxel-level P<0.01, Gaussian random field correction, cluster-level P<0.05). Age and sex were incorporated as covariates.
The relationship between the ALFF values in significantly altered regions and clinical features in the DR group was calculated using Pearson correlation. The regions of the cerebrum with a distinctly different mean ALFF signal value between the two groups were assessed using the receiver operating characteristic (ROC) curve. Both the Pearson correlation and the ROC curve were performed using the SPSS software version 16.0.
Results
Demographics and Disease Characteristics
There were no statistically significant differences between the DR and HC groups in gender (P=0.918) or age (P=0.719), but significant differences in BCVA of the right eye (P<0.001), and left eye (P<0.001). The results of these data were listed in Table 2.
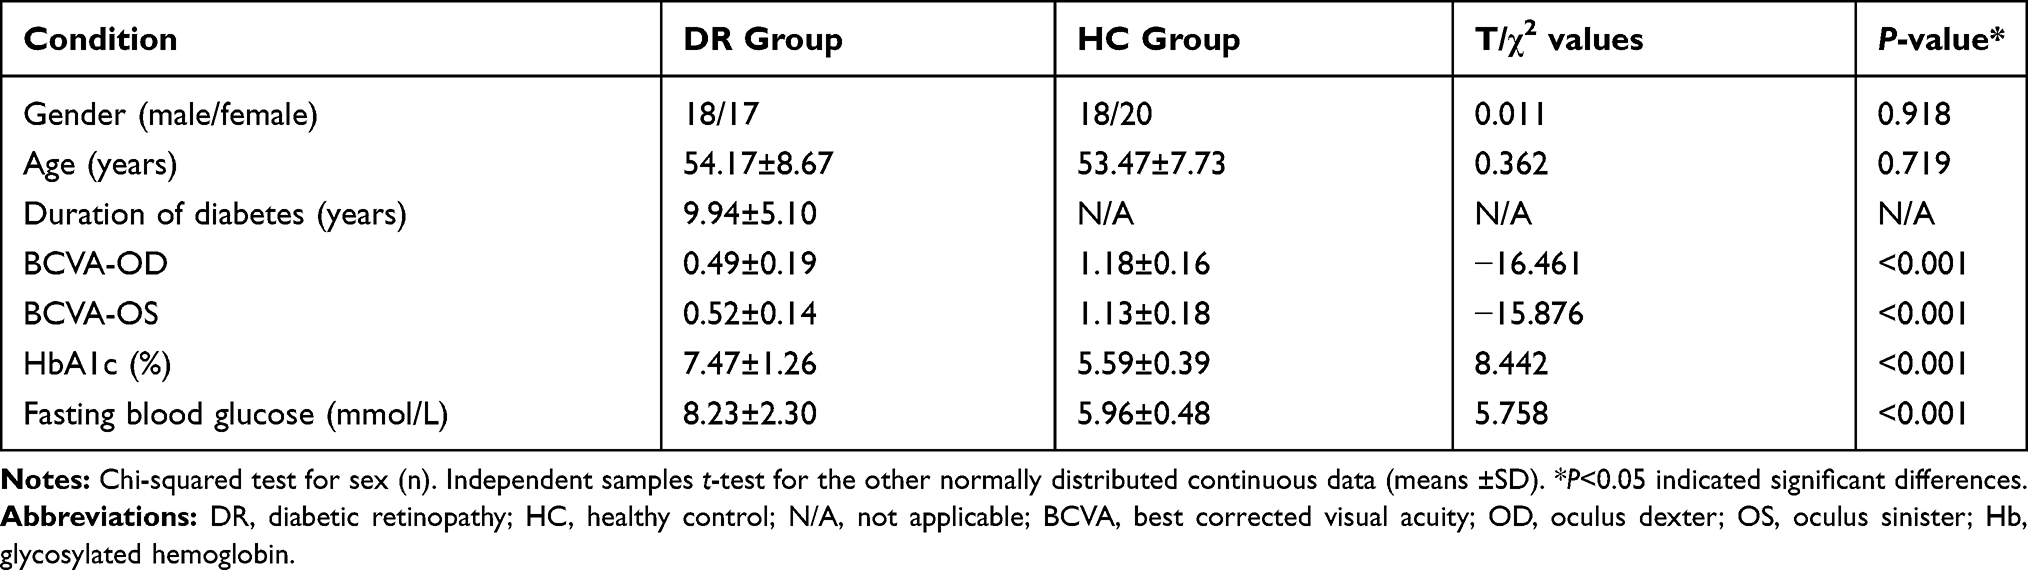 |
Table 2 Characteristics of Participants Included in the Study |
Imaging of the Retinal Fundus
Figure 1A and C shows fundus photography and fluorescein fundus angiography of a right eye, showing the following signs of the HCs: no exudation, edema, and no microaneurysm formation. The Figure 1B is typical fundus photography of the right eye, presenting the following signs of DR: retinal punctate hemorrhage, hard exudation, and microaneurysms formation. Fluorescein fundus angiography (Figure 1D) showed strong fluorescence at the later stage of angiography: there are visible retinal hemorrhages and fluorescein leakage.
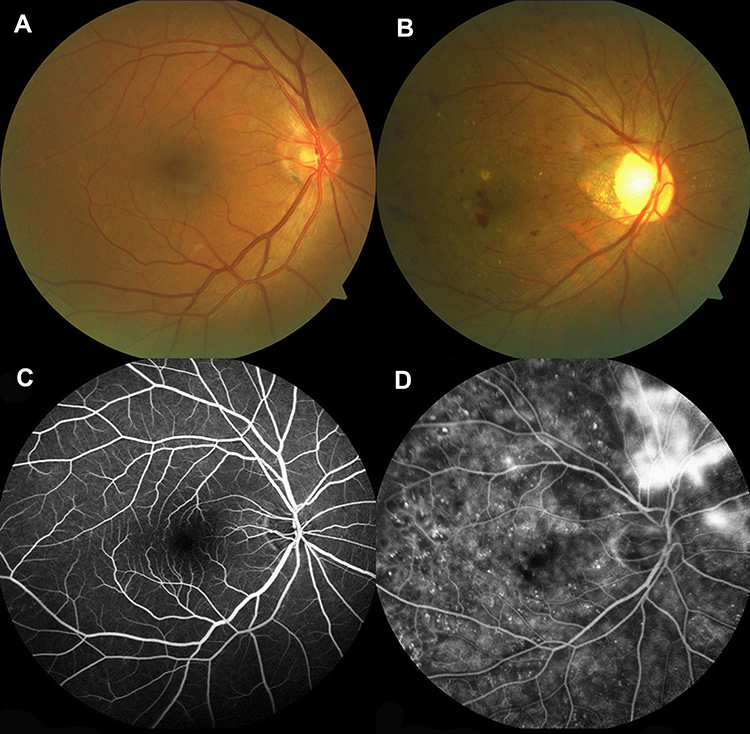 |
Figure 1 Examples of retinal fundus photography and fluorescence fundus angiography in the DR patients and HC group. |
Group Differences in ALFF
The spatial distribution of ALFF maps of the DR and HCs within each group was shown in Figure 2. Compared with the HCs, patients with DR had significantly lower ALFF values in the left and right middle occipital gyrus (MOG). In contrast, patients with DR showed higher ALFF values in the left cerebellum (CER), left inferior temporal gyrus (ITG) and left hippocampus (Hipp) (Figure 3 and Table 3). However, no relationship was observed between the mean ALFF signal values of the altered regions and clinical manifestations in the patients with DR.
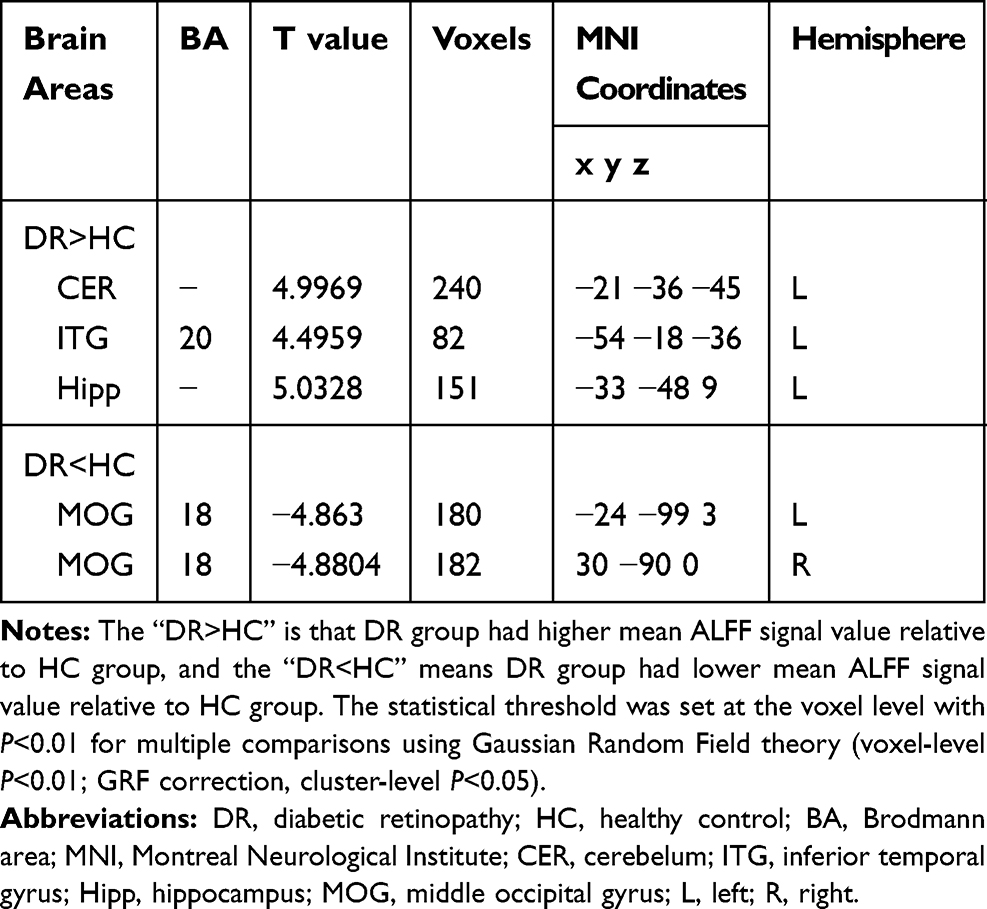 |
Table 3 Brain Areas with Significantly Different ALFF Values Between Two Groups |
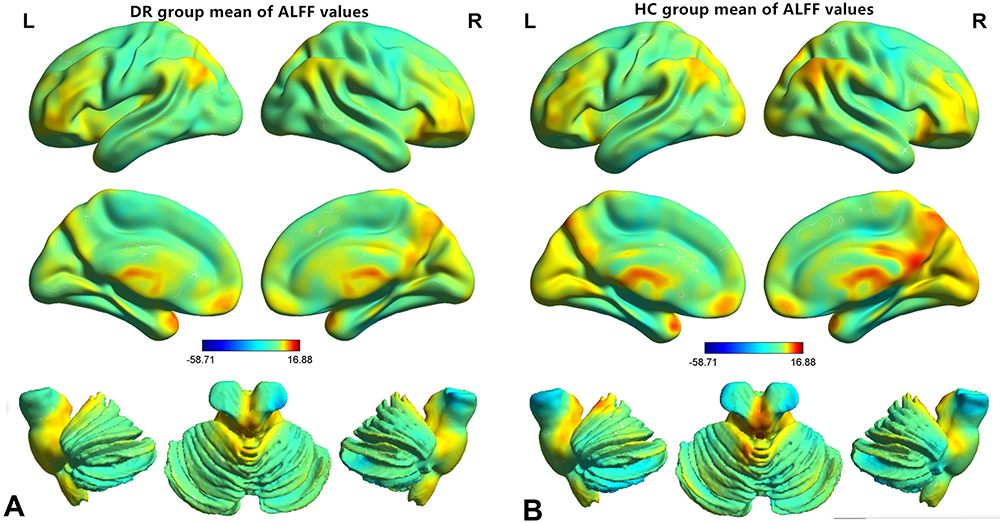 |
Figure 2 Distribution patterns of ALFF were observed at the group level in DR and HC groups in the typical frequency band (0.01–0.08 Hz). |
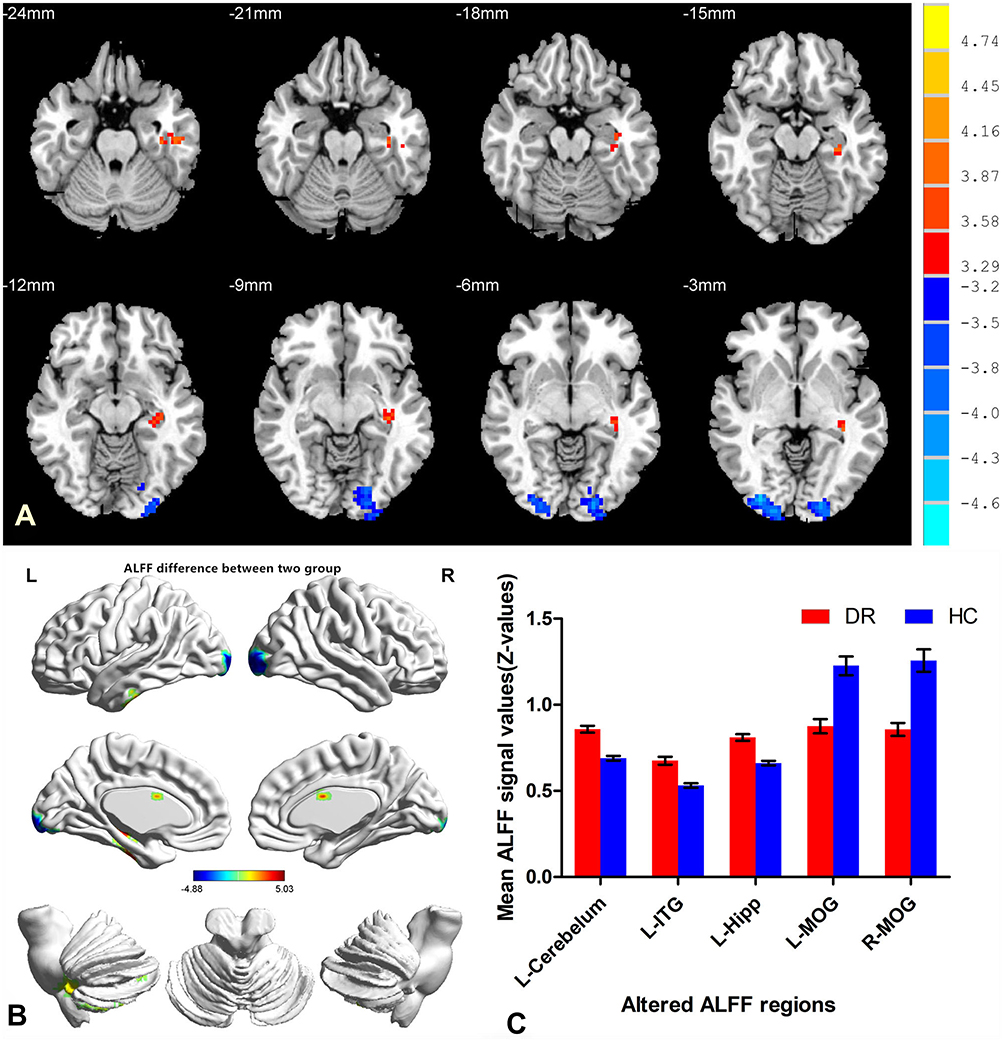 |
Figure 3 Spontaneous brain activity in the DRs and HCs. |
ROC Curve
The ROC curve was utilized to analyze the mean ALFF signal values of the different brain areas between DR and HC groups. The area under the ROC curve (AUC) represented the diagnosis rate. AUC values of 0.5 to ~0.7 indicated low accuracy, AUC values between 0.7 and ≤0.9 indicated medium accuracy, and AUC values exceeding 0.9 are considered high accuracy. The AUC for ALFF values was shown as follows: left CER (0.897; P<0.001; 95%CI=0.827–0.967), left ITG (0.823; P<0.001; 95%CI=0.728–0.918) and left Hipp (0.866; P<0.001; 95%CI=0.786–0.946) (Figure 4A); left MOG (0.809; P<0.001; 95%CI=0.710–0.908) and right MOG (0.805; P<0.001; 95%CI=0.706–0.905) (Figure 4B).
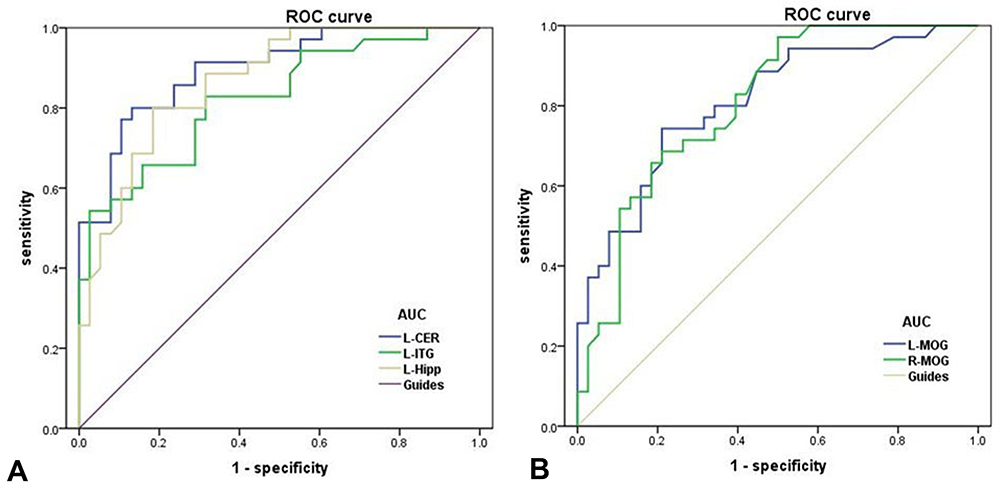 |
Figure 4 ROC curve analysis of the mean ALFF values for altered brain regions within two groups. |
Discussion
At present, there is no satisfactory treatment that allows patients with DR to recover good vision; thus, there is an urgent need to clarify the pathological mechanism involved in DR. ALFF is an index of LFOs that can focus on the neural processes of important regions, rather than correlations among regions. In the present study, we compared the resting-state ALFF in the brains of patients with DR and HCs. We found significantly elevated ALFF in the left CER, left ITG, and left Hipp; we found significantly reduced ALFF in the bilateral MOG.
The MOG is a component of the occipital cortex that performs visual spatial processing. In addition, the MOG is a vital component of the dorsal visual pathways. The MOG has been shown to play important roles in effective dysfunction and category-selective attention.24 Dogan et al found that patients with DR showed elevations in apparent diffusion coefficient values in the visual cortex, which supported the association between DR and brain microstructural damage.10 Moreover, a conventional MRI study of gray matter density in DR individuals and patients with DM, revealed that patients with DR showed significantly reduced gray matter density in the occipital lobe, according to voxel-based morphometry results.7 Retinal ganglion cells are known to play key roles in visual stimulation.25 The pathological mechanisms of DR involve retinal vascular leakage, altered retinal thickness, and retinal ganglion cell loss. These retinal abnormalities lead to the disruption of visual signals and the reduction of visual stimulation.9 Therefore, visual stimuli processing abnormalities may cause changes in spontaneous neuronal activity in the visual regions. In the present study, the ALFF values of the right/left MOG were significantly lower in patients with DR than in the HC group, suggesting that MOG function is reduced in patients with DR.
The Hipp is a critical hub in the default mode network (DMN), a network responsible for spontaneous cognition. Characterized as an integrated network, the brain’s DMN has been defined as a distributed set of regions in associated cortices that showed elevated spontaneous activity during wakeful rest.26 The Hipp is also a key structure of the limbic system, which is involved in learning, episodic memory, and spatial navigation.27 An rs-fMRI study demonstrated elevated functional connectivity between the left Hipp and left MOG, which may reflect memory impairment and sleep disturbance in patients with major depressive disorder.28 DR is reportedly associated with cognitive decline, especially in the domains of learning, memory, and mental speed.29 Patients with T2DM and mild cognitive impairment reportedly showed significant ALFF changes in a variety of brain regions, including the Hipp, which reflected aggravated cognitive and brain functional impairment.30 Consistent with the findings of previous studies, significant ALFF elevation was observed in the Hipp of patients with DR in the present study; this may be a compensatory reallocation or recruitment of cognitive resources from other regions.
With respect to cognitive function, compared to HCs, patients with DR showed increased ALFF values in the left CER in our study. The CER is typically regarded as a component of pathways related to balance and motor control;31 some studies have reported that the CER is also involved in higher cognitive processes.32,33 Prior studies have demonstrated increased risks of cognitive impairment in patients with DR.15,34 Moreover, Wang et al found that patients with T2DM showed abnormal spontaneous brain activity in the posterior lobe of the CER, compared with HCs; this abnormal activity was associated with poor cognitive performance.35 Cognitive deficits in patients with DR are presumably due to changes in neural function and neurotransmitter metabolism, as well as the loss of the blood–brain barrier.36 Thus, we speculate that elevated spontaneous brain activity in the CER may serve as compensation for other types of cognitive-related brain dysfunction in patients with DR.
The ITG is located on the ventral and medial surfaces of the temporal lobe. The ITG is regarded as a key component of the ventral visual pathway implicated in visual memory and visual shape categorization.37 In addition, previous studies have demonstrated that the inferotemporal cortex contains shape-selective neurons, which underlie the recognition and categorization of three-dimensional objects.38 Recent clinical experimental and neuroimaging studies have demonstrated that, in addition to retinal microvascular changes, the visual impairment of patients with DR is related to abnormities in the cerebral visual pathway and neural activities of visual network areas.9,39 Yu et al reported that patients with T2DM displayed significant changes in the absolute cerebral blood flow-mean ALFF coupling of the cerebral blood flow-network, which was involved in the temporal lobe.40 A neuroimaging study also revealed that patients with T2DM and mild cognitive impairment exhibited significant ALFF alterations in the temporal lobe.30 Consistent with the prior findings, we observed significantly higher ALFF values in the left ITG of patients with DR, indicating stronger local spontaneous brain activity than that observed in HCs. Furthermore, the ROC curve in Figure 4 shows that the abnormal ALFF signal value of the left ITG exhibited robust accuracy and excellent specificity for distinguishing between the two groups. The elevated intrinsic brain activity in the left ITG might suggest ITG function is enhanced in patients with DR.
Conclusion
In summary, the ALFF method is a reliable index of LFOs, which can focus on the neural activity of key regions. Compared to HCs, patients with DR exhibited abnormal spontaneous neural activity in a specific subset of brain regions, including the MOG, CER, ITG, and Hipp. These results imply the presence of impaired cognition and vision in patients with DR, and may enable further exploration of the underlying pathophysiology of DR.
Disclosure
The authors report no conflicts of interest in this work.
References
1. Mark B, David A. Moving past Anti-VEGF: novel therapies for treating diabetic retinopathy. Int J Mol Sci. 2016;17(9):1498–1521. doi:10.3390/ijms17091498
2. Ranchod TM, Fine SL. Primary treatment of diabetic macular edema. Clin Interv Aging. 2009;4:101–107. doi:10.2147/CIA.S4357
3. Ting DSW, Cheung GCM, Wong TY. Diabetic retinopathy: global prevalence, major risk factors, screening practices and public health challenges: a review. Clin Exp Ophthalmol. 2016;44(4):260–277. doi:10.1111/ceo.12696
4. Resnikoff S, Pascolini D, Etya’ale D, et al. Global data on visual impairment in the year 2002. Bull World Health Organ. 2004;82(11):844–851.
5. Yau JWY, Rogers S, Kawasaki R, et al. Global prevalence and major risk factors of diabetic retinopathy. Diabetes Care. 2012;35(3):556–564. doi:10.2337/dc11-1909
6. Patton N, Aslam T, Macgillivray T, Pattie A, Deary IJ, Dhillon B. Retinal vascular image analysis as a potential screening tool for cerebrovascular disease: a rationale based on homology between cerebral and retinal microvasculatures. J Anat. 2005;206(4):319–348. doi:10.1111/j.1469-7580.2005.00395.x
7. Wessels AM, Simsek S, Remijnse PL, et al. Voxel-based morphometry demonstrates reduced grey matter density on brain MRI in patients with diabetic retinopathy. Diabetologia. 2006;49(10):2474–2480. doi:10.1007/s00125-006-0283-7
8. Lin Y, Zhou J, Sha L, et al. Metabolite differences in the lenticular nucleus in type 2 diabetes mellitus shown by proton MR spectroscopy. AJNR Am J Neuroradiol. 2013;34(9):1692–1696. doi:10.3174/ajnr.A3492
9. Li YM, Zhou HM, Xu XY, Shi HS. Research progress in MRI of the visual pathway in diabetic retinopathy. Curr Med Sci. 2018;38(6):968–975. doi:10.1007/s11596-018-1971-5
10. Dogan M, Ozsoy E, Doganay S, et al. Brain diffusion-weighted imaging in diabetic patients with retinopathy. Eur Rev Med Pharmacol Sci. 2012;16(1):126–131.
11. Ding J, Strachan MW, Reynolds RM, et al. Diabetic retinopathy and cognitive decline in older people with type 2 diabetes: the Edinburgh type 2 diabetes study. Diabetes. 2010;59(11):2883–2889. doi:10.2337/db10-0752
12. Liao JL, Xiong ZY, Yang ZK, et al. An association of cognitive impairment with diabetes and retinopathy in end stage renal disease patients under peritoneal dialysis. PLoS One. 2017;12(8):e0183965. doi:10.1371/journal.pone.0183965
13. Wei FF, Raaijmakers A, Zhang ZY, et al. Association between cognition and the retinal microvasculature in 11-year old children born preterm or at term. Early Hum Dev. 2018;118:1–7. doi:10.1016/j.earlhumdev.2018.01.018
14. Gupta P, Gan ATL, Man REK, et al. Association between diabetic retinopathy and incident cognitive impairment. Br J Ophthalmol. 2019;103(11):1605–1609. doi:10.1136/bjophthalmol-2018-312807
15. Dai H, Zhang Y, Lai L, et al. Brain functional networks: correlation analysis with clinical indexes in patients with diabetic retinopathy. Neuroradiology. 2017;59(11):1121–1131. doi:10.1007/s00234-017-1900-5
16. Cordes D, Haughton VM, Arfanakis K, et al. Frequencies contributing to functional connectivity in the cerebral cortex in “resting-state” data. AJNR Am J Neuroradiol. 2001;22(7):1326–1333.
17. Wang YF, Dai GS, Liu F, Long ZL, Yan JH, Chan HF. Steady-state BOLD response to higher-order cognition modulates low-frequency neural oscillations. J Cogn Neurosci. 2015;27(12):2406–2415. doi:10.1162/jocn_a_00864
18. Gao Q, Peng B, Huang X, et al. Assessment of cerebral low-frequency oscillations in patients with retinal vein occlusion: a preliminary functional MRI study. Acta Radiol. 2019.
19. Zhang YF, He Y, Zhu CZ, et al. Altered baseline brain activity in children with ADHD revealed by resting-state functional MRI. Brain Dev. 2007;29(2):83–91. doi:10.1016/j.braindev.2006.07.002
20. Qi R, Zhang L, Wu S, et al. Altered resting-state brain activity at functional MR imaging during the progression of hepatic encephalopathy. Radiology. 2012;264(1):187–195. doi:10.1148/radiol.12111429
21. Li T, Liu Z, Li J, et al. Altered amplitude of low-frequency fluctuation in primary open-angle glaucoma: a resting-state FMRI study. Invest Ophthalmol Vis Sci. 2014;56(1):322–329. doi:10.1167/iovs.14-14974
22. Huang X, Zhou FQ, Dan HD, Shen Y. Abnormal intrinsic brain activity in individuals with peripheral vision loss because of retinitis pigmentosa using amplitude of low-frequency fluctuations. Neuroreport. 2018;29(15):1323–1332. doi:10.1097/WNR.0000000000001116
23. Wilkinson CP, Ferris FL, Klein RE, et al. Proposed international clinical diabetic retinopathy and diabetic macular edema disease severity scales. Ophthalmology. 2003;110(9):1677–1682. doi:10.1016/S0161-6420(03)00475-5
24. Tu S, Qiu J, Martens U, Zhang Q. Category-selective attention modulates unconscious processes in the middle occipital gyrus. Conscious Cogn. 2013;22(2):479–485. doi:10.1016/j.concog.2013.02.007
25. Caprara C, Grimm C. From oxygen to erythropoietin: relevance of hypoxia for retinal development, health and disease. Prog Retin Eye Res. 2012;31(1):89–119. doi:10.1016/j.preteyeres.2011.11.003
26. Persson J, Pudas S, Nilsson LG, Nybery L. Longitudinal assessment of default-mode brain function in aging. Neurobiol Aging. 2014;35(9):2107–2117. doi:10.1016/j.neurobiolaging.2014.03.012
27. Buzsaki G, Moser EI. Memory, navigation and theta rhythm in the hippocampal-entorhinal system. Nat Neurosci. 2013;16(2):130–138. doi:10.1038/nn.3304
28. Teng C, Zhou J, Ma H, et al. Abnormal resting state activity of left middle occipital gyrus and its functional connectivity in female patients with major depressive disorder. BMC Psychiatry. 2018;18(1):370–379. doi:10.1186/s12888-018-1955-9
29. Flier JS. Obesity wars: molecular progress confronts an expanding epidemic. Cell. 2004;116(2):337–350. doi:10.1016/S0092-8674(03)01081-X
30. Zhou X, Zhang J, Chen Y, et al. Aggravated cognitive and brain functional impairment in mild cognitive impairment patients with type 2 diabetes: a resting-state functional MRI study. J Alzheimers Dis. 2014;41(3):925–935. doi:10.3233/JAD-132354
31. Herzfeld DJ, Kojima Y, Soetedjo R, Shadmehr R. Encoding of action by the Purkinje cells of the cerebellum. Nature. 2015;526(7573):439–442. doi:10.1038/nature15693
32. Stoodley CJ, Schmahmann JD. Evidence for topographic organization in the cerebellum of motor control versus cognitive and affective processing. Cortex. 2010;46(7):831–844. doi:10.1016/j.cortex.2009.11.008
33. Izana J, Criscimagna-Hemminger SE, Shadmehr R. Cerebellar contributions to reach adaptation and learning sensory consequences of action. J Neurosci. 2012;32(12):4230–4239. doi:10.1523/JNEUROSCI.6353-11.2012
34. Kawamura T, Umemura T, Hotta N. Curious relationship between cognitive impairment and diabetic retinopathy. J Diabetes Investig. 2015;6(1):21–23. doi:10.1111/jdi.12234
35. Wang CX, Fu KL, Liu HJ, Xing F, Zhang SY, Valdes-Sosa PA. Spontaneous brain activity in type 2 diabetics revealed by amplitude of low-frequency fluctuations and its association with diabetic vascular disease: a resting-state FMRI study. PLoS One. 2014;9(10):e108883. doi:10.1371/journal.pone.0108883
36. Zlokovic BV. The blood-brain barrier in health and chronic neurodegenerative disorders. Neuron. 2008;57(2):178–201. doi:10.1016/j.neuron.2008.01.003
37. Mckee JL, Riesenhhuber M, Miller EK, Freedman DJ. Task dependence of visual and category representations in prefrontal and inferior temporal cortices. J Neurosci. 2014;34(48):16065–16075. doi:10.1523/JNEUROSCI.1660-14.2014
38. Verhoef BE, Vogels R, Janssen P. Inferotemporal cortex subserves three-dimensional structure categorization. Neuron. 2012;73(1):171–182. doi:10.1016/j.neuron.2011.10.031
39. van Duinkerken E, Schoonheim MM, Sanz-Arigita EJ, et al. Resting-state brain networks in type 1 diabetic patients with and without microangiopathy and their relation to cognitive functions and disease variables. Diabetes. 2012;61(7):1814–1821. doi:10.2337/db11-1358
40. Yu Y, Yan LF, Sun Q, et al. Neurovascular decoupling in type 2 diabetes mellitus without mild cognitive impairment: potential biomarker for early cognitive impairment. Neuroimage. 2019;200:644–658. doi:10.1016/j.neuroimage.2019.06.058
 © 2020 The Author(s). This work is published and licensed by Dove Medical Press Limited. The full terms of this license are available at https://www.dovepress.com/terms.php and incorporate the Creative Commons Attribution - Non Commercial (unported, v3.0) License.
By accessing the work you hereby accept the Terms. Non-commercial uses of the work are permitted without any further permission from Dove Medical Press Limited, provided the work is properly attributed. For permission for commercial use of this work, please see paragraphs 4.2 and 5 of our Terms.
© 2020 The Author(s). This work is published and licensed by Dove Medical Press Limited. The full terms of this license are available at https://www.dovepress.com/terms.php and incorporate the Creative Commons Attribution - Non Commercial (unported, v3.0) License.
By accessing the work you hereby accept the Terms. Non-commercial uses of the work are permitted without any further permission from Dove Medical Press Limited, provided the work is properly attributed. For permission for commercial use of this work, please see paragraphs 4.2 and 5 of our Terms.