")
Back to Journals » Diabetes, Metabolic Syndrome and Obesity » Volume 14
Alterations of Ocular Surface Parameters in Type 2 Diabetic Patients
Authors Liang S , Niu W, Wang H, Yang L
Received 8 June 2021
Accepted for publication 12 August 2021
Published 28 August 2021 Volume 2021:14 Pages 3787—3793
DOI https://doi.org/10.2147/DMSO.S323770
Checked for plagiarism Yes
Review by Single anonymous peer review
Peer reviewer comments 2
Editor who approved publication: Professor Ming-Hui Zou
Shuang Liang,1 Wanxia Niu,1 Helei Wang,2 Lixia Yang2
1Department of Pediatrics, The Second Hospital, Cheeloo College of Medicine, Shandong University, Jinan, People’s Republic of China; 2Department of Ophthalmology, The Second Hospital, Cheeloo College of Medicine, Shandong University, Jinan, People’s Republic of China
Correspondence: Lixia Yang
Department of Ophthalmology, The Second Hospital, Cheeloo College of Medicine, Shandong University, 247 Beiyuan Main Street, Jinan, 250021, People’s Republic of China
Tel +86 17660083151
Email [email protected]
Objective: The purpose of the study was to evaluate the changes in the ocular surface parameters of type 2 diabetic patients.
Methods: This study is a cross-sectional observational study. It included 76 eyes of 38 patients with type 2 diabetes and 183 eyes of 92 non-diabetic controls. The diabetic subjects were divided into two groups based on diabetic duration. Ocular surface parameters were assessed for all participants.
Results: The diabetic group had a significantly thinner lipid layer thickness (LLT) (p = 0.008) than non-diabetic controls. LLT in the subgroup with diabetic duration ≥ 10 years was significantly thinner than that in the subgroup with diabetic duration < 10 years (p = 0.006). Multivariate linear regression analysis showed that LLT was associated with the duration of diabetes (β = − 1.497, p = 0.009) and Schirmer I test (SIT) score (β = 0.852, p = 0.04) in diabetic. Diabetic duration was significantly negatively associated with LLT (β = − 0.062, p = 0.004) and significantly positively associated with ocular surface disease index (OSDI) (β = 0.087, p = 0.039).
Conclusion: Diabetic patients exhibit significantly reduced LLT and this trend becomes more pronounced with increased duration of diabetes.
Keywords: lipid layer thickness, diabetes, ocular surface parameters
Introduction
Diabetes is one of the major causes of early illness and death worldwide. Type 2 diabetes mellitus (DM) accounts for over 90% of patients with diabetes,1 and it is associated with several metabolic and cardiovascular complications. Diabetes-related ocular complications, such as diabetic retinopathy and cataract, have drawn the attention of ophthalmologists and have been extensively researched. Several studies have observed the ocular surface parameters in Type 2 DM.2–7 However, they only investigated some part of ocular surface parameters in their research, and there was no comprehensive and systematic evaluation of ocular surface parameters, and none of them used objective scatter index (OSI) as their research index. To our knowledge, our study is the first comprehensive research of ocular surface parameters for diabetics, including OSI. Therefore, we aimed to evaluate whether there are changes in ocular surface (including OSI) parameters in type 2 DM, and to further clarify whether these changes are related to the duration of type 2 DM.
Materials and Methods
Study Design
This study was a single-visit, cross-sectional, cohort study.
Patients
This study was conducted at the 2nd hospital of Shandong University, Jinan, China, between December 2019 and November 2020. Ethical approval was granted by the institutional review board of the 2nd hospital of Shandong University, and the study adhered to the tenets of the Declaration of Helsinki and the Health Insurance Portability and Accountability Act. Written informed consent was obtained from all the patients prior to enrolment.
Thirty-eight patients diagnosed with type 2 DM met the inclusion criteria and were enrolled in the study. The diagnostic criteria of diabetes is defined according to the American Diabetes Association 2014 Criteria.8 Ninety-two patients without diabetes waiting for a vision test in our department were recruited as nondiabetic controls. Fasting blood glucose was measured to rule out diabetes.
Inclusion criteria were ages greater than 18-years-old and ability to cooperate with examinations of our study. Patients’ relevant information was collected including age, gender, prior medical history, prior ocular history, prior ocular surgery, previous or ongoing medication use, as well as biomicroscopic slit-lamp examination findings. Exclusion criteria: 1) patients who had obvious eyelid or ocular surface diseases, wore contact lenses, and had a history of ocular surgery; 2) patients aged less than 18 years and those who had obvious eyelid or ocular surface diseases, and had a history of ocular trauma; 3) patients who used topical ocular medications and had any disease affecting the ocular surface (ie, ocular infection, allergy and systemic autoimmune disease); 4) patients who were not sufficiently cooperative for examinations.
Data were obtained from both eyes of each subject. Of all the patients, only one patient (without diabetes) had only one eye data after enucleation. Finally, 76 eyes of 38 patients with type 2 DM and 183 eyes of 92 nondiabetic controls were included. The diabetics were categorized into two groups according to the duration of diabetes mellitus since the first diagnosis: ≥10 years, and <10 years.
Ocular Surface Assessments
A series of clinical examinations on both eyes for each patient were conducted in the outpatient department, and data from both eyes were used for analysis. The clinical examinations were carried out in the following order: the ocular surface disease index (OSDI) questionnaire (score 0–100), lipid layer thickness (LLT), partial blinks rate (PBR), 10-min rest, lower tear meniscus height (TMH), first noninvasive tear breakup time (FNITBUT), mean noninvasive tear breakup time (MNITBUT), grading of meibomian gland dropout area score (Meiboscore), OSI, mean OSI (MOSI), 10 min rest, the Schirmer I tear test (SIT) without local anesthesia, corneal fluorescein staining (CFS). All ocular surface parameters were carried out by the same experienced examiner.
OSDI
The ocular surface symptoms of each subject were evaluated by the OSDI questionnaire.9 Twelve questions which are related to vision-related symptoms, ocular symptoms and environmental triggers were included in the OSDI questionnaire, and each item was graded on a scale from 0 (none of the time) to 4 (all the time). The OSDI score was calculated on the basis of this formula: OSDI = [(sum of the scores for all questions answered)×100]/[(total number of questions answered)×4]. The scores on the questionnaire ranged from 0 to 100.
LLT, PBR
The Lipiview Interferometer (Tear Science Inc., Morrisville, NC) allowed for automated measurements of LLT and PBR. A 20-s video was captured to document the interference pattern of the tear film for each subject. Analysis of this video resulted in measuring interferometric color units for each eye recorded. One interferometric color unit approximately reflects 1 nm of the LLT.10 The maximum LLT value is limited to be 100 nm. The partial blinking and total blinking values were recorded, and the ratio of the two values is PBR. All the measurements were evaluated by a single examiner.
Tear Function
Tear functions, including TMH, NITBUT, and meiboscore, were assessed using the Keratograph 5M (Oculus GmbH, Wetzlar, Germany) in a darkened room. The NITBUT was further divided into the FNIBUT and the MNITBUT.
Patients were asked to focus on the fixation target, and a Placido disc comprising of 22 mire rings was projected onto the corneal surface. The lower tear film meniscus images were captured 5s after blinking, and the values of TMH were measured using an integrated ruler. All measurements were repeated three times and the average was recorded.
The infrared photography of meibomian gland was also captured by the Keratograph 5M, and the grade was evaluated by the dropout area of meibomian gland: meiboscore 0: normal, meiboscore 1: the dropout area <1/3, meiboscore 2: 1/3 <the dropout area <2/3, meiboscore 3: the dropout area >2/3.
OSI, MOSI
The Optical Quality Analysis System (OQAS, Visiometrics, Terrassa, Spain) is based on the double-pass technique and is developed to evaluate vision quality objectively. The optical quality changes were acquired before clinical ocular surface tests. The examination was performed in a darkened room to obtain the largest pupil. The patients were asked to blink freely during the examination of the OQAS. After reflection in the retina and a double pass through the ocular media, the light was recorded by a charge-coupled camera device. The MOSI values were acquired during the 20 seconds of dynamic tear film analysis. Then, the patients were asked to blink freely, and the OSI value was also acquired. The difference between MOSI and OSI can reflect the stability of tear film by OQAS.
SIT
The Schirmer I test was performed on both eyes simultaneously by placing the Schirmer paper strip (Jingming Limited company, Tianjin, China) in the lower outer fornix without anesthesia. The subjects were instructed to close their eyes for 5 min. The strips were removed, and the score was the measured length of wetting at 5 min.
CFS
CFS was evaluated under blue illumination of the slit-lamp microscope and observed with a yellow Wratten barrier filter, following application of sodium fluorescein (Jingming Limited company, Tianjin, China). The cornea was divided into four quadrants (supertemporal, inferotemporal, supernasal, and inferonasal). The punctate epithelial erosions on corneal surface were scored on a scale of 0–3 in each quadrant: 0 = 0 dots, 1 = 1–5 dots, 2 = 6–30 dots, 3 = >30 dots. A sum of the CFS scores ranged from 0 to 12.
Statistical Analysis
Statistical analyses were performed using Statistical Package for Social Sciences software for windows version 20.0 (SPSS Inc. Chicago, USA). All variables were expressed as mean ± standard deviation (SD). Comparison between the two groups was done using Student’s t-test. Categorical variables were compared by the chi-square test. Pearson's correlations were used to determine associations between continuous variables. Multivariate linear regression analysis was further performed to identify independent predictors of LLT and diabetic duration. A p-value less than 0.05 was considered to be statistically significant.
Results
Comparison of Ocular Surface Parameters Between Diabetics and Controls
The characteristics of the study population are shown in Table 1. There were no significant differences in age and gender in the diabetes and control groups. Significantly, thinner LLT levels were observed in the subjects with diabetes than in the control group (p = 0.008, Figure 1A), but FNITBUT, MNITBUT, CFS, OSDI, SIT, TMH, Meiboscore, PBR, MOSI and OSI did not exhibit significant differences among diabetic and nondiabetic groups (p > 0.05).
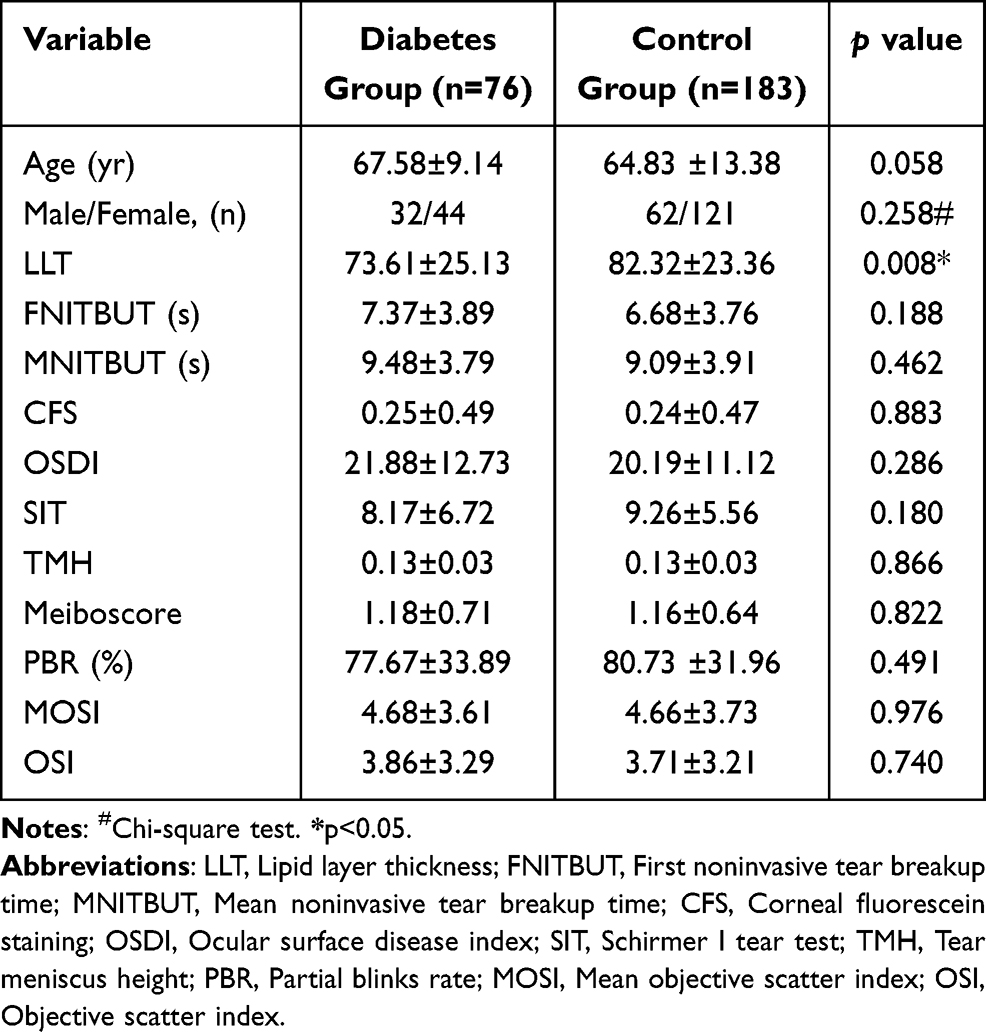 |
Table 1 Clinical Characteristics in Diabetes and Control Groups |
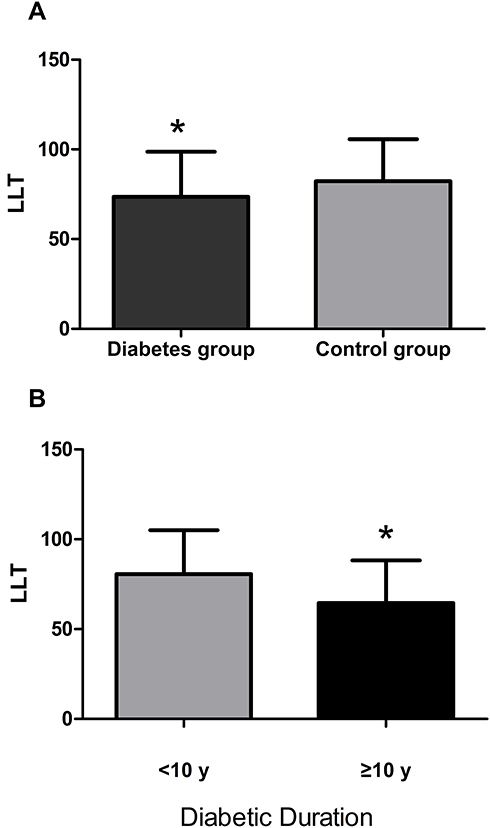 |
Figure 1 (A) Comparison of LLT between Diabetics and Controls. (B) Comparison of LLT between the two groups according to Diabetic Duration. Note: *p<0.05. |
Comparison of Ocular Surface Parameters Between the Diabetic Duration Subgroups
The diabetics were further divided into 2 subgroups according to the disease duration: duration <10 y group (Group A) and duration ≥10 y group (Group B). The clinical characteristics and ocular surface parameters of the two subgroups are summarized in Table 2. Group B had a significantly higher diabetic duration and age than Group A (p < 0.001), and there was a significantly lower LLT in group B than in Group A (p=0.006, Figure 1B). Gender, FNITBUT, MNITBUT, CFS, OSDI, SIT, TMH, meiboscore, PBR, MOSI and OSI were similar in both subgroups (p > 0.05).
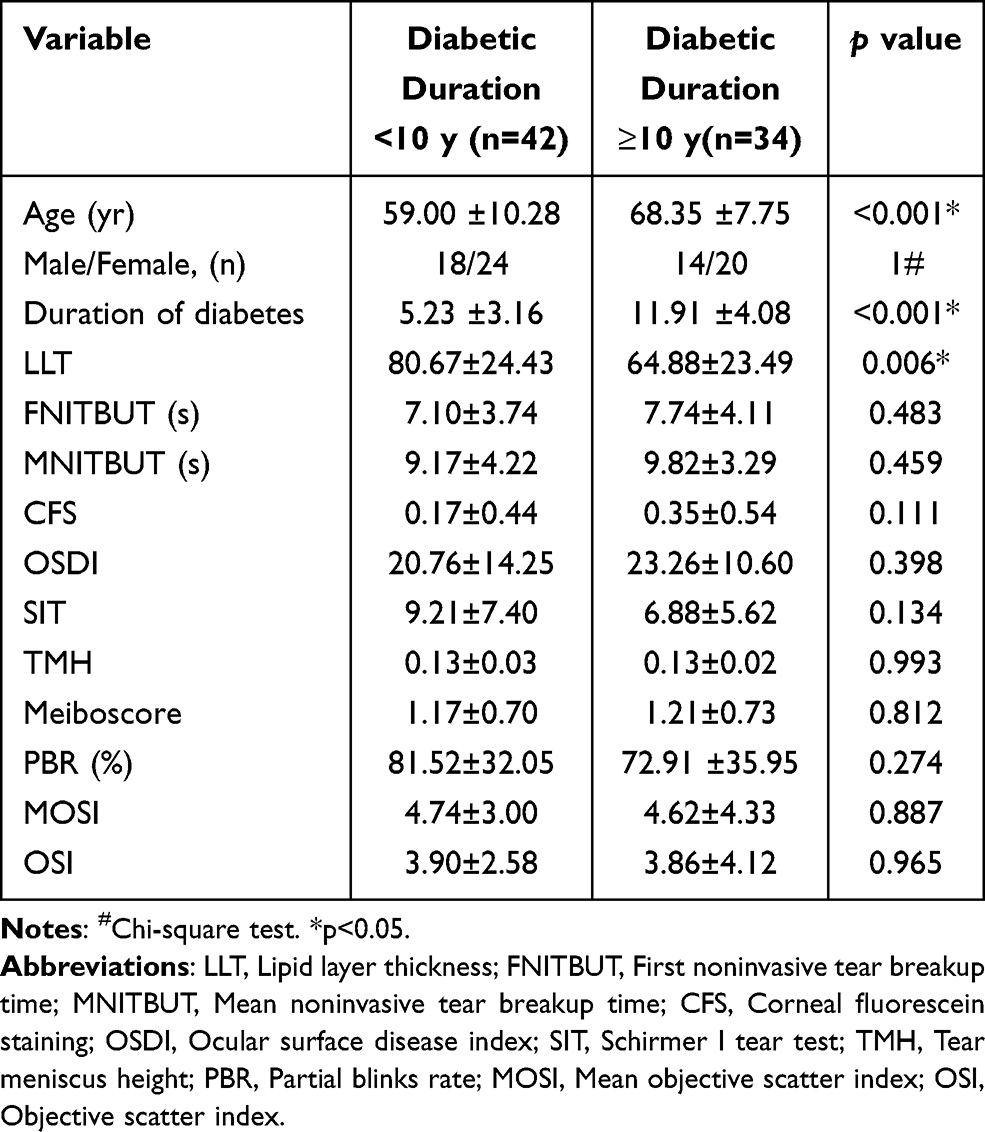 |
Table 2 Clinical Characteristics in Diabetes Patients According to Diabetic Duration |
Correlations Between LLT and Other Parameters in Diabetic Groups
Correlations between LLT and other parameters in diabetic groups are shown in Table 3. LLT were negatively correlated with diabetic duration (r =−0.332, p = 0.003) and LLT was positively correlated with SIT score (r = 0.279, p = 0.015). However, other ocular surface parameters showed no correlation with LLT (p > 0.05). Furthermore, multivariate linear regression analysis showed that diabetic duration and SIT score were the independent determinants of LLT in diabetics. LLT was associated with duration of diabetes (β=−1.497, p = 0.009) and SIT score (β=0.852, p = 0.04). These associations remained significant after adjusting for age.
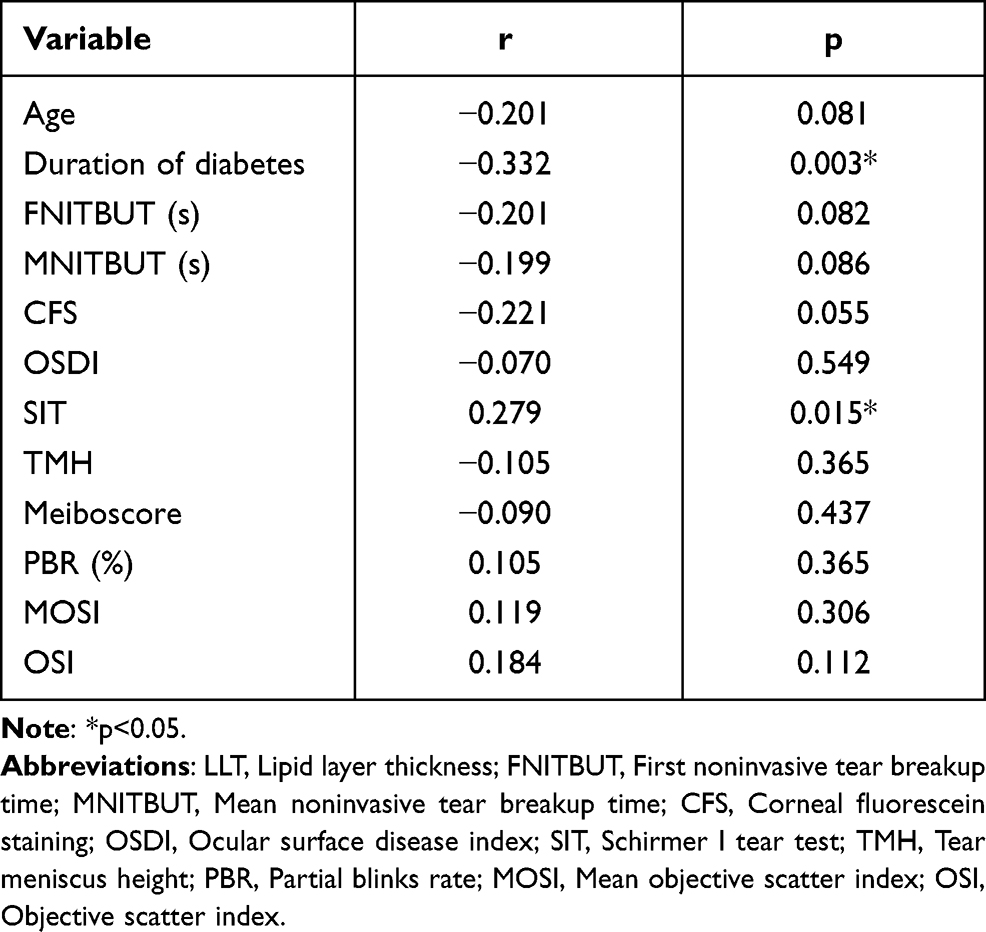 |
Table 3 Bivariate Correlation Analysis Between LLT and Other Parameters in Diabetes Patients |
Correlations Between Diabetic Duration and Other Ocular Surface Parameters in Diabetic Groups
Correlations between diabetic duration and other parameters in diabetic groups are shown in Table 4. Diabetic durations were negatively correlated with LLT (r =−0.332, p = 0.003), and diabetic duration was positively correlated with OSDI (r = 0.248, p = 0.031). However, other ocular surface parameters showed no relationship with diabetic duration (p > 0.05). Furthermore, multivariate linear regression analysis showed that LLT and OSDI were the independent determinants of diabetic duration in diabetics. Diabetic duration was significantly negatively associated with LLT (β=−0.062, p = 0.004), and positively associated with age (β=0.124, p = 0.016) and OSDI (β=0.087, p = 0.039).
 |
Table 4 Bivariate Correlation Analysis Between Duration of Diabetes and Other Parameters in in Diabetes Patients |
Discussion
The World Health Organization Global Burden of Disease Study reported that 220 million people suffer from type 2 DM in 2010, and it is estimated that there will be a rise to 366 million by the year 2030.11,12 The tear film lipid layer is located at the surface of the cornea and acts as a blanket over the aqueous layer to prevent tear evaporation. The diabetic duration is considered as one of the most important risk factors for retinopathy.13,14 However, its role in the ocular surface remains contradictable. Therefore, we conduct this clinical study to investigate the ocular surface and DM.
In the present study, we found that patients with diabetes have markedly thinner LLT than controls. Furthermore, patients with duration of diabetes over 10 years had thinner LLT than those with diabetic duration <10 y. In addition, our study found a significant inverse relationship between LLT and diabetic duration in Type 2 DM patients after controlling other confounders.
Lin et al reported that the LLT was thicker in the diabetic group than in the controls,4 which is contradictory with ours. In our present study, the value of LLT was 82.32±23.36 nm in the control group and 73.61±25.13 nm in the diabetic group. The subjects in their study were scheduled for cataract surgery and most of them maintain stable levels of blood glucose. In our study, patients with diabetes mellitus were enrolled from the outpatient department of ophthalmology, including the subjects who came for the retinopathy of diabetes. The participants’ different blood glucose may be the reason for this difference. However, in another study7 with in patients with diabetes mellitus scheduled for cataract surgery, the conclusion that the duration of diabetes had an influence on tear film LLT is consistent with ours. They found significantly thinner preoperative LLT in patients with duration of DM over 10 years than those with duration of DM less than 10 years.
Gunay et al15 reported that the mean Schirmer test score was significantly lower in diabetic children than in healthy children. In another study, Goebbels et al16 investigated 86 type 1 diabetics and 84 nondiabetic controls in his study and found that Schirmer I test without topical anaesthesia values were found to be significantly decreased in the diabetic group (10±3 mm/5 minutes) compared with the non-diabetic control group (18±5 mm/5 minutes). In our study, SIT score was found to be lower in the diabetic group than in the control group, but there was no significant difference between the two groups. Our present investigation indicates that a positive significance between LLT and SIT, to the best of our knowledge, is first described in the literature. However, the mechanism of the correlation between LLT and SIT is unclear and will be further explored.
It is reported that more than 50% of the patients with diabetes show reduced sensitivity due to the damage to corneal sensory nerve.17 Sandra et al18 found that OSDI was significantly higher in the diabetic group than in the control group and longer duration of diabetes was associated with major symptoms of ocular surface in their prospective study from Colombia. It is known that the ocular surface is damaged with the extension of the course of diabetes. In a prospective study in China conducted by He et al,3 they concluded that ocular surface damage in long-term type 2 DM is more severe than that in patients with shorter disease duration. In our study, the duration of diabetes mellitus showed a positive correlation with OSDI. OSDI was found to be higher in the diabetes group than in the control group, but there was no significant correlation between the two groups. We think the reason may be contributed to the shorter duration of diabetes and the relatively mild damage of corneal nerve in our study. In these patients, the discomfort of eyes is more likely to be felt, resulting in a relatively high OSDI value. This may also be related to the choice of patients, the participants’ blood glucose and insulin status.
There were some limitations in the study, and one of the important limitations of the study was the lack of data on blood glucose, glycosylated hemoglobin and insulin levels in participants. Another limitation was that the cross-sectional design of our study, we cannot determine causality between LLT and diabetes. Thirdly, in the study, the exact mechanism responsible for the altered LLT in diabetes is not well clarified. In addition, statistical analysis of the two eyes of a single patient is another limitation of the study. Finally, the relatively small sample size is another limitation of this study, and expanding sample size should be a possible research direction for our future research. Despite these limitations, to the best of our knowledge, the present study is the first to demonstrate an inverse relationship between LLT levels and diabetic duration independent of several other confounding factors. We believe that our data provide important implications for the ophthalmology management of diabetic patients. Larger sample size, prospective multicenter studies with long-term follow-up are needed to confirm our findings.
Conclusion
In conclusion, the current study indicates that LLT is lower in subjects with diabetic compared with non-diabetic and it decreases with increased duration of diabetes. Longer duration of diabetes may be an important determinant of LLT. Thus, our findings suggested that additional investigation for ocular surface parameters in Type 2 DM patients might be necessary, in order to verify possible complications of early ocular surface disorder. Our findings have a certain scientific and clinical implications for the clinical management of Type 2 DM.
Abbreviations
DM, diabetes mellitus; OSI, Objective scatter index; OSDI, Ocular surface disease index; LLT, Lipid layer thickness; PBR, Partial blinks rate; TMH, Tear meniscus height; FNITBUT, First noninvasive tear breakup time; MNITBUT, Mean noninvasive tear breakup time; MOSI, Mean objective scatter index; SIT, Schirmer I tear test; CFS, Corneal fluorescein staining; OQAS, Optical Quality Analysis System.
Acknowledgments
The authors are grateful to all participants for participating in this study.
Funding
This research was supported by Jinan clinical medical science and technology innovation plan (NO. 201907002).
Disclosure
The authors declare that they have no competing interests.
References
1. Care D. Economic Costs of Diabetes in the U.S. in 2017. Diabetes Care. 2018;41:917–928. doi:10.2337/dci18-0007
2. Yu T, Shi WY, Song AP. Changes of meibomian glands in patients with type 2 diabetes mellitus. Int J Ophthalmol. 2016;9:1740.
3. He F, Zhao Z, Liu Y, Lu L, Fu Y. Assessment of Ocular Surface Damage during the Course of Type 2 Diabetes Mellitus. J Ophthalmol. 2018;2018:1–8.
4. Lin X, Xu B, Zheng Y, et al. Meibomian gland dysfunction in type 2 diabetic patients. J Ophthalmol. 2017;2017:1–7.
5. Liu Y-S, Wei M, Wang L, et al. The impact of subclinical hypothyroidism on long-term outcomes in older patients undergoing percutaneous coronary intervention. BMC Endocr Disord. 2021;1:21.
6. Zeng X, Lv Y, Gu Z, et al. The effects of diabetic duration on lacrimal functional unit in patients with type II diabetes. J Ophthalmol. 2019;2019:1–11.
7. Zhang K, Zhang S, Yu J, Lu Y, Zhu X. Changes of the tear film lipid layer thickness after cataract surgery in patients with diabetes mellitus. Acta Ophthalmol. 2021;99(2):e202–e208. doi:10.1111/aos.14565
8. American Diabetes Association. Standards of Medical Care in Diabetes–2014. Diabetes Care. 2013;37:S14–S80.
9. Schiffman RM, Christianson MD, Jacobsen G, Hirsch JD, Reis BL. Reliability and validity of the ocular surface disease index. Arch Ophthalmol. 2000;118:615–621. doi:10.1001/archopht.118.5.615
10. Finis D, Pischel N, Schrader S, Geerling G. Evaluation of lipid layer thickness measurement of the tear film as a diagnostic tool for Meibomian gland dysfunction. Cornea. 2013;32:1549–1553. doi:10.1097/ICO.0b013e3182a7f3e1
11. Zimmet P, Alberti KG, Shaw J. Global and societal implications of the diabetes epidemic. Nature. 2001;414:782–787. doi:10.1038/414782a
12. Rathmann W, Giani G. Global prevalence of diabetes: estimates for the year 2000 and projections for 2030. Diabetes Care. 2004;27:2568–2569. doi:10.2337/diacare.27.10.2568
13. Manaviat MR, Rashidi M, Afkhami-Ardekani M, Shoja MR. Prevalence of dry eye syndrome and diabetic retinopathy in type 2 diabetic patients. BMC Ophthalmol. 2008;8:10. doi:10.1186/1471-2415-8-10
14. Rani PK, Raman R, Chandrakantan A, Pal SS, Perumal GM, Sharma T. Risk factors for diabetic retinopathy in self-reported rural population with diabetes. J Postgrad Med. 2009;55:92–96. doi:10.4103/0022-3859.48787
15. Gunay M, Celik G, Yildiz E, et al. Ocular surface characteristics in diabetic children. Curr Eye Res. 2016;41:1526–1531. doi:10.3109/02713683.2015.1136421
16. Goebbels M. Tear secretion and tear film function in insulin dependent diabetics. Br J Ophthalmol. 2000;84:19–21. doi:10.1136/bjo.84.1.19
17. Premkumar LS, Pabbidi RM. Diabetic peripheral neuropathy: role of reactive oxygen and nitrogen species. Cell Biochem Biophys. 2013;67:373–383. doi:10.1007/s12013-013-9609-5
18. Sandra Johanna GP, Antonio LA, Andrés GS. Correlation between type 2 diabetes, dry eye and Meibomian glands dysfunction. J Optom. 2019;12:256–262. doi:10.1016/j.optom.2019.02.003
 © 2021 The Author(s). This work is published and licensed by Dove Medical Press Limited. The full terms of this license are available at https://www.dovepress.com/terms.php and incorporate the Creative Commons Attribution - Non Commercial (unported, v3.0) License.
By accessing the work you hereby accept the Terms. Non-commercial uses of the work are permitted without any further permission from Dove Medical Press Limited, provided the work is properly attributed. For permission for commercial use of this work, please see paragraphs 4.2 and 5 of our Terms.
© 2021 The Author(s). This work is published and licensed by Dove Medical Press Limited. The full terms of this license are available at https://www.dovepress.com/terms.php and incorporate the Creative Commons Attribution - Non Commercial (unported, v3.0) License.
By accessing the work you hereby accept the Terms. Non-commercial uses of the work are permitted without any further permission from Dove Medical Press Limited, provided the work is properly attributed. For permission for commercial use of this work, please see paragraphs 4.2 and 5 of our Terms.